 Sumito Matoba
 Ryo Hazuki1,2
 Yutaka Kurosaki
 Teruo Aoki
- 1Pan-Okhotsk Research Center, Institute of Low Temperature Science, Hokkaido University, Sapporo, Japan
- 2Graduate School of Environmental Science, Hokkaido University, Sapporo, Japan
- 3National Institute of Polar Research, Tachikawa, Japan
- 4Meteorological Research Institute, Japan Meteorological Agency, Tsukuba, Japan
From glaciological observations, we found spatial variation in the input of insoluble particles (ISP) on a glacier surface from atmospheric deposition and outcropping at the surface of the glacier by surface ablation at the ablation area of the Qaanaaq Ice Cap in northwestern Greenland. Possible sources of ISP input to the glacier surface were outcropping at the surface of the glacier by ablation at intermediate and low elevations, and from atmospheric deposition at high elevations. The annual atmospheric deposition of ISP was larger at high elevations than at intermediate and low elevations. The annual abundance of outcropping ISP was larger at intermediate elevations than at low elevations, where the annual ablation rate of the glacier surface was 1.5 times larger than at intermediate elevations. The ISP concentration in the glacier ice at intermediate sites was approximately 10 times larger than at low sites. The water stable isotopes of glacier ice at intermediate sites indicated that glacier ice at the intermediate sites did not form since the last glacial maximum, possibly the Holocene Thermal Maximum. Therefore, the accumulation of the ISP, which is outcropping at the intermediate site, occurred at high elevations after Holocene Thermal Maximum.
Introduction
Ice loss from the Greenland Ice Sheet (henceforth referred to as ice sheet) and local glaciers and ice caps surrounding Greenland (henceforth referred to as glaciers) is one of the largest contributors to the current global sea level rise (Meier et al., 2007; Rignot et al., 2011). Bolch et al. (2013) estimated that the mass loss of glaciers from 2003 to 2008 is responsible for 10% of the global sea level rise. Glaciers are sensitive to recent climate change because they are at relatively low elevations (Hanna et al., 2012). The mass loss of an ice sheet and glaciers is driven mainly by rising air temperature and a reduction in surface albedo (Box et al., 2012). Remote sensing data show the reduction in albedo in recent decades (e.g., Tedesco et al., 2011; Shimada et al., 2016). As the albedo of the ice surface decreases, the absorption of solar radiation at the glacier surface increases, and surface melting is enhanced. The albedo of the surface of glaciers and ice sheets is controlled by snow grain size and the concentration of light-absorbing impurities in snow (henceforth referred to as LAI), such as mineral dust, black carbon, and organic compounds. Snow grain size has increased via accelerated snow metamorphism under recent warm conditions, and coarse snow grains reduce the albedo in the near-infrared range. LAI reduce the albedo in the visible range. If LAI exist with coarse snow grains, the albedo reduction is enhanced (Warren and Wiscombe, 1980; Aoki et al., 2011; Aoki et al., 2003).
LAI are added to a glacier surface via 1) atmospheric deposition, 2) outcropping at the surface of the glacier during glacier surface ablation, and 3) microbial products and metabolites, and is reduced by 4) meltwater run-off and 5) the decomposition of organic substances via microbial activities and chemical reactions, such as photo-oxidation (e.g., Takeuchi et al., 2018). The main constituent of atmospheric deposition is mineral dust, with a minor contribution of black carbon in Greenland (Aoki et al., 2014a). Several papers show that atmospheric mineral dust deposited on the interior of the ice sheet is mainly transported from Asian deserts by long-distance transport and that atmospheric mineral dust deposited on the ablation area of the ice sheet and glaciers is from local windblown sediment or englacial debris. Asian dust, generated when the surface soil in the arid region of the Asian continental landmass is lifted by winds into the free troposphere, can be transported a long distance (e.g., Uno et al., 2001; Sasaki et al., 2016). Bory et al. (2002) showed that mineral dust in the snow in the last decade at the North GRIP in the central ice sheet was originated from eastern Asia using mineralogical analyses and isotopic analyses of Sr and Nd, which are used for tracer of mineral dust sources. Svensson et al. (2000) showed that the predominant source of mineral dust deposited at Summit of the ice sheet for Younger Dryas, Bølling, Last Glacier Maximum, and the cold and mild glacial periods back to 44 kyr B.P. is found most likely to be eastern Asia. Nagatsuka et al. (2016) showed that mineral dust in the snow at the ablation area of the glacier and the ice sheet in the Qaanaaq region in northwestern Greenland, and the Kangerlussuaq area in western Greenland is originated from moraines and around each glacier using isotopic analyses of Sr and Nd. Windblown sediment or englacial debris in the coastal region of Greenland cannot be lifted up to high elevation where aerosol can be transported a long distance, because the strength of air convection is not enough in the cold region. Moreover, the stability of the atmosphere over the ice sheet developed by anticyclone restricts the transportation of substances from the coastal region of Greenland to inland (e.g., Davidson et al., 1993; Matoba et al., 2014). Therefore, the dominant source of mineral dust in the inland of the ice sheet is a remote area such as Asian deserts. On the other hand, the ablation area of the ice sheet and glaciers locate the coastal region of Greenland and the elevation is low. Thus, the windblown sediment or englacial debris, even coarse particles, can be transported to the low elevation site. Therefore, dominant sources of mineral dust in the ablation area of the ice sheet and glaciers are the windblown sediment or englacial debris in the coastal region of Greenland. Wientjes et al. (2011) indicated that the contribution of outcropping dust to albedo reduction is comparable to that of atmospheric dust.
The spatiotemporal variation in surface albedo and its effects on surface melting in the ablation zone of the ice sheet and glaciers are complex. Field data are insufficient to discuss the regional variation in Greenland, especially for glaciers. Several studies in northwestern Greenland have examined the mass balance and variation in surface albedo at the Qaanaaq Glacier and Ice Cap. Aoki et al. (2014b) installed an automatic weather station at site SIGMA-B (944 m elevation) on the Qaanaaq Ice Cap in 2012 and made glaciological observations; they reported temporal changes in snow height, air temperature, and surface conditions. In 2012, the surface at site SIGMA-B was slushy and was covered with snow or ice grains containing dark material, whereas the surface of large areas at elevations higher than about 700 m a.s.l. was covered with snow in 2013. Sugiyama et al. (2014) observed the surface melt rate, ice flow velocity, and ice thickness along a survey route on an outlet glacier (Qaanaaq Glacier) from the Qaanaaq Ice Cap, and showed that the degree-day factor was larger on the dark surface in the middle of the glacier than on relatively clean surfaces at lower and higher parts of the glacier. They suggested the importance of darkening on the increased surface melting of glaciers. Tsutaki et al. (2017) reported the surface mass balance, ice velocity, and ice temperature along the flow line of the Qaanaaq Glacier and site SIGMA-B. Takeuchi et al. (2018) showed the mechanisms for the development and collapse of cryoconite holes based on observations on the Qaanaaq Ice Cap. Nagatsuka et al. (2014) indicated that mineral dust in cryoconite on the Qaanaaq Glacier was supplied from englacial dust and moraines near the glaciers rather than from distant areas based on analyses of strontium and neodymium isotopes in mineral dust in the cryoconite. Søndergaad et al. (2019) reported the glacier history of the Qaanaaq Ice Cap using geomorphological mapping, 10Be exposure dating of boulders, and lake sediment cores and suggested that the Qaanaaq Ice Cap survived the Holocene Thermal Maximum, although the ice cap was smaller than at present between 3.3 ± 0.1 and 0.9 ± 0.1 kcal BP, and it advanced again at the Little Ice Age.
Uncertainty about the spatiotemporal variation in dark material on the Qaanaaq Ice Cap and the processes that increase or decrease these materials persists. Here, we focused on the processes inputting materials to the surface of the Qaanaaq Ice Cap and report the spatial variation in the input of materials from atmospheric deposition and outcropping from the inside of the glacier at the ice cap based on investigations conducted on the glacier in 2017.
Method
The Qaanaaq Ice Cap (77°28′N, 69°14′W), located in northwestern Greenland, covers an area of 312 km2 and an elevation range of 30–1,110 m a.s.l. over the central part of a peninsula (Figure 1). Since 2012, several field campaigns have been conducted on the Qaanaaq Glacier, which flows southwest from the southern part of the Qaanaaq Ice Cap, and six observation sites were established along the flowline of the Qaanaaq Glacier (Aoki et al., 2014b; Sugiyama et al., 2014; Tsutaki et al., 2017) (Table 1). We conducted field observations at these sites and the SIGMA-B site, where an automatic weather station was installed in 2012 (Aoki et al., 2014b). We made snow pit observations at each observation site, observed stratigraphic features by eye using a loupe, and measured snow density using a 100-cm3 snow sampler and an electric balance, and snow temperature using a PT100 sensor. The observations were conducted on June 12, 2017, at sites 1 and 2, June 14 at site 3, June 9, and 14 at site 4, June 17 at sites 5 and 6, and June 9 at the SIGMA-B site.
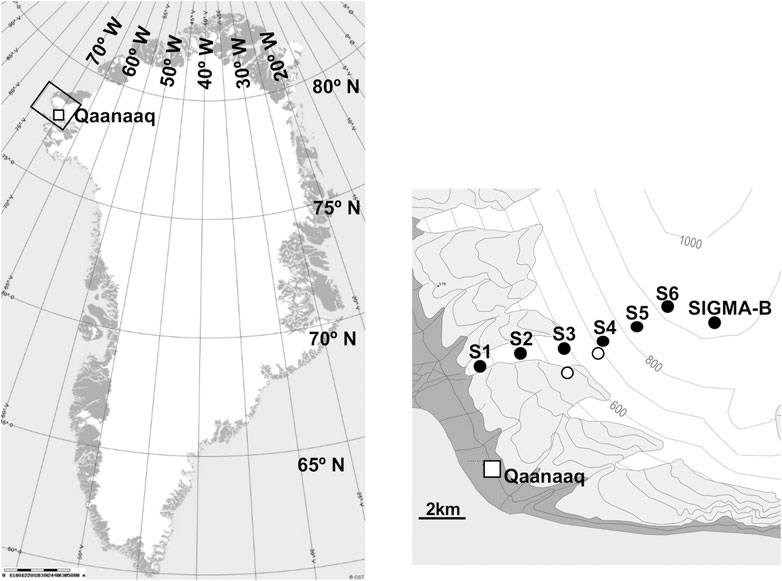
FIGURE 1. Locations of the study area and the observation sites showing measurement sites (solid circles) and places of atmospheric deposition sampling (white circle). A square indicates Qaanaaq village. The contour interval is 100 m.
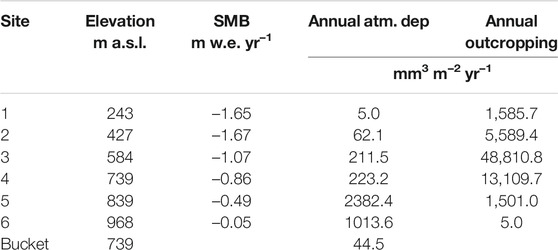
TABLE 1. Elevation, surface mass balance (SMB), and annual abundance of atmospheric deposition and outcropping of ISP.
We collected snow samples from full depth seasonal snowpack at each site to estimate the amount of atmospheric deposition during snow season. We also collected ice samples from the glacier under the seasonal snowpack at each site to estimate the amount of outcropping substance by surface ablation of the glacier. We took snow and ice samples using a stainless sampler and then stored them in polyethylene bags, melted the samples in the bags at ambient temperature, and decanted the sample into polypropylene bottles. In this research, we did not consider the increase in the mass of the concentration of insoluble particles (ISP) due to biological activity on the glacier surface. To avoid contamination by material that covered the glacier surface the previous summer, we collected only ice underneath the glacier surface of the previous summer. To confirm that the ice sampled could be collected from the inside of the glacier, and not from superimposed ice formed within the past few years or glacier surface in last summer, we measured the tritium concentration using a liquid scintillation counter (LSC-LB1, Aloka). If the ice had formed within a few decades, tritium from natural sources produced by the reaction with cosmic rays should be detected. We examined only samples in which no tritium was detected. To determine whether the sampled ice had formed in the Holocene or last glacial period, we measured the stable isotopes of water in ice samples using wavelength-scanned cavity ring-down spectroscopy (L2130i, Picarro).
We also collected atmospheric depositional materials using buckets filled with pure water tied to wooden stakes. The bucket samplers were set at site 4 and on a moraine near site 3, where surface albedo reduction by LAI had been observed by Sugiyama et al. (2014), from June 6 to July 4, 2017. The diameter of the open mouth of each bucket was 0.2 m. After the sampling period, we recovered the materials and liquid in the buckets. To avoid contaminations from the snow surface and ground surface, the buckets were set 1.5 m height.
We measured the ISP concentration in both snowpack and bucket samples using a Coulter counter (Multisizer 3, Beckman Coulter) using standard analytical conditions.
Results and Discussions
Figure 2 shows the vertical profiles of snow density, snow stratigraphy, and snow temperature of the seasonal snowpack at sites 2–6 and SIGMA-B on the Qaanaaq Glacier. Most of the snowpack of seasonal snow at sites 3 and 4 consisted of melt forms. At site 3, the snow density exceeded 300 kg m−3 at the surface, decreased with snow depth to 0.2 m, and then increased with snow depth below 0.4 m. The snow temperature was 0°C from the surface to 0.1 m depth and below 0°C at greater depths. At site 4, the snow density above 2.5 m was approximately 300 kg m−3, increased with snow depth to 0.4 m, and then decreased with snow depth to 0.55 m. The snow temperature was 0°C from the surface to 0.4 m depth and below 0°C at greater depths. These profiles from sites 3 and 4 indicate that the upper parts of the snowpack had already melted but that the amount of melting was not remarkable, and no meltwater had been washed out of the snowpack. At sites 5, 6, and SIGMA-B, most of the seasonal snow snowpack consisted of rounded grains. The snow temperature at all depths was below 0°C. These profiles indicate that the snowpack at sites 5, 6, and SIGMA-B had not melted before the observations. We calculated the snow water equivalent (SWE) depth of seasonal snow at each site from the snow depth and density.
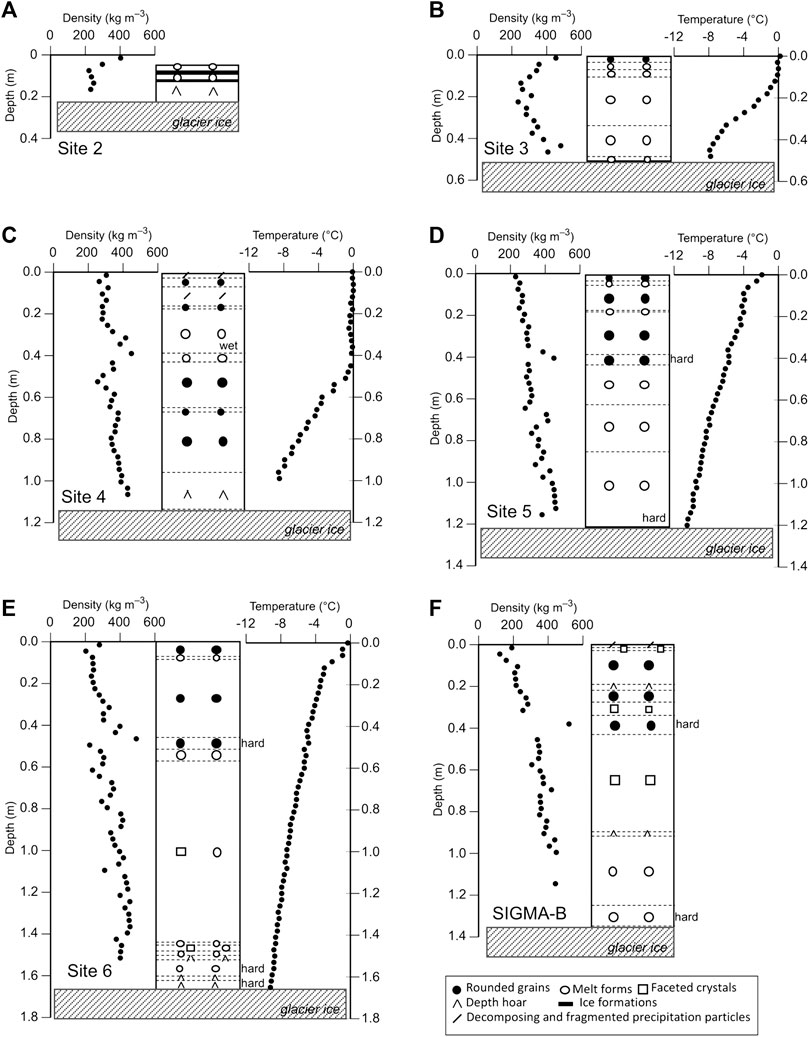
FIGURE 2. Snow stratigraphy and vertical profiles of snow density and snow temperature in snow pits at sites 2–6 (A–E) and SIGMA-B site (F). The characters showing snow classification of stratigraphy are following by the snow classification by Fierz et al. (2009). Shading areas represent glacier ice under seasonal snow layer. “hard” represents relatively hard snow layer. “wet” in figure c represents a snow layer containing liquid water.
Figure 3 shows the ISP concentrations in seasonal snow and glacier ice at each site. The ISP concentration in seasonal snow ranged from 490 to 4,710 mm3 m−3 and was highest at site 5. The ISP concentrations were higher in glacial ice than in the seasonal snow and had a wider range from 1,320 to 34,300 mm3 m−3. The glacial ice ISP concentrations were highest at intermediate elevations (sites 3 and 4) on the Qaanaaq Glacier.
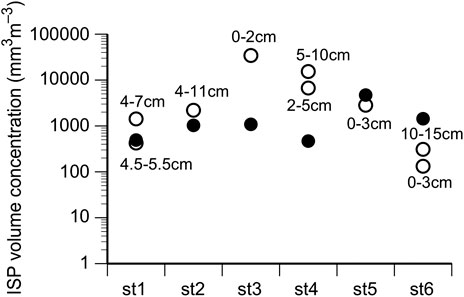
FIGURE 3. Mass concentrations of ISP in snowpack (solid circle) and the glacial ice (open circle) at site 1–6.
We calculated the annual flux of atmospheric deposition of ISP from the ISP concentrations in the snowpack as:
where Fair(snow) is the annual flux of atmospheric ISP, Csnow is the ISP concentration in the snowpack, Hsnow is the SWE at the site, and tsnow is the period from the first day of snow accumulation in this season to the day of the observation. We set August 17, 2016, as the first day of snow accumulation in this season based on the variation in snow height at site SIGMA-B recorded by the automatic weather station (Aoki et al., 2014b; Aoki et al., 2014c).
We also calculated the annual flux of the atmospheric deposition of ISP with the amount of ISP collected by the bucket samplers as:
where Fair(bucket) is the annual flux of atmospheric ISP, Cbucket is the measured concentration of ISP in the water in a bucket, Vbucket is the volume of water in the bucket at the end of sampling, Sbucket is the area of the open mouth of the bucket, and tbucket = 0.071 years (26 days) is the period of bucket sampling from June 6 to July 4, 2017. Table 1 shows the calculated annual fluxes. Fair(bucket) was comparable to Fair(snow), although the period of bucket sampling differed from the snow cover period used for the Fair(snow) calculations.
The annual abundance of ISP outcropped from the glacier surface is the abundance of ISP contained in the glacier ice which melts in an ablation season at each site. We calculated the annual abundance of outcropping ISP at glacier surface at each site as:
where Fout is the annual abundance of outcropping ISP, Cice is the ISP concentration in glacial ice, and Aice is the annual ablation rate of the glacier surface at the site. We used the Aice averages of the annual surface mass balance from 2012/13 to 2015/16 reported by Tsutaki et al. (2017). Table 1 shows the calculated annual values of the outcropped ISP.
Figure 4 shows the annual flux of atmospheric ISP and the annual abundance of outcropping ISP at each site. The dominant source of ISP input to the glacier surface was atmospheric deposition at sites 5 and 6 and outcropping from glacial ice at sites 1–4, where it exceeded 97%. The annual flux of atmospheric ISP was higher at sites 5 and 6. The annual abundance of outcropping ISP was higher at sites 3 and 4.
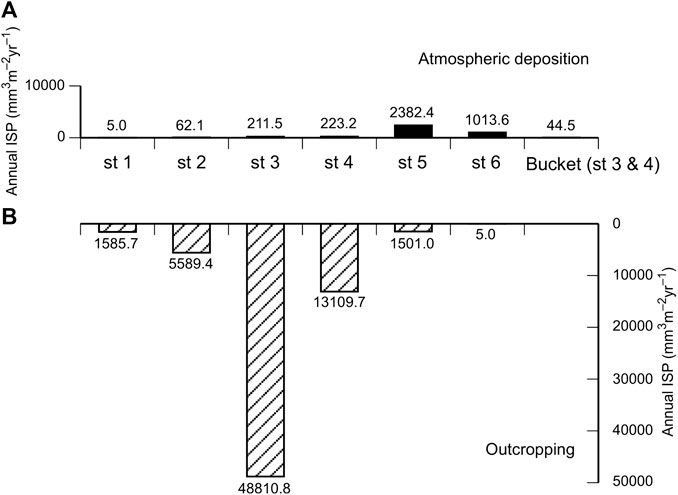
FIGURE 4. (top) Annual flux of atmospheric ISP estimated from ISP concentration in seasonal snowpack in site 1–6 (st1 - st6), and from ISP concentration collected by bucket samplers set in sites 3 and 4 (right most). Value estimated by the bucket samplers is average of those in site 3 and site 4. Numbers of bar graphs indicate the estimated annual flux of atmospheric ISP (mm3 m−2 yr−1). (bottom) Annual abundance of outcropping ISP at the surface of the glacier estimated by ISP concentrations in the glacier ice and annual surface mass balance at each site 1–6. Numbers of bar graphs indicate the estimated annual abundance of outcropping ISP (mm3 m−2 yr−1) in each site.
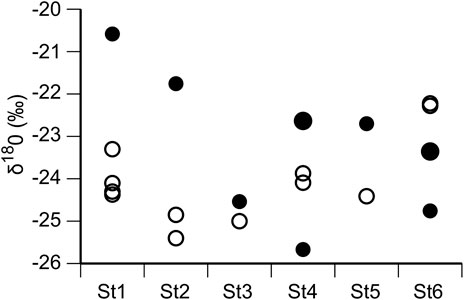
FIGURE 5. δ18O of snow of the seasonal snow (solid circle) and the glacial ice (open circle) at site 1–6.
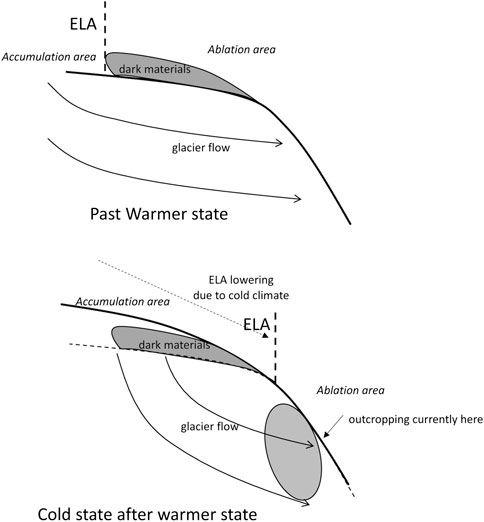
FIGURE 6. Schematic drawing of accumulation of dark materials in warmer state and outcropping of dark materials in current state. Dark materials accumulated in Past Warmer state is conveyed with glacier flow in Cold States inside glacier, then is outcropping currently at intermediate of the glacier.
We consider the cause of the spatial distribution of atmospheric deposition of ISP, which was higher at sites 5 and 6. Hashimoto et al. (2018, 2019) reported that occasional events of intense winds in winter and early spring in this region. Numerical simulation results show that the intense wind is driven by a northerly lee side downward wind from the ice sheet when low pressure exists over the northern Baffin Bay. We speculate that the northerly intense wind from the ice sheet to the Qaanaaq Ice Cap can blow up mineral dust from glacier moraine between the ice sheet and the Qaanaaq Ice Cap, and transport the mineral dust over the Qaanaaq Ice Cap from north to south. Therefore, the ISP concentrations in the snowpack at the more northern and higher elevation sites (5 and 6) are higher than at lower sites (1–4) (Hashimoto et al., 2018).
Next, we considered the cause of the spatial distribution of outcropping ISP, which was very high at sites 3 and 4, where dark material covered the glacier surface (Sugiyama et al., 2014). Although the annual ablation rate of the glacier surface was 1.5 times higher at sites 1 and 2 than at sites 3 and 4, the abundance of outcropping ISP at sites 1 and 2 was lower because the ISP concentrations in the glacial ice at sites 3 and 4 were approximately 10 times higher than those at sites 1 and 2.
We consider why the ISP concentrations in the glacial ice at sites 3 and 4 were higher than those at sites 1 and 2. The equilibrium line altitude (ELA) of the Qaanaaq Glacier is approximately 900 m a.s.l. (Tsutaki et al., 2017). The ice in the present ablation zone formed in a higher accumulation zone in the past and flowed to the present position with the glacier dynamics. Therefore, the ISP at sites 1, 2, 3, and 4 accumulated at high elevation areas in the past. One possible mechanism to accumulate the high ISP concentration at higher elevation areas is the high atmospheric deposition of mineral dust in the past. During the glaciation period, water circulation in the atmosphere weakens, and airborne dust can be transported over long distances. Therefore, the mineral dust concentration in the upper troposphere increases (e.g., Lambert et al., 2008). The rate of mineral dust deposition on land and ocean also increased in the glaciation period (e.g., Lambert et al., 2008). The concentration of mineral dust in an ice core obtained from the Greenland Ice Sheet was more than 10 times higher during the glaciation period than in the Holocene (e.g., Ruth et al., 2003). To identify whether glacier formation and ISP deposition, which is occurring at sites 3 and 4 at present, had occurred at higher elevations in the glaciation period, we measured the water stable isotopes of the glacial ice sample at sites 3 and 4. Generally, the water stable isotope ratio is smaller at cold temperatures. In Greenland ice cores, δ18O was 5–8‰ lower during the glaciation period than at present (Svensson et al., 2008). However, the δ18O in the glacial ice sample was comparable with that in seasonal snow at present (Figure 5). Therefore, we concluded that ISP contained in the inside of the glacier at sites 3 and 4 was deposited in the Holocene. We postulated the following mechanism for the high ISP concentrations deposited on the glacier surface at higher elevations in the Holocene (Figure 6). In a warmer period, the ELA was higher than at present, and the ablation zone expanded to higher areas. In this higher ablation zone, ISP accumulated annually via atmospheric deposition, outcropping substances at the surface of the glacier by ablation, and microbe activities. Then, the air temperature decreased, and ELA descended to the present elevation. The area where the ISP had accumulated became the accumulation zone, and the ISP was transported into the inside of the glacier with accumulated snow. Then, the ISP flowed up to the glacier surface at sites 3 and 4 at present. Søndergaad et al. (2019) believed that the Qaanaaq Ice Cap survived the Holocene Thermal Maximum, but was smaller from 3.3 ± 0.1 to 0.9 ± 0.1 kcal BP than at present, before expanding in the Little Ice Age. The ISP accumulation in higher areas may have occurred in the warm period before the Little Ice Age. To verify this mechanism, further studies need to include glacier flow dynamics and quantitative evaluation of the contribution of microbe activities.
Conclusion
We conducted glaciological observations in the ablation zone of the Qaanaaq Glacier in northwestern Greenland to reveal the spatial variation in the input of insoluble particles (ISP) on the glacier surface from atmospheric deposition and outcropping at the surface of the glacier by ablation. The annual abundance of atmospheric depositions of ISP was estimated from ISP concentrations in the seasonal snowpack before the snowmelt season at low (sites 1 and 2), intermediate (sites 3 and 4), and high (sites 5 and 6) elevation sites. ISP was collected by bucket samplers at site 4 and a side moraine. The annual abundance of atmospheric ISP at site 4 estimated using the seasonal snowpack was comparable to that based on bucket sampling. The annual atmospheric ISP was higher at sites 5 and 6 because the intense wind from the Greenland Ice Sheet blows over the Qaanaaq Ice Cap and transports mineral dust to higher areas on the Qaanaaq Ice Cap. The annual abundance of outcropping ISP was higher at sites 3 and 4 because the ISP concentrations in the glacial ice at sites 3 and 4 were higher, although the annual ablation rate was higher at sites 1 and 2 than at sites 3 and 4. Because the water stable isotopes of the glacial ice at sites 3 and 4 were not the values found in the glaciation period, we propose that concentrated ISP, which accumulated at higher elevations in a warmer Holocene period, is flowing up at sites 3 and 4 at present.
Data Availability Statement
All datasets generated for this study are included in the article.
Author Contributions
SM: Designed research, conducted field research, and wrote the paper. RH: Conducted field researches and laboratory analyses and wrote this paper. YK: conducted field researches. TA: Gave technical supports.
Funding
This study was supported by MEXT/JSPS KAKENHI (18H05292, 17H01156, 16H01772, and 15H01733), ArCS (Arctic Challenge for Sustainability), ArCS II (JPMXD1420318865), grant from the Joint Research Program of the Institute of Low Temperature Science, Hokkaido University (18S007 and 19G043), and Okhotsk Network Program from the Pan-Okhotsk Research Center, Institute of Low Temperature Science, Hokkaido University.
Conflict of Interest
The authors declare that the research was conducted in the absence of any commercial or financial relationships that could be construed as a potential conflict of interest.
Acknowledgments
We thank Navarana K’avigak, Toku Ohshima, Kim Petersen, and Sofie Jensen for their support in Qaanaaq. We also thank Tetsuhide Yamasaki, Yoshinori Iizuka, Naga Ohshima, Tomonori Tanikawa, and Masashi Niwano for support of field observations. We also appreciate reviewers and a scientific editor Dr. Helle Astrid Kjær for their helpful comments.
References
Aoki, T., Aoki, T., Fukabori, M., Hachikubo, A., Tachibana, Y., and Nishio, F. (2000). Effects of snow physical parameters on spectral albedo and bidirectional reflectance of snow surface. J. Geophys. Res. 105, 10219–10236. doi:10.1029/1999JD901122
Aoki, T., Hachikubo, A., and Hori, M. (2003). Effects of snow physical parameters on shortwave broadband albedos. J. Geophys. Res. 108, 4616. doi:10.1029/2003JD003506
Aoki, T., Kuchiki, K., Niwano, M., Kodama, Y., Hosaka, M., and Tanaka, T. (2011). Physically based snow albedo model for calculating broadband albedos and the solar heating profile in snowpack for general circulation models. J. Geophys. Res. 116, D11114. doi:10.1029/2010JD015507
Aoki, T., Matoba, S., Yamaguchi, S., Tanikawa, T., Niwano, M., Kuchiki, K., et al. (2014a). Light-absorbing snow impurity concentrations measured on Northwest Greenland Ice Sheet in 2011 and 2012. Bull. Glacier Res. 32, 21–31. doi:10.5331/bgr.32.21
Aoki, T., Matoba, S., Uetake, J., Takeuchi, N., and Motoyama, H. (2014b). Field activities of the “snow impurity and glacial microbe effects on abrupt warming in the Arctic” (SIGMA) project in Greenland in 2011-2013. Bull. Glacier Res. 32, 3–20. doi:10.5331/bgr.32.3
Aoki, T., Matoba, S., Yamaguchi, S., Fujita, K., Yamasaki, T., Tanikawa, T., et al. (2014c). SIGMA-AWS dataset, 1.10, arctic data archive system (ADS), Japan. Available at: http://ads.nipr.ac.jp/dataset/A20140714-002.
Bolch, T., Sandberg Sørensen, L., Simonsen, S. B., Mölg, N., Machguth, H., Rastner, P., et al. (2013). Mass loss of Greenland’s glaciers and ice caps 2003-2008 revealed from ICESat laser altimetry data. Geophys. Res. Lett. 40, 875–881. doi:10.1002/grl.50207010.1002/grl.50270
Bory, A. J.-M., Biscaye, P. E., Svensson, A., and Grousset, F. E. (2002). Seasonal variability in the origin of recent atmospheric mineral dust at NorthGRIP, Greenland. Earth Planet Sci. Lett. 196, 123. doi:10.1016/S0012-821X(01)00609-4
Box, J. E., Fettweis, X., Stroeve, J. C., Tedesco, M., Hall, D. K., and Steffen, K. (2012). Greenland ice sheet albedo feedback: thermodynamics and atmospheric drivers. Cryosphere 6, 821–839. doi:10.5194/tc-6-821-2012
Davidson, C. I., Jaffrezo, J.-L., Small, M. J., Summers, P. W., Olson, M. P., and Borys, R. D. (1993). Trajectory analysis of source regions influencing the south Greenland Ice Sheet during the Dye 3 gas and aerosol sampling program. Atmos. Environ A 27, 2739–2749. doi:10.1016/0960-1686(93)90306-J
Fierz, C., Armstrong, R. L., Durand, Y., Etchevers, P., Greene, E., MacClung, D. M., et al. (2009). “The international classification for seasonal snow on the ground,” in IHP-VII technical documents in hydrology No. 83, IACS contribution No.1 (Paris, France: UNESCO-IHP), 90.
Hanna, E., Mernild, S. H., Cappelen, J., and Steffen, K. (2012). Recent warming in Greenland in a long-term instrumental (1881-2012) climatic context: I. Evaluation of surface air temperature records. Environ. Res. Lett. 7 (4), 045404. doi:10.1088/1748-9326/7/4/045404
Hashimoto, A., Niwano, M., Yamaguchi, S., Yamasaki, T., and Aoki, T. (2018). Numerical simulation of lee-side downslope winds near Siorapaluk in northwest Greenland. CAS/JSC WGNE Res. Act. Atmos. Oceanic Modell. 48, 505–506.
Hashimoto, A., Yamasaki, T., Teruo, A., Masashi, N., and Yamaguchi, S. (2019). Occurrence frequency of strong winds at Siorapaluk and Qaanaaq in northwest Greenland. Annu. Rep. Snow Ice Hokkaido. 38, 81–84. (in Japanese with English abstract).
Lambert, F., Delmonte, B., Petit, J. R., Bigler, M., Kaufmann, P. R., Hutterli, M. A., et al. (2008). Dust-climate couplings over the past 800,000 years from the EPICA Dome C ice core. Nature 452, 616–619. doi:10.1038/nature06763
Matoba, S., Yamasaki, T., Miyahara, M., and Motoyama, H. (2014). Spatial variations of δ18O and ion species in the snowpack of the northwestern Greenland ice sheet. Bull. Glacier Res. 32, 79–84. doi:105331/bgr.32.79
Meier, M. F., Dyurgerov, M. B., Rick, U. K., O’Neel, S., Pfeffer, W. T., Anderson, R. S., et al. (2007). Glaciers dominate eustatic sea-level rise in the 21st century. Science 317, 1064–1067. doi:10.1126/science.1143906
Nagatsuka, N., Takeuchi, N., Uetake, J., and Shimada, R. (2014). Mineralogical composition of cryoconite on glaciers in northwest Greenland. Bull. Glacier Res. 32, 107–114. doi:105331/bgr.32.10710.5331/bgr.32.107
Nagatsuka, N., Takeuchi, N., Uetake, J., Shimada, R., Onuma, Y., Tanaka, S., et al. (2016). Variations in Sr and Nd isotopic ratios of mineral particles in cryoconite in western Greenland. Front. Earth Sci. 4, 93. doi:10.3389/feart.2016.00093
Rignot, E., Velicogna, I., van den Broeke, M. R., Monaghan, A., and Lenaerts, J. T. M. (2011). Acceleration of the contribution of the Greenland and Antarctic ice sheets to sea level rise. Geophys. Res. Lett. 38, 1–5. doi:10.1029/2011GL046583
Ruth, U., Wagenbach, D., Steffensen, J. P., and Bigler, M. (2003). Continuous record of microparticle concentration and size distribution in the central Greenland NGRIP ice core during the last glacial period. J. Geophys. Res. 108, 4098, doi:10.1029/2002JD002376
Sasaki, H., Matoba, S., Shiraiwa, T., and Benson, C. S. (2016). Temporal variation in iron flux deposition onto the northern North Pacific reconstructed from an ice core drilled at Mount Wrangell, Alaska. SOLA 12, 287–290. doi:10.2151/sola.2016-056
Shimada, R., Takeuchi, N., and Aoki, T. (2016). Inter-annual and geographical variations in the extent of bare ice and dark ice on the Greenland Ice Sheet derived from MODIS satellite images. Front. Earth Sci. 4, 43. doi:10.3389/feart.2016.00043
Søndergaad, A. S., Larsen, N. K., Olsen, J., Strunk, A., and Woodroffe, S. (2019). Glacial history of the Greenland Ice Sheet and a local ice cap in Qaanaaq, northwest Greenlan. J. Quaternary. Sci. 34 (7), 536–547. doi:10.1002/jqs.3139
Sugiyama, S., Sakakibara, D., Matsuno, S., Yamaguchi, S., Matoba, S., and Aoki, T. (2014). Initial field observations on Qaanaaq ice cap, northwestern Greenland. Ann. Glaciol. 55, 25–33. doi:10.3189/2014AoG66A102
Svensson, A., Andersen, K. K., Bigler, M., Clausen, H. B., Dahl-Jensen, D., Davis, S. M., et al. (2008). A 60,000 year Greenland stratigraphic ice core chronology. Clim. Past. 4, 47–57. doi:10.5194/cp-4-47-2008
Svensson, A., Biscaye, P. E., and Grousset, F. E. (2000). Characterization of late glacial continental dust in the Greenland Ice Core Project ice core. J. Geophys. Res. 105 (D4), 4637–4656. doi:10.1029/1999JD901093
Takeuchi, N., Sakaki, R., Uetake, J., Nagatsuka, N., Shimada, R., Niwano, M., et al. (2018). Temporal variations of cryoconite holes and cryoconite coverage on the ablation ice surface of Qaanaaq Glacier in northwest Greenland. Ann. Glaciol. 59, 21–30. doi:10.1017/aog.2018.19
Tedesco, M., Fettweis, X., van den Broeke, M. R., van de Wal, R. S. W., Smeets, C. J. P. P., van de Berg, W. J., et al. (2011). The role of albedo and accumulation in the 2010 melting record in Greenland. Environ. Res. Lett. 6, 014005. doi:10.1088/1748-9326/6/1/014005
Tsutaki, S., Sugiyama, S., Sakakibara, D., Aoki, T., and Niwano, M. (2017). Surface mass balance, ice velocity and near-surface ice temperature on Qaanaaq Ice Cap, northwestern Greenland, from 2012 to 2016. Ann. Glaciol. 58, 181–192. doi:10.1017/aog.2017.7
Uno, I., Amano, H., Emori, S., Kinoshita, K., Matsui, I., and Sugimoto, N. (2001). Trans-Pacific yellow sand transport observed in April 1998: a numerical simulation. J. Geophys. Res. 106 (D16), 18331–18344. doi:10.1029/2000JD900748
Warren, S. G., and Wiscombe, W. J. (1980). A model for the spectral albedo of snow. II: snow containing atmospheric aerosols. J. Atmos. Sci. 37, 2734–2745. doi:10.1175/1520-0469(1980)037<2734:amftsa>2.0.co;2
Keywords: Greenland, insoluble particles, Qaanaaq, dark ice, albedo reduction
Citation: Matoba S, Hazuki R, Kurosaki Y and Aoki T (2020) Spatial Distribution of the Input of Insoluble Particles Into the Surface of the Qaanaaq Glacier, Northwestern Greenland. Front. Earth Sci. 8:542557. doi: 10.3389/feart.2020.542557
Received: 13 March 2020; Accepted: 22 September 2020;
Published: 11 December 2020.
Edited by:
Helle Astrid Kjær, Niels Bohr Institute, DenmarkReviewed by:
Zhiwen Dong, Chinese Academy of Sciences (CAS), ChinaDavid F. Porter, Columbia University, United States
Copyright © 2020 Matoba, Hazuki, Kurosaki and Aoki. This is an open-access article distributed under the terms of the Creative Commons Attribution License (CC BY). The use, distribution or reproduction in other forums is permitted, provided the original author(s) and the copyright owner(s) are credited and that the original publication in this journal is cited, in accordance with accepted academic practice. No use, distribution or reproduction is permitted which does not comply with these terms.
*Correspondence: Sumito Matoba, bWF0b2JhQGxvd3RlbS5ob2t1ZGFpLmFjLmpw