Abstract
Flood forecasting is one of the most significant tools for reducing flood risk and avoiding the loss of life To solve the problem of low resolution and the short lead time of the traditional urban flood forecasting method, this work develops a novel high-accuracy and long lead time model through coupling the atmospheric and hydrodynamic models. The GRAPE_MESO model is applied as an atmospheric model for predicting rainstorms. To improve reliability, a reconstructed method is put forward to correct predicted rainstorm data. The reconstructed predicted rainstorm is then used as input data for the hydrodynamic flood model. Finally, the urban flood inundation process was forecasted by the coupled atmospheric and flood model. Though applying the coupled model at Fengxi New Town (China), the performance is evaluated for realistic urban flood forecasting. The results show that the coupled modeling system can predict the urban flood inundation process with high-resolution and a long lead time.
Introduction
Urban flood disasters are becoming more and more frequent with the increasing growth of urbanization and the effects of climate change. In an impermeable and highly urbanized landscape with inadequate drainage capacity, intense precipitation events can cause cities to experience severe flood inundation, a situation which is likely to become more common in the foreseeable future (Lee et al., 2016; Wu et al., 2017; Esposito et al., 2018) with the increasing intensity of rainstorms . Research from the Intergovernmental Panel on Climate Change (IPCC) estimates that the annual probability of 500 mm extreme rainfall was around 1% between 1981 and 2000, and that this probability is likely to increase to 18% by 2100 (Emanuel, 2017). Therefore, it is of great importance to developing preventive measures and prediction methods for analyzing flood occurrence (See, 2019).
Flood inundation forecasting is one of the most efficient tools for reducing disaster risk and avoiding losses, but it has been a challenging problem until now (Chen et al., 2006). Aiming to extend the lead time, ground-based rain gauge measured rainfall should be replaced by high-resolution predicted rainstorm products from the meso scale atmospheric model (numerical weather prediction, NWP) as input data of flood inundation forecasting system (Siccardi et al., 2005; Li et al., 2017). However, because of the nonlinear and chaotic properties of the earth’s atmosphere, quantitative precipitation forecasting (QPF) is still a problem for the NWP model, therefore how to get a high-resolution and high-accuracy QPF product is the primary condition for releasing reliable flood inundation forecasting (Tian et al., 2017). Accurate flood forecasting can be achieved by using a model that combines the meso scale NWP model and the rainfall-runoff model (Wu et al., 2014; Yesubabu et al., 2016). For instance, Li et al. (2017) brought together the Liuxihe hydrology model with the Weather Research and Forecasting (WRF) model for large-scale watershed flood forecasting in southern China. This method extends the lead time of flood forecasting and provides forecasting products with a grid resolution of 20 × 20 km. Tian et al. (2019) developed an atmospheric-hydrological modeling system, which was constructed by coupling the WRF model and the Hebei hydrology model together with the 3DVar data assimilation module. The result shows that the forecasting system had better performance for space uniform rainstorms, but that there were large errors in predicting rainstorms with a short duration. Sikder et al. (2019) used a curve map, designed by the relationship of rainfall and water levels, to generate flood forecasting maps, but this method does not perform well in heavy rainstorm conditions. Habibi et al. (2019) used the NWS Hydrologic distributed model, driven by QPF data from the X-band weather radar. The result shows that the system can predict the variation of water level and stream, but that its time errors significantly deteriorate in forecasting quality for some basins. Liu et al. (2018) adopted the Variable Infiltration Capacity (VIC) model to forecast annual maximum flood, based on rainfall and temperature extremum from the European Center for Medium-Range Weather Forecasts model (ECMWF). These forecasting results show that the flood forecasting system can accurately forecast flood peak discharge at least 10 days in advance, but that it cannot be reliably applied to predicting urban flood processes.
To compute urban flood process, as the traditional hydrological model cannot simulate the inundation process, the full hydrodynamic model numerically solves the shallow water equations (SWEs) is an ideal tool (Costabile et al., 2012; Xia et al., 2017). The detailed hydraulic process, e.g., the water depth and the discharge evolution, can be evaluated in complex urban terrain by using the dynamic wave based hydrodynamic model. Since it is a physics-based model, the computational burden is relatively large compared to the conceptual hydrological ones. To improve computational efficiency for a hydrodynamic model, the GPU techniques are applied, as in that of Hou et al. (2018). The high efficiency hydrodynamic model can produce reliable urban flood inundation processes quickly. It is therefore an ideal hydrodynamic flood model for forecasting.
In this work, an atmospheric-flood forecasting system was proposed by coupling the GRAPE_MESO model and the two-dimensional hydrodynamical flood model. The GRAPE_MESO model was used to forecast rainstorms. A dynamic wave based hydrodynamical model driven by predicted rainstorm data was then applied to calculate urban flood inundation. The forecasting system was evaluated by different rainstorms with different characteristics in the study area. To this end, the paper is structured as follows: Study Area describes the information of the study area. The coupled atmospheric-hydrodynamical modeling system description is in Coupled Atmospheric-Hydrodynamical Modeling System. Results and Discussion discusses the results and the future research directions, before the conclusion in Conclusions.
Study Area
The study area is located in Fengxi New Town (China). It belongs to the arid and semi-arid zones (Sjögersten et al., 2013). It is a typical residential area with a total area of 22.5 km2. This area is a flood-prone area with multiple inundated locations. There is one weather station in Fengxi New Town. Rainstorm data from the weather station are regarded as the ground truth to evaluate the GRAPES_MESO outputs. The annual rainfall is mainly concentrated in summer (July–September). Local pipe-network blockage and unreasonable structural design limit drainage capacity. Hence floods may happen when encountering heavy rainfall. Rainstorm inundation can lead to the loss of many lives and applying the coupled forecasting system in flooding areas could have great socio-economic benefits.
Because surface morphology has a significant effect on the runoff process, high-resolution surface data is needed to measure and characterize the true terrain of the study area. In flood simulations, the performance of the model is usually sensitive to spatial resolution. As the DEM resolution was improved, the high-resolution DEM data can reflect surface microscopic features, the surface runoff is more complicated. In this work, terrain data was measured by UAV aerial survey technology. The mesh size of the Digital Elevation Model (DEM) and Digital Orthophoto Map (DOM) data is 2 m with totaling 5,369,855 cells. The DEM data is shown in Figure 1 and the land-use data is shown in Figure 2. According to the orthophoto map, cells were divided into five different land-use types by the maximum likelihood classification, as shown in Table 1. The infiltration parameters were obtained through field measurements by using the double-cycle infiltrator. The manning coefficient of the underlying surface was determined by reference to relevant standards and literature on urban drainage (Li, 2007; Gao, 2014).
FIGURE 1

DEM data.
FIGURE 2
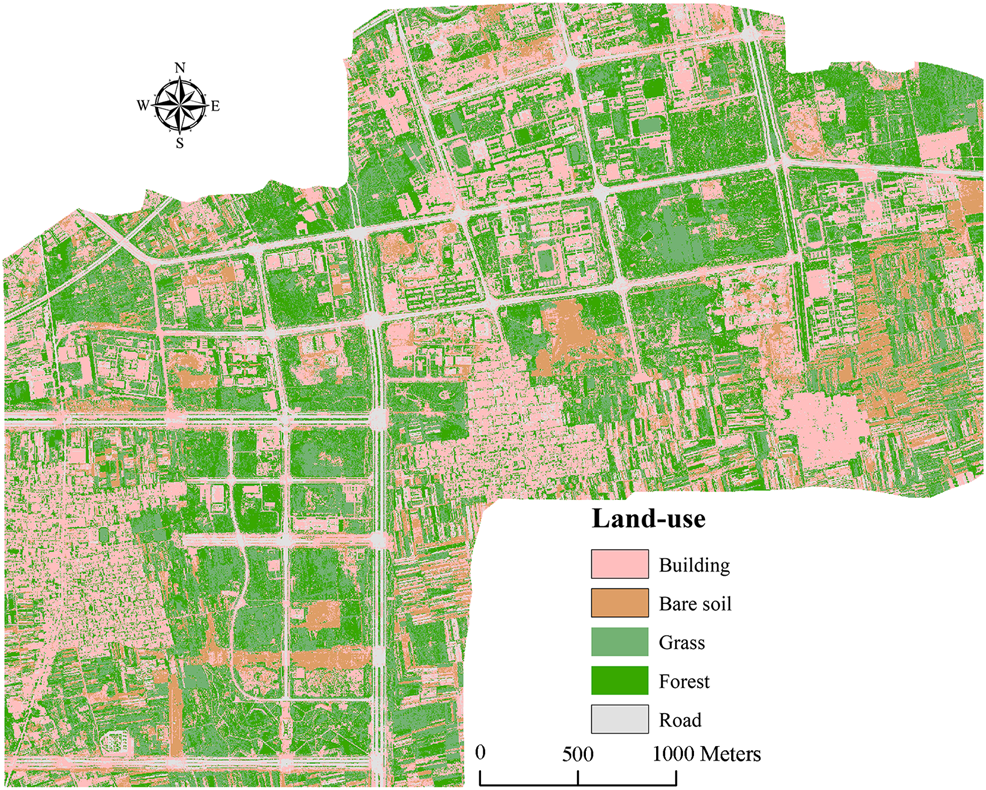
Land-use data.
TABLE 1
| Land-use | Area/km2 | Percentage occupancy/% | Stable infiltration rate/(mm h−1) | Manning |
|---|---|---|---|---|
| Building | 0.445 | 25.872 | 0 | 0.015 |
| Road | 0.143 | 8.314 | 0 | 0.014 |
| Bare soil | 0.450 | 26.163 | 19.430 | 0.030 |
| Grass | 0.523 | 30.407 | 28.390 | 0.060 |
| Forest | 0.159 | 9.244 | 37.550 | 0.200 |
Properties of the underlying surface and manning coefficients.
Coupled Atmospheric-Hydrodynamical Modeling System
Integration of the Model in the System
The atmospheric-flood forecasting model is constructed by coupling the GRAPE_MESO model, the two-dimensional hydrodynamical flood model and the predicted rainstorm reconstructed method. Figure 3 shows the flowchart of the coupled modeling system. The predicted rainstorm data is provided by the GRAPE_MESO model every 12 h and improved by the reconstructed method which is based on the regression analysis method. The predicted rainstorm data is then regarded as input data for the hydrodynamic flood model, which is calibrated using historical rainfall-runoff data before simulation. To evaluate the effect of the reconstructed method on the improvement of both rainstorm data and flood inundation, the measured rainstorm data from the weather station and the raw predicted data are also used to drive the flood model for the inundation process forecasting. The depth and area of inundation are the main affecting factors of the city resident trip (Lyu et al., 2019). Hence this work uses these indexes to evaluate the inundation forecasting performance.
FIGURE 3
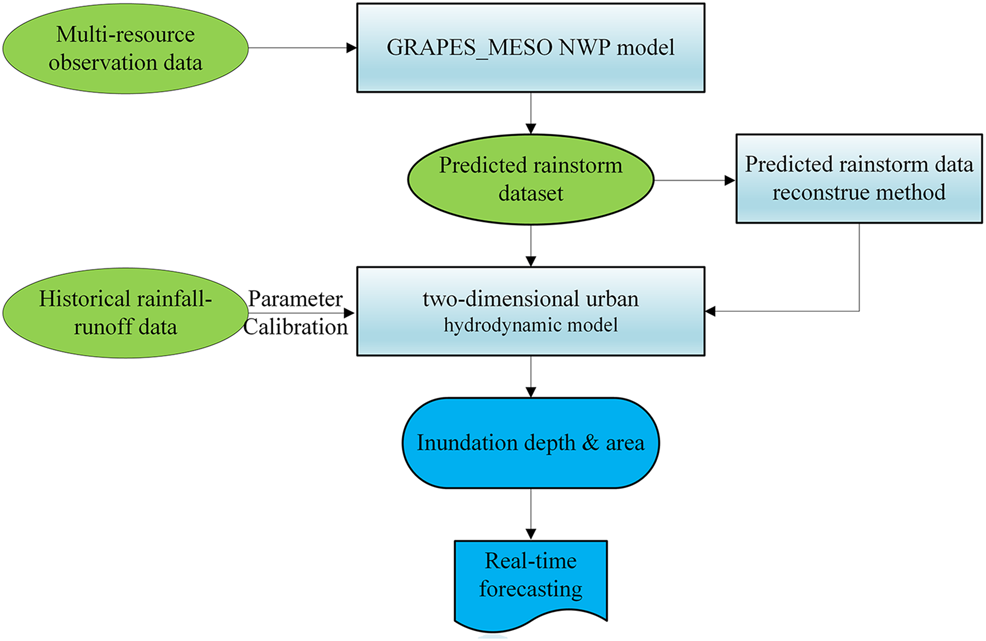
Flowchart of the urban flood inundation forecasting system.
Global/Regional Assimilation and Prediction System_MESO Model
The Global/Regional Assimilation and Prediction System (GRAPES) is a numerical weather prediction model independently developed by the China Meteorological Administration, which adopts multilevel universal data assimilation. The global medium-range weather forecasting system (GRAPES_GFS) and GRAPES_MESO model can be, respectively, formed by selecting regional or global medium-term physical process software packages according to different resolution requirements (Zhang et al., 2018; Long et al., 2011). The urban flood forecasting system uses GRAPES_MESO Version 4.0 to forecast precipitation data. The rainstorm forecasting system updates the rainstorm data of China and its surrounding areas with a maximum time of 72 h at 0 and 12 o’clock every day, and it can be obtained stably and efficiently. The temporal resolution is 3 h and the spatial resolution is 10 km2.
Predicted Rainstorm Reconstructed Method
To achieve high-resolution urban flood forecasting, it is important to forecast rainstorm data with reasonable time and spatial resolution. This method used the GRAPES_MESO predicted data (http://data.cma.cn/) as the independent variable and data from the weather station at Fengxi New Town as the dependent variable. The reconstructed formula of this method is fitted using the regression analysis function of SPSS statistical analysis software. The numerical forecasting products of GRAPES_MESO were first released on December 29, 2015, and the analysis sample selected for this method covered the period from January 1, 2016 to January 1, 2019, using 3 years of predicted and measured data. Excluding rainfall that was less than 10 mm, data from 37 rainstorms were selected as the training data in the SPSS regression analysis. In addition to the training data, six additional rainstorms with different characteristics were selected as test data. Rainstorm Ⅰ had relatively uniform distribution and short duration. Rainstorm Ⅱ and Ⅲ had multiple rain peaks and relatively long duration. While rainstorm Ⅳ and Ⅴ had high rainfall intensity and short duration, and rainstorm Ⅵ had relatively uniform distribution and long duration.
The study area belongs to the arid and semi-arid zones. Therefore, it has four distinct seasons. The rule of rainstorm samples took this into account and we qualitatively concluded that the first and third quarter forecasting rainfall was smaller than the measured data, while the second quarter rainfall forecasting was larger. Because of the small number of rainstorms in the fourth quarter, it was not analyzed. This work selected six common models such as linear equation, quadratic equation, cubic equation, logarithmic equation, exponential equation, and power equation for fitting formula. By removing over-fitting and low-correlation functions, it deduced the functional relationship between predicted data, and measured data as shown in Table 2. The logarithmic function fits the first quarter, and the correlation coefficient R2 is 0.81. The second and third quarters formula are fitted by the cubic function. R2 of these two quarters are 0.91 and 0.93, respectively. The third quarter has a lot of rainstorm samples, so the fitting effect was best. In the formula, x represents raw predicted data; xH is predicted relative humidity; y represents correction value.
TABLE 2
| Quarter | Formula |
|---|---|
| First | |
| Second | |
| Third | |
| Fourth | None |
Correction formulas of the study area.
Because time resolution of the rainstorm forecasting data was 3 h, the rain peaks are not obvious if the rainstorm duration was less than 3 h. This will causes the rainfall process to become flat and errors in the inundation simulation. Aiming to make the reconstructed rainfall data more in line with the actual situation, the reconstructed rainfall was redistributed in this step, using the correction formula in Table 2. The Chicago rainfall pattern formula based on multi-year rain data describes the short-duration rainfall process in the region (Liu et al., 2018). The Fengxi New Town rainstorm intensity formula is shown in Eq. 1 (Hou et al., 2017). According to this, the rainstorm will be proportionally distributed according to the Chicago rainfall pattern distribution ratio. According to the equation calculation, total rainfall accounted for 10% in the first hour, 81% in the second hour, and 9% in the third hour. Through this distributed method, rain peak is constructed when the duration was less than 3 h.Where is the rainstorm intensity; is the return period; is the duration.
The Nash efficiency coefficient (NSE) was used to evaluate how similar the predicted data is to the actual situation. We used Eq. 2 to calculate this (if NSE on the brink of 1, it means the simulated result is reliable): Where is the simulated data sequence; is the measured data sequence; is the measured data mean; is the measured data.
The Two-Dimensional High-Resolution Hydrodynamical Flood Model
The two-dimensional high-resolution hydrodynamical model is a full hydrodynamic model based on GPU acceleration techniques. The high-resolution DEM is in the framework of a Godunov-type finite volume scheme to solve the shallow water equations (SWEs). To accurately predict the urban flood inundation process, it resolves the realistic features of urban terrain and uses Graphic Processing Units (GPU) as a parallel computing technique to speed up calculation.
The relative errors (RE) of the inundation area and depth were adopted to evaluate the performance of the flood model. Equation 3 shows is the calculated formula, where represents the simulated value and represents the measured value:
Surface Hydrodynamic Model
Government Equations
The governing equation of the two-dimensional high-resolution hydrodynamical model was the SWEs, which were derived from depth-integrating the Navier-Stokes equations and assuming hydrostatic pressure distribution. In this model, the kinetic and turbulent viscous terms, wind stresses and Coriolis effects were neglected, a conservation law of the two-dimensional no-linear shallow water equations can be written in the vector form as:where represents the time; and are the Cartesian coordinates; denotes the vector of conserved flow variables consisting of , and , i.e., the water depth, unit-width discharges in x- and y-direction, respectively; , , and are depth-averaged velocities in x- and y-directions; represents the acceleration of gravity; and represent the flux vectors in x- and y-directions; is the source vector that may be further subdivided into slope source term and friction source term; represents the bed elevation; is the bed roughness coefficient that is generally computed by with being the manning coefficient, denotes the rainfall source term.
Infiltration
To describe the characteristics of soil water infiltration, the Green-Ampt infiltration model was applied according to the basic assumptions.Where represents the infiltration rate; is the saturated hydraulic conductivity; , are initial saturated water content and soil moisture, respectively; represents humid front suction; represents the start time of inundation after rainfall beginning; is rainfall intensity; is cumulative infiltration, .
Drainage-Pipe System
The governing equation of the drainage network system model is one-dimensional St. Venant’s equation, conservation law of the 1D equations can be written as:Where represents the discharge in the pipe; is the discharge section area of the pipe; t represents the time; represents the acceleration of gravity; represents the distance of the cross section withthe flow; represents friction slope.
When considering the surface water flow into the pipe system, we used the weir formula to solve the problem.Where represents the discharge that flows into the inlet; is the discharge coefficient; is the diameter of the node; represents the water depth of the surface grid connecting with the inlet.
This model uses the virtual linear reservoir method to simulate when the water leaves the underground drainage system because the water pipes become surcharged. In this method, the pipe network drainage system is treated as a series of connected virtual reservoirs. A reservoir that is not full indicates the inlet well is draining, and when the water amount exceeds the limit of a reservoir, it indicates that the inlet well will overflow. The water depth of the reservoir is solved by Eq. 11. When the water amount of the reservoir is greater than the storage capacity, it is considered as the overflow, and the overflow amount is the difference between the water amount and the storage capacity.Where is the current water depth the of virtual reservoir; is the old water depth; represents the inflow and outflow of the neighboring kth reservoir; is the surface inflow or the overflow, the inflow is positive and the overflow is negative; is the area of the reservoir.
Numerical Method and Graphic Processing Units High-Performance Computing Technology
The model adopts the framework of the Godunov-type cell-centered finite volume scheme based on structured grids to solve the SWEs. The fluxes of mass and momentum at the cell edges are calculated by the HLLC (Harten Lax van Leer Contact) approximate Riemann solver. The slope source term is computed by the slope flux method (Hou et al., 2013). The friction source term is calculated by the improved explicit method (Hou et al., 2018). When computing the fluxes and the slope source terms, the values at the midpoints of the cell edges are required. The two-stage explicit Runge-Kutta approach is applied to update the flow variables to a new time level. These values are evaluated by a novel 2D edge-based MUSCL (Monotonic Upwind Scheme for Conservation Laws) scheme.
The code is programmed by using C++ and Compute Unified Device Architecture (CUDA), which could run on Graphics Processing Unit (GPUs) to substantially accelerate the computation. The cells waiting to be computed are allocated to each thread using the way of the matrix. Each GPU thread calculates the boundary flux and source term of cell in sequence. The input data and computed results are treated as parameters of the Kernel function. After the calculation is completed, the result is returned to the GPU memory. In order to reduce the time of the data exchange between the GPU memory and the CPU memory, all data is transferred to the GPU memory after initialization, and all data is exchanged in the GPU memory during the calculation process. Until the result needs to be output, the data is stored in the GPU memory return to the CPU memory. In this work, the computational platform was based on the NVIDIA Tesla P100 and Intel (R) Core (TM) Xeon E5-2650.
Results and Discussion
Model Validation
The model was verified by using the measured rainstorm data between 0:36 on August 25, and 12:27 on August 25, 2016. The rainstorm is bimodal with a total duration of 12 h and rainfall of 97.2 mm, as shown in Figure 4A. According to the field observation document provided by the Fengxi New Town management committee, there were eight points with actual inundation area records, as shown in Figure 4B.
FIGURE 4
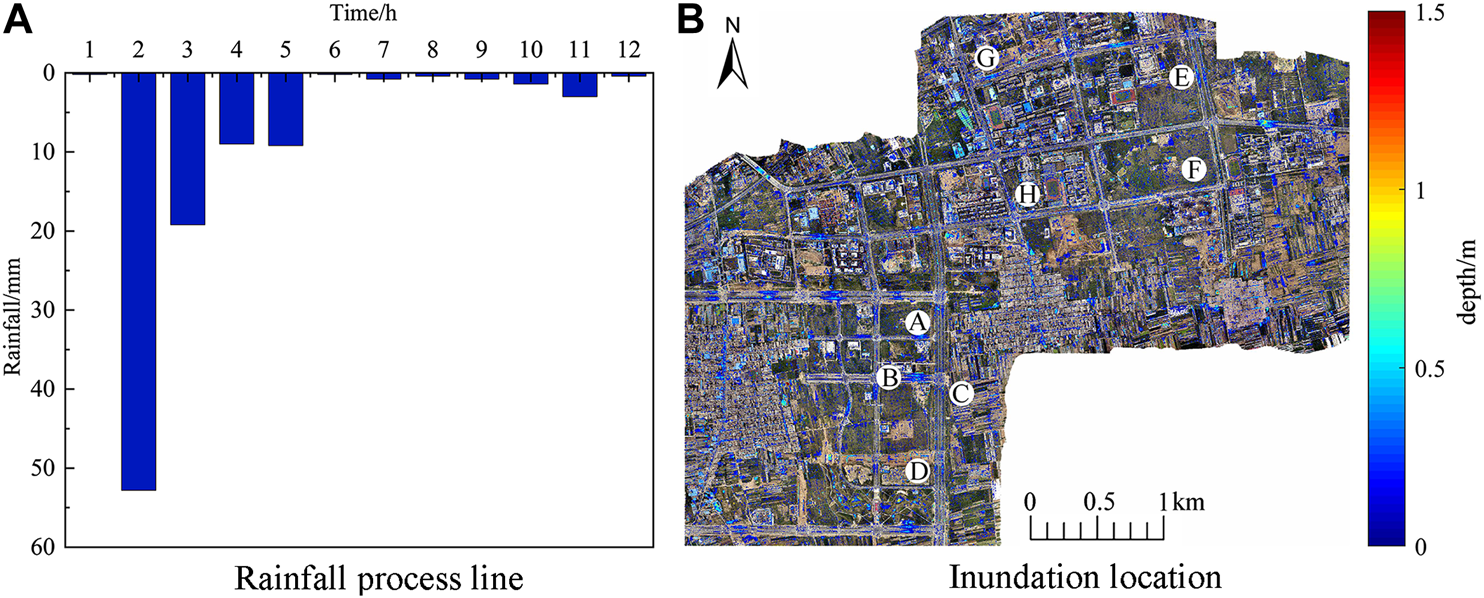
Rainfall process line and inundation location. (A) Rainfall process line. (B) Inundation location.
By analyzing the comparison of field pictures and simulated results (Figure 5), the location of simulated inundation is in line with the field data. Although the measured inundation area of four points compares with the simulated results, it can be seen from Table 3 that the simulated inundation point has good agreement with the measurement, and the average relative error of inundation area is only 3.95%, showing that the model is reliable, and it can effectively simulate urban flood inundation process. The hydrodynamical model has high precision and computational efficiency, and it is suitable for urban flood process simulation with large-scale and complex terrain.
FIGURE 5
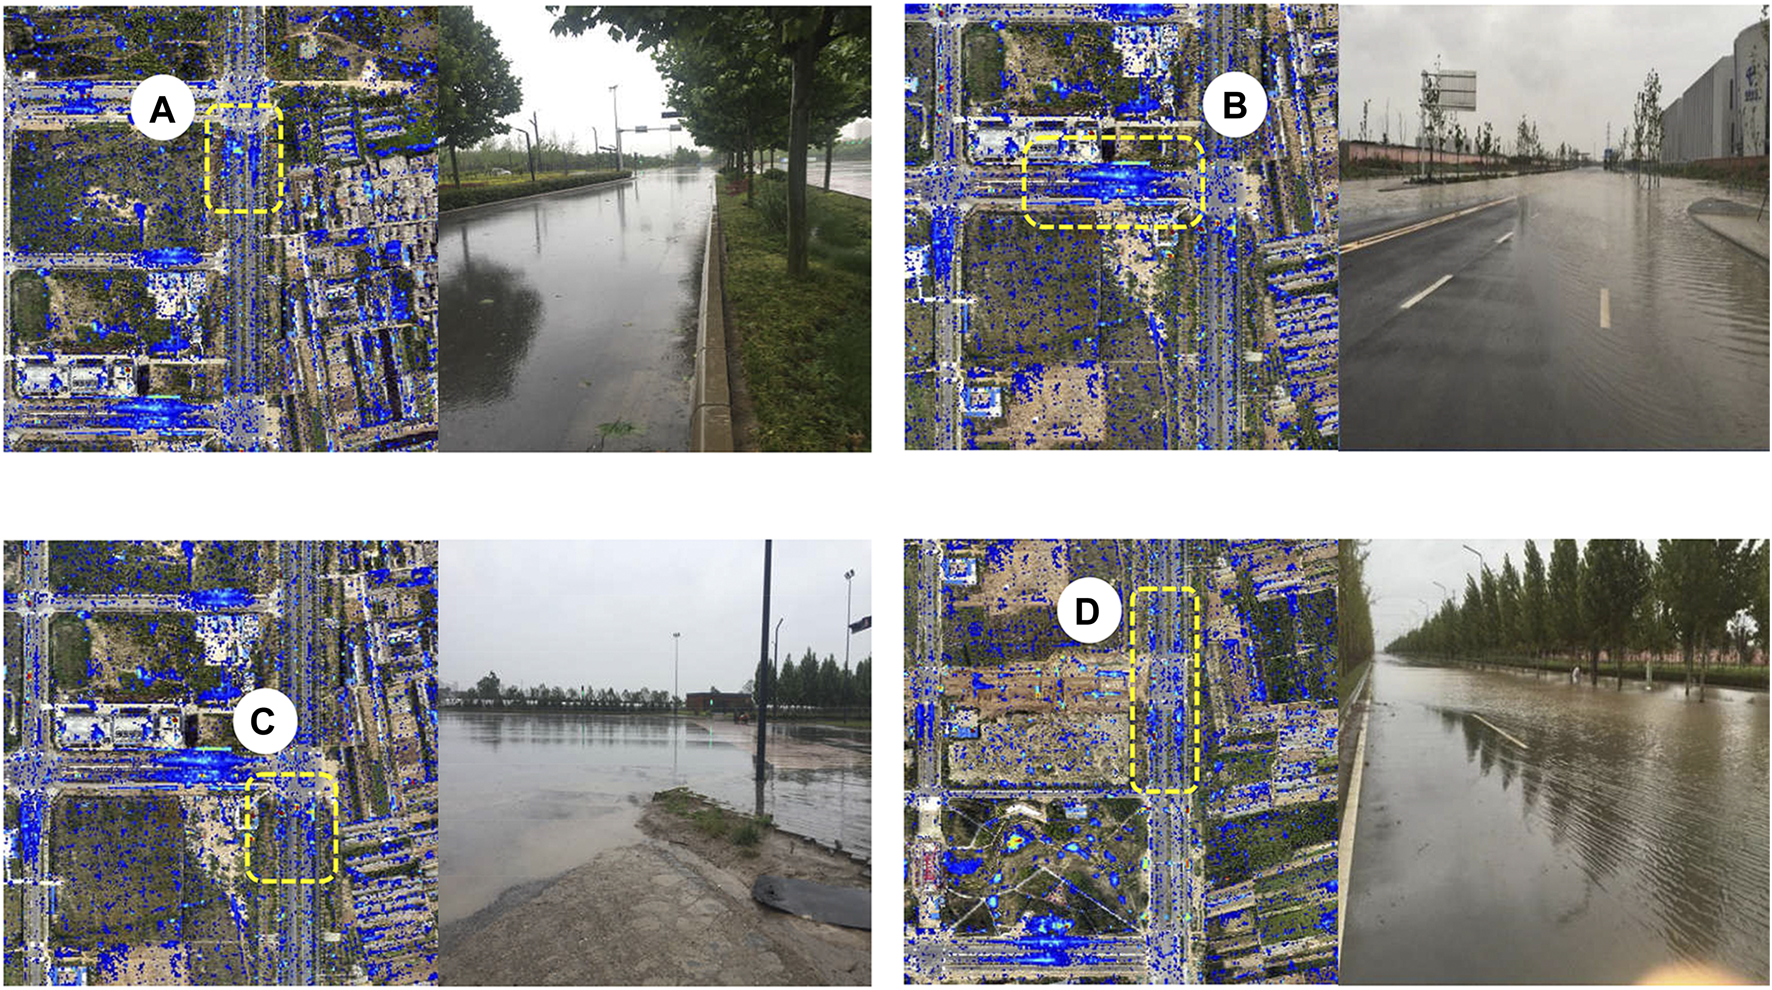
The comparison of field pictures and simulated results: the labels “A, B, C, and D” represent four inundation points, and the yellow dashed box represents the study area of inundation.
TABLE 3
| Location | Inundation area (m2) | RE (%) | |
|---|---|---|---|
| Simulated value | Measured value | ||
| A | 6,600 | 6,837 | 3.5 |
| B | 8,150 | 7,901 | 3.2 |
| C | 6,656 | 6,388 | 4.2 |
| D | 7,800 | 7,665 | 1.8 |
| E | 1,566 | 1,650 | 5.1 |
| F | 770 | 800 | 3.8 |
| G | 917 | 970 | 5.5 |
| H | 1738 | 1820 | 4.5 |
The comparison of measured results and simulated results (t = 4 h).
Evaluation of Rainstorm Forecasting
The accuracy of flood forecasting highly depends on the quality of predicted rainstorm data. The test rainstorms have unique characteristics to represent the reconstructed method performance under different conditions. The GRAPES_MESO forecasting product issued 48 h previously was adopted. The characteristics of rainstorms with and without the reconstructed method are presented in Table 4.
TABLE 4
| No | Type | Star time | Duration/h | Accumulated rainfall/mm | NSE |
|---|---|---|---|---|---|
| I | Measured rainstorm | 23:03 | 12 | 40.2 | — |
| Raw rainstorm | 18:00 | 12 | 95.73 | −2.13 | |
| Reconstructed rainstorm | 18:00 | 12 | 68.34 | −0.4 | |
| Ⅱ | Measured rainstorm | 9:15 | 24 | 17.6 | — |
| Raw rainstorm | 6:00 | 21 | 41.6 | −4.7 | |
| Reconstructed rainstorm | 6:00 | 21 | 36.6 | −2.8 | |
| Ⅲ | Measured rainstorm | 16:45 | 21 | 32.8 | — |
| Raw rainstorm | 15:00 | 21 | 34.8 | −0.53 | |
| Reconstructed rainstorm | 15:00 | 21 | 33.3 | 0.41 | |
| Ⅳ | Measured rainstorm | 10:18 | 5 | 34.6 | — |
| Raw rainstorm | 10:00 | 9 | 50.7 | 0.54 | |
| Reconstructed rainstorm | 10:00 | 9 | 43.4 | 0.93 | |
| Ⅴ | Measured rainstorm | 16:45 | 2 | 21.0 | — |
| Raw rainstorm | 15:00 | 6 | 29.8 | 0.21 | |
| Reconstructed rainstorm | 15:00 | 6 | 15.71 | 0.69 | |
| Ⅵ | Measured rainstorm | 03:03 | 35 | 39.8 | — |
| Raw rainstorm | 03:00 | 42 | 72.2 | −5.02 | |
| Reconstructed rainstorm | 03:00 | 42 | 43.0 | 0.33 |
Characteristics of rainstorms with and without the reconstructed method.
From the comparison of the NSE of each rainstorm with and without the reconstructed method, it shows that the NSE of reconstructed forecast data is higher than the NSE of raw rainstorm data. The results prove that the reconstructed method can effectively reduce the uncertainty of forecast data. The comparison of different rainfall processes in Figure 6 also proves this. But for the situation where the raw forecast data has been close to the measured rainstorm data (No. Ⅵ), it cannot further reduce the uncertainty. Compared with the raw data, the accumulated rainfall treated by the reconstructed method has fewer errors. The data of start time and duration does not completely match the measured data. It is the reason for the uncertainty in the reconstruction. It can show that this method can correct the rainfall process and reduce the uncertainty of the predicted rainstorm.
FIGURE 6
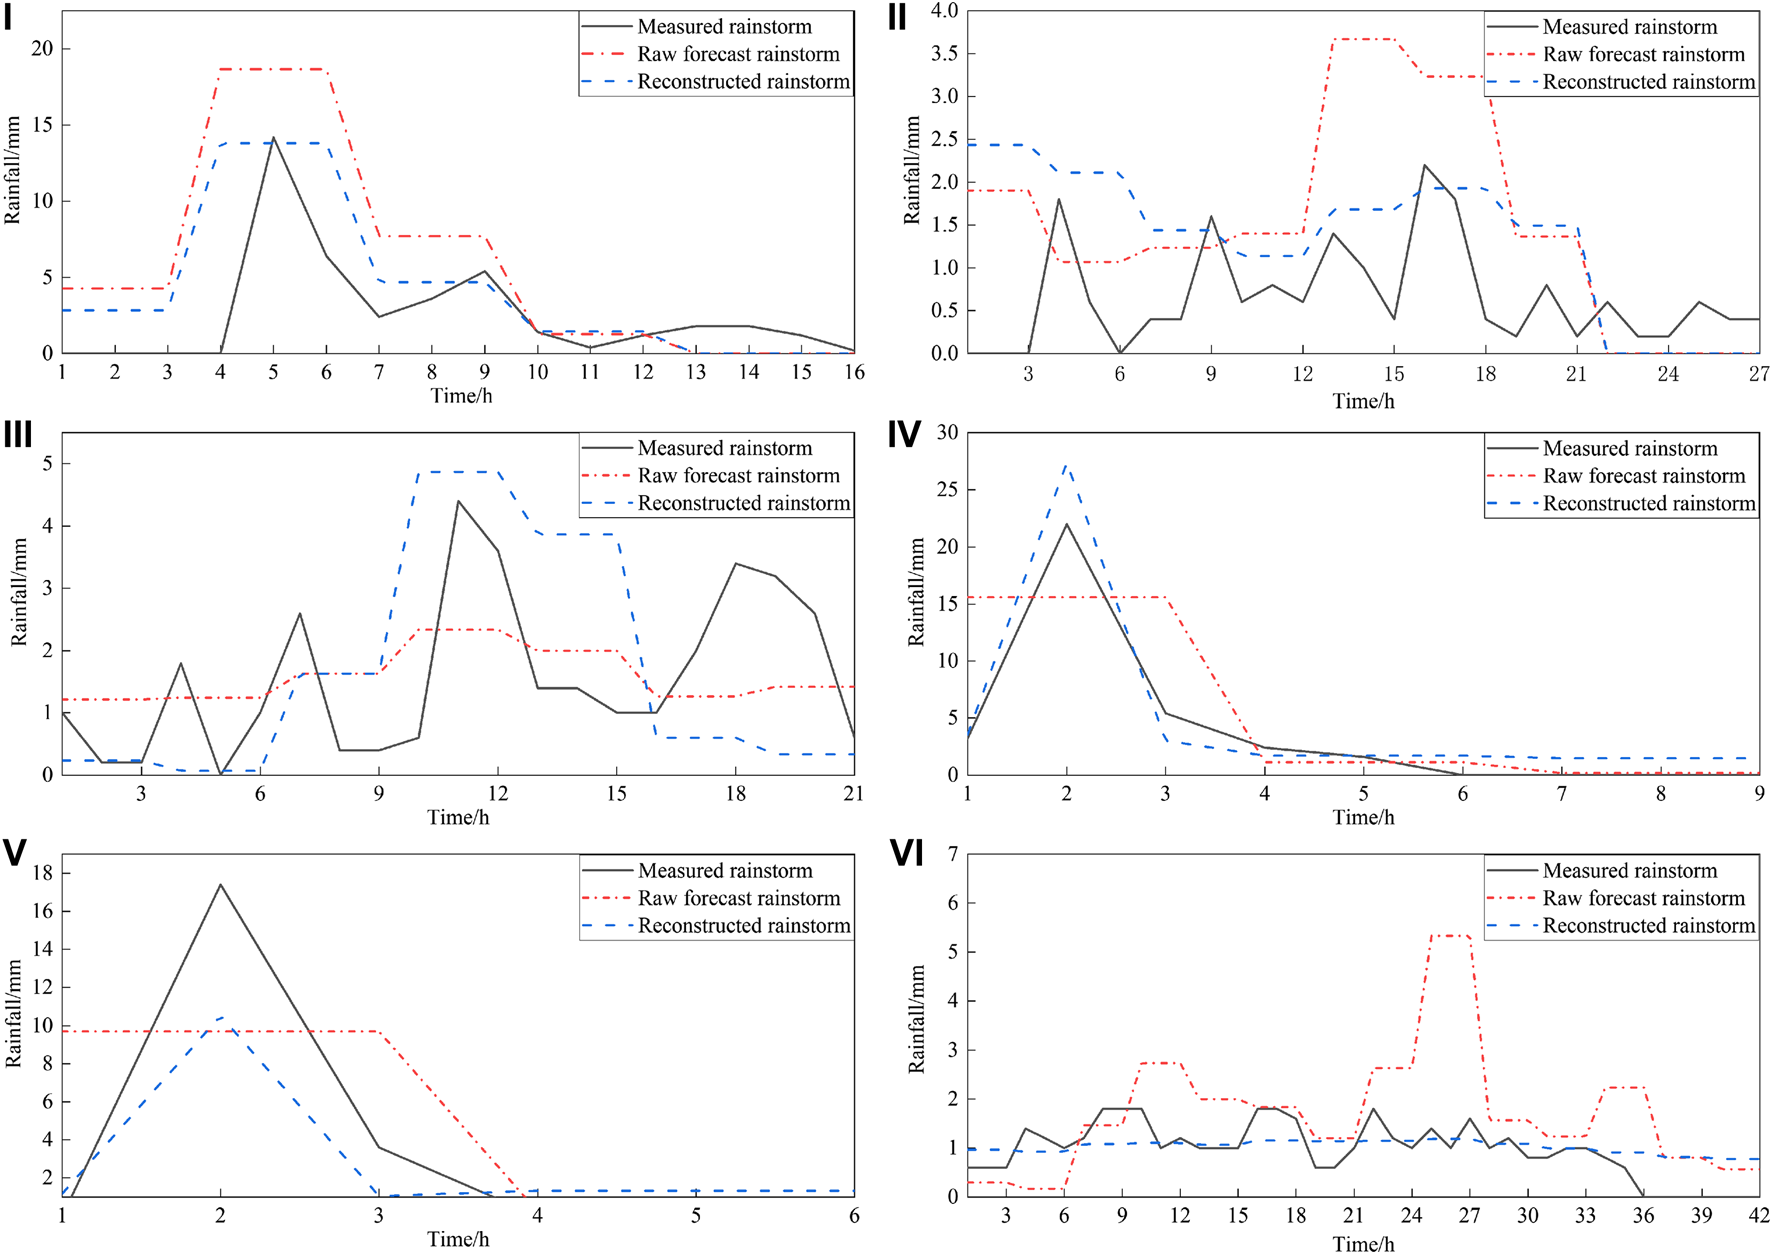
The comparison of rainfall process with and without the reconstructed method: the labels “I‐VI” represent the serial number of six rainstorms; the black solid line is the rainfall data measured by the weather station; the red dashed line is the raw GRAPES_MESO forecast data; the blue dashed line is the new forecast data generated by the reconstruction method.
The Comparison of the Used Hydrodynamic Model and Mike Model
The computational efficiency of the used hydrodynamic model and MIKE-SHE model were compared. The rainstorm data adopted the model validation data. The common parameters have the same value. But for the MIKE-SHE model, the water depth threshold for the dry and wet cell discrimination is the software recommended values. The drying depth was 0.005 m, the flooding water depth was 0.05 m, and the wetting depth is 0.1 m.
In all scenarios, the computational efficiency of the used model was higher than the MIKE-SHE model. Table 5 shows that the model calculation time can meet the forecast requirement even with 2 m spatial resolution. And the computational efficiency of the used hydrodynamic model is more significant than the MIKE-SHE model as the number of computational grids increases. Assuming that the weather prediction model can forecast the rainstorm 72 h in advance, the model can take 5.09 h to complete the flood process simulation (2 m resolution), then the forecast information will release 54.91 h in advance. The hydrodynamic model equipped with GPU high-performance computing technology can meet forecast requirements.
TABLE 5
| Model type | Cell resolution/m (cell number) | Computation time/hour | Forecast lead time/hour |
|---|---|---|---|
| The used hydrodynamic model | 2 (5,369,855) | 5.09 | 54.91 |
| 5 (859,682) | 2.18 | 57.82 | |
| 10 (215,131) | 0.05 | 59.95 | |
| MIKE-SHE | 2 (5,369,855) | 11.5 | 48.5 |
| 5 (859,682) | 2.68 | 57.32 | |
| 10 (215,131) | 0.06 | 59.94 |
Runtime for 12 h of flood simulations at different spatial resolutions.
Table 6 represents the error comparison of the used model and the MIKE-SHE model. Take the four points marked in Figure 4B as an example. Through calculation, the errors of inundation area by using the used hydrodynamic model in location A, B, C, D were 3.5, 3.2, 4.2, 1.8%, while the errors of inundation area by using the MIKE21 FM model were 14.3, 4.6, 5.4, 16.9%. The simulated accuracy of the used hydrodynamic model is better, and the calculation errors of the submerged area of the four regions A, B, C, and D were increased by 1.1, 11.1, 1.2, and 15.1%, respectively. The superiority of the used hydrodynamic model in the complex underlying surface is more obvious. The results show that the used model improved the simulation of the problem of the wetting and drying boundary, and can be better applied to the simulation of urban flood process.
TABLE 6
| Location | Inundation area (m2) | RE (%) | |||
|---|---|---|---|---|---|
| Measurement | MIKE-SHE model | The used hydrodynamic model | MIKE-SHE model | The used hydrodynamic model | |
| A | 6,837 | 6,522 | 6,600 | 4.6 | 3.5 |
| B | 7,901 | 6,772 | 8,150 | 14.3 | 3.2 |
| C | 6,388 | 6,046 | 6,656 | 5.4 | 4.2 |
| D | 7,665 | 6,370 | 7,800 | 16.9 | 1.8 |
The error comparison of the used model and MIKE-SHE model (t = 4 h).
Evaluation of Inundation Depth and Area Forecasting
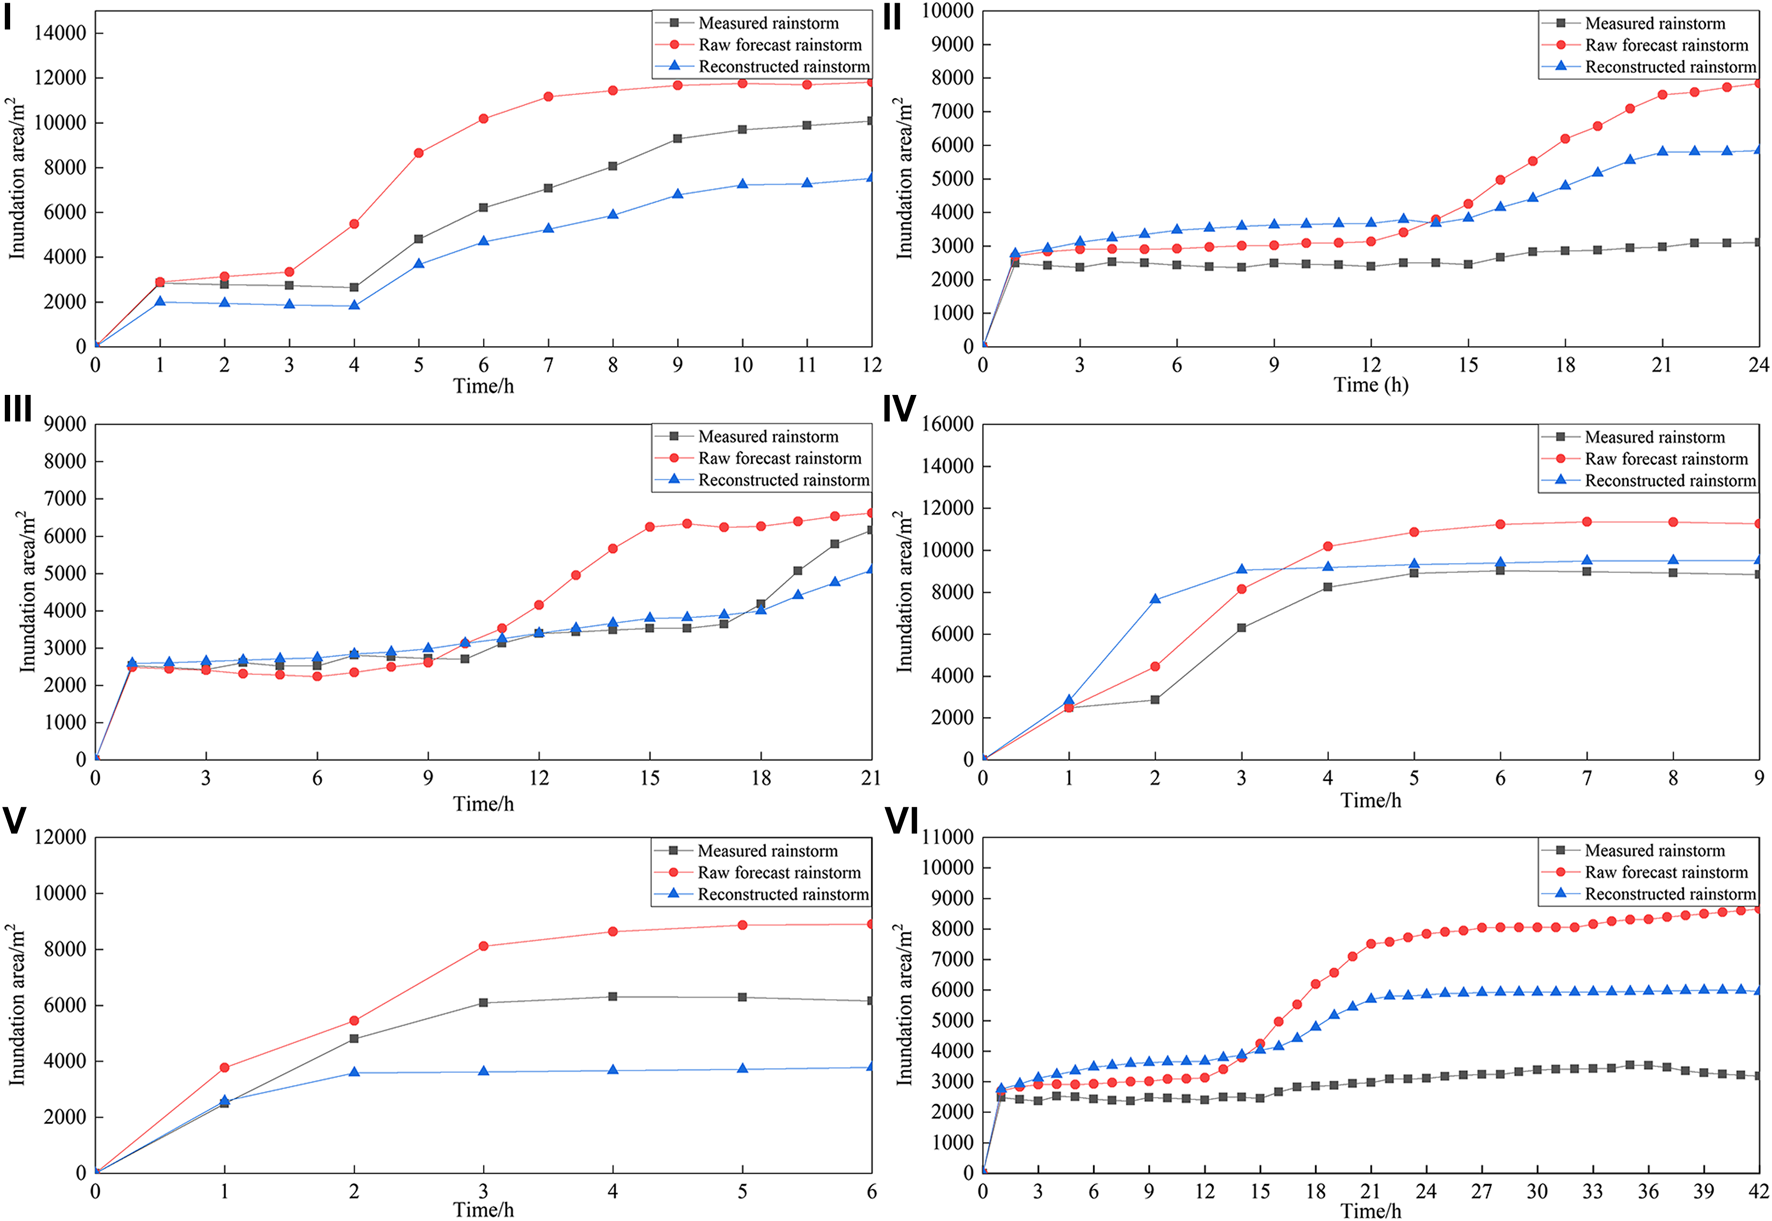
Take Point B in Figure 4B which is one of the severely flooded locations in the study area as an example. It took 6.79, 11.35, 8.61, 3.82, 2.55, and 17.81 h, respectively, to simulate the inundation process in the study area. Figure 7 shows the simulated inundation area using three kinds of rainstorm data (measured data, raw forecast data, and reconstructed forecast data). Figure 8 shows the simulated inundation depth. It can conclude that the variation trends of three types of simulated area and depth are consistent, but there have different errors. Because GRAPES_MESO rainstorm forecasting overestimated rainfall and duration, the simulated forecasting used the raw forecasting data to drive the forecasting system, which was greater than that simulated by using the measured data. The forecasting simulated by using the reconstructed data was much closer to the measured results. The forecasting system had different forecasting performance on inundation, caused by rainstorms with different characteristics.
FIGURE 7
Inundation area simulation by using different input data: the labels “I‐VI” represent the serial number of six rainstorms; the black line is the simulated inundation area generated by using measured rainfall data; the red line is the simulated inundation area generated by using the raw GRAPES_MESO forecast data; the blue line is the simulated inundation area generated by using the reconstructed forecast data.
FIGURE 8
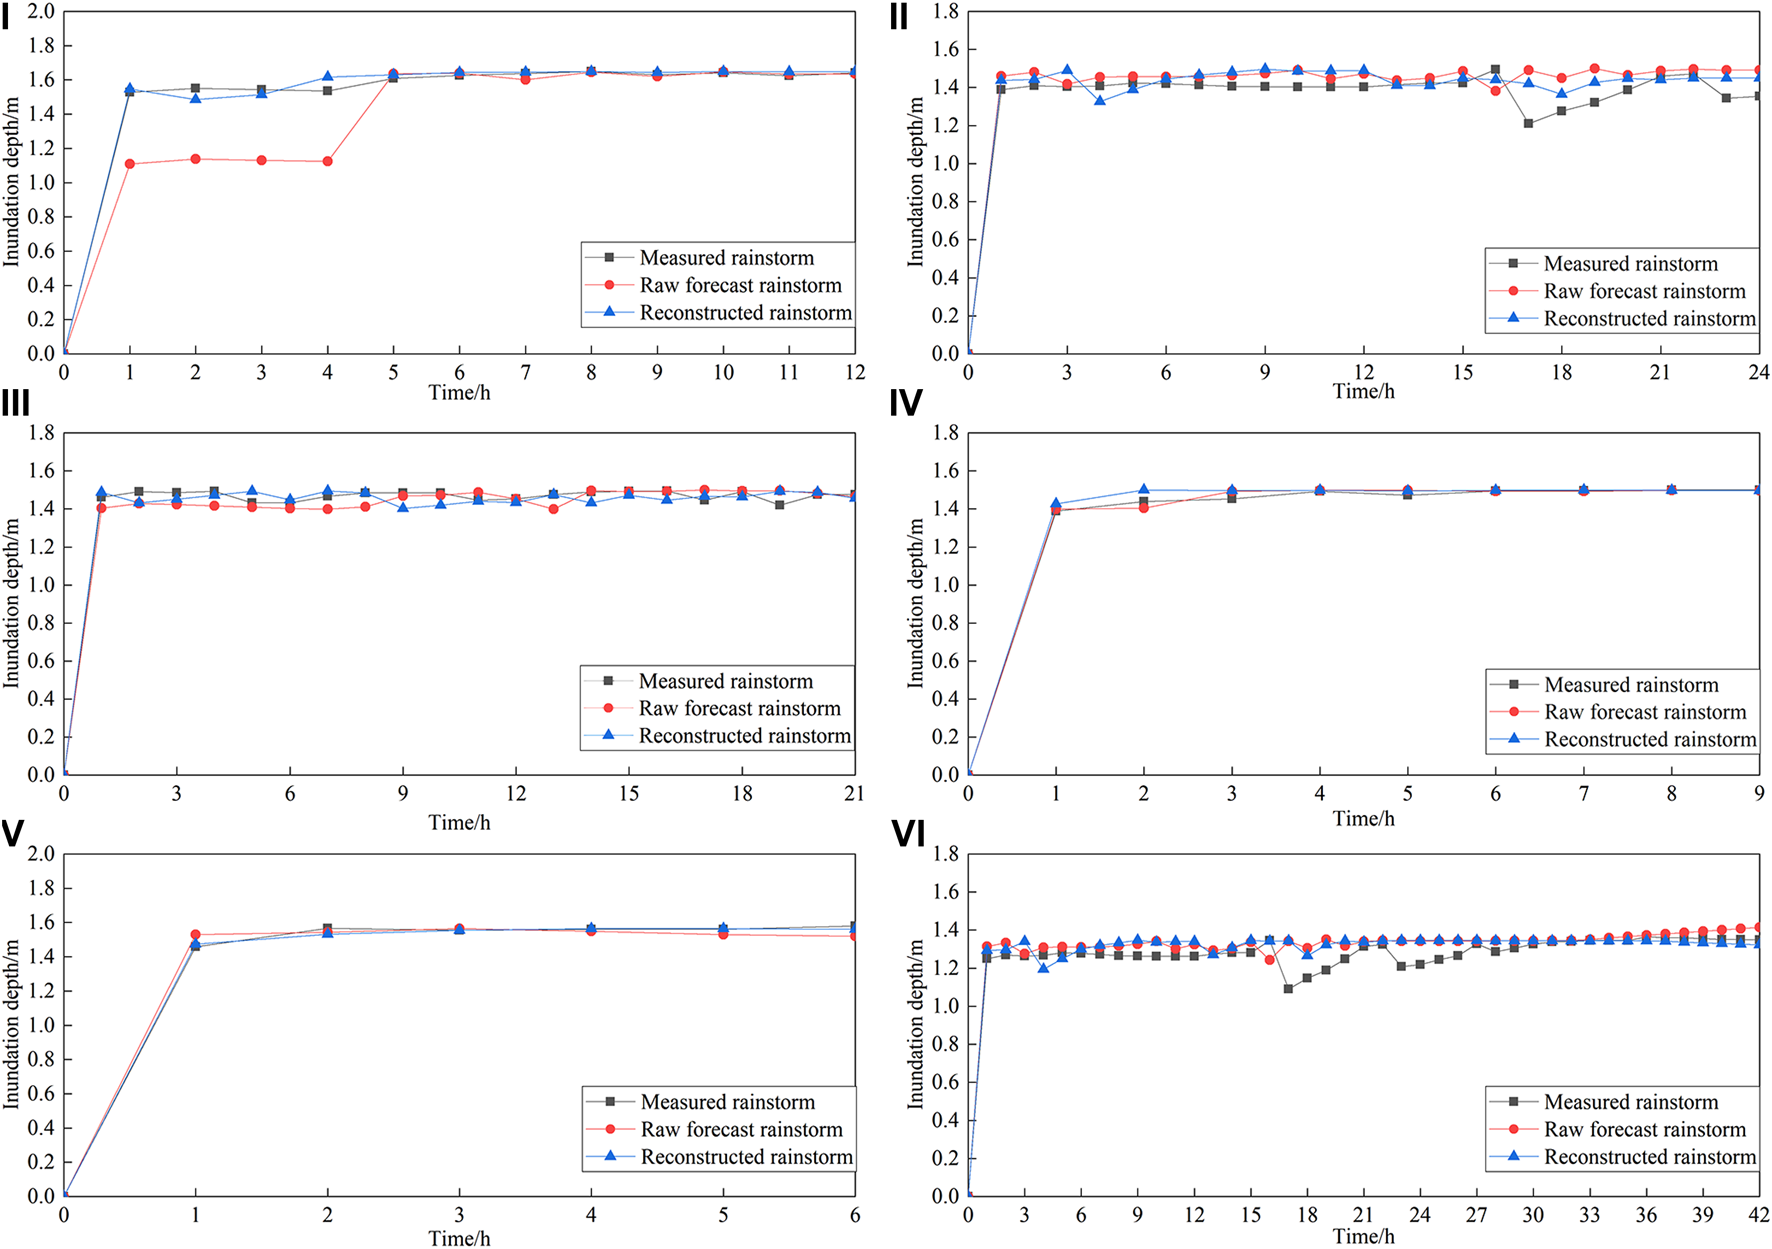
Inundation depth simulation by using different input data: the labels “I‐VI” represent the serial number of six rainstorms; the black line is the simulated inundation depth generated by using measured rainfall data; the red line is the simulated inundation depth generated by using the raw GRAPES_MESO forecast data; the blue line is the simulated inundation depth generated by using the reconstructed forecast data.
If the start and stop time for the forecasted rainstorm is the same as the actual one, the reconstructed method has a better revised effect on the flood forecast caused by the short-duration rainstorm. Taking rainstorm Ⅳ as an example, the start and stop time match the actual situation, hence the reconstructed effect is better, but the forecast start time for rainstorm Ⅳ is 1 h earlier than the actual one, so the reconstructed effect is less effective. For a long-duration rainstorm, such as rainstorm Ⅲ, the flood forecast is more accurate because the overall corrected rainfall process was in line with the actual one. However, if the local deviation of reconstructed rainfall is large, such as in rainstorms Ⅰ, Ⅱ, and Ⅵ, the reconstructed effect in the early period of the flood is good. With the extension of the rainstorm duration, the rainfall error in the early period gradually accumulates, which in turn leads to a gradual increase in the error of the flood forecast. This phenomenon means the reconstructed method has uncertainty for some conditions.
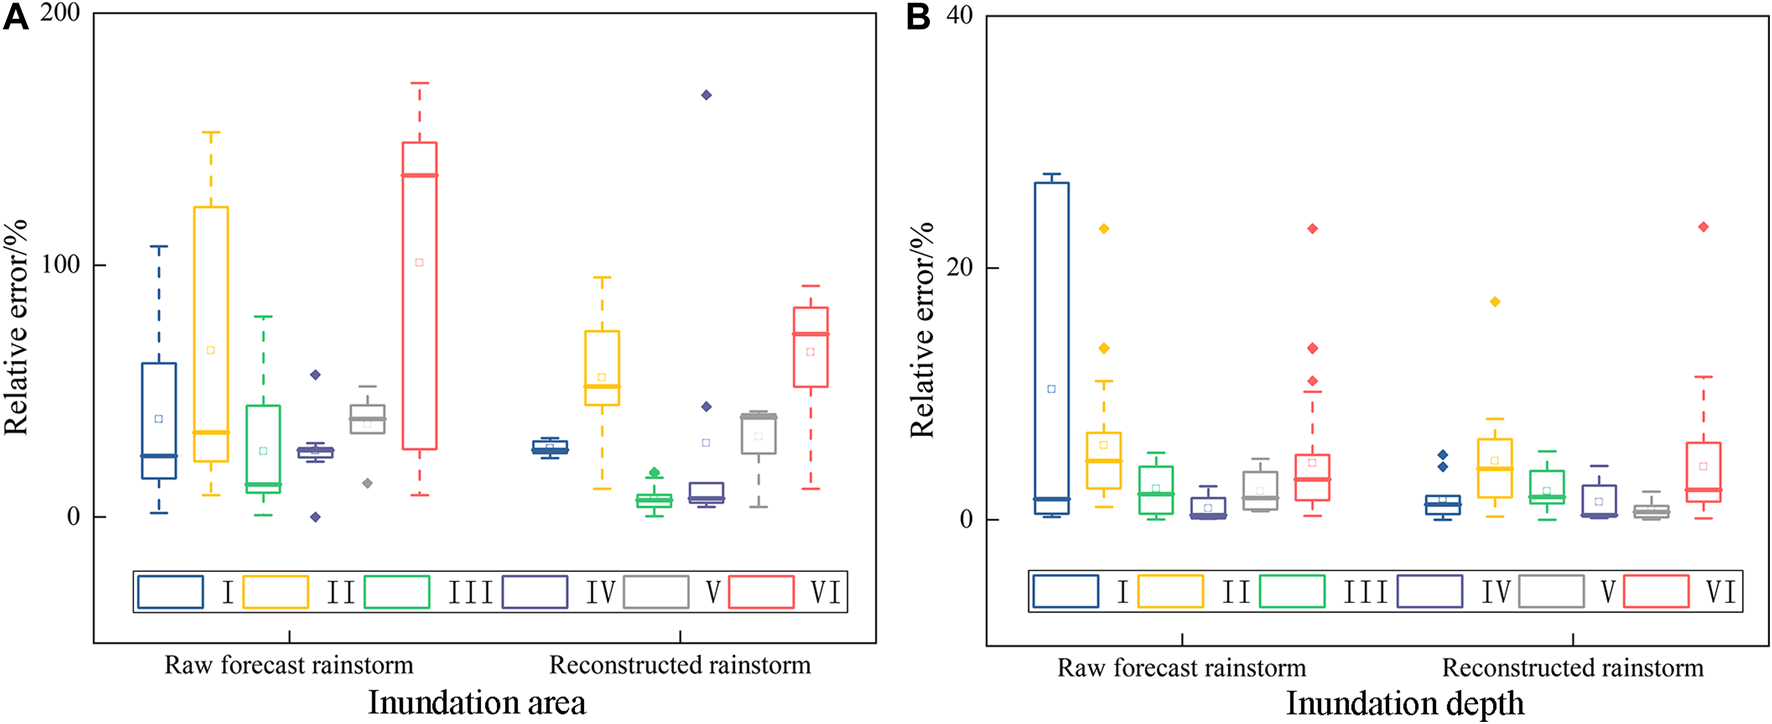
The RE of inundation simulated forecasting by using predicted rainstorm data and measured rainstorm data is shown in Figure 9. From this, we can conclude that the RE of the predicted inundation area and depth simulated by using the reconstructed forecast rainstorm are lower than those simulated by using the raw forecast rainstorm data. The average RE of area in rainstorms Ⅰ∼Ⅵ are about 27.29, 55.38, 7.28, 29.41, 31.83, and 63.46%, respectively. The average RE of depth in rainstorms Ⅰ∼Ⅵ are about 1.65, 4.69, 2.26, 1.42, 0.81, and 4.21%, respectively. The magnitude of flood forecast error is related to the accuracy of the forecasted rainstorm. The more realistic the reconstructed rainstorm is, the smaller the forecast error will be. The hydrodynamic model does not further amplify the error caused by forecast rainstorm data. The maximum RE value of forecast area and depth are about 60 and 5%. The RE of the area is more sensitive to the accuracy of the forecasted rainstorm. This contrasts with Figure 9, which shows that the RE of simulated depth is smaller than the simulated area. This scene can be explained by the fact that once water volume reaches maximum storage in urban inundation areas, supernumerary water cannot be stored. It then overflows to increase the inundation area on the surface, but the depth will not change too much. As depression reaches the upper limit of storage, there is a minor change in water depth. Although the improvement of the reconstructed method had a certain uncertainty, the forecasting results could provide a valuable reference for flood control decisions with low error.
FIGURE 9
The RE of inundation area and depth simulation by using different input data.
A comparison of the raw inundation process forecasting and reconstructed forecasting shows that the reconstructed method has a positive impact on improving forecasting performance, but that the uncertainty of the forecasting system needs to be further examined to improve performance. The insufficient spatial and temporal resolution of the original forecast data is another factor that affects the forecast accuracy. Because of the flat terrain, the weather within the research area does not change significantly. Therefore, the forecast data with the mesoscale spatial and temporal resolution can be used in this area, but the intense rainstorm has the character of localized distribution. Forecasted rainstorm data with fine spatial and temporal resolution should be used whenever possible. The accuracy of flood forecasting heavily depends on the quality of the predicted rainstorm, therefore improving and optimizing the numerical weather prediction model is the primary and most direct means to improve the accuracy of flood inundation forecasting.
Conclusions
Through coupling the GRAPES_MESO numerical weather prediction model and the two-dimensional hydrodynamical flood model, this work proposes a high-resolution urban inundation forecasting system. The system was applied in the study area of Fengxi New Town (China). By analyzing these results, we can conclude the following:
The forecasting model improves the raw predicted rainstorm data by using the GRAPES_MESO numerical weather prediction model certain error, proposing a reconstructed method for correcting predicted rainstorm data based on the regression analysis method. This study verified that the reconstructed method can effectively reduce the uncertainty.
The forecasting model can accurately forecast the inundation points. The largest relative errors of the predicted inundation area and depth are 63.46 and 4.69%, respectively. The simulated evolution trend of area and depth is also in line with the actual situation, indicating the system has a good ability to predict the urban flood process.
It takes 5.09 h to simulate a 12 h flood event at 2 m resolution (5.37 million cells). Considering the long forecasting time of the rainstorm, this lead time suffices for guiding realistic urban flood management.
In summary, through assessing the performance of the proposed high-resolution flood forecasting system, the urban flood process in terms of inundation evolution can predict accurately and efficiently. This model has great potential for practical applications in urban flood prevention. However, the GRAPES_MESO model just provides free predicted rainstorm data with a spatial and temporal resolution of 10 km and 3 h, respectively. The weather data with coarse resolution remarkably influence the reliability of flood prediction. In future studies, we plan to develop down-scaling methods for the weather prediction model, in order to produce higher-resolution predicted rainstorm data.
Funding
This research was supported by the National Natural Science Foundation of China (Grant Nos 52079106 and 52009104), the Shaanxi International Science and Technology Cooperation and Exchange Program (Grant No. 2017KW-014), and the Shaanxi Water Science and Technology Program (Grant No. 2017slki-14).
Statements
Data availability statement
The raw data supporting the conclusions of this manuscript will be made available by the authors, without undue reservation, to any qualified researcher.
Author contributions
GC and JH contributed to analysis and manuscript preparation. NZ and SY performed the data analyses and wrote the manuscript. YT and FS helped perform the analysis through constructive discussions. LH and XB helped to conceive and design the paper.
Conflict of interest
Author FS was employed by the company Power China Northwest Engineering Corporation Limited. The remaining authors declare that the research was conducted in the absence of any commercial or financial relationships that could be construed as a potential conflict of interest.
References
1
ChenS.-H.LinY.-H.ChangL.-C.ChangF.-J. (2006). The strategy of building a flood forecast model by neuro-fuzzy network. Hydrol. Process.20, 1525–1540. 10.1002/hyp.5942.
2
CostabileP.CostanzoC.MacChioneF. (2012). Comparative analysis of overland flow models using finite volume schemes. J. Hydroinf.14, 122–135. 10.2166/hydro.2011.077.
3
EmanuelK. (2017). Assessing the present and future probability of Hurricane Harvey's rainfall. Proc. Natl. Acad. Sci. U.S.A.114, 12681–12684. 10.1073/pnas.1716222114.
4
EspositoG.MatanoF.ScepiG.TirantiD. (2018). Analysis of increasing flash flood frequency in the densely urbanized coastline of the campi flegrei volcanic area, Italy. Front. Earth Sci.6, 63. 10.3389/feart.2018.00063.
5
GaoE. P. (2014). Research on Manning coefficient of different vegetated slope (in Chinese). Beijing, China: Beijing Forestry Univ, 64.
6
HabibiH.DasguptaI.NohS.KimS.ZinkM.SeoD.-J.et al (2019). High-resolution hydrologic forecasting for very large urban areas. J. Hydroinf.21, 441–454. 10.2166/hydro.2019.100.
7
HouJ.GuoK.WangZ. L.JingH. X.LiD. L. (2017). Numerical simulation of design storm pattern effects on urban flood inundation (in chinese). Adv. Water Sci. Methodol.28, 820–828. 10.14042/j.cnki.32.1309.2017.06.003.
8
HouJ.SimonsF.MahgoubM.HinkelmannR. (2013). A robust well-balanced model on unstructured grids for shallow water flows with wetting and drying over complex topography. Comput. Methods Appl. Mech. Eng.257, 126–149. 10.1016/j.cma.2013.01.015.
9
HouJ.WangT.LiP.LiZ.ZhangX.ZhaoJ.et al (2018). An implicit friction source term treatment for overland flow simulation using shallow water flow model. J. Hydrol.564, 357–366. 10.1016/j.jhydrol.2018.07.027.
10
LeeS.NakagawaH.KawaikeK.ZhangH. (2016). Urban inundation simulation considering road network and building configurations. J. Flood Risk Manag. 9, 224–233. 10.1111/jfr3.12165
11
LiG. Y. (2007). Comparative study of soil infiltration under different land uses (in Chinese). Yangling, China: Northwest A&F Univ., 135.
12
LiJ.ChenY.WangH.QinJ.LiJ.ChiaoS. (2017). Extending flood forecasting lead time in a large watershed by coupling WRF QPF with a distributed hydrological model. Hydrol. Earth Syst. Sci.21, 1279–1294. 10.5194/hess-21-1279-2017.
13
LiuJ.ZhouH.LuC.GaoC.(2018). A review on recent advances of urban rainfall intensity-duration-frequency relationships (in chinese). Adv. Water Sci.29, 898–910. 10.14042/j.cnki.32.1309.2018.06.015
14
LiuL.PanS. L.BaiZ. X.XuY. P. (2019). Potential application of hydrological ensemble prediction in forecasting flood and its components over the Yarlung Zangbo River Basin, China. Hydrol. Earth Syst. Sci.23, 3335–3352. 10.5194/hess-23-3335-2019.
15
LongK.-J.ChenJ.MaX.-L.JiY. (2011). The preliminary study on ensemble prediction of GRAPES-meso based on ETKF. J. CHENGDU Univ. Y Inf. Technol.26, 276–284. 10.3969/j.issn.1671-1742.2011.01.008
16
LyuH.-M.ShenS.-L.YangJ.YinZ.-Y. (2019). Inundation analysis of metro systems with the storm water management model incorporated into a geographical information system: a case study in ShanghaiHydrol. Earth Syst. Sci23, 4293–4307. 10.5194/hess-23-4293-2019.
17
SeeL. (2019). A review of citizen science and crowdsourcing in applications of pluvial flooding. Front. Earth Sci.7, 1–7. 10.3389/feart.2019.00044.
18
SiccardiF.BoniG.FerrarisL.RudariR. (2005). A hydrometeorological approach for probabilistic flood forecast. J. Geophys. Res.110, D05101. 10.1029/2004JD005314.
19
SikderM. S.AhmadS.HossainF.GebregiorgisA. S.LeeH. (2019). Case study: rapid urban inundation forecasting technique based on quantitative precipitation forecast for Houston and Harris County flood control district. J. Hydrol. Eng.24, 1–13. 10.1061/(ASCE)HE.1943-5584.0001807.
20
SjögerstenS.AtkinC.ClarkeM. L.MooneyS. J.WuB.WestH. M. (2013). Responses to climate change and farming policies by rural communities in northern China: a report on field observation and farmers' perception in dryland north Shaanxi and Ningxia. Land Use Policy.32, 125–133. 10.1016/j.landusepol.2012.09.014.
21
TianJ.LiuJ.YanD.DingL.LiC. (2019). Ensemble flood forecasting based on a coupled atmospheric-hydrological modeling system with data assimilation. Atmos. Res.224, 127–137. 10.1016/j.atmosres.2019.03.029.
22
TianJ.LiuJ.YanD.LiC.ChuZ.YuF. (2017). An assimilation test of Doppler radar reflectivity and radial velocity from different height layers in improving the WRF rainfall forecasts. Atmos. Res.198, 132–144. 10.1016/j.atmosres.2017.08.004.
23
WuJ.LuG.WuZ. (2014). Flood forecasts based on multi-model ensemble precipitation forecasting using a coupled atmospheric-hydrological modeling system. Nat. Hazards.74, 325–340. 10.1007/s11069-014-1204-6.
24
WuX.WangZ.GuoS.LiaoW.ZengZ.ChenX. (2017). Scenario-based projections of future urban inundation within a coupled hydrodynamic model framework: a case study in Dongguan City, China. J. Hydrol.547, 428–442. 10.1016/j.jhydrol.2017.02.020.
25
XiaX.LiangQ.MingX.HouJ. (2017). An efficient and stable hydrodynamic model with novel source term discretization schemes for overland flow and flood simulations. Water Resour. Res.53, 3730–3759. 10.1002/2016WR020055.
26
YesubabuV.SrinivasC. V.LangodanS.HoteitI. (2016). Predicting extreme rainfall events over Jeddah, Saudi Arabia: impact of data assimilation with conventional and satellite observations. Q. J. R. Meteorol. Soc.142, 327–348. 10.1002/qj.2654.
27
ZhangM.WangH.ZhangX.PengY.CheH. (2018). Applying the WRF double-moment six-class microphysics scheme in the GRAPES_Meso model: a case study. J. Meteorol. Res.32, 246–264. 10.1007/s13351-018-7066-1.
Summary
Keywords
urban flood forecasting, hydrodynamic model, atmospheric model, inundation, graphic processing unit high-performance computation
Citation
Chen G, Hou J, Zhou N, Yang S, Tong Y, Su F, Huang L and Bi X (2020) High-Resolution Urban Flood Forecasting by Using a Coupled Atmospheric and Hydrodynamic Flood Models. Front. Earth Sci. 8:545612. doi: 10.3389/feart.2020.545612
Received
25 March 2020
Accepted
04 September 2020
Published
30 October 2020
Volume
8 - 2020
Edited by
Jorge Eduardo Teixeira Leandro, Technical University of Munich, Germany
Reviewed by
Giuseppe Aronica, University of Messina, Italy
Joao P. Leitao, Swiss Federal Institute of Aquatic Science and Technology, Switzerland
Updates
Copyright
© 2020 Chen, Hou, Zhou, Yang, Tong, Su, Huang and Bi.
This is an open-access article distributed under the terms of the Creative Commons Attribution License (CC BY). The use, distribution or reproduction in other forums is permitted, provided the original author(s) and the copyright owner(s) are credited and that the original publication in this journal is cited, in accordance with accepted academic practice. No use, distribution or reproduction is permitted which does not comply with these terms.
*Correspondence: Jingming Hou, Houjingming.hou@xaut.edu.cn
This article was submitted to Hydrosphere, a section of the journal Frontiers in Earth Science
Disclaimer
All claims expressed in this article are solely those of the authors and do not necessarily represent those of their affiliated organizations, or those of the publisher, the editors and the reviewers. Any product that may be evaluated in this article or claim that may be made by its manufacturer is not guaranteed or endorsed by the publisher.