 Lingli Fan1,2
 Huade Guan
 Wenju Cai
- 1College of Ocean and Meteorology, South China Sea Institute of Marine Meteorology, Guangdong Ocean University, Zhanjiang, China
- 2National Centre for Groundwater Research and Training, College of Science and Engineering, Flinders University, Bedford Park, SA, Australia
- 3Key Laboratory of Physical Oceanography/Institute for Advanced Ocean Studies, Ocean University of China and Qingdao National Laboratory for Marine Science and Technology, Qingdao, China
- 4Centre for Southern Hemisphere Oceans Research (CSHOR), CSIRO Oceans and Atmosphere, Hobart, SA, Australia
Precipitation teleconnections with large-scale ocean–atmosphere oscillation systems provide useful information for water management. Here, we present a 7-year lag response in South Australia (SA) precipitation to the Southern Annular Mode (SAM) in a positive Interdecadal Pacific Oscillation (IPO) phase. This teleconnection between a positive SAM phase and increased SA precipitation, and vice versa, statistically consists of three sequential steps: a 27-season lag positive correlation between sea subsurface potential temperature (SSPT) to the south of SA and SAM, a zero-season lag positive correlation between sea surface temperature (SST) and SSPT, and a 2-season positive lag correlation between SA precipitation and sea surface temperature. Physically, this teleconnection seems to be associated with a supergyre circulation of the southern hemisphere oceans, which transfers SAM signal via subsurface potential sea temperature in the central south Pacific to the south of SA in 27 seasons during the positive IPO phase. Practically, this teleconnection provides a 7-year-lead drought precursor for rain-fed agriculture planning in SA. However, the teleconnection disappears in negative IPO phases. The oceanic pathway via the supergyre suggested in this study provides a basis to predict when this 7-year teleconnection may resume in the future based on observation and/or modeling.
Introduction
Precipitation provides water on land to support ecosystem functions and societal development. Drought events, largely associated with precipitation interannual variability, can lead to ecosystem and societal disasters (McDowell et al., 2008; van DijK et al., 2013). Drought impacts on society primarily lie in the water supply and agriculture sectors (Stahl et al., 2016). A reliable prediction of regional rainfall beyond monthly time scale is thus beneficial for water resource management and agricultural planning. In some areas, such as Australia (www.forecasts4profit.com.au), seasonal rainfall prediction has been routinely communicated to farmers and agricultural business operators. Statistical relationships between precipitation of a region and large-scale climate oscillation systems, in addition to atmospheric modeling, provide useful information for drought and its impact predictions, particularly in agriculture (Bonner et al., 2014; Lu et al., 2017).
The relationships between large-scale climate drivers and precipitation in different parts of the world have been investigated in numerous studies. While coupled ocean–atmosphere oscillation systems have been shown useful for precipitation prediction, the reported lag structure varies for different climate indices and between regions (Figure 1). Most of the reported lags are within a couple of months (Thompson and Wallace, 2000; Saji and Yamagata, 2003; Polonsky et al., 2004; Trigo et al., 2004; Li and Wang, 2005; Hu and Feng, 2010; Kenyon and Hegerl, 2010; Chen and Chung, 2015; He et al., 2017; Tabari and Willems, 2018). Some teleconnections have a lag extending to over 6 months (Kakade and Dugam, 2000; Mistry and Conway, 2003; Saji and Yamagata, 2003; Li and Wang, 2005; Fang et al., 2014; Chen and Chung, 2015; He et al., 2017). In one case, precipitation response lags a climate oscillation system by about 15 years (Sun et al., 2015).
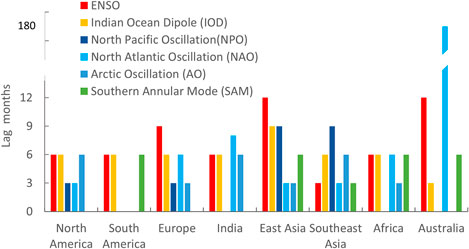
FIGURE 1. Reported maximum lag (months) response of precipitation to large-scale climate oscillation systems for selected regions based on published studies referenced in the text.
As the driest inhabited continent, Australia has a high hydroclimatic variability (Peel et al., 2001). Rainfall variability poses a big challenge to water resource management and agricultural production (van DijK et al., 2013; Jarvis et al., 2018; Parton et al., 2019), and flood risk management (Liu et al., 2018). Many studies have been carried out to understand rainfall variability in Australia (Nicholls, 1989; Chiew et al., 1998; Saji and Yamagata, 2003; Meehl et al., 2010). El Niño–Southern Oscillation (ENSO) (McBride and Nicholls, 1983; Power et al., 1999; Wang and Hendon, 2007), Indian Ocean Dipole (IOD) (Ashok et al., 2003; Acworth et al., 2016), Interdecadal Pacific Oscillation (IPO) (Verdon and Franks, 2006), Southern Annular Mode (SAM) (Thompson et al., 2000; Hendon et al., 2007; Meneghini et al., 2007; Lim et al., 2016), subtropical ridge (STR) (Drosdowsky, 2005; Timbal and Drosdowsky, 2012), and a combination of them (Ihara et al., 2007; Meyers et al., 2007; Murphy and Timbal, 2008; Pezza et al., 2008; Kirono et al., 2010; Pohl et al., 2010; Cai et al., 2012; Schepen et al., 2012) are documented as having an influence on precipitation in Australia. Generally speaking, ENSO influences precipitation with La Niña (El Niño) associated with a wetter (drier) than normal condition in eastern and northeast Australia (Dey et al., 2019). IOD influences western and southern Australia with negative IOD connected to a wetter than normal condition (Risbey et al., 2009). The influence of SAM varies among season, with positive SAM connected to wetter spring and autumn in Australia, but dryer winter in the western and southeastern coasts (Ho et al., 2012). On interdecadal scales, positive (negative) IPO leads to dryer (wetter) monsoon in northern Australia (Dey et al., 2019).
In South Australia (SA), current skill to predict seasonal and longer time interval rainfall is low, which, however, are critical for the agriculture and water resources management (Drosdowsky, 1993; Risbey et al., 2009; Tozer et al., 2017). Part of this low prediction skill is likely associated with the fact that not all relevant climate indices are considered with an appropriate lag structure (He and Guan, 2013). Most of the teleconnection studies only consider SA rainfall lag responses over a few months—SAM (2–6 months), IOD (3–6 months), and ENSO (3–12 months) (Simmonds and Hope, 1997; Kiem and Franks, 2004; Pezza et al., 2008; Evans et al., 2009; Ummenhofer et al., 2009; Williams and Stone, 2009; He and Guan, 2013; Montazerolghaem et al., 2016; Tozer et al., 2017). These short-lag teleconnections are associated with dynamic ocean–atmosphere interactions and thus more variable and less predictable.
Thus, it is useful to explore teleconnections with lags beyond a year, which can be connected to the so-called “ocean tunnel” (Liu and Alexander, 2007). Should such a teleconnection path exist, it can be less dynamic and more reliable for prediction. Indeed, a recent study reports that subtropical eastern Australian rainfall is likely connected to the North Atlantic Oscillation, with a lag of 15 years (Sun et al., 2015). In the southern hemisphere oceans exists a supergyre that connects subsurface southern Pacific Ocean and southern Indian Ocean (Ridgway and Dunn, 2007). South Australia sits to the north along the path of this supergyre. If the thermal dynamic conditions carried by this supergyre become explicit on sea surface, they may influence precipitation in South Australia. Thus, there is a possibility to find a long-lag teleconnection for precipitation in South Australia.
In South Australia, rain-fed agriculture is confined to a narrow band in the coast bounded on the north by the so-called Goyder’s line (Nidumolu et al., 2012). Goyder’s line is a historic rainfall marker in South Australia indicating the margin between reliable cropping environments and those only suited to grazing. It was first drawn by the then Surveyor-General of the colony in 1865, linked with a major drought that occurred in this region during 1864–1865. This line is drawn from Ceduna in the west, across to Spencer Gulf, north to Orroroo, then south and east across the Victorian border at Pinnaroo. It was recently suggested that this line would be better drawn along the growing-season rainfall-to-potential evaporation ratio of 0.26. With projected climate change, this line will very likely move southward, reducing the rain-fed cropping area in South Australia (Nidumolu et al., 2012).
The SAM, a leading mode of variability in the southern hemisphere extratropical circulation, has not been reported with a short-lead predicting skill for precipitation in this region (Risbey et al., 2009; He et al., 2014). Given that the SAM reflects oscillation of a coupled ocean–atmosphere system to the south of 20°S, it is possible to be associated with the above-mentioned supergyre and thus has potential to be a long-lead predictor for precipitation in South Australia, particularly for the agriculture area to the south of Goyder’s line. In this study, we examine the possibility of a long-lag SA precipitation teleconnection with SAM. The objectives are to answer the following questions: 1) Does SA precipitation teleconnect with SAM with a long lag? 2) If so, what is the possible underlying mechanism? 3) Is this long-lag teleconnection useful in precipitation and drought prediction for agricultural planning?
Methodology
Data
The datasets employed in this study include climate indices [SAM, ENSO, IPO, and related Pacific Decadal Oscillation (PDO)], sea surface temperature (SST), subsurface sea potential temperature (SSPT), atmospheric variables, and station-based precipitation data in Australia. The details are given in the following.
Three SAM indices were selected for this present study. They are reanalysis data–based NOAA monthly AAO index (1979–2017) and monthly SAM index (1851–2011), and station data–based Marshall index (1957–2017). The NOAA AAO index, calculated based on 700 hPa geopotential height anomaly poleward of 20°S (Ho et al., 2012), is available at https://www.cpc.ncep.noaa.gov/products/precip/CWlink/daily_ao_index/aao/monthly.aao.index.b79.current.ascii.table. The NOAA SAM index, calculated based on the difference of normalized zonal mean sea level pressure at 40°S and 65°S (Gong and Wang, 1999), was obtained from https://www.esrl.noaa.gov/psd/data/correlation/sam.20crv2c.short.data. The Marshall SAM index, also constructed based on the definition in Gong and Wang (1999) but using station data, is available at https://legacy.bas.ac.uk/met/gjma/sam.html. A minor positive trend observed in the Marshall SAM index has been removed for this study. The NOAA AAO index was applied for analyses on data after 1979, and the two SAM indices were adopted for those with data prior to 1979. The monthly Interdecadal Pacific Oscillation (IPO) tripole index from 1854 to present was obtained from NOAA (https://www.esrl.noaa.gov/psd/) (Henley et al., 2015). The monthly Pacific Decadal Oscillation (PDO) index from 1900 to present was obtained from NOAA (https://psl.noaa.gov/gcos_wgsp/Timeseries/Data/pdo.long.data) (Henley et al., 2015). The monthly Niño-3.4 index from 1950 to present was obtained from NOAA (https://origin.cpc.ncep.noaa.gov/products/analysis_monitoring/ensostuff/ONI_v5.php) (Trenberth, 1997). Monthly precipitation records of 325 meteorological stations were obtained from Australian Bureau of Meteorology, http://www.bom.gov.au/climate/data/), including 33 sites in SA.
The monthly COBE SST (Centennial in situ Observation–Based Estimates of the variability of SST) data were obtained from NOAA (https://www.esrl.noaa.gov/psd/). The COBE data are available from 1891 to present, gridded on a 1.0 × 1.0 mesh (Ishii et al., 2005). Monthly data of reanalysis potential temperature in subsurface were obtained from the ECMWF (European Centre for Medium-Range Weather Forecasts, http://www.ecmwf.int/products/) Ocean Reanalysis System 4 (ORAS4), from January 1959 to present. The data are gridded on a 1.0 × 1.0 mesh (Balmaseda et al., 2013).
Data Analyses
The relationships between pairs of variables are examined by correlation analysis. The statistical significance of these analyses is assessed using the two-tailed Student’s t test. For relationships critical to this study, that is, the one between South Australia precipitation and SAM, the statistical significance is evaluated with the t test statistic considering the effect of autocorrelation in time series (Hamed and Rao, 1998; He and Guan, 2013). It is determined by
where Neff is the effective sample size taking into account the effect of autocorrelation in the time series. The effective sample size Neff is estimated by
where N is the sample size and r1 and r2 are the lag-one autocorrelations of the two time series.
Correlation analysis of anomaly time series is performed between precipitation and SAM indices, between SSPT and AAO index, between SST and SSPT, and between precipitation and SST, with various time lags. These analyses are based on monthly and seasonal anomaly time series. Monthly data obtained from different sources are summed (for precipitation) or averaged (for SST, SSPT, SAM, and AAO) into seasonal time series. The seasons in the study area are defined as spring (September–November), summer (December–February), autumn (March–May), and winter (June–August). Moving average is applied to investigate patterns in variables and relationships between variables at longer time intervals.
It is reported that SAM and ENSO are strongly correlated (Fogt and Bromwich, 2006; Pohl et al., 2010; Lim et al., 2013; Datwyler et al., 2020). Thus, possible ENSO effects on precipitation should be removed when the association between SAM and precipitation is examined. Partial correlation between precipitation and SAM against ENSO is applied to address this issue (Guan et al., 2010). Precipitation teleconnection with a climatic index is often nonsymmetric between the two extreme phases (Power et al., 2006; Ummenhofer et al., 2009; Cai et al., 2011; King et al., 2013). In this study, composite analysis is applied to detect the difference in atmospheric conditions (i.e., water vapor flux and divergence, and atmospheric convective instability) at a certain lag corresponding to positive and negative SAM phases.
Results and Discussion
Correlation Analysis of South Australia Precipitation Anomaly and Southern Annular Mode
A statistically significant 29-season lag correlation between SA precipitation and AAO is found. Figure 2A shows the 29-season lag correlation coefficients of seasonal precipitation anomalies with the AAO index, for 325 Australia sites, including 33 SA sites (Supplementary Table S1). For SA sites, common maximum correlations occur at a lag of 29 seasons. The correlation coefficients are statistically significant at a confidence level of 95% or above for 17 sites (solid dots in Figure 2A, listed in Supplementary Table S1). Distribution of these 17 sites is spatially coherent. They are mostly located in the south close to the coast of South Australia. The other 16 sites, without such a lag correlation, distribute inland in the north. Such a spatial coherence pattern is common in correlation between spatial distributed precipitation and a large-scale climate driver.
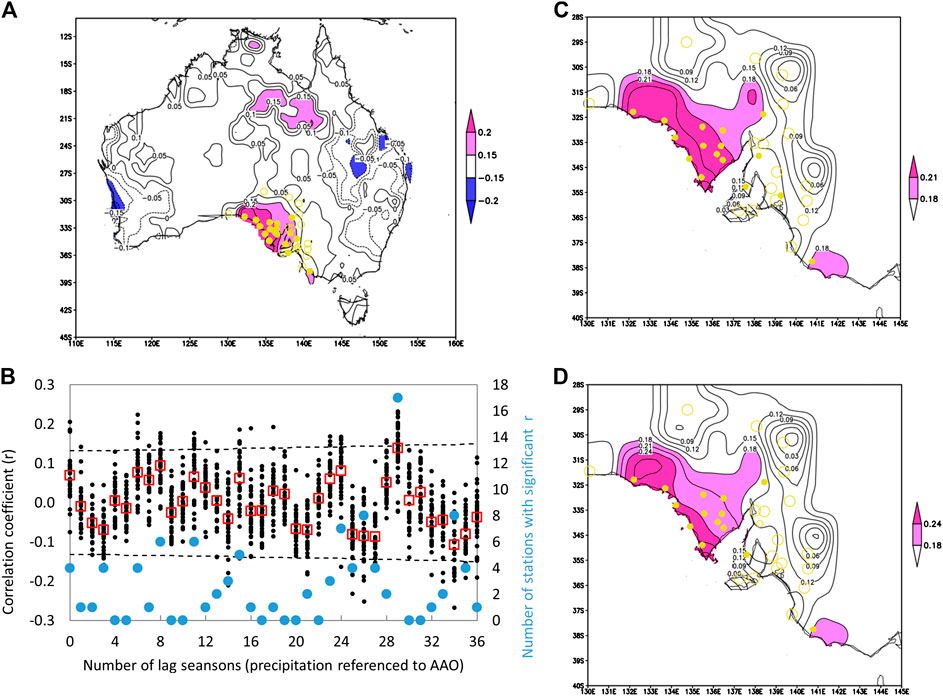
FIGURE 2. Lag correlation coefficients between seasonal (MAM, JJA, SON, and DJF) precipitation anomalies and the AAO index over the period of 12/1978–11/2017: (A) for 325 stations in Australia at a 29-season lag and (B) for 33 SA stations with various lags. And partial correlation coefficients between seasonal precipitation at a 29-season lag with the AAO index: (C) independent of Niño-3.4 in pace with AAO and (D) independent of Nino 3.4 in pace with precipitation. The shaded areas in (A), (C), and (D) and dash lines in (B) indicate statistically significance exceeding the 95% level. Yellow dots in (A), (C), and (D) represent the sites for which correlation coefficients are statistically significant above the 95% confidence level. The red squares in (B) are the 33-site average correlation coefficients at various lags, and blue solid symbols show the number of stations with significant lag correlations.
The lag correlation between seasonal precipitation and seasonal AAO index is examined over a wide range of time lags, varying from zero season to 36 seasons (Figure 2B). The 29-season lag correlation clearly stands out, with 17 stations with significant lag correlation. At some other time lags (e.g., 8, 11, 24, 26, and 34 seasons), significant correlation exists for six to eight stations. It can be explained by internal cycles in the AAO index (Supplementary Figure S1). The result that a much smaller number of stations with significant correlation with the AAO index at these lags than the 29-season lag suggests that the 29-season lag correlation is the primary one and more likely to have a physical basis.
To make sure that this apparent lag correlation between precipitation and SAM is not an artifact from a possible correlation of precipitation and ENSO, partial correlation has been done for precipitation and SAM at a 29-season lag independent of ENSO (represented by Nino-3.4), for two time offsets for ENSO, 0 season with SAM (Figure 2C), and 0 season with precipitation (Figure 2D). Similar spatial patterns of 29-season lag correlation with SAM, to the original analysis shown in Figure 2A, are revealed.
Most of the 17 sites with significant 29-season lag correlation with AAO index are located to the south of Goyder’s line, making them an important precipitation prediction target for agriculture planning. The average rainfall anomaly of these 17 sites is thus used as the South Australia SAM sensitive seasonal precipitation anomaly (hereafter referred to as SAP) for further analysis. The correlation coefficient of the concurrent NOAA SAM index with the SAP time series during 1957–2017 is insignificant, which is consistent with previous studies (Risbey et al., 2009; Ho et al., 2012). However, at a 29-season lag, the two time-series are correlated with a correlation coefficient of 0.147, which is significant above the 98% confidence level.
To examine how robust this lag correlation varies over time, the 29-season lag SAP-SAM correlation is calculated with a 45-season moving window, based on two selected SAM indices. The size of the moving window is chosen to see if this lag correlation persists across decades. The result indicates that the significant lag correlation started around 1984, lasting for about 15 years (Figure 3, referenced to the SAM time). This time window is coincident with a positive IPO (or PDO) (1979–1998) (Salinger et al., 2001; Dong and Dai, 2015; Henley et al., 2015), offset by a half-length of the moving window (∼5 years) (Figure 3). Beyond this time period, no significant 29-season lag correlation exists between SAP and SAM. Within the positive IPO phase, the lag correlation coefficients fluctuate below the significant threshold in some occasions, which is likely associated with the small moving window size and disturbance from other factors (e.g., ENSO and IOD). This result suggests that the 29-season lag SAP–SAM relationship has a decadal variability, in rhythm with IPO, with the significant correlation occurring only in positive IPO.
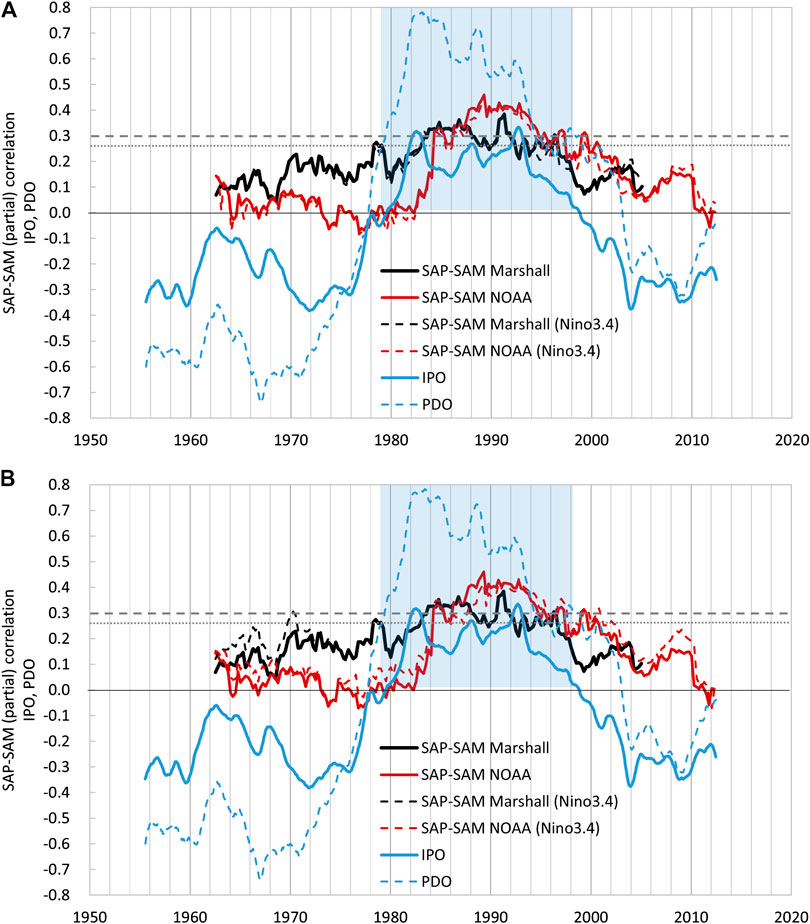
FIGURE 3. Moving 45-season window 29-season lag correlation between SAP and SAM, and lag partial correlation between them in dependent of Niño-3.4 in pace with SAM (A) and in pace with SAP (B) (black and red lines, the correlation is shown at the centered season of the 45-season window, referenced to SAM time), compared with the 11-year moving average of IPO and PDO index (blue lines). The dash lines mark the threshold of significant SAP and SAM lag partial correlation at 95% and 90% confidence levels. The light blue–shaded area marks the duration of the positive IPO (PDO) phase.
Correlation Analyses between Southern Annular Mode, Sea Temperatures, and South Australia Precipitation
If the 29-season lag correlation between SAP and AAO indices has a physical basis, it must be related to ocean processes. Analysis of the relationship between Southern Ocean temperature variations and the AAO index may provide evidence. Given that the lag correlation occurs roughly coincident with a positive IPO phase, this analysis is confined to 1979–1998. A 27-season lag correlation between subsurface sea potential temperature (averaged over the top 1,000 m) near South Australia and the AAO index is found (Figure 4A).
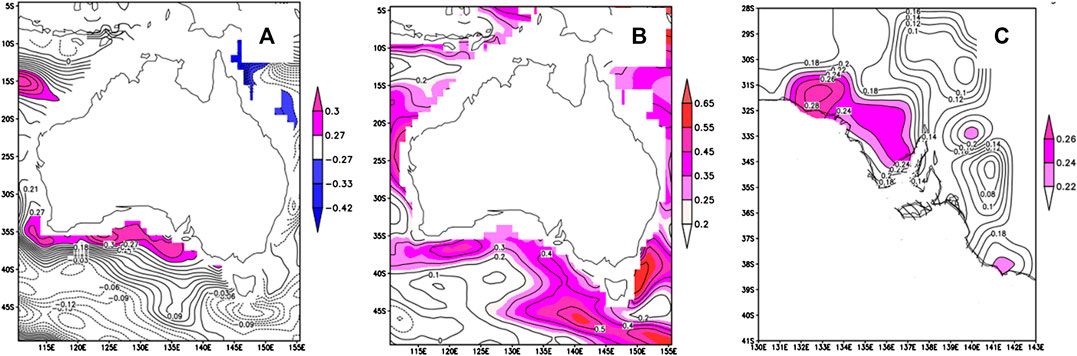
FIGURE 4. Correlation coefficients during a positive IPO phase (1979–1998) of (A) seasonal SSPT anomalies with AAO index at a 27-season lag, (B) same-grid seasonal SST with SSPT anomalies at a zero-season lag, (C) season precipitation anomaly with SST anomaly index in the Southern Ocean offshore South Australia (120–140°E, 40–35°S) at a 2-season lag. The shaded areas indicate statistically significance exceeding the 95% confidence level.
In addition, there is an outstanding zero-season lag correlation between SST and SSPT anomalies over the same area where the 27-season SSPT lag correlation with the AAO index appears (Figure 4B). The SST anomaly of this area (120–140°E, 40–35°S) is found to have a two-season lead correlation with precipitation in the coastal area of South Australia (Figure 4C). The spatial pattern of this lag correlation is in general consistent with that for the 29-season lag correlation between precipitation and the AAO index (Figure 2A).
It seems that the 29-season lag SAP correlation with the NOAA AAO index is associated with 1) a 27-season lag correlation of SSPT off coast of South Australia and AAO, 2) a zero-season lag correlation of SST and SSPT, and 3) a two-season lag correlation between SAP and SST to the south of South Australia. These coherent statistical correlations support a physical causal relationship between SAM and SAP. In other words, a 29-season lag SAP teleconnection with SAM very likely occurred during the positive IPO phase (1979–1998).
It would be ideal to test this possible teleconnection using coupled climate models. However, it is difficult to do so because current coupled climate models often do not reproduce observed teleconnection patterns, even for a short time range teleconnection with ENSO (Dieppois et al., 2015). Here, we choose to investigate a possible oceanic pathway via sea water temperature propagation using a statistical analysis, detailed in the next section.
Possible Oceanic Pathway for the 7-Year Lag Teleconnection
If what we deduced from Figure 4 in the previous section is correct, it suggests that SAM takes 27 seasons to influence SST to the south of South Australia. How does the SAM signal propagate in 27 seasons to arrive offshore South Australia? To answer this question, we calculate correlation coefficients between the SSPT (averaged over top 1,000 m) anomaly and the AAO index for the Southern Hemisphere Oceans for the period 1978–1998, with lags ranging from zero season to 29 seasons (Figure 5). At a 10-season (or 2.5 years) lag, significant SSPT correlation with the AAO index emerges around 25°S and 140°W. The significant correlation area propagates westward, with the front arriving at the northeastern coast of Australia (at 20-season lag) in about 2.5 years. After that, the signal turns southward along the eastern coast. In about one year, the signal passes south of Tasmania (at 24-season lag) and turns west toward the South Australian coast. It finally arrives at the sea to the south of South Australia (at 27-season lag) in about three seasons. The whole path takes about 27 seasons since an SAM episode.
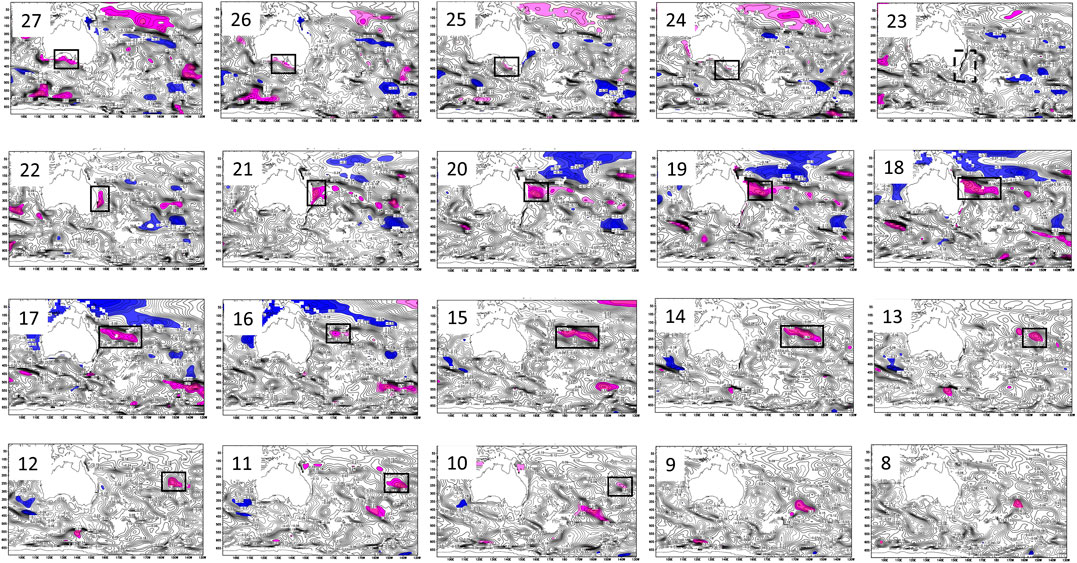
FIGURE 5. Spatially coherent locations (marked by black rectangles) of significant correlation between subsurface sea potential temperature (SSPT, average of 0–1,000 m depths) with SAM at different lag seasons (numbers in the figure) in a positive IPO phase (1979–1998), showing the track of SAM signal propagation through SSPT starting at 25°S 140°W with a 10-season lag referenced to SAM, arriving at the eastern coast of Australia at a 18-season lag, moving southerly along the coast, emerging in coastal waters to the south of Australia at a 24-season lag, and reaching offshore South Australia at a 27-season lag (Figure 4A). The colors indicate statistically significant correlation (red for positive and blue for negative) at the 95% confidence level.
This AAO signal propagation trajectory via SSPT is in a good match with a strong southern hemisphere oceanic supergyre that links the subtropical gyres of the Pacific and Indian oceans (Wang et al., 2014)—a strong East Australia Current passing through the Tasman Sea with a Tasman leakage from the southern Pacific Ocean to the southern Indian Ocean (Ridgway and Dunn, 2007). At the surface level, the Pacific and Indian oceans are connected via the Indonesian Throughflow. In subsurface, the two oceans are connected via the supergyre (Ridgway and Dunn, 2007). Previous studies have shown that AAO is connected to the supergyre. In positive AAO episodes, a poleward intensification of the supergyre occurs as a result of the poleward shift of the westerlies (Wang and Cai, 2013). Thus, it is very likely that the AAO-associated southern hemisphere oceanic supergyre provides an “ocean tunnel,” substantiating the 7-year (approximation of 29 seasons) lag teleconnection for precipitation in South Australia.
However, in a negative IPO phase, such an AAO signal propagation via SSPT from the southern Pacific Ocean to Indian Ocean is not found (Supplementary Figure S2). It is likely that under negative IPO condition, AAO and the Southern Ocean’s supergyre becomes decoupled, or that the depth-varying pattern of the supergyre differs from that in a positive IPO phase. As a result, the 7-year lag correlation between SAP and SAM disappears (Figure 3). In other words, the 7-year lag teleconnection holds for a positive IPO phase but breaks down for a negative IOP. Periodic breakdown or weakening of teleconnections is common for other oscillations (e.g., Ashcroft et al., 2016; Zhu, 2018).
Wet-Season Rendering of the Teleconnection
Given the importance of wet season precipitation to natural ecosystems (Xu et al., 2019) and agriculture in South Australia, it is crucial to know how this teleconnection may impact wet season (winter in South Australia) precipitation processes. Composite analysis is conducted to examine the anomaly of atmospheric circulation over SA winters. First, four positive and five negative AAO autumns are identified during the positive IOP phase (1979–1998), based on 3-month moving average AAO time series (Supplementary Figure S3). At a 29-season lag referenced to these AAO autumns, the corresponding winters in South Australia are identified. They are 1986, 1989, 1996, and 2005 and 1987, 1988, 1993, 1997, and 1999, respectively.
Composite differences of winter circulation and water vapor over Australia are shown in Figure 6A. At 850 hPa, there is a cyclonic anomaly over SA, combined with a water vapor sink anomaly. The difference of water vapor flux divergence is -2 · 10–7 g cm−2 hPa−1 s−1, statistically significant above the 95% confidence level (Figure 6A). Similar composite analysis is conducted for convective instability (Figure 6B). It is shown that, although not statistically significant, the convective instability in the coastal SA increases (by 0.6 · 10–3 K hPa−1) in winters with a 29-season lag from negative SAM to those corresponding to positive SAM.
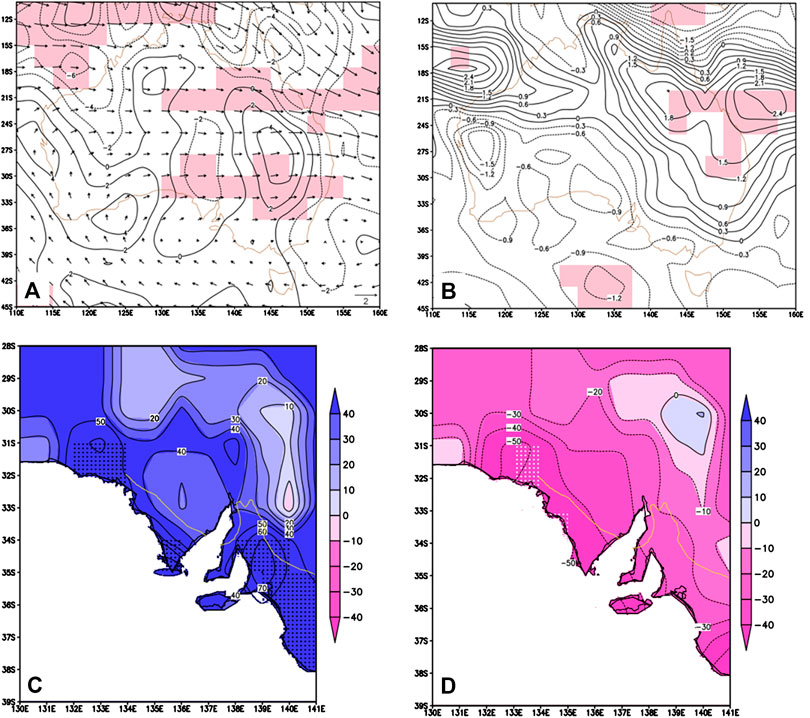
FIGURE 6. Composite differences of average austral winter (JJA) at a 29-season lag from positive and negative SAM autumns during a positive IPO phase: (A) 850 hPa atmospheric water vapor flux (vectors, in g cm−1 hPa−1 s−1) and its divergence (contours in 10−7 g cm−2 hPa−1 s−1), and (B) 700-hPa convective instability (−∂θe/∂p) (contours in 0.3 × 10⁻³ K hPa−1). The shaded areas represent statistically significant above the 95% confidence level. And average winter precipitation anomaly (mm, referenced to the period of 1979–2017) at a 29-season lag from four positive SAM autumns (C), and five negative SAM autumns (D). The abnormal positive AAO autumns occurred in 1979, 1982, 1989, and 1998, and negative AAO autumns in 1980, 1981, 1986, 1990, and 1992 (Figure 3A). The anomaly is statistically significant above the 95% confidence level for the dotted areas. The yellow line in (C) and (D) is Goyder’s line, approximating the northern boundary of rain-fed agriculture in South Australia.
These composite analysis results support that the 7-year teleconnection causes an observable difference in mean winter atmospheric conditions in the coastal area of South Australia. And this difference does translate to winter precipitation (Figures 6C,D). For SAM-teleconnected wet winters, the seasonal precipitation south of Goyder’s line has a positive anomaly ranging from 50 to 90 mm (about 30% of winter precipitation) and is mostly statistically significant. For SAM-teleconnected dry winters, the seasonal precipitation south of Goyder’s line has a negative anomaly ranging from 20 to 50 mm (about 15% of winter precipitation). Such a 7-year lead prediction would provide useful information for farmers and other agricultural operators. This is particularly important for low-rainfall farming communities on the edge of Goyder’s line which will very likely move southward in the near future.
A 7-Year-Lead Drought Precursor for South Australia
The oceanic pathway (Possible Oceanic Pathway for the 7-Year Lag Teleconnection) very likely smooths the SAM signal beyond the seasonal time interval. Additional analysis has been done to examine the connection between SAM and annual precipitation at longer time intervals. It is found that during a positive IPO phase, two lows of 19-month moving average of the SAM and AAO indices precede by 29-season two occurrences of reduced annual precipitation (represented by 13-month moving average) at a selected site (Coulta in Eyre Peninsula, Supplementary Table S1) (Figure 7B).
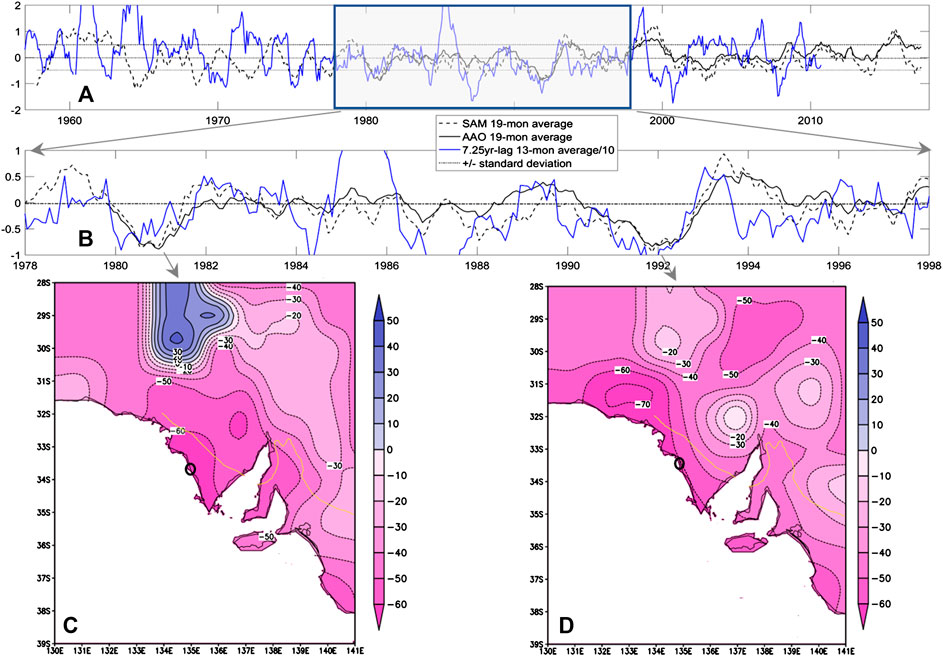
FIGURE 7. Nineteen-month moving average of SAM (detrended) and AAO monthly indexes and 7.25-year lag 13-month moving average precipitation (unit: 10 mm) at Coulta, South Australia (black circle on the maps) for (A) 1957–2018 and (B) 1978–1998 (positive IPO). And the distribution of precipitation anomaly (unit: percentage of the mean of 1948–2017) for two selected drought years in the coastal area of South Australia (C) June 1987–May 1988 and (D) June 1998–May 1999, preceded around 7 years by SAM and AAO low 19-month moving averages. The year numbers in (a) and (b) mark the start of the years for SAM and AAO, with precipitation time shifted by 7.25 years. The yellow line in (C) and (D) is Goyder’s line, approximating the northern boundary of rain-fed agriculture in South Australia.
During the positive IPO phase, there are two such significant negative 1.5-year SAM episodes (Figure 7A), and both successfully predict droughts in the coastal area of South Australia with a 7.25-year lead (Figures 7C,D). For the drought predicted for June 1987–May 1988, at least 50% precipitation reduction occurs south of Goyder’s line, and for that in June 1998–May 1999, precipitation south of Goyder’s line reduces by at least 40%.
However, of five negative 1.5-year SAM episodes identified in negative IPO phases (Figure 7A), only one (1976) is coincident with a drought in Coulta at a 7.25-year lag. This contrast between positive and negative IPO, in the reliability of using 1.5-year moving average AAO as a 7-year lead drought precursor for rain-fed agriculture in South Australia, is consistent with decadal variation of the oceanic pathway (Possible Oceanic Pathway for the 7-Year Lag Teleconnection).
Conclusions
This study documents a possible 7-year lag teleconnection for precipitation in South Australia, particularly in its rain-fed agriculture region, during a positive IOP phase. This teleconnection is composed of three sequential steps: a 27-season lag positive connection between sea subsurface potential temperature (SSPT) off coast of SA and SAM, a zero-season lag positive connection between SST and SSPT, and a 2-season lag positive connection between precipitation in SA and SST.
The 29-season lag response between South Australia precipitation and SAM is likely related to an oceanic supergyre in the southern hemisphere oceans. It takes 27 seasons for the impact of SAM episodes to emerge in sea temperatures to the south of South Australia. The subsequent influences on the atmospheric conditions likely take about two seasons.
This teleconnection may provide valuable lead information for water resource management and agriculture planning for South Australia. It is found that during a positive IPO phase, a positive SAM autumn tends to be associated with a wet winter 7 year later, and vice versa, south of Goyder’s Line in South Australia. A negative 1.5-year moving average SAM can be used as a drought precursor for rain-fed agriculture in South Australia with a 7-year lead time. This relationship successfully hindcasts two drought events with about 50% annual precipitation reduction to the south of Goyder’s Line.
However, these conclusions are drawn primarily based on data of 1979–2017, which includes only one positive IPO phase. Nevertheless, the oceanic pathway via the supergyre suggested in this study provides a basis to predict when this 7-year teleconnection may resume in the future based on observation and/or modeling.
Data Availability Statement
Publicly available datasets were analyzed in this study. Links to the data can be found in the Supplementary Material.
Author Contributions
LF: conducted most of the data analysis, found the atmospheric and oceanic evidence to explain the 7-year lag teleconnection, and wrote part of this manuscript. HG: shaped the research idea, coordinated the study, performed part of data analysis, and wrote part of the manuscript. WC: provided advice in data analyses to substantiate the 7-year lag teleconnection, which has led to the important findings in this paper (e.g., IPO-phase dependence, ocean pathway), and wrote part of the manuscript. CR and HG: found the 7-year lag correlation between rainfall and SAM index. JX: provided advice in data analyses to substantiate the 7-year lag teleconnection, edited the manuscript.
Conflict of Interest
The authors declare that the research was conducted in the absence of any commercial or financial relationships that could be construed as a potential conflict of interest.
Acknowledgments
This study was partly funded by the National Key Research and Development Program of China NO 2018YFC1506002 and NO 2018YFA0605604. Early development of the research idea was benefited from the National Centre for Groundwater Research and Training (Australia) SR08000001. WC was supported by the Centre for Southern Hemisphere Oceans Research, a joint research center between QNLM and CSIRO. Craig T. Simmons, Jochen Kaempf, and Matthias Tomczak (deceased) from Flinders University joined discussion at the early stage of this work. Two reviewers and Editor Stahl’s constructive comments improved this manuscript. All data used in this paper are available in the relevant organizations described in the data section.
Supplementary Material
The Supplementary Material for this article can be found online at: https://www.frontiersin.org/articles/10.3389/feart.2020.553506/full#supplementary-material
References
Acworth, R. I., Rau, G. C., Cuthbert, M. O., Jensen, E., and Leggett, K. (2016). Long-term spatio-temporal precipitation variability in arid-zone Australia and implications for groundwater recharge. Hydrogeol. J. 24 (4), 905–921. doi:10.1007/s10040-015-1358-7
Ashcroft, L., Gergis, J., and Karoly, D. J. (2016). Long-term stationarity of el Nino-southern oscillation teleconnections in southeastern Australia. Clim. Dynam. 46 (9-10), 2991–3006. doi:10.1007/s00382-015-2746-3
Ashok, K., Guan, Z. Y., and Yamagata, T. (2003). Influence of the Indian Ocean Dipole on the Australian winter rainfall. Geophys. Res. Lett. 30 (15), 1821. doi:10.1029/2003gl017926
Balmaseda, M. A., Trenberth, K. E., and Källén, E. (2013). Distinctive climate signals in reanalysis of global ocean heat content. Geophys. Res. Lett. 40 (9), 1754–1759. doi:10.1002/grl.50382
Bonner, S. J., Newlands, N. K., and Heckman, N. E. (2014). Modeling regional impacts of climate teleconnections using functional data analysis. Environ. Ecol. Stat. 21 (1), 1–26. doi:10.1007/s10651-013-0241-8
Cai, W., Sullivan, A., and Cowan, T. (2011). Interactions of ENSO, the IOD, and the SAM in CMIP3 models. J. Clim. 24 (6): 1688–1704. doi:10.1175/2010jcli3744.1
Cai, W., van Rensch, P., Cowan, T., and Hendon, H. H. (2012). An asymmetry in the IOD and ENSO teleconnection pathway and its impact on Australian climate. J. Clim. 25 (18), 6318–6329. doi:10.1175/jcli-d-11-00501.1
Chen, J., and Chung, C. (2015). Representation of global precipitation anomalies using four major climate patterns. Sci. China Technol. Sci. 58 (5), 927–934. doi:10.1007/s11431-015-5799-y
Chiew, F. H. A., Piechota, T. C., Dracup, J. A., and McMahon, T. A. (1998). El Nino southern oscillation and Australian rainfall, streamflow and drought: links and potential for forecasting. J. Hydrol. 204 (1-4), 138–149. doi:10.1016/s0022-1694(97)00121-2
Dätwyler, C., Grosjean, M., Steiger, N. J., and Neukom, R. (2020). Teleconnections and relationship between the El Niño-southern oscillation (ENSO) and the southern annular mode (SAM) in reconstructions and models over the past millennium. Clim. Past 16 (2), 743–756. doi:10.5194/cp-16-743-2020
Dey, R., Lewis, S. C., Arblaster, J. M., and Abram, N. J. (2019). A review of past and projected changes in Australia's rainfall. Wiley Interdiscip. Rev.-Clim. Chang. 10 (3), 23. doi:10.1002/wcc.577
Dieppois, B., Rouault, M., and New, M. (2015). The impact of ENSO on Southern African rainfall in CMIP5 ocean atmosphere coupled climate models. Clim. Dynam. 45 (9-10), 2425–2442. doi:10.1007/s00382-015-2480-x
Dong, B., and Dai, A. G. (2015). The influence of the interdecadal Pacific oscillation on temperature and precipitation over the globe. Clim. Dynam. 45 (9-10), 2667–2681. doi:10.1007/s00382-015-2500-x
Drosdowsky, W. (1993). An analysis of Australian seasonal rainfall anomalies: 1950-1987. II: temporal variability and teleconnection patterns. Int. J. Climatol. 13 (2), 111–149. doi:10.1002/joc.3370130202
Drosdowsky, W. (2005). The latitude of the subtropical ridge over Eastern Australia: the L index revisited. Int. J. Climatol. 25 (10), 1291–1299. doi:10.1002/joc.1196
Evans, A. D., Bennett, J. M., and Ewenz, C. M. (2009). South Australian rainfall variability and climate extremes. Clim. Dynam. 33 (4), 477–493. doi:10.1007/s00382-008-0461-z
Fang, K. Y., Chen, F., Sen, A. K., Davi, N., Huang, W., Li, J., et al. (2014). Hydroclimate variations in central and monsoonal asia over the past 700 years. PLoS One 9 (8), e102751. doi:10.1371/journal.pone.0102751
Fogt, R. L., and Bromwich, D. H. (2006). Decadal variability of the ENSO teleconnection to the high-latitude south Pacific governed by coupling with the southern annular mode. J. Clim. 19 (6), 979–997. doi:10.1175/jcli3671.1
Gong, D., and Wang, S. (1999). Definition of antarctic oscillation index. Geophys. Res. Lett. 26 (4), 459–462. doi:10.1029/1999gl900003
Guan, H., Love, A. J., Simmons, C. T., Makhnin, O., and Kayaalp, A. S. (2010). Factors influencing chloride deposition in a coastal hilly area and application to chloride deposition mapping. Hydrol. Earth Syst. Sci. 14, 801–813. doi:10.5194/hess-14-801-2010
Hamed, K. H., and Rao, A. R. (1998). A modified Mann-Kendall trend test for autocorrelated data. J. Hydrol. 204 (1-4), 182–196. doi:10.1016/s0022-1694(97)00125-x
He, S., Gao, Y., Li, F., Wang, H., and He, Y. (2017). Impact of arctic oscillation on the east Asian climate: a review. Earth Sci. Rev. 164, 48–62. doi:10.1016/j.earscirev.2016.10.014
He, X., and Guan, H. (2013). Multiresolution analysis of precipitation teleconnections with large-scale climate signals: a case study in South Australia. Water Resour. Res. 49 (10), 6995–7008. doi:10.1002/wrcr.20560
He, X., Guan, H., Zhang, X., and Simmons, C. T. (2014). A wavelet-based multiple linear regression model for forecasting monthly rainfall. Int. J. Climatol. 34 (6), 1898–1912. doi:10.1002/joc.3809
Hendon, H. H., Thompson, D. W. J., and Wheeler, M. C. (2007). Australian rainfall and surface temperature variations associated with the Southern Hemisphere annular mode. J. Clim. 20 (11), 2452–2467. doi:10.1175/jcli4134.1
Henley, B. J., Gergis, J., Karoly, D. J., Power, S., Kennedy, J., and Folland, C. K. (2015). A tripole index for the interdecadal Pacific oscillation. Clim. Dynam. 45 (11-12), 3077–3090. doi:10.1007/s00382-015-2525-1
Ho, M., Kiem, A. S., and Verdon-Kidd, D. C. (2012). The southern annular mode: a comparison of indices. Hydrol. Earth Syst. Sci. 16 (3), 967–982. doi:10.5194/hess-16-967-2012
Hu, Q., and Feng, S. (2010). Influence of the Arctic oscillation on central United States summer rainfall. J. Geophys. Res. Atmos. 115, D01102. doi:10.1029/2009jd011805
Ihara, C., Kushnir, Y., Cane, M. A., and De La Peña, V. H. (2007). Indian summer monsoon rainfall and its link with ENSO and Indian Ocean climate indices. Int. J. Climatol. 27 (2), 179–187. doi:10.1002/joc.1394
Ishii, M., Shouji, A., Sugimoto, S., and Matsumoto, T. (2005). Objective analyses of sea-surface temperature and marine meteorological variables for the 20th century using icoads and the Kobe collection. Int. J. Climatol. 25 (7), 865–879. doi:10.1002/joc.1169
Jarvis, C., Darbyshire, R., Eckard, R., Goodwin, I., and Barlow, E. (2018). Influence of el Niño-southern oscillation and the Indian Ocean Dipole on winegrape maturity in Australia. Agric. For. Meteorol. 248, 502–510. doi:10.1016/j.agrformet.2017.10.021
Kakade, S. B., and Dugam, S. S. (2000). The simultaneous effect of NAO and SO on the monsoon activity over India. Geophys. Res. Lett. 27 (21), 3501–3504. doi:10.1029/1999gl011201
Kenyon, J., and Hegerl, G. C. (2010). Influence of modes of climate variability on global precipitation extremes. J. Clim. 23 (23), 6248–6262. doi:10.1175/2010jcli3617.1
Kiem, A. S., and Franks, S. W. (2004). Multi-decadal variability of drought risk, eastern Australia. Hydrol. Process. 18 (11), 2039–2050. doi:10.1002/hyp.1460
King, A. D., Alexander, L. V., and Donat, M. G. (2013). Asymmetry in the response of eastern Australia extreme rainfall to low-frequency Pacific variability. Geophys. Res. Lett. 40 (10), 2271–2277. doi:10.1002/grl.50427
Kirono, D. G. C., Chiew, F. H. S., and Kent, D. M. (2010). Identification of best predictors for forecasting seasonal rainfall and runoff in Australia. Hydrol. Process. 24 (10), 1237–1247.
Li, T., and Wang, B. (2005). REVIEW A review on the western north Pacific monsoon: synoptic-to-interannual variabilities. Terr. Atmos. Ocean Sci. 16 (2), 285–314. doi:10.3319/tao.2005.16.2.285(a)
Lim, E.-P., Hendon, H. H., Arblaster, J. M., Delage, F., Nguyen, H., Min, S.-K., et al. (2016). The impact of the southern annular mode on future changes in southern Hemisphere rainfall. Geophys. Res. Lett. 43 (13), 7160–7167. doi:10.1002/2016gl069453
Lim, E.-P., Hendon, H. H., and Rashid, H. (2013). Seasonal predictability of the southern annular mode due to its association with ENSO. J. Clim. 26 (20), 8037–8054. doi:10.1175/jcli-d-13-00006.1
Liu, J., Zhang, Y., Yang, Y., Gu, X., and Xiao, M. (2018). Investigating relationships between Australian flooding and large-scale climate indices and possible mechanism. J. Geophys. Res. Atmos. 123 (16), 8708–8723. doi:10.1029/2017jd028197
Liu, Z. Y., and Alexander, M. (2007). Atmospheric bridge, oceanic tunnel, and global climatic teleconnections. Rev. Geophys. 45 (2), 34. doi:10.1029/2005rg000172
Lu, W., Atkinson, D. E., and Newlands, N. K. (2017). ENSO climate risk: predicting crop yield variability and coherence using cluster-based PCA. Model. Earth Syst. Environ. 3 (4), 1343–1359. doi:10.1007/s40808-017-0382-0
McBride, J. L., and Nicholls, N. (1983). Seasonal relationships between Australian rainfall and the southern Oscillation. Mon. Wea. Rev. 111 (10), 1998–2004. doi:10.1175/1520-0493(1983)111<1998:srbara>2.0.co;2
McDowell, N., Pockman, W. T., Allen, C. D., Breshears, D. D., Cobb, N., Kolb, T., et al. (2008). Mechanisms of plant survival and mortality during drought: why do some plants survive while others succumb to drought?. New Phytol. 178 (4), 719–739. doi:10.1111/j.1469-8137.2008.02436.x
Meehl, G. A., Hu, A., and Tebaldi, C. (2010). Decadal prediction in the Pacific region. J. Clim. 23 (11), 2959–2973. doi:10.1175/2010jcli3296.1
Meneghini, B., Simmonds, I., and Smith, I. N. (2007). Association between Australian rainfall and the southern annular mode. Int. J. Climatol. 27 (1), 109–121. doi:10.1002/joc.1370
Meyers, G., McIntosh, P., Pigot, L., and Pook, M. (2007). The years of El Niño, La Niña, and interactions with the tropical Indian ocean. J. Clim. 20 (13), 2872–2880. doi:10.1175/jcli4152.1
Mistry, V. V., and Conway, D. (2003). Remote forcing of East African rainfall and relationships with fluctuations in levels of Lake Victoria. Int. J. Climatol. 23 (1), 67–89. doi:10.1002/joc.861
Montazerolghaem, M., Vervoort, W., Minasny, B., and McBratney, A. (2016). Long-term variability of the leading seasonal modes of rainfall in south-eastern Australia. Weather Clim. Extrem. 13, 1–14. doi:10.1016/j.wace.2016.04.001
Murphy, B. F., and Timbal, B. (2008). A review of recent climate variability and climate change in southeastern Australia. Int. J. Climatol. 28 (7), 859–879. doi:10.1002/joc.1627
Nidumolu, U., Hayman, P., Howden, S., and Alexander, B. (2012). Re-evaluating the margin of the South Australian grain belt in a changing climate. Clim. Res. 51 (3), 249–260. doi:10.3354/cr01075
Nicholls, J. G., and Hernandez, U. G. (1989). Growth and synapse formation by identified leech Neurones in culture: a review. Exp. Physiol. 74, 965–973. doi:10.1175/1520-0442(1989)002<0965:sstaaw>2.0.co;2
Parton, K. A., Crean, J., and Hayman, P. (2019). The value of seasonal climate forecasts for Australian agriculture. Agric. Syst. 174, 1–10. doi:10.1016/j.agsy.2019.04.005
Peel, M. C., McMahon, T. A., Finlayson, B. L., and Watson, F. G. R. (2001). Identification and explanation of continental differences in the variability of annual runoff. J. Hydrol. 250 (1-4), 224–240. doi:10.1016/s0022-1694(01)00438-3
Pezza, A. B., Durrant, T., Simmonds, I., and Smith, I. (2008). Southern Hemisphere synoptic behavior in extreme phases of SAM, ENSO, sea ice extent, and southern Australia rainfall. J. Clim. 21 (21), 5566–5584. doi:10.1175/2008jcli2128.1
Pohl, B., Fauchereau, N., Reason, C. J. C., and Rouault, M. (2010). Relationships between the Antarctic oscillation, the Madden-Julian oscillation, and ENSO, and consequences for rainfall analysis. J. Clim. 23 (2), 238–254. doi:10.1175/2009jcli2443.1
Polonsky, A. B., Basharin, D. V., Voskresenskaya, E. N., Worley, S. J., and Yurovsky, A. V. (2004). Relationship between the north atlantic oscillation, euro-asian climate anomalies and Pacific variability. Pacific Oceanography. 2, 2.
Power, S., Casey, T., Folland, C., Colman, A., and Mehta, V. (1999). Inter-decadal modulation of the impact of ENSO on Australia. Clim. Dynam. 15 (5), 319–324. doi:10.1007/s003820050284
Power, S., Haylock, M., Colman, R., and Wang, X. (2006). The predictability of interdecadal changes in ENSO activity and ENSO teleconnections. J. Clim. 19 (19), 4755–4771. doi:10.1175/jcli3868.1
Ridgway, K. R., and Dunn, J. R. (2007). Observational evidence for a Southern Hemisphere oceanic supergyre. Geophys. Res. Lett. 34 (13), 5. doi:10.1029/2007gl030392
Risbey, J. S., Pook, M. J., McIntosh, P. C., Wheeler, M. C., and Hendon, H. H. (2009). On the remote drivers of rainfall variability in Australia. Mon. Weather Rev. 137 (10), 3233–3253. doi:10.1175/2009mwr2861.1
Saji, N., and Yamagata, T. (2003). Possible impacts of Indian Ocean Dipole mode events on global climate. Clim. Res. 25 (2), 151–169. doi:10.3354/cr025151
Salinger, M. J., Renwick, J. A., and Mullan, A. B. (2001). Interdecadal Pacific oscillation and south Pacific climate. Int. J. Climatol. 2 (14), 1705–1721. doi:10.1002/joc.691
Schepen, A., Wang, Q. J., and Robertson, D. (2012). Evidence for using lagged climate indices to forecast Australian seasonal rainfall. J. Clim. 25 (4), 1230–1246. doi:10.1175/jcli-d-11-00156.1
Simmonds, I., and Hope, P. (1997). Correction: Persistence characteristics of Australian rainfall anomalies. Int. J. Climatol. 17 (8), 908. doi:10.1002/(sici)1097-0088(19970630)17:8<908::aid-joc181>3.0.co;2-e
Stahl, K., Kohn, I., Blauhut, V., Urquijo, J., De Stefano, L., Acácio, V., et al. (2016). Impacts of European drought events: insights from an international database of text-based reports. Nat. Hazards Earth Syst. Sci. 16 (3), 801–819. doi:10.5194/nhess-16-801-2016
Sun, C., Li, J., Feng, J., and Xie, F. (2015). A decadal-scale teleconnection between the north Atlantic oscillation and subtropical eastern Australian rainfall. J. Clim. 28 (3), 1074–1092. doi:10.1175/jcli-d-14-00372.1
Tabari, H., and Willems, P. (2018). Lagged influence of Atlantic and Pacific climate patterns on European extreme precipitation. Sci. Rep. 8. doi:10.1038/s41598-018-24069-9
Thompson, D. W. J., and Wallace, J. M. (2000). Annular modes in the extratropical circulation. Part I: month-to-month variability. J. Clim. 13 (5), 1000–1016. doi:10.1175/1520-0442(2000)013<1000:amitec>2.0.co;2
Thompson, D. W. J., Wallace, J. M., and Hegerl, G. C. (2000). Annular modes in the extratropical circulation. Part II: Trends. J. Clim. 13 (5), 1018–1036. doi:10.1175/1520-0442(2000)013<1018:amitec>2.0.co;2
Timbal, B., and Drosdowsky, W. (2012). The relationship between the decline of Southeastern Australian rainfall and the strengthening of the subtropical ridge. Int. J. Climatol. 33, 1021–1034. doi:10.1002/joc.3492
Tozer, C. R., Kiem, A. S., and Verdon-Kidd, D. C. (2017). Large-scale ocean-atmospheric processes and seasonal rainfall variability in South Australia: potential for improving seasonal hydroclimatic forecasts. Int. J. Climatol. 37, 861–877. doi:10.1002/joc.5043
Trenberth, K. E. (1997). The definition of el Niño. Bull. Am. Meteorol. Soc. 78 (12), 2771–2777. doi:10.1175/1520-0477(1997)078<2771:tdoeno>2.0.co;2
Trigo, R. M., Pozo-Vázquez, D., Osborn, T. J., Castro-Díez, Y., Gámiz-Fortis, S., and Esteban-Parra, M. J. (2004). North Atlantic oscillation influence on precipitation, river flow and water resources in the Iberian peninsula. Int. J. Climatol. 24 (8), 925–944. doi:10.1002/joc.1048
Ummenhofer, C. C., England, M. H., McIntosh, P. C., Meyers, G. A., Pook, M. J., Risbey, J. S., et al. (2009). What causes southeast Australia's worst droughts? Geophys. Res. Lett. 36, L04706. doi:10.1029/2008gl036801
van Dijk, A. I. J. M., Beck, H. E., Crosbie, R. S., de Jeu, R. A. M., Liu, Y. Y., Podger, G. M., et al. (2013). The millennium drought in southeast Australia (2001–2009): natural and human causes and implications for water resources, ecosystems, economy, and society. Water Resour. Res. 49, 1040–1057. doi:10.1002/wrcr.20123
Verdon, D. C., and Franks, S. W. (2006). Long-term behaviour of ENSO: interactions with the PDO over the past 400 years inferred from paleoclimate records. Geophys. Res. Lett. 33 (6), L06712. doi:10.1029/2005gl025052
Wang, G., Cai, W., and Purich, A. (2014). Trends in southern hemisphere wind-driven circulation in CMIP5 models over the 21st century: ozone recovery versus greenhouse forcing. J. Geophys. Res. Oceans. 119 (5), 2974–2986. doi:10.1002/2013jc009589
Wang, G., and Hendon, H. H. (2007). Sensitivity of Australian rainfall to inter-El Niño variations. J. Clim. 20 (16), 4211–4226. doi:10.1175/jcli4228.1
Wang, G. J., and Cai, W. J. (2013). Climate-change impact on the 20th-century relationship between the southern annular mode and global mean temperature. Sci. Rep. 3, 2039. doi:10.1038/srep02039
Williams, A. A. J., and Stone, R. C. (2009). An assessment of relationships between the Australian subtropical ridge, rainfall variability, and high-latitude circulation patterns. Int. J. Climatol. 29 (5), 691–709. doi:10.1002/joc.1732
Xu, X., Guan, H., Skrzypek, G., and Simmons, C. T. (2019). Root-zone moisture replenishment in a native vegetated catchment under Mediterranean climate. Hydrological Process. 33 (18), 2394–2407. doi:10.1002/hyp.13475
Keywords: precipitation prediction, southern annular mode, sea temperature, supergyre, drought, Goyder’s line
Citation: Fan L, Guan H, Cai W, Rofe CP and Xu J (2020) A 7-Year Lag Precipitation Teleconnection in South Australia and Its Possible Mechanism. Front. Earth Sci. 8:553506. doi:10.3389/feart.2020.553506
Received: 19 April 2020; Accepted: 16 September 2020;
Published: 29 October 2020.
Edited by:
Kerstin Stahl, University of Freiburg, GermanyReviewed by:
Nathaniel K. Newlands, Agriculture and Agri-Food Canada (AAFC), CanadaBastien Dieppois, Coventry University, United Kingdom
Copyright © 2020 Fan, Guan, Cai, Rofe and Xu. This is an open-access article distributed under the terms of the Creative Commons Attribution License (CC BY). The use, distribution or reproduction in other forums is permitted, provided the original author(s) and the copyright owner(s) are credited and that the original publication in this journal is cited, in accordance with accepted academic practice. No use, distribution or reproduction is permitted which does not comply with these terms.
*Correspondence: Huade Guan, aHVhZGUuZ3VhbkBmbGluZGVycy5lZHUuYXU=