 Muhammad Edo Marshal Nurshal1,2*
 Muhammad Suwongso Sadewo1Arif Hidayat1
 Wildan Nur Hamzah1,3Benyamin Sapiie2
 Mirzam Abdurrachman3Alfend Rudyawan2
- 1Department of Geological Engineering-Master Program, Bandung Institute of Technology, Bandung, Indonesia
- 2Structural Geology and Geodynamics Research Group, Department of Geological Engineering, Bandung Institute of Technology, Bandung, Indonesia
- 3Petrology, Volcanology, and Geochemistry Research Group, Department of Geological Engineering, Bandung Institute of Technology, Bandung, Indonesia
Three-dimensional outcrop models, or Digital Surface Models (DSMs), have proved their capacity in many geoscience studies. Along with the advantage in the rapid acquisition, DSMs are capable of creating virtual models of fractured outcrops to be interpreted for further analysis. This paper reports the DSM robustness by comparing the result of fracture-lineament measurement using DSMs and discusses the possible causes of error that might occur. The first method applied in this study is the scanline method to collect fracture data directly from outcrops, measuring more than 1,400 fracture data. The second method is applying fully automatic and manual fracture identification by optimizing hill-shaded DSMs. Two well-exposed granite outcrops in Bangka, Indonesia, are designed for the pilot area. Structure-from-Motion (SfM) photogrammetry is utilized to generate the DSMs, where a series of aerial images are captured using Unmanned Aerial Vehicle (UAV). The images are then processed into hill-shaded DSMs to be automatically analyzed following the algorithm in PCI Geomatics software and manually assessed. The textures of DSMs are also used in fracture identification through RGB filtering as the third method. The results show that the semiautomatic measurement using RGB-filtering texture has the closest pattern to the scanline data compared to the hill-shaded DSM method. The differences rely on several conditions, such as the geometry and texture of the outcrops. Eventually, methods of fracture identification using DSM are expected to be capable as options in preliminary fracture data collecting on outcrops, especially when the scanline is unable to be performed.
Introduction
Digital Surface Models (DSMs), or also known as three-dimensional outcrop models/digital outcrop models, have played many important roles in geoscience research. Generating georeferenced outcrop models using a drone has been proven to help geological mapping in dolomite (Madjid et al., 2018), sedimentology research (Westoby et al., 2015), and observing gas plumes of a volcano (Jordan, 2015) among many other researches on bringing outcrops into the digital world. In terms of collecting fracture data on an outcrop, the scanline method is one of the common procedures (Priest and Hudson, 1981; Mauldon et al., 2001). This method simply uses measuring tape and geological compass to study the fracture behavior of rocks (Peacock et al., 2003) and represent the regional model (Chesnaux et al., 2009) or as an analog to a subsurface model (Guerriero et al., 2010). However, a variety of factors can prohibit the method from being used during fieldwork, such as time-consuming and safety concerns.
Various publications discuss the capability of DSM to collect fracture data such as automatic fracture identification (Vasuki et al., 2013). By using UAV to capture sets of pictures of the outcrop to create a DSM, fracture detection is applied to identify lineaments that are interpreted as fractures. The process has also been used, for example, to classify joints, bedding, and other discontinuity features on outcrops (Kottenstette, 2005; Roncella et al., 2005; Micklethwaite et al., 2012; Bemis et al., 2014). However, most of the experiments are concerned with the capability of DSMs to report very comprehensive features, whilst the need to verify the robustness of the system is seldom attempted. Thus, along with the benefits of using DSM, this study aims to test fracture detection methods for DSMs relative to the traditional scanline method.
Two granite outcrops are chosen to test the methods. The outcrops are labeled SL01 and SL02, which are located on Bangka Island, Indonesia (106.1628°E longitude and 1.8688°S latitude for SL01 and 106.1735° longitude and 1.8771° latitude for SL02). These granites are grouped into hornblende-bearing granites as part of the Southeast Asia Late Triassic granite tin belt (Mangga and Djamal, 1994; Ng et al., 2017). Fractures are identified on both outcrops, interpreted as the result of a tectonic event that formed the Bentong-Raub Suture during Late Triassic-Early Jurassic when Sibumasu Block and Indochina were collided with each other (Metcalfe, 2017) or later.
Materials and Equipment
The capability of displaying a very detailed 3D digital outcrop on a workstation is one of many benefits of the DSM. The typical resolution of a DSM reaches around 0.1–0.5 m (Pringle et al., 2006). Moreover, the rapid acquisition during fieldwork and the capability to get through physically unreachable locations are other advantages in using UAVs to create a DSM. Nonetheless, as suggested by Jordan (2015), there are at least three drawbacks of UAV. The first weak point is the reliance on the weather. Bad weather conditions may interrupt the flight and consume more battery power. Other disadvantages are flight-time limitations and local regulations. In this study, a DJI Mavic Pro drone with a 12-megapixel mounted camera is used to capture sets of images of the outcrops during fieldwork. The images are later processed using Structure-from-Motion (SfM) photogrammetry (Westoby et al., 2015; Madjid et al., 2018; Hansman and Ring, 2019) to construct a three-dimensional model. Fracture data of the outcrops have also been collected with the linear scanline method by using a measuring tape and geological compass to later ground truth and validate the results of DSM methods.
Methods
Three different methods are applied to get the results of the fracture data of the outcrops, which are the linear scanline method, automatic and manual identification on hill-shaded DSM, and semiautomatic fracture determination on RGB-filtering DSM textures. The methods are basically based on feature identification on contrast changes of the DSMs, following the feature detection method on DSM by Bemis et al. (2014), Micklethwaite et al. (2012), and Vasuki et al. (2014). The hill-shaded DSMs are those which are processed into the digital elevation model and then later interpreted both manually and automatically. Meanwhile, since the fracture identification is based on the color of DSMs, the RGB-filtering methods are also applied to get higher contrast changes. The lineament data are also processed with a simple triangulation method (Fernández, 2005; Bemis et al., 2014; Vasuki et al., 2014) to get the true strike and dip values. The method is performed by defining points at each end and midpoint of every lineament. Subsequently, the height of the DSM is extracted to the points to obtain a triangular plane of the fractures.
Fracture Sampling Using Linear Scanline
As the most conventional and reliable technique to collect fracture data, the linear scanline method has been carried out at the outcrops. The measurements are used as validation of the other methods of collecting fracture data using hill-shaded DSM and RGB-filtering DSM. To cover all fractures at the selected outcrops, nine scanlines have been executed. Four scanlines were conducted at SL01 (SL0101, SL0102, SL0103, and SL0104) and five scanlines were conducted at SL02 (SL0201, SL0202, SL0203, SL0204, and SL0205), to cover all fractures at these selected outcrops (Figures 1–3).
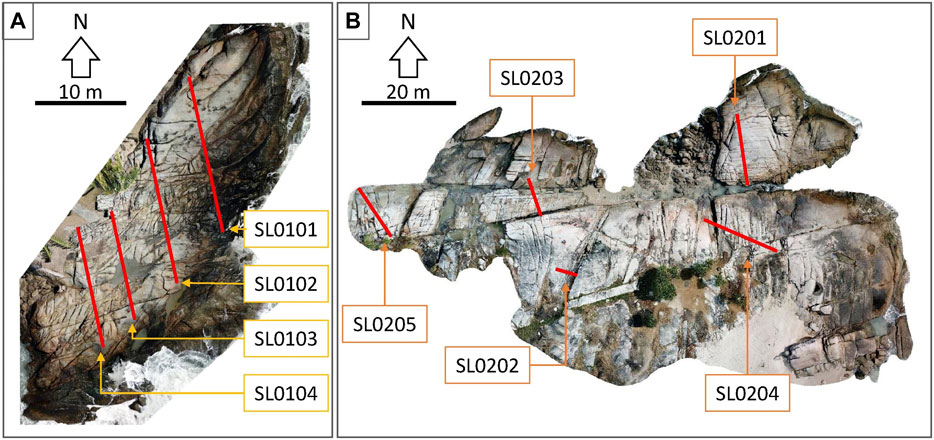
FIGURE 1. Imagery of the outcrops: (A) SL01 and (B) SL02 along with the projection of linear scanlines location (red lines). Both outcrops are located on Bangka Island, Indonesia (106.1628°E longitude and 1.8688°S latitude and 106.1735° longitude and 1.8771° latitude for SL01 and SL02, respectively).
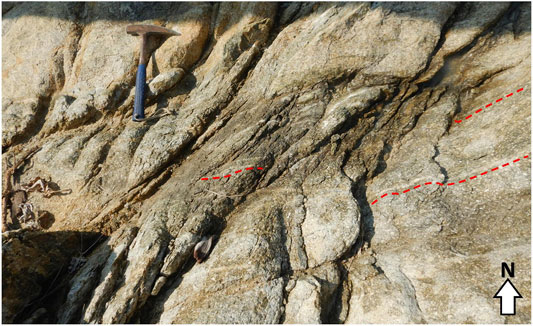
FIGURE 2. Detailed picture of the fracture network on SL01 with the handle of the hammer pointing south. Fractures on the outcrop are mainly trending E-W and NE-SW; fine-sized fractures are very common, trending E-W (marked with red dashed line).
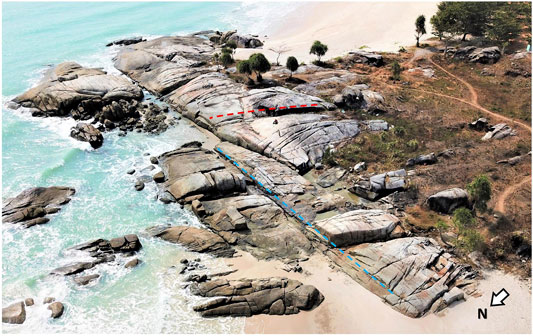
FIGURE 3. Aerial view of SL02. At least two fracture orientations can be distinguished: an E-W (red dashed line) and a NE-SW (light blue dashed line).
Fracture Identification on Hill-Shaded Digital Surface Models
Initial fracture identification involved DSM processing into hill-shaded digital elevation models. To create DSMs, as many as 91 georeferenced images of the outcrops were collected using a drone and processed to construct the digital model of the outcrops. Later, the models go through a hill-shading process to obtain clear geometry of the fracture lineaments. Subsequently, the generation of automatic and manual lineament from hill-shaded DSMs is executed. Manual fracture identification follows the Yamaguchi Method (Yamaguchi, 1985), which defines the relationship between the resolution of images (R) and optimum image-scale for interpretation of satellite imagery data (S). According to the method, the value of S should fit the formula, where
The automatic fracture identification was processed using Geomatica software from PCI Geomatics. The minimum length of automatically generated lineaments was set equal to the minimum length of the fractures, which has been manually identified. The main purpose of this determination is to avoid mislead lineament generation in differentiating features between fractures and artifacts. The other two parameters, the angular difference threshold and the lineament radius, are relying on the resolution of DSM. We set a step of 10° for the angular difference threshold, which specifies the maximum angle to create a segmented line because the direction data are plotted on rose diagrams at intervals of 10°. The lineament radius (defined as the radius of pixel to detect lineament continuation) is set at 20 pixels (40 cm), which is the minimum observable fracture length (Figure 4).
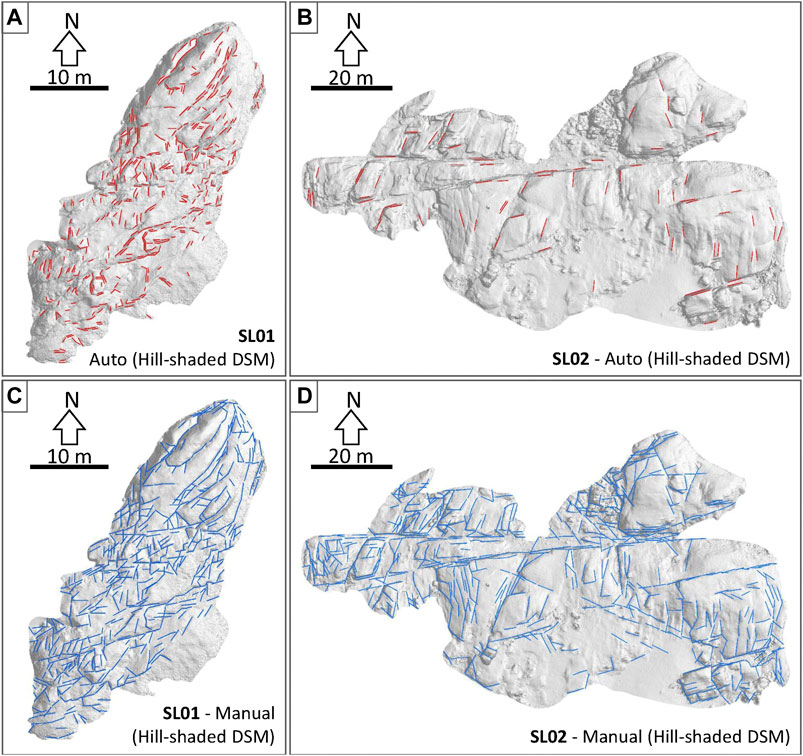
FIGURE 4. Images of hill-shaded DSM of the outcrops captured from the top, with colored lines as the fracture lines on both outcrops. Lineaments at panels (A, B) are generated automatically, whereas lineaments at panels (C, D) are the result of manual interpretation.
Fracture Identification on Red-Green-Blue-Filtering Digital Surface Models
In this method, the textures of DSMs are used to determine fractures at the outcrops. Similar to the hill-shaded DSM method, DSMs of the outcrops (Figure 1) are also required to obtain very detailed textures. Furthermore, the RGB (Red-Green-Blue) value of the textures was filtered to highlight the fractures from the outcrops. This process inverts the real texture of the DSM and subsequently, the contrast is manually adjusted for the optimum visual results. The fractures are later interpreted by a semiautomatic process. The DSMs are first processed with automatic fracture-lineament identification using Geomatica software, and subsequently, the lineaments are manually reinterpreted (Figure 5).
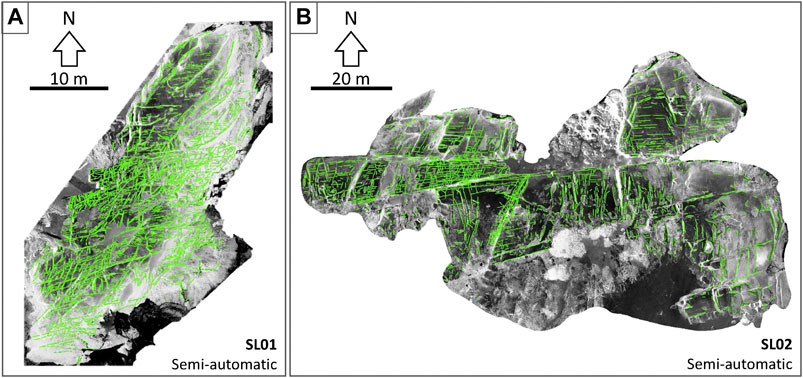
FIGURE 5. Results of RGB-processed lineaments from the texture of DSMs as fracture lineaments from the semiautomatic process in the outcrops SL01 (A) and SL02 (B).
Results
Based on the outcome of lineament identification using DSMs, fractures are well identified on both hill-shaded DSMs and RGB-processed DSMs methods (Figures 4,5). The numbers of lineaments also varied, with the RGB-processed methods providing the maximum number of identified fractures. In terms of fracture direction, various patterns are well recorded on both outcrops. To assess the robustness of all the DSMs methods compared to the scanline, we display the results in rose diagrams (Figures 6,7) and stereographic projections (Figures 8,9). For the first outcrop (SL01), the E-W trend (080°–100°) is the major direction, covering 31% of all data (Figure 6). Subordinate fractures also occur at NE-SW (030–040°) and N-S (000–010°) trends, comprising 8% and 2% of all data, respectively. Similar trends are also shown in RGB-processed DSM. A slight difference in pattern is shown from the results of the hill-shaded DSM, where the E-W trend is shifted around 10° in a counterclockwise direction to 070–080°.
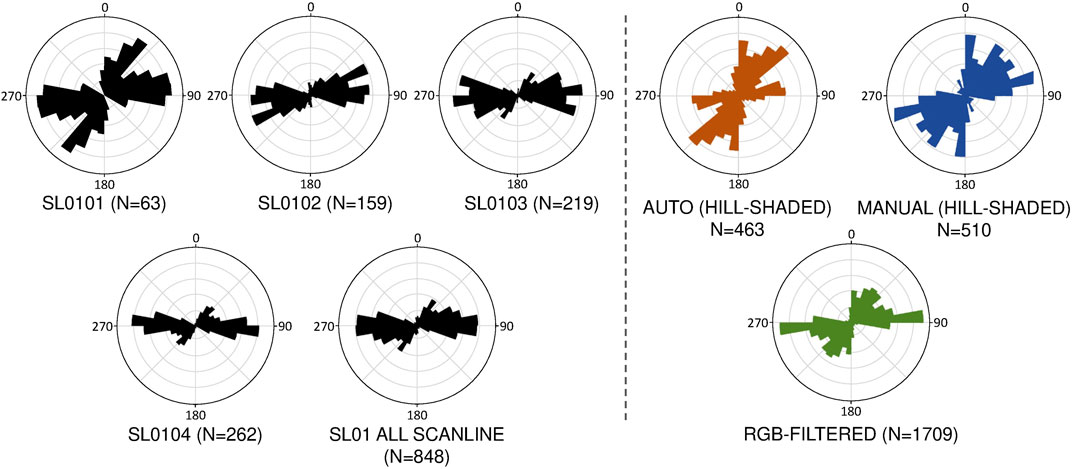
FIGURE 6. Three lineament trends are distinguished from all methods on SL01 outcrop. The results of the scanline (black graphs), automated hill-shade (orange graphs), manual hill-shaded (blue graphs), and RGB-filtered DSM (green graphs) methods are portrayed on rose diagrams.
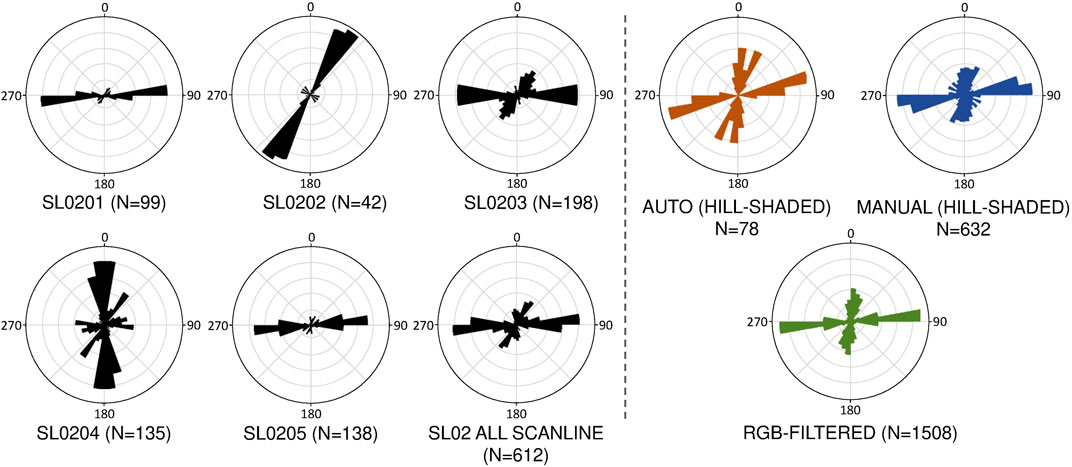
FIGURE 7. Plots of the lineament trends obtained from scanline (black graphs), automated hill-shade (orange graphs), manual hill-shaded (blue graphs), and RGB-filtered DSM (green graphs) are portrayed on rose diagrams.
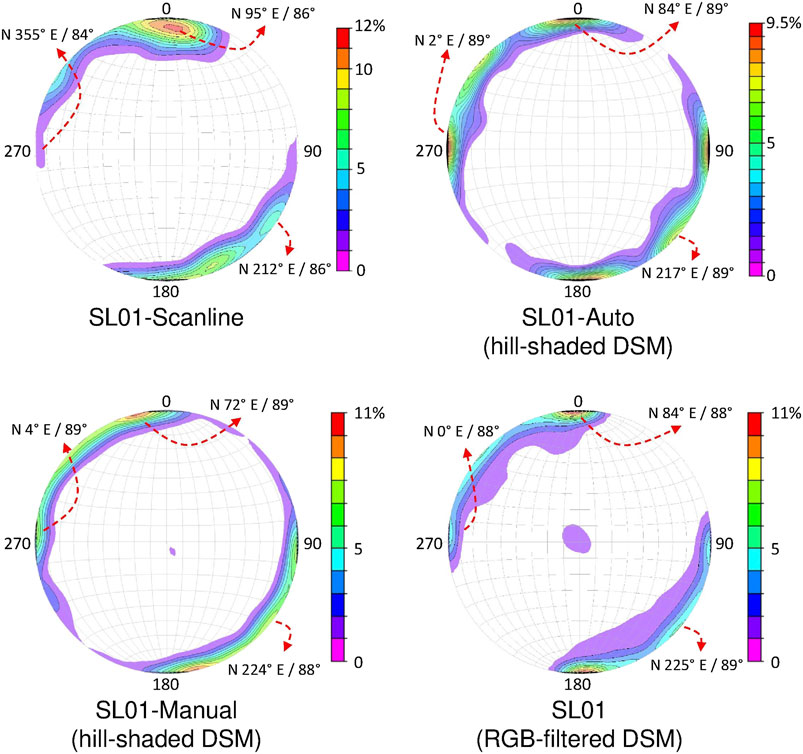
FIGURE 8. Lower-hemisphere stereographic projections of fracture planes generated from the simple triangulation method for SL01 outcrop. All DSM methods show nearly identical outcomes compared to the result from the scanline regarding true strike direction and dip angle.
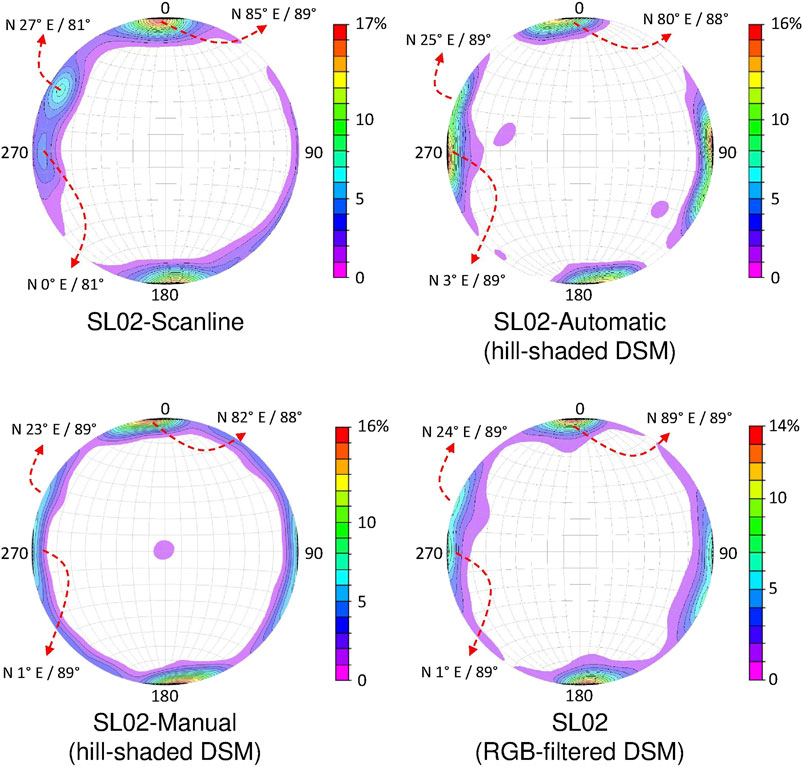
FIGURE 9. Stereographic projections of fracture planes for SL02, generated from the simple triangulation method. Similar to the result from SL01, the outcome from all DSMs methods is nearly identical to the result from the scanline method.
The results of the scanline method at SL02 site show the occurrence of fractures trending E-W (080–090°) as the major trend, covering 20% of all data (Figure 7). Minor sets of fractures are oriented NE-SW (030–040°) and N-S (355–000°), encompassing 9 and 5% of all data, respectively. These trends are well recognized in both methods using DSMs. Shifted trends also appear, where the NE-SW trend is rotated in a counterclockwise direction to 020–030° on all of the DSM-based methods. In addition, the dip value of every lineament has also been processed by using a simple triangulation method. The results are shown in lower-hemisphere stereographic projections (Figures 8,9).
Discussion
The results obtained from DSM methods and scanline differ by about 10° for both investigated outcrops (Figures 6,7), because DSM methods measure only apparent and not true strike. Each point at the edge of various lineaments from DSM methods has a different height; thus, it can be assumed that some of the lineaments record apparent strike directions. To prevent apparent strike recording, the conversion of lineaments into planes has been done. Based on the results shown in stereographic projections (Figures 8,9), it can be concluded that methods using DSM provide nearly identical results with the scanline method. Overall, the strike acquired from DSM methods compared to those obtained from the scanline deviates by less than 8°, with a maximum of 23° deviation on fractures striking E-W at the SL01 site.
The DSM methods show promising results in treating the dip values of each fracture population, as well. The highest deviation among all peaks on the projection is only 8°. However, the dip values tend to widely disperse. Several identified fractures are roughly horizontal (Figures 8,9). These gently steeping fracture planes are generated from the simple triangulation method where the elevation difference between each of the points is extremely low.
Obvious differences in the population of the E-W trend at SL01 outcrop between the three methods are also distinguished from the rose diagrams and the stereographic projections. According to field observation, hairline fractures with the E-W trend do not play any role in controlling the outcrop geometry and have not been recorded on the DSM texture (Figure 2). Thus, the number of this fracture trend is underestimated on the DSM. It is apparent that a field observation should be conducted before performing fracture identification from DSM.
Among all, the method using RGB-processed DSM appears to be more accurate. All fracture directions are recorded very well at both outcrops obviously because the RGB-processed method has the advantage to display fractures more accurately than the hill-shaded DSM. The fracture identification on the hill-shaded method also tends to be more dependent on outcrop geometry in recording the presence of fractures. Moreover, during the process of automatic lineament interpretations, numerous artifacts (e.g., vegetation, mud, rock boundaries, and shadows) are also misinterpreted as fractures.
In summary, methods of fracture measurement using DSMs are highly dependent on the geometry and texture of the outcrop. Errors may occur during the process, such as misidentified apparent strike for true strike direction, misleads in displaying major-minor trends in rose diagram due to the presence of hairline fractures, lack of lineament data if the outcrop relief is unable to produce high contrast in hill-shading process, and the presence of artifacts. As far as the apparent strike problem is concerned, a simple triangulation method may be used to transform the fracture lineaments into planes to achieve the true strike and dip value of the identified fractures. Field observation directly to the outcrops is important to mitigate mislead due to the presence of hairline fractures and artifacts.
Nonetheless, all DSM methods in this study demonstrated similar lineament patterns to the actual measurement of fractures in the field via the scanline method. Fractures oriented N-S, NE-SW, and E-W from scanlines are all recorded well using hill-shaded and RGB-filtered methods on both outcrops. Thereby, along with UAV advantages, such as capturing detailed outcrop features, covering a large area, and saving time, methods using DSM are a suitable option for collecting fracture data on outcrops, when the scanline method is unable to be conducted during fieldwork.
Data Availability Statement
The raw data supporting the conclusion of this article will be made available by the authors, without undue reservation.
Author Contributions
MEMN contributed in data collecting, data processing, and writing the first draft of the manuscript. MSS and AH performed the data processing. WNH was involved in data collecting. BS, MA, and AR contributed in supervising the study. All authors contributed to the conception of the study, data analysis, and drafting and revising the manuscript.
Funding
This work was supported by the Structural Geology and Geodynamics Research Group-ITB, Petrology, Volcanology, and Geochemistry Research Group-ITB, and P3MI Research Scheme from LPPM Institut Teknologi Bandung.
Conflict of Interest
The authors declare that the research was conducted in the absence of any commercial or financial relationships that could be construed as a potential conflict of interest.
Acknowledgments
The authors would like to thank all members of the Geodynamics Research Group-ITB for helpful discussions, FKPA Bangka-Belitung for supporting the fieldwork in Bangka, and Lely T. Anggarini for the kind review.
References
Bemis, S. P., Micklethwaite, S., Turner, D., James, M. R., Akciz, S., Thiele, S. T., et al. (2014). Ground-based and UAV-based photogrammetry: a multi-scale, high-resolution mapping tool for structural geology and paleoseismology. J. Struct. Geol. 69, 163–178. doi:10.1016/j.jsg.2014.10.007
Chesnaux, R., Allen, D. M., and Jenni, S. (2009). Regional fracture network permeability using outcrop scale measurements. Eng. Geol. 108 (3–4), 259–271. doi:10.1016/j.enggeo.2009.06.024
Fernández, O. (2005). Obtaining a best fitting plane through 3D georeferenced data. J. Struct. Geol. 27 (5), 855–858. doi:10.1016/j.jsg.2004.12.004
Guerriero, V., Iannace, A., Mazzoli, S., Parente, M., Vitale, S., and Giorgioni, M. (2010). Quantifying uncertainties in multi-scale studies of fractured reservoir analogues: implemented statistical analysis of scan line data from carbonate rocks. J. Struct. Geol. 32 (9), 1271–1278. doi:10.1016/j.jsg.2009.04.016
Hansman, R. J., and Ring, U. (2019). Workflow: from photo-based 3-D reconstruction of remotely piloted aircraft images to a 3-D geological model. Geosphere 15 (4), 1393–1408. doi:10.1130/ges02031.1
Jordan, B. R. (2015). A bird’s-eye view of geology: the use of micro drones/UAVs in geologic fieldwork and education. Gsat 25 (7), 50–52. doi:10.1130/gsatg232gw.1
Kottenstette, J. T. (2005). “Measurement of geologic features using close range terrestrial photogrammetry,” in Alaska rocks 2005, the 40th US symposium on rock mechanics (USRMS), Anchorage, Alaska (Alexandria, VA: American Rock Mechanics Association).
Madjid, M. Y. A., Vandeginste, V., Hampson, G., Jordan, C. J., and Booth, A. D. (2018). Drones in carbonate geology: opportunities and challenges, and application in diagenetic dolomite geobody mapping. Mar. Petrol. Geol. 91, 723–734. doi:10.1016/j.marpetgeo.2018.02.002
Mangga, S. A., and Djamal, B. (1994). Peta Geologi Lembar Bangka Utara, Sumatera. (Bandung, Indonesia: Pusat Penelitian dan Pengembangan Geologi).
Mauldon, M., Dunne, W. M., and Rohrbaugh, M. B. (2001). Circular scanlines and circular windows: new tools for characterizing the geometry of fracture traces. J. Struct. Geol. 23 (2–3), 247–258. doi:10.1016/s0191-8141(00)00094-8
Micklethwaite, S., Turner, D., Vasuki, Y., Kovesi, P., and Lucieer, A. (2012). “Mapping from an Armchair: rapid, high-resolution mapping using UAV and computer vision technology,” in Proceedings of Structural Geology and Resources, Kalgoorlie, Australia, September 2012, 130–133.
Ng, S. W.-P., Whitehouse, M. J., Roselee, M. H., Teschner, C., Murtadha, S., Oliver, G. J. H., et al. (2017). Late Triassic granites from Bangka, Indonesia: a continuation of the main range granite province of the South-East Asian tin belt. J. Asian Earth Sci. 138, 548–561. doi:10.1016/j.jseaes.2017.03.002
Peacock, D. C. P., Harris, S. D., and Mauldon, M. (2003). Use of curved scanlines and boreholes to predict fracture frequencies. J. Struct. Geol. 25 (1), 109–119. doi:10.1016/s0191-8141(02)00016-0
Priest, S. D., and Hudson, J. A. (1981). Estimation of discontinuity spacing and trace length using scanline surveys. Int. J. Rock Mech. Min. Sci. Geomech. Abstr. 18 (3), 183–197. doi:10.1016/0148-9062(81)90973-6
Pringle, J. K., Howell, J. A., Hodgetts, D., Westerman, A. R., and Hodgson, D. M. (2006). Virtual outcrop models of petroleum reservoir outcrop analogues–a review of the current state-of-the-art. First Break 24 (3), 33–42. doi:10.3997/1365-2397.2006005
Roncella, R., Forlani, G., and Remondino, F. (2005). “Photogrammetry for geological applications: automatic retrieval of discontinuity orientation in rock slopes,” in Proceedings of the Videometrics VIII. International Society for Optics and Photonics, San Jose, CA, January 2005, 5665.
Vasuki, Y., Holden, E.-J., Kovesi, P., and Micklethwaite, S. (2013). A geological structure mapping tool using photogrammetric data. ASEG Extended Abstracts 2013 (1), 1–4. doi:10.1071/aseg2013ab144
Vasuki, Y., Holden, E.-J., Kovesi, P., and Micklethwaite, S. (2014). Semi-automatic mapping of geological Structures using UAV-based photogrammetric data: an image analysis approach. Comput. Geosci. 69, 22–32. doi:10.1016/j.cageo.2014.04.012
Westoby, M. J., Dunning, S. A., Woodward, J., Hein, A. S., Marrero, S. M., Winter, K., et al. (2015). Sedimentological characterization of Antarctic moraines using UAVs and structure-from-motion photogrammetry. J. Glaciol. 61 (230), 1088–1102. doi:10.3189/2015jog15j086
Keywords: photogrammetry, drone, fracture, structural geology, granite, bangka
Citation: Nurshal MEM, Sadewo MS, Hidayat A, Hamzah WN, Sapiie B, Abdurrachman M and Rudyawan A (2020) Automatic and Manual Fracture-Lineament Identification on Digital Surface Models as Methods for Collecting Fracture Data on Outcrops: Case Study on Fractured Granite Outcrops, Bangka. Front. Earth Sci. 8:560596. doi: 10.3389/feart.2020.560596
Received: 09 May 2020; Accepted: 09 November 2020;
Published: 17 December 2020.
Edited by:
Basilios Tsikouras, Universiti Brunei Darussalam, BruneiCopyright © 2020 Nurshal, Sadewo, Hidayat, Hamzah, Sapiie, Abdurrachman and Rudyawan. This is an open-access article distributed under the terms of the Creative Commons Attribution License (CC BY). The use, distribution or reproduction in other forums is permitted, provided the original author(s) and the copyright owner(s) are credited and that the original publication in this journal is cited, in accordance with accepted academic practice. No use, distribution or reproduction is permitted which does not comply with these terms.
*Correspondence: Muhammad Edo Marshal Nurshal, ZWRvbWFyc2hhbEBnZW9kaW4ubmV0