 Yijia Hu
 Zhong Zhong1,2
 Yuan Sun
- 1College of Meteorology and Oceanography, National University of Defense Technology, Nanjing, China
- 2School of Atmospheric Sciences, Nanjing University, Nanjing, China
- 3University of International Relations, National University of Defense Technology, Nanjing, China
This study reveals the impacts of cumulus parameterization schemes (CPSs) on the simulation of interannual and interdecadal variations of Meiyu in the middle and lower reaches of the Yangtze River valley (Yangtze Meiyu) by using a regional climate model. A multiple 55-year (1955-2009) simulation of Yangtze Meiyu is conducted using RegCM4.6 with different CPSs, including the Emanuel scheme, Kuo scheme, and Grell scheme. It is found that all the CPSs have good performances in simulating the interannual variation of Yangtze Meiyu rainfall amounts. However, a large bias is found in the simulated interdecadal variation of Yangtze Meiyu rainfall amount by the three CPSs. Because the Emanuel CPS has good performance in the simulation of both interannual and interdecadal variations of Yangtze Meiyu, its overall performance in the simulation of the total amount of Yangtze Meiyu is the best among the three CPSs. The second best CPS is the Grell scheme, and the worst is the Kuo scheme. The model convergence in simulating the distribution of Yangtze Meiyu shows an obvious characteristic of interdecadal variation. During the years with strong summer monsoon and northward rain belt, the simulated distributions of Yangtze Meiyu by the three CPSs are quite different, and the model convergence is weak. On the contrary, during the years with weak summer monsoon and southward rain belt, the simulated distributions of Yangtze Meiyu by the three CPSs are similar to each other, and the model convergence is strong. As a result, when the well-known interdecadal change happens in the late 1970s, the monsoon changes from strong to weak, whereas the model convergence changes from weak to strong.
Introduction
The Meiyu front is an important component of the East Asian summer monsoon system. Climatologically, as the summer monsoon advances northward in mid-June, the Western Pacific Subtropical High (WPSH) jumps northward to around 25°N, and the Meiyu front to the north of the WPSH remains quasi-stationary in the middle and lower reaches of the Yangtze River. The dry and cold air from the north converges with the warm and moist monsoon southwesterly flow, resulting in large-scale Meiyu (or plum rain) in the middle and lower reaches of the Yangtze River (hereafter Yangtze Meiyu), which usually lasts until early to mid-July (Tao and Chen, 1987; Ding, 1992; Ding, 1994). Due to the large-scale, heavy precipitation concentrated in the Meiyu season, rainstorms and floods frequently occur in the middle and lower reaches of the Yangtze River. Several most famous floods that occurred in 1991, 1998, 1999, and 2016 are just examples of such weather disasters in this region, which can cause huge economic and casualty losses. For this reason, Meiyu is always a research hotspot in East Asian countries such as China, Japan, and South Korea.
Yangtze Meiyu demonstrates significant interannual and interdecadal variations (Tanaka, 1997). Some studies have revealed that the interannual variation of Yangtze Meiyu is mainly characterized by a biennial oscillation (TBO), and this TBO characteristic is more obvious in the middle and lower reaches of the Yangtze River than in other regions of China (Miao and Lau, 1990; Tian and Yasunari, 1992; Chang et al., 2000; Huang et al., 2006). The interdecadal variation of Yangtze Meiyu mainly occurred in the late 1970s, when the East Asian monsoon experienced an interdecadal change from strong to weak (Wang et al., 2001; Ding et al., 2008; Huang et al., 2004; Zeng et al., 2007). As a result, Yangtze Meiyu shifted from the dry phase to rainy phase in the late 1970s (Chen et al., 1998; Nitta and Hu, 1996; Qian and Qin, 2008; Ding et al., 2008).
Whether the climate model can realistically reproduce characteristics of interannual and interdecadal variations of the East Asian monsoon is of great significance for future climate prediction, climate model improvement, and climate change assessment. Many studies have evaluated the capability of global climate models (GCMs) for simulating interannual and interdecadal changes of the East Asian monsoon (Zhou et al., 2009; Sperber et al., 2013; Jiang and Tian, 2013; Gao, et al., 2015). It is found that some GCMs can reproduce the main characteristics of interannual and interdecadal variations of the Asian summer monsoon, whereas some other GCMs perform poorly in the simulation of changes in the East Asian summer monsoon and precipitation due to the coarse resolution used in most of the GCMs and inaccurate description of some physical processes (Yu et al., 2000; Wang et al., 2004; Zhou et al., 2008). To save computing resources, nested regional climate modeling (RCM, or dynamic downscaling) can be used for long-term climate simulation and prediction from decades to hundreds of years. Although the low-resolution GCM information will be passed into the RCM through lateral boundary forcing, climate in the interior of the RCM domain will differ from the GCM to some extent due to the impacts of the internal physical-dynamical processes of the RCM itself and high-resolution terrain and land use type in the RCM (Giorgi and Mearns, 1999; Gao et al., 2008; Leung et al., 2004). The nested RCMs are intended to produce realistic sub-GCM grid-scale details (Dickinson et al., 1989; Dickinson et al., 1993; Giorgi, 1990). Thus, great attention has been attached to the issue of whether the RCMs can realistically reflect characteristic interannual and interdecadal climate variations.
Biases of the simulated summer precipitation in the RCMs are mainly related to the cumulus parameterization schemes (CPSs). This is because cumulus convections are very strong in the Meiyu frontal system, and convective precipitation accounts for a large proportion of total precipitation (Zhang, 1994; Ding and Chan, 2005). Convective activities play a dominant role in monsoon circulation and precipitation (Rajendran et al., 2002). In addition, cumulus clouds formed under large-scale forcing can affect atmospheric circulations through their feedback on sensible and latent heat and momentum transport. They play a key role in determining the vertical structures of atmospheric temperature and humidity fields (Arakawa, 1975). For this reason, large-scale circulation biases simulated by the RCM are also related to cumulus convection parameterization schemes (Donner et al., 1982; Zhang and Mcfarlane, 1995; Giorgi and Shields, 1999).
The simulation of summer precipitation and circulation in East Asia is very sensitive to the choice of CPS in the RCM. Because the triggering mechanisms, moist convective processes, and the feedback processes to the large-scale environmental field in different CPSs differ from each other, the precipitation and circulation simulated by different CPSs are also significantly different (Lee et al., 2005; Hu et al., 2016; Liang et al., 2007; Song et al., 2011). The performance of a CPS depends on the case, region, season, and coupling with other physical processes. It is thus hard to determine which CPS is absolutely optimal (Lee et al., 2005), and CPS is one of the major causes of errors and uncertainties in East Asian summer rainfall simulations (Fu et al., 1998).
Previous studies have focused more on the impacts of CPSs on the simulation of seasonal precipitation in East Asia, but few studies provide detailed analysis about the impacts of CPSs on the simulated interannual and interdecadal variations of Yangtze Meiyu. Therefore, the performances of different CPSs in simulating the interannual and interdecadal variations of Yangtze Meiyu are evaluated, and the model bias and model convergence of the simulation by different CPSs are also investigated in this study. These results will be helpful for the prediction of future change of Yangtze Meiyu and the understanding of the results from a regional climate model. The rest of the article is organized as follows: Section 2 describes the datasets and methods and Analysis of Results analyzes the sensitivities of the simulated amount and distribution of Yangtze Meiyu to CPSs. The concluding remarks and discussions are provided in Summary and Discussions.
Datasets and Methods
Methods
Regional climate model 4.6 (RegCM4.6), which is developed by the International Centre for Theoretical Physics (ICTP) in Italy, is used in this study. It is the latest version of the regional climate model and upgraded from its last version (RegCM3). It has more advanced physical schemes and computing solutions than RegCM3. Compared to the previous versions, RegCM4.6 has an improved performance in several respects (Giorgi et al., 2012). Details about this model can be found in the RegCM Reference Manual (Nellie et al., 2014).
Due to the large interannual variability of Yangtze Meiyu, the duration of the rainy season and the time of entering and exiting the rainy season are different from year to year. Climatologically, the Yangtze Meiyu season begins in mid-June and ends in mid-July every year. For the sake of convenience, we define each year from June 15 to July 15 as the Yangtze Meiyu season. RegCM4.6 is used to simulate climate in the Yangtze Meiyu season for a total of 65 years from 1951 to 2015. All experiments are initialized at 6:00 UTC 5 June and end at 00 UTC 16 July each year. The first 10 days are taken as a spin-up time, and results for the period 15 June to 15 July are analyzed. The grid interval is 30 km, and the model domain is centered at (116°E, 30°N). There are 72 and 56 grid numbers in the east–west and north–south directions, respectively. The area (112°E∼122°E, 28°N∼33°N) is taken as the middle and lower reaches of the Yangtze River. The model domain and the area of the middle and lower reaches of the Yangtze River are displayed in Figure 1. There are 23 levels in the vertical direction, and the model top is 50 hPa. Time step is set to 90s. Initial and boundary conditions are extracted from the NCEP/NCAR reanalysis product, and an exponential relaxation procedure is applied to provide the model with time-dependent lateral boundary conditions updated every 6 hours. A lateral buffer zone with a width of 12 grid points is implemented. Three CPSs, that is, the Grell scheme including the FC assumption (Grell, 1993), the Emanuel scheme Emanuel, 1991; Emanuel and Zivkovic-Rothman, 1999, and the Kuo scheme (Anthes, 1977), are used for 55-year Meiyu climate simulations. The land surface scheme is BATS1e. Sea surface temperature (SST) data used in the model are extracted from the Hadley Centre global SST dataset in 1°×1° grids.
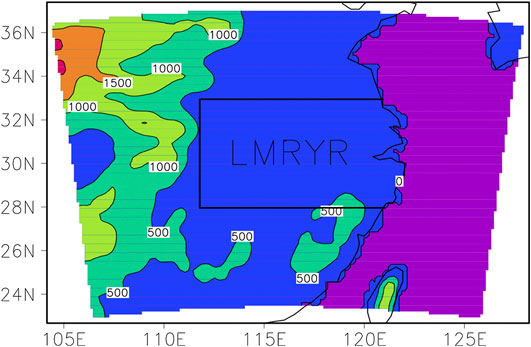
FIGURE 1. Model domain, topography (shaded, unit: m), and the area of the middle and lower reaches of the Yangtze River.
The harmonic analysis method proposed by Eliasen (1958) is implemented to filter the interannual and interdecadal variation components of the Yangtze Meiyu time series for the period 1951–2015. Fourier transform is applied to the time series of simulated and observed precipitation, and oscillations with periods greater than 8 years are classified as oscillations on the interdecadal scale, while those oscillations with periods of 13 months ≤ T <8 years are classified as oscillations on the interannual scale. To avoid the errors at the two ends of data after the filtering, only the original, interannual, and interdecadal data for 55 years from 1955 to 2009 are analyzed. The simulated results during the periods 1951-1954 and 2010-2015 are not analyzed in this study.
Datasets
The observed monthly precipitation at 752 stations in China and NCEP reanalysis data are interpolated to the model grids to verify the performance of the model. The precipitation dataset is released by the national meteorological information center, which can be downloaded freely from the Internet site at http://www.nmic.cn/. The NCEP reanalysis data can be downloaded freely from the Internet website at https://www.esrl.noaa.gov/psd/data/gridded/data.ncep.reanalysis.html. The HadiSST data provided by the UK Hadley Centre is used to build the bottom conditions for RegCM4.6, which can be downloaded freely from the Internet website at http://www.metoffice.gov.uk/hadobs/hadisst/data/download.html.
Analysis of Results
Simulated Interannual and Interdecadal Variations of Yangtze Meiyu
The area-averaged rainfall amount in the middle and lower reaches of the Yangtze River is defined as the Yangtze Meiyu rainfall amount. The variations in Yangtze Meiyu rainfall amount from simulations with the three CPSs and from observations are displayed in Figure 2A, which demonstrates obvious interannual variation. All the three CPSs can basically reproduce the variation of the Yangtze Meiyu rainfall amount. Certain degrees of uncertainty can be found in the simulated Yangtze Meiyu rainfall by the three CPSs; that is, for some years, the Grell scheme simulations are the closest to observations, and for some other years, the Emanuel scheme or the Kuo scheme performs better. In order to quantitatively evaluate the performance of different CPSs, the correlation coefficients of observations with simulations by different CPSs are calculated. Results are listed in Table 1. The highest correlation coefficient (0.77) is found between observations and simulations by the Emanuel scheme, followed by that between observations and the Grell scheme simulations (0.74). The Kuo scheme performs worst with the correlation coefficient of 0.73. The above results indicate that the Emanuel scheme has the best performance in simulating the variation of Yangtze Meiyu rainfall amount.
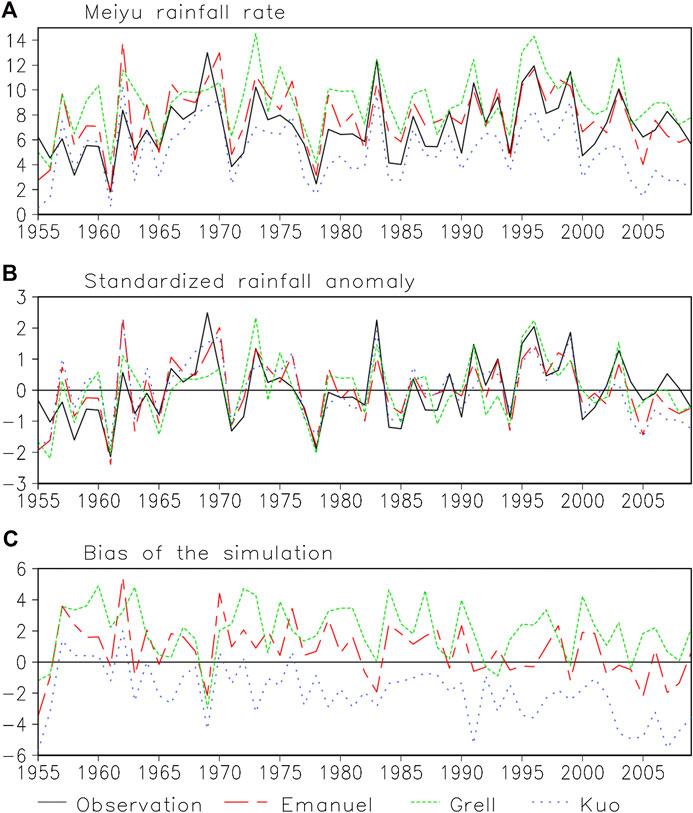
FIGURE 2. (A) Observated (black solid line) and simulated Yangtze Meiyu rated by the Emanuel (red long-dashed line), the Grell (green short-dashed line), and the Kuo (blue dotted line) (unit: mm/d) schemes; (B) normalized anomalies; and (C) biases of simulations (unit: mm day). Annual precipitation is the area mean value of precipitation in the middle and lower reaches of the Yangtze River.

TABLE 1. Correlation coefficients between observated and simulated Yangtze Meiyu by various CPSs and the 55-year mean biases of the simulation (unit: mm/day).
Figure 2C displays the biases of Yangtze Meiyu simulated by the three CPSs. Various CPSs have their specific systematic biases that are different from each other. Positive biases are found in Yangtze Meiyu rainfall amount simulations by Emanuel and Grell schemes in most years, while negative biases prevail in the simulations using the Kuo scheme. Fifty-five–year mean biases in the simulations with the three CPSs (Table 1) indicate that the bias for the Emanuel scheme is 0.74mm/d, which is much smaller than that for the other two CPSs. This result again indicates that the Emanuel scheme preforms better in Yangtze Meiyu rainfall amount simulation than the other two CPSs.
Since all the three CPSs show systematic errors in the simulation of Yangtze Meiyu, observed and simulated normalized anomalies of Yangtze Meiyu simulated are calculated (Figure 2B). The normalized anomalies can represent precipitation anomalies after eliminating the systematic errors of precipitation simulated by RegCM4. As shown in Figure 2B, the three cCPSs can well simulate the variations in Yangtze Meiyu rainfall amount in the middle and lower reaches of the Yangtze River.
Next, the impacts of the CPSs on simulating the interannual variation of Yangtze Meiyu are analyzed. Figure 3A displays the interannual variations of the observed and simulated Yangtze Meiyu rainfall amount. As shown in Figure 3A, the interannual variations of the Yangtze Meiyu rainfall amount simulated by the three CPSs are very consistent with the observations, and the correlation coefficients between the observations and simulations by the three CPSs are high and very close to each other (Table 2), indicating that all the three CPSs have a strong and similar capacity in simulating the interannual variation of Yangtze Meiyu rainfall amount. Note that the correlation coefficients between the interannual components of observations and simulations are higher than those between the simulations of original Yangtze Meiyu itself and observations, suggesting that the relatively poor performance in the simulation of the other time-scale variation of Yangtze Meiyu rainfall drags down the overall performance in the simulation of the variation of the original amount of Yangtze Meiyu rainfall. It is demonstrated by the larger biases of the interdecadal variation simulated by the three CPSs than by those of interannual variations. It can be found from Figure 3B that all the three CPSs perform poorly in the simulating the phase of interdecadal variations of Yangtze Meiyu rainfall amount before 1972. They also cannot reproduce the magnitude of the interdecadal variation of Yangtze Meiyu after 2000. Correlation coefficients between observed and simulated interdecadal variations of Yangtze Meiyu rainfall amount obtained by all the three CPSs are smaller than those between observed and simulated precipitation, suggesting that RegCM4’s capability for the simulation of the interdecadal variation of Yangtze Meiyu rainfall amount is lower than its capability for the simulation of the interannual variation of Yangtze Meiyu rainfall amount. This degradation of capability in simulating the interdecadal variation of Meiyu by a RCM is due to the weak signal of interdecadal variation in the large-scale forcing (Hu et al., 2016). Hu et al. (2016) also found that the signal of interannual variation is the strongest in large-scale forcing. Therefore, no matter what CPS is implemented, RCM can well catch the interannual signal and realistically simulate the interannual variation of Yangtze Meiyu rainfall amount. However, the signals of interdecadal change are always weak in large-scale forcing, which makes it hard for RCMs to catch such signals. As a result, the RCM simulation of the interdecadal variation of Yangtze Meiyu is not as good as its simulation of interannual variation.
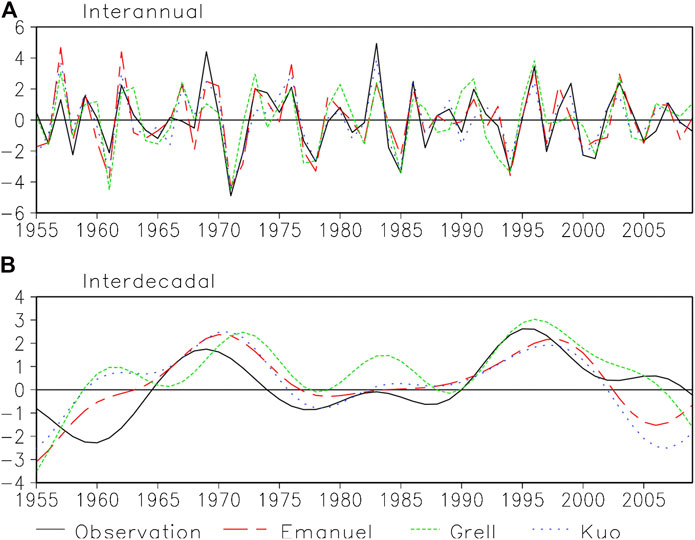
FIGURE 3. (A) Interannual and (B) interdecadal variations of Yangtze Meiyu from observations (black solid line) and simulations by the Emanuel scheme (red long-dashed line), the Grell scheme (green short-dashed line), and the Kuo scheme (blue dotted line) (unit: mm/day).

TABLE 2. Correlation coefficients of interannual and interdecadal changes of simulated Yangtze Meiyu with observations.

TABLE 3. Spacial correlation coefficients between simulations and observations of Yangtze Meiyu averaged over the 55-year period (a) and its interannual (b) and interdecadal (c) variations.
In addition, comparison of interdecadal variations of Yangtze Meiyu simulated by various CPSs shows that the correlation coefficient between observations and simulations by the Emanuel CPS is the highest (0.71), followed by the Grell CPS (0.61), and the worst is the Kuo CPS (0.50). The above results indicate that the capability of the Emanuel CPS is much better than that of the other two CPSs for the simulation of interdecadal variations of Yangtze Meiyu. Because the Emanuel CPS performs better in the simulation of both interannual and interdecadal variations of Yangtze Meiyu, its overall performance in the simulation of the total amount of Yangtze Meiyu is also the best among the three CPSs. Although the Kuo scheme can simulate the interannual variation of Yangtze Meiyu well, its overall performance in simulating the variation of Yangtze Meiyu rainfall amount is dragged down by its poor performance in simulating the interdecadal variation of Yangtze Meiyu rainfall amount. This further illustrates that various CPSs in the RCM have quite different responses to interdecadal variation signals in the large-scale forcing, although their responses to signals of interannual variation are similar.
In addition to the analysis of the Yangtze Meiyu changes simulated by the three CPSs, the simulated atmospheric circulation is also analyzed. It is well known that precipitation can persist over the middle and lower reaches of the Yangtze River in the Meiyu season only when the appropriate large-scale circulation remains stable. Generally, three external conditions are required for maintaining the Yangtze Meiyu: a stable WPSH with its ridge line located near 28°N, a stable blocking high in the north, and continuous water vapor transport to the middle and lower reaches of the Yangtze River (Wang, 1992; Ding et al., 2010; Chen and Zhai, 2016). Figure 4 shows the average precipitation distribution in the Meiyu season over the middle and lower reaches of the Yangtze River during the 55-year period of 1955–2009 from observations and simulations as well as the 500-hPa large-scale circulation patterns. It can be found from the observation (Figure 4A) that the main rain belt during the Meiyu season is located in the middle and lower reaches of the Yangtze River, and the WPSH is south of the Meiyu rain belt. Comparing the simulation with the observation, it is found that the three CPSs can realistically simulate the large-scale circulation at 500 hPa, such as the location and intensity of the WPSH, and the simulated 500-hPa circulation patterns by the three CPSs are very similar. In addition to the 500-hPa circulation, the simulated circulation at 850 hPa by the three CPSs are basically the same too. The consistency of the simulated atmospheric circulation by different CPSs is due to the constraint of the lateral boundary condition. Note that the model domain in our study is small and the large-scale lateral boundary condition forcing is strong and has great impacts on the simulated atmospheric circulation in the internal model domain. Therefore, the simulated atmospheric circulation at the lower and middle levels is mainly determined by the strong forcing of lateral boundary conditions, instead of the internal physical process scheme (such as the CPS).
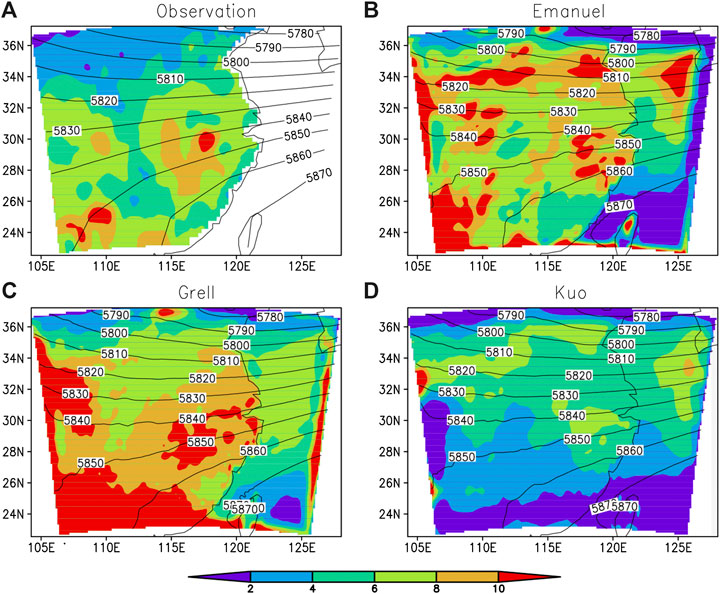
FIGURE 4. Yangtze Meiyu distribution (shaded) and 500-hPa geopotential height (contours, unit: gpm) averaged over the 55-year period from 1955 to 2009 for observations and simulations by the Emanuel, Grell, and Kuo schemes.
However, obvious differences can be found in precipitation distribution simulated by the three CPSs. The Grell and Emanuel schemes significantly overestimate precipitation, while the Kuo scheme underestimates precipitation. Besides, in addition to the large precipitation area in the middle and lower reaches of the Yangtze River, the Emanuel and Kuo schemes also produce a fictitious rain band to the north of the middle and lower reaches of the Yangtze River. The differences in the simulated distribution of Yangtze Meiyu indicate that in addition to large-scale circulation, the physical parameterization scheme used in the model also has great impacts on the precipitation simulation, especially in summer, when the large-scale forcing is weaker than that in the winter and local convection becomes more important for precipitation (Giorgi et al., 1999). Therefore, under the same large-scale atmospheric circulation, sdifferent CPSs yield different Yangtze Meiyu distributions.
Model Convergence
In addition to the total Yangtze Meiyu amount, the performances of three CPSs in simulating the distribution of Yangtze Meiyu are also evaluated. The spatial correlation coefficients between the simulations and observations of annual Yangtze Meiyu and its interannual and interdecadal variation components over the middle and lower reaches of the Yangtze River are calculated (Figure 4). It can be found from Figure 5 that the three CPSs have a certain degree of uncertainty in the simulation of the distribution of Yangtze Meiyu in different years. Overall, the Grell scheme can best simulate the distribution of Yangtze Meiyu in most years, and the performance of the Kuo scheme is the worst, which can also be supplemented by the correlation coefficients between the simulation and observation (Table 3). In addition, Figure 5 also indicates that the Yangtze Meiyu distributions simulated by the three CPSs are quite different in some years, suggesting a poor convergence of the model. However, the differences are small in the other years, indicating a tendency toward better convergence. To further investigate this variation of the model convergence, a convergence index (CI) is designed to describe the model convergence in simulating the spatial distribution of Yangtze Meiyu by the three CPSs, which can be written as
where
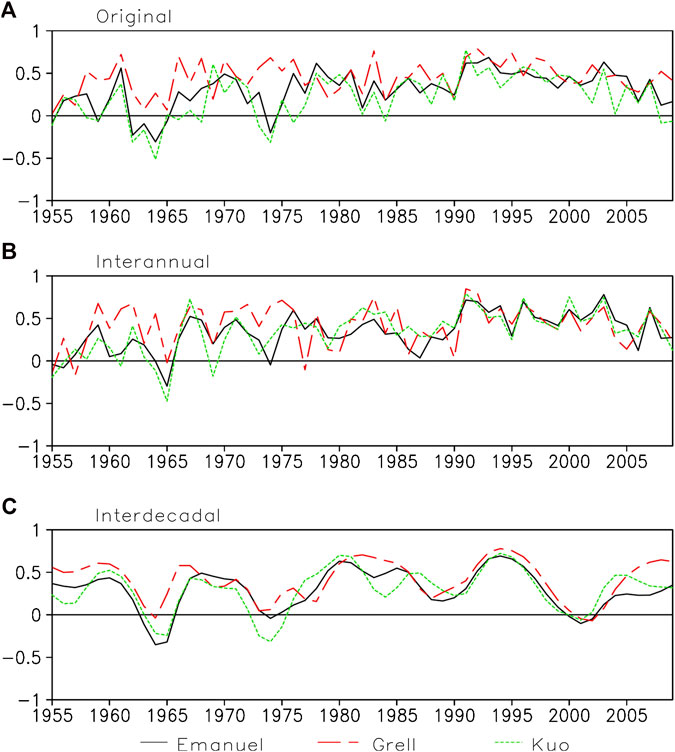
FIGURE 5. Evolution of the spatial correlation coefficients between simulations and observations of annual Yangtze Meiyu rainfall (A) and its interannual (B) and interdecadal (C) variations.
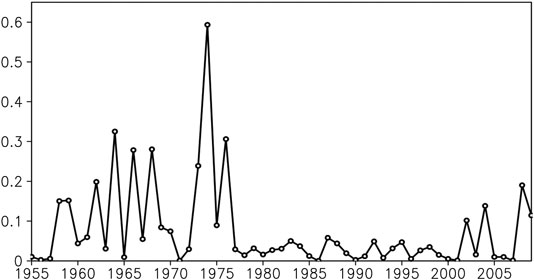
FIGURE 6. Evolution of the convergence index of the simulated spatial distribution of Yangtze Meiyu by the three cumulus parameterization schemes. The smaller the index, the stronger the convergence.
Why the model convergence changes in the late 1970s? To find the reason, the circulation patterns in some typical years with large and small differences in Yangtze Meiyu between observations and simulations are analyzed, respectively. Several representative years are selected to demonstrate their specific characteristics. The years 1964 (Figure 7) and 1974 (Figure 8) are two typical years with large differences between observations and simulations, whereas 1992 (Figure 9) and 1993 (Figure 10) are selected as two typical years with little difference in the distribution of Yangtze Meiyu. As shown in Figures 7 and 8, the intensity of WPSH is weak and located further northeast than its normal position, and the East Asian summer monsoon is strong. Although the circulation patterns in the 2 years simulated by the three CPSs are similar, large differences are found in the simulated precipitation distribution. This further demonstrated that the circulation simulated by RCM is not the only factor that determines the distribution of precipitation. A good simulation of the circulation does not necessarily guarantee a good simulation of precipitation distribution (Zhong et al., 2010a; Zhong et al., 2010b). Among the three CPSs used in the present study, the position of the rain belt simulated by the Grell scheme is the closest to the observation, although it overestimates the intensity. However, the Kuo scheme and the Emanuel scheme cannot reproduce the location of the main rain belt in the middle and lower reaches of the Yangtze River, and their simulated rain belt shifts northward to North China. The simulated rainfall by the Kuo scheme is significantly underestimated. The Emanuel scheme overestimates the rainfall in the north of the Yangtze River.
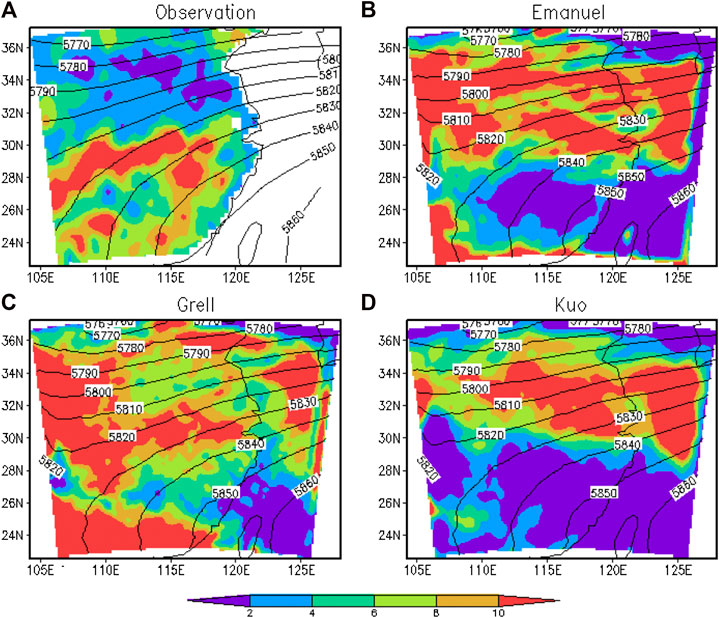
FIGURE 7. Spatial distributions of precipitation (unit: mm/day) and 500-hPa geopotential height (unit: gpm) during the Meiyu season of 1964 from observations and simulations by the Emanuel, Grell, and Kuo schemes.
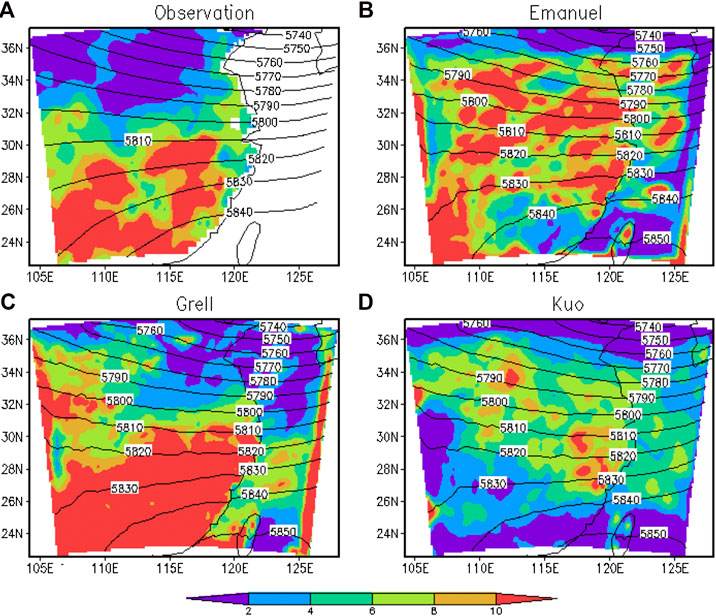
FIGURE 8. Spatial distributions of precipitation (unit: mm/day) and 500- hPa geopotential height (unit: gpm) during the Meiyu season of 1974 from observations and simulations by the Emanuel, Grell, and Kuo schemes.
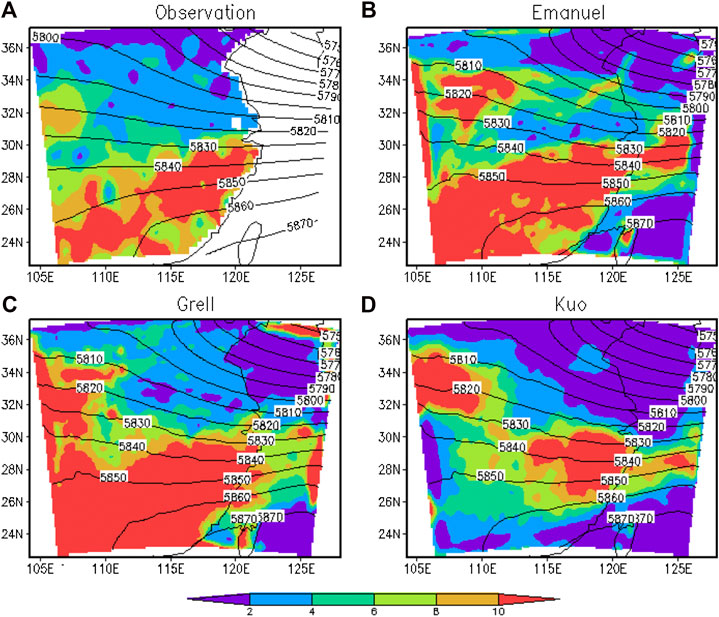
FIGURE 9. Spatial distributions of precipitation (unit: mm/d) and 500-hPa geopotential height (unit: gpm) during the Meiyu season of 1992 from observations and simulations by the Emanuel, Grell, and Kuo schemes.
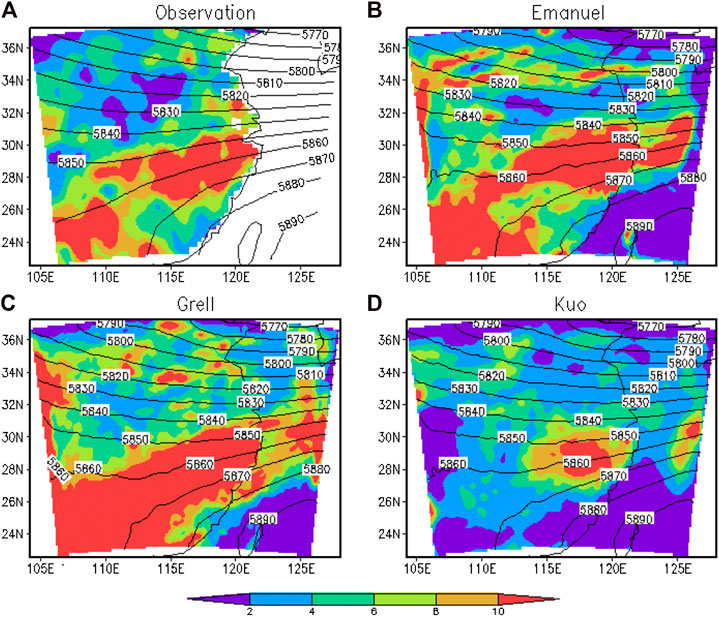
FIGURE 10. Spatial distributions of precipitation (unit: mm/d) and 500-hPa geopotential height (unit: gpm) during the Meiyu season of 1993 from observations and simulations by the Emanuel, Grell, and Kuo schemes.
Let us take a look at the circulation characteristics in the years with small differences in Yangtze Meiyu between observations and simulations. The years 1992 (Figure 9) and 1993 (Figure 10) are selected as two typical years with little difference in the distribution of Yangtze Meiyu. Observations shown in Figures 9 and 10 indicate that the WPSH is located further southwest than its normal position, and the East Asian summer monsoon is weaker than normal, and the rain belt shifted southward in these two years. All the three CPSs can realistically simulate the precipitation distributions and circulation patterns in these two years. The Kuo scheme still severely underestimates the precipitation intensity, but the simulated rain belt no longer shifts northward.
Through the above analysis, it can be found that the model convergence of Yangtze Meiyu distribution simulated by different CPSs is closely related to the intensity of the East Asain summer monsoon (EASM), the pattern of the monsoon circulation system, and the location of the rain belt each year. To demonstrate this relationship between the model convergence and the intensity of EASM, the East Asian summer monsoon index (EASMI) proposed by Li and Zeng (2002), which is a good proxy of the intensity of the monsoon, is used to compare with the convergence index. Both of them are filtered into interdecadal components (Figure 11). It can be found from Figure 11 that the interdecadal variation of the convergence index is basically consistent with the interdecadal variation of EASMI. The correlation coefficient between them is 0.54, which can pass the significance test and further demonstrate the close relationship between the model convergence and EASM intensity.
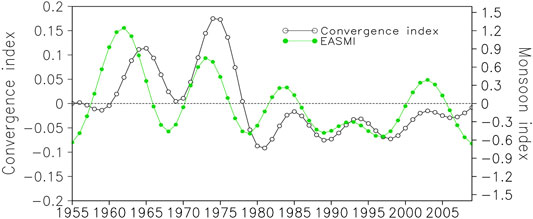
FIGURE 11. Evolution of interdecadal components of the convergence index (black line with hollow circles) and monsoon index (green line with solid circles).
It is well known that the distribution of the summer rain belt is closely related to the strength of the EASM: when the EASM is strong and the WPSH is located further northeast, the monsoon southwesterlies can reach North China without being blocked by the WPSH. As a result, more precipitation occurs in North China and less precipitation occurs in the middle and lower reaches of the Yangtze River, and the monsoon rain belt shifts northward than its normal position. On the contrary, when the EASM weakens and the WPSH shifts to the southwest, the monsoon southwesterlies are blocked by the WPSH and can only reach the Yangtze–Huai River basin, where they converge with the cold air and form precipitation. In this situation, more precipitation occurs in the Yangtze–Huai River basin and less precipitation occurs in North China. The rain band shifts to the south of its normal position (Zhu et al., 2008). It can be found from Figure 6 that large differences in the distribution of Yangtze Meiyu between simulations and observations are mostly concentrated in the years when the monsoon is strong and the WPSH is located further northeast. In these years, the strong monsoon transports huge amounts of water vapor to the north of the Yangtze River, and the Emanuel and Kuo schemes tend to convert more water vapor into precipitation and produce excessive precipitation there. Then, the simulated rain band by the Emanuel and Kuo schemes shifts to the north of its normal position. In the years when the monsoon is weak and the WPSH is located more southwest, the water vapor transport to the north of the Yangtze River decreases in these years due to the weak monsoon, which makes the Emanuel and Kuo schemes unable to produce precipitation in the north of the Yangtze River. Precipitation is concentrated in the middle and lower reaches of the Yangtze River. The northward deviation of the rain band simulated by the Emanuel and Kuo schemes decreases.
Summary and Discussions
In this study, the impacts of CPSs on the simulation of interannual and interdecadal variations of Yangtze Meiyu and the model convergence are investigated by using RegCM4. A multiple 55-year (1955-2009) simulation of Yangtze Meiyu is conducted with different CPSs, including the Emanuel scheme, Kuo scheme, and Grell scheme.
It is found that all the CPSs have good performances and strong convergence in simulating the interannual variation of Yangtze Meiyu rainfall amount. However, large bias and weak model convergence are found in the simulated interdecadal variation of Yangtze Meiyu rainfall amount by the three CPSs. Because the Emanuel CPS has good performance in the simulation of both interannual and interdecadal variations of Yangtze Meiyu, its overall performance in the simulation of the total amount of Yangtze Meiyu is also the best among the three CPSs. The second best CPS is the Grell CPS. and the worst is the Kuo CPS.
Atmospheric circulations can be realistically reproduced by all the three CPSs and are basically the same due to the strong constraint of the lateral boundary condition. The simulated circulation patterns are mainly determined by the strong forcing of lateral boundary conditions, instead of the internal physical process scheme (such as the CPS). However, due to the different triggering mechanisms and moist convective process of different CPSs, the simulated Yangtze Meiyu by different CPSs differs from each other. For example, the convective activity in the Kuo scheme is initiated when the moisture convergence in a column exceeds a given threshold and the vertical sounding is convectively unstable. The Grell scheme parameterization considers clouds as two steady-state circulations: an updraft and a downdraft. Its convection is activated when a lifted parcel attains moist convection. The Emanuel scheme assumes that the mixing in clouds is highly episodic and inhomogeneous and considers convective fluxes based on an idealized model of sub–cloud-scale updrafts and downdrafts. Its convection is triggered when the level of neutral buoyancy is greater than the cloud base level. Therefore, CPS has great impacts on precipitation simulation, especially in summer, when the large-scale forcing is weaker than that in the winter and local convection becomes more important for precipitation.
The model convergence in simulating the distribution of Yangtze Meiyu shows an obvious characteristic of interdecadal variation. During the years with strong summer monsoon and northward rain belt, the model convergence is weak by using different CPSs. On the contrary, during the years with strong and southward rain belt, the model convergence is strong. As a result, with the well-known interdecadal change happening in the late 1970s, the monsoon changes from strong to weak, whereas the model convergence changes from weak to strong.
It is noteworthy that the model convergence of different CPSs will change with the interdecadal variation of monsoon climate background. Weak model convergence will reduce the credibility of the ensemble prediction results in future climate change prediction. Therefore, it is very important to predict the future summer monsoon climate accurately and evaluate the model convergence of RCM cautiously. Then, we can determine the reliability of the ensemble prediction results.
Data Availability Statement
The datasets presented in this study can be found in online repositories. The names of the repository/repositories and accession number(s) can be found below: NCEP/NCAR Reanalysis 1 [https://psl.noaa.gov/data/gridded/data.ncep.reanalysis.html] and HadISST Data [https://www.metoffice.gov.uk/hadobs/hadisst/data/download.html].
Author Contributions
YHu conducted the numerical experiments and analyzed the results. ZZ designed the numerical experiments and revised this paper. YHa analyzed the interannual and interdecadal variations of Meiyu in simulation. YS provided the data for this work. YZ and LY revised this paper and polish the English.
Funding
This work is sponsored jointly by the National Key Research and Development Project (2018YFC1505803), National Natural Science Foundation of China (41675077, 41975090, and 41605072), Scientific Research Program of National University of Defense Technology (ZK17-03–22), and Jiangsu Collaborative Innovation Center for Climate Change.
Conflict of Interest
The authors declare that the research was conducted in the absence of any commercial or financial relationships that could be construed as a potential conflict of interest.
References
Anthes, R. A. (1977). A cumulus parameterization scheme utilizing a one-dimensional cloud model, Mon. Weather Rev. 105 (3), 270–286. doi:10.1175/1520-0493(1977)105<0270:acpsua>2.0.co;2
Arakawa, A. (1975). “Modelling clouds and cloud processes for use in climate model,” in The physical basis of climate and climate modelling, GARP Publication Series, No. 16 (Geneva, Switzerland: WMO), 183–197.
Chang, C. P., Zhang, Y. S., and Li, T. (2000). Interannual and interdecadal variations of the East Asian summer monsoon and tropical pacific SSTs. Part I: Roles of the subtropical ridge. J.Climate 13, 4310–4340. doi:10.1175/1520-0442(2000)013<4310:IAIVOT>2.0.CO;2
Chen, S. J., Kuo, Y. H., Wang, W., Tao, Z. U., and Cui, B. (1998). A modeling case study of heavy rainstorms along the Mei-Yu front. Mon. Weather Rev. 126 (9):2330–2351. doi:10.1175/1520-0493(1998)126<2330:amcsoh>2.0.co;2
Chen, Y., and Zhai, P. (2016). Mechanisms for concurrent low-latitude circulation anomalies responsible for persistent extreme precipitation in the Yangtze river valley. Clim. Dynam. 47, 989–1006. doi:10.1007/s00382-015-2885-6
Dickinson, R., Errico, R., Giorgi, F., and Bates, G. (1989). A regional climate model for the western united states. Climate Change, 15, 383–422. doi:10.1007/bf00240465.
Dickinson, R. E., Henderson-Sellers, A., and Kennedy, P. J. (1993). Biosphere-atmosphere transfer scheme (bats) version 1e as coupled to the ncar community climate model, National Center for Atmospheric Research, Technical Report.
Ding, Y. H. (1992). Summer monsoon rainfalls in China. J. Meteorol. Soc. Jpn. 70, 373–396. doi:10.1007/s00376-001-0012-6
Ding, Y. H., and Chan, J. C-L. (2005). The East Asian summer monsoon: an overview. Meteorol. Atmos. Phys. 89, 117–142. doi:10.1007/s00703-005-0125-z
Ding, Y. H., Wang, Z., and Sun, Y. (2008). Inter-decadal variation of the summer precipitation in East China and its association with decreasing Asian summer monsoon. Part I: observed evidences. Int. J. Climatol. 28, 1139–1161. doi:10.1002/joc.1759
Ding, Z. Y., Liu, C. H., Chang, Y., Shen, X. Y., He, J. H., and Xu, H. M. (2010). Study of double rain bands in a persistent rainstorm over South China. J. Trop. Meteorol. 16, 380–389. doi:10.3969/j.issn.1006-8775.2010.04.010.
Donner, L., Kuo, H-L., and Pitcher, E. (1982). The significance of thermodynamic forcing by cumulus convection in a general circulation model. J. Atmos. Sci. 39. 2159–2181. doi:10.1175/1520-0469(1982)039<2159:TSOTFB>2.0.CO;2.
Eliasen, E. (1958). A study of the long atmospheric waves on the basis of zonal harmonic analysis. Tellus, 10, 206–215.
Emanuel, K. A. (1991). A scheme for representing cumulus convection in large-scale models. J. Atmos. Sci. 48 (21), 2313–2335. doi:10.1175/1520-0469(1991)048<2313:asfrcc>2.0.co;2
Emanuel, K. A., and Zivkovic-Rothman, M. (1999). Development and evaluation of a convection scheme for use in climate models. J. Atmos. Sci. 56, 1766–1782. doi:10.1175/1520-0469(1999)056<1766:daeoac>2.0.co;2
Fu, C., Wei, H., and Chen, M. (1998). Simulation of the evolution of summer monsoon rainbelts over eastern China from regional climate model. Chinese J. Atmos. Sci. 22 (4), 522–534
Gao, Y., Wanga, C. H., and Jianga, D. (2015). An intercomparison of CMIP5 and CMIP3 models for interannual variability of summer precipitation in Pan-Asian monsoon region. Int. J. Climatol. 35 (13), 3770–3780. doi:10.1002/joc.4245
Giorgi, F. (1990). Simulation of regional climate using a limited area model nested in a general circulation model. J. Climate 3, 941–963. doi:10.1175/1520-0442(1990)003<0941:SORCUA>2.0.CO;2
Giorgi, F., Coppola, E., Solmon, F., Mariotti, L., Sylla, M. B., Biand, X., et al. (2012). RegCM4: model description and preliminary tests over multiple CORDEX domains. Clim. Res. 52, 7–29. doi:10.3354/cr01018
Giorgi, F., and Mearns, L. O. (1999). Introduction to special section: regional climate modeling revisited. J. Geophys. Res., 104: 6335–6352. doi:10.1029/98jd02072
Giorgi, F., and Shields, C. (1999). Tests of precipitation parameterizations available in latest version of NCAR regional climate model (RegCM) over continental United States. J. Geophys. Res.: Atmosphere. 104, 6353–6375. doi:10.1029/98JD01164
Grell, G. (1993). Prognostic evaluation of assumptions used by cumulus parameterizations. Mon. Weather Rev. 121, 764–787. doi:10.1175/1520-0493(1993)121<0764:peoaub>2.0.co;2
Holtslag, A. A. M., de Bruijn, E. I. F., and Pan, H.-L. (1990). A high resolution air mass transformation model for shortrange weather forecasting. Mon. Weather Rev. 118, 1561–1575. doi:10.1175/1520-0493(1990)118<1561:ahramt>2.0.co;2
Hu, Y., Zhong, Z., Lu, W., Zhang, Y. C., and Sun, Y. (2016). Evaluation of RegCM4 in simulating the interannual and interdecadal variations of Meiyu rainfall in China. Theor. Appl. Climatol. 124, 757–767. doi:10.1007/s00704-015-1459-1
Huang, R., Chen, J., Huang, G., and Zhang, Q. (2006). The quasi-biennial oscillation of summer monsoon Rainfall in China and its cause. Chinese J. Atmos. Sci. 30 (4), 545–560.
Huang, R. H., Huang, G., and Wei, Z. G. (2004). “Climate variations of the summer monsoon over China.” in East Asian monsoon. Editor C. P. Chang (Singapore: World Scientific), 213–270.
Jiang, D. B., and Tian, Z. P. (2013). East Asian monsoon change for the 21st century: results of CMIP3 and CMIP5 models. Chin. Sci. Bull. 58 (12), 1427–1435. doi:10.1007/s11434-012-5533-0
Kiehl, J. T., Hack, J. J., Bonan, G. B., Boville, B. A., Breigleb, B. P., Williamson, D., et al. (1996). Description of the ncar community climate model (ccm3). National Center for Atmospheric Research, Technical Report NCAR/TN-420+STR,
Lee, D.-K., Cha, D.-H., and Choi, S.-J. (2005). A sensitivity study of regional climate simulation to convective parameterization schemes for 1998 East Asia summer monsoon. Terr. Atmos. Ocean Sci. 16, 989–1015. doi:10.3319/tao.2005.16.5.989(rcs)
Li, J. P., and Zeng, Q. C. (2002). A unified monsoon index. Geophys. Res. Lett. 29 (8), 1274. doi:10.1029/2001GL01387
Li, J. P., and Zeng, Q. C. (2003). A new monsoon index and the geographical distribution of the global monsoons. Adv. Atmos. Sci. 20, 299–302. doi:10.1007/s00376-003-0016-5
Li, J. P., and Zeng, Q. C. (2005). A new monsoon index, its interannual variability and relation with monsoon precipitation. Clim. Environ. Res. 10 (3), 351–365. doi:10.3878/j.issn.1006-9585.2005.03.09
Liang, X. Z., Xu, M., Kunkel, K., Grell, G., and Kain, J. S. (2007). Regional climate model simulation of U.S.–Mexico summer precipitation using the optimal ensemble of two cumulus parameterizations. J. Clim. 20, 5201–5207. doi:10.1175/JCLI4306.1.
Miao, J. H., and Lau, K-M. (1990). Interannual variability of East Asian monsoon rainfall. Quart.J.AppZ. Meteor. l, 377–382.
Nellie, E., Bi, X., Filippo, G., Badrinath, N., Pal, J., Solmon, F., et al. (2014). Regional Climate Model RegCM Reference Manual Version 4.6 The Abdus Salam International Centre for Theoretical Physics, Strada Costiera, Trieste, Italy, Earth System Physics Section ‐ ESP. J. Geophys. Res. 113 (G1):G01021. doi:10.1029/2007jg000563
Nitta, T., and Hu, Z.‐Z. (1996). Summer climate variability in China and its association with 500 hPa height and tropical convection. J. Meteor. Soc. Japan 74, 425–445.
https://doi.org/10.2151/jmsj1965.74.4_425CrossRef Full Text | Google Scholar
Qian, W., and Qin, A. (2008). Precipitation division and climate shift in China from 1960 to 2000. Theor. Appl. Climatol. 93, 1–17. doi:10.1007/s00704-007-0330-4
Rajendran, K., Nanjundiah, R. S., and Srinivasan, J. (2002). Comparison of seasonal and intraseasonal variation of tropical climate in NCAR CCM2 GCM with two different cumulus schemes. Meteorol. Atmos. Phys. 79, 57–86. doi:10.1007/s703-002-8229-0
Song, S., Tang, J., and Chen, X. (2011). Impacts of spectral nudging on the sensitivity of a regional climate model to convective parameterizations in East Asia. Acta Meteorol. Sin. 25 (1), 63–77. doi:10.1007/s13351-011-0005-z
Sperber, K. R., Annamalai, H., Kang, I-S., Kitoh, A., Moise, A., Turner, A., et al. (2013). The Asian summer monsoon: an intercomparison of CMIP5 vs. CMIP3 simulations of the late 20th century. Clim. Dynam. 41, 2711–2744. doi:10.1007/s00382-012-1607-6
Tao, S. Y., and Chen, L. (1987). “A review of recent research on the East Asia summer monsoon over China,” in Monsoon meteorology. Editors P. C. Chang and T. N. Krishnamurti (London, UK: Oxford University Press), 50–92.
Tian, S. F., and Yasunari, T. (1992). Time and space structure of interannual variations in summer rainfall over China. J.Meteor. Soc.Japan 70, 585–596. doi:10.2151/jmsj1965.70.1b_585
Wang, B., Kang, I. S., and Li, J. Y. (2004). Ensemble simulation of Asian-Australian monsoon variability by 11 AGCMs. J. Clim. 17, 803–818. doi:10. 1175/1520-0442(2004)0172.0.CO;2
Wang, B., Wu, R., and Lau, K. (2001). Interannual variability of the Asian summer monsoon: Contrasts between the Indian and the western North Pacific-East Asian monsoons. J. Climate 14, 4073–4090. doi:10.1175/1520-0442(2001)014<4073:IVOTAS>2.0.CO;2
Wang, Y. (1992). Effects of blocking anticyclones in Eurasia in the rainy season (Meiyu/Baiu season). J. Meteorol. Soc. Jpn. 70, 929–950. doi:10.2151/jmsj1965.70.5_929
Yu, R., Li, W., Zhang, X., Liu, Y., Yu, Y., Liu, H., et al. (2000). Climatic features related to eastern China summer rainfalls in the NCAR CCM3. Adv. Atmos. Sci. 17, 503–518.
Zeng, G., Sun, Z., Wang, W. C., and Min, J. (2007). Interdecadal variability of the East Asian summer monsoon and associated atmospheric circulations. Adv. Atmos. Sci. 24 (5), 915–926.
Zhang, G. J. (1994). Effects of cumulus convection on the simulated monsoon in a general circulation model. Mon. Weather Rev. 122, 2022–2038. doi:10.1175/1520-0493(1994)122<2022:eoccot>2.0.co;2
Zhang, G. J., and Mcfarlane, N. (1995). Sensitivity of climate simulations to the parameterization of cumulus convection in the Canadian climate Centre general circulation model. Atmosphere-ocean. 33, 407–446. doi:10.1080/07055900.1995.9649539.
Zhou, T., Wu, B., and Wang, B. (2009). How well do atmospheric general circulation models capture the leading modes of the interannual variability of Asian-Australian monsoon?. J. Clim. 22, 1159–1173. doi:10.1175/2008JCLI2245.1
Zhou, T., Yu, R., Li, H., and Wang, B. (2008). Ocean forcing to changes in global monsoon precipitation over the recent half century. J. Climate 21, 3833–3852.
Keywords: Meiyu, interannual, interdecadal, cumulus parameterization scheme, RegCM4
Citation: Hu Y, Zhong Z, Ha Y, Sun Y, Zhu Y and Yu L (2020) Impacts of Cumulus Parameterization Schemes on the Simulation of Interannual and Interdecadal Variation of Meiyu in the Middle and Lower Reaches of the Yangtze River by Using Regional Climate Model 4. Front. Earth Sci. 8:588038. doi:10.3389/feart.2020.588038
Received: 28 July 2020; Accepted: 07 September 2020;
Published: 06 November 2020.
Edited by:
Lei Zhang, University of Colorado Boulder, United StatesReviewed by:
Xuguang Sun, Nanjing University, ChinaHaiming Xu, Nanjing University of Information Science and Technology, China
Copyright © 2020 Hu, Zhong, Ha, Sun, Zhu and Yu. This is an open-access article distributed under the terms of the Creative Commons Attribution License (CC BY). The use, distribution or reproduction in other forums is permitted, provided the original author(s) and the copyright owner(s) are credited and that the original publication in this journal is cited, in accordance with accepted academic practice. No use, distribution or reproduction is permitted which does not comply with these terms.
*Correspondence: Yijia Hu, bGdkeGh1eWlqaWFAMTYzLmNvbQ==