 Roger R. Fu1*
 Kimberly Hess1
 Plinio Jaqueto2,3
 Valdir F. Novello3
 Tyler Kukla4
 Ricardo I. F. Trindade3Nicolás M. Stríkis5Francisco W. Cruz Jr.3Oren Ben Dor1,6
- 1Department of Earth and Planetary Sciences, Harvard University, Cambridge, MA, United States
- 2Department of Earth and Environmental Sciences, University of Minnesota, Minneapolis, MN, United States
- 3Instituto de Astronomia, Geofísica e Ciências Atmosféricas, Universidade de São Paulo, São Paulo, Brazil
- 4Department of Geological Sciences, Stanford University, Stanford, CA, United States
- 5Universidade Federal Fluminense, Niterói, Brazil
- 6Department of Physics, Harvard University, Cambridge, MA, United States
Quantum diamond microscope (QDM) magnetic field imaging is a recently developed technique capable of mapping magnetic field sources in geologic samples at 1 micrometer resolution. Applying QDM imaging to speleothems can provide high‐resolution time series of detrital input into the cave environment, which, in turn, can yield useful paleoenvironmental information. Here we map the magnetic field over a speleothem from midwest Brazil over a 174 year timespan with annual to sub-annual resolution and perform backfield remanence acquisition experiments to quantify changes in the magnetic grain population through time. We find that magnetic particles occur in highly enriched layers of 10–100 µm thickness that sample the same detrital source population. Combined with petrographic observations and electron microprobe mapping of Mg and Ca, we conclude that detrital enrichment in our sample is caused by drier conditions leading to slow or halted speleothem growth. This interpretation is compatible with oxygen isotopic data and implies that speleothem magnetism can be used to infer the past occurrence of drought and potentially quantify their duration. Future high-resolution magnetic imaging of speleothems may provide additional insight into the mechanism of detrital enrichment and establish their role as a proxy for local moisture and infiltration.
Introduction
Environmental magnetism studies seek to extract information about past Earth surface conditions using rock magnetic techniques, which can quantify properties of Fe-bearing mineral populations in sediments. Compared to geochemical and isotopic techniques, rock magnetism can characterize mineral populations at extremely low concentrations and is uniquely sensitive to some parameters such as grain size and Fe oxidation state. As such, environmental magnetism studies provide unique insight into past climates and environments. Although full applications of environmental magnetism are reviewed elsewhere (Verosub and Roberts, 1995; Liu et al., 2012), prominent examples include quantifying climatic and chemical conditions during deposition [e.g. (Maher et al., 1994; Liu et al., 2007; Slotznick et al., 2018)], identifying the provenance of detrital particles [e.g. (Blundell et al., 2009; Maher et al., 2009)], and understanding the mechanisms of pedogenesis and diagenesis (Bloemendal et al., 1992; Roberts, 2015).
Most environmental magnetism studies are based on measurements of magnetic properties in millimeter to centimeter scale specimens, hereafter referred to as bulk specimens. In the case of sedimentary samples deposited over time, analyses of bulk specimens at a range of stratigraphic heights can be compiled to construct a time series of magnetic properties, which can in turn be interpreted to record paleoenvironmental change. The temporal resolution of such studies is limited by the minimum volume of sample that retains sufficient magnetic content to be detectable using available instrumentation.
By recovering maps of magnetic fields with sub-millimeter resolution, magnetic imaging is a complementary approach that can circumvent spatial resolution limitations inherent to bulk specimens analyses. In addition to providing high temporal resolution, spatially resolved maps of magnetic field sources can pinpoint the mineralogical source of magnetic field signal. Combined with microscopy over the same regions of interest, this information permits the definitive attribution of a given magnetic signal to specific grain populations.
Magnetic field imaging techniques are therefore well-suited for analyzing environmental magnetism records that display heterogeneity at fine spatial scales. Cave deposits, or speleothems, hold unique potential for generating high-resolution time series due to the availability of high-precision U-Th age dating. Intensive study over the past decades has demonstrated their potential to retain paleoenvironmental information through a range of chemical and isotopic systems [e.g., McDermott (2004)]. With respect to magnetic studies, bulk samples extracted from speleothems have been used to show that the concentration of ferromagnetic minerals covary with other paleoenvironmental proxies. In mid-latitudes, magnetization intensity has been found to correlate with oxygen isotopic variations (Bourne et al., 2015) as well as with organic proxies for moisture (Zhu et al., 2017). These correlations, observed at the centennial to millennial timescale, may be due to greater production and transport of detrital magnetite into cave environments during times of heavier rainfall, which drive shifts in other moisture proxies.
Other mid-latitude speleothem studies have shown no clear relationship between stable isotopic and magnetic variations, finding instead a correlation between magnetism and other proxies for local detrital input such as speleothem coloration (Font et al., 2014). Finally, one multi-proxy study of a tropical speleothem from midwest Brazil has suggested that, at a multidecadal scale, drier periods with sparse vegetation dominated by plants with C4 photosynthesis lead to soil erosion and, therefore, enhanced flux of magnetic particles into the cave environment (Jaqueto et al., 2016).
All studies of speleothem magnetism described above used bulk specimens in their analyses, thus limiting temporal resolution to multi-decadal to millennial timescales. Although these records are suitable for understanding long-term climatic variations driven by insolation changes at these timescales, analysis with higher resolution time series, such as provided by magnetic field imaging, can potentially provide complementary insights. First, time series with annual or even finer resolution may reveal rapid paleoenvironmental changes occurring on these timescales such as effects of the El Niño Southern Oscillation or extreme climate events such as major floods. Second, high resolution records can help identify underlying forces that drive changes in the magnetic content of speleothems. For example, a seasonally resolved record would test the hypothesis that enhanced summer precipitation is responsible for enrichment of magnetic content in North American speleothems (Bourne et al., 2015). Finally, records with annual resolution over historical times would also allow comparison to instrumental or written records of environmental forcings such as precipitation, runoff, and soil pH. Relationships established through these direct comparisons may lead to more robust interpretations of speleothem magnetism records in deeper time.
Magnetic field imaging techniques used in speleothem analyses have thus far been limited to superconducting quantum interference device (SQUID) microscopy, which is capable of ∼150 µm resolution. In an analysis of ferromagnetic particle distribution in a North American speleothem deposited over a 500 years interval, Feinberg et al. (2020) found that magnetized layers correspond to major floods, showing that, at least in some settings, detrital enrichment in speleothems is a tracer of extreme precipitation events. However, the resolution of the SQUID microscope was unable to clearly separate individual flooding events during intervals where multiple events occurred within the same decade. Furthermore, because major floods typically occur after elevated precipitation over multiple timescales spanning days to years (Seiler et al., 2002), depositional layers from major floods may be accompanied by minor events that cannot be resolved by the SQUID microscope in the studied speleothem.
Although Feinberg et al. (2020) established a flood origin for magnetic particle enrichment in their sample, the mechanism responsible for incorporating magnetic particles in other speleothems remains poorly understood. High-resolution magnetic imaging of speleothems from distinct climate settings may be useful for identifying the mechanism of magnetic particle enrichment and thereby establishing their paleoenvironmental interpretation. Acquiring such a process-based understanding of magnetic particle enrichment is critical for the broader application of speleothem magnetism as a paleoclimate proxy.
High‐resolution mapping of different speleothems using the recently developed quantum diamond microscope (QDM), which has 30–100 times higher spatial resolution than the SQUID microscope, can potentially locate individual magnetic enrichment peaks with higher precision and provide fine details on the distribution of magnetic particles. Combined with other proxy data and petrography, such a high-resolution record can help identify the origin of detrital enrichment and reveal evidence for environmental change immediately before and after discrete depositional events.
In this study we use the QDM to map magnetic field sources in a Brazilian speleothem with annual resolution over a 174 year interval. Leveraging the annual to sub-annual temporal resolution of the analysis, we find that Fe-bearing detritus in the speleothem are highly concentrated in 10–100 µm scale bands that show no resolvable change in rock magnetic properties over the analyzed time interval. Combined with the fine-scale morphology, mineralogy, and composition of the magnetized layers, we conclude that the magnetized layers were deposited during slowdowns or hiatuses in speleothem deposition, possibly coupled with enhanced soil erosion during drier time intervals.
Materials and Methods
We performed QDM imaging on the same speleothem sample from Mato Grosso State, Brazil analyzed for stable isotopes by Novello et al. (2016) and bulk specimens magnetic properties by Jaqueto et al. (2016) (Figure 1). The full candle-type stalagmite, known has ALHO6, was deposited in the Pau D’Alho cave (15°12′20″S, 56°48′41″W) over approximately 1,370 years between 490 CE and 1860 CE with an average deposition rate of 0.17 mm y−1 in the central column. Applying the QDM, which has a minimum pixel size of 1.2 µm and maximum field of view width of 2.25 mm, to the central column of the speleothem would therefore result in approximately 13 years per field of view with a nominal resolution of <1 week, which is too fine to compare to other proxy records. We therefore first binned pixels by a factor of 4 to achieve a spatial resolution of 4.7 µm per pixel, which is more closely matches the length scale of the magnetic signal and increases the signal to noise ratio. We also chose to image an approximately 5 × 10 mm sample with 0.5 mm thickness polished with 1 µm alumina grit extracted from the flank of the speleothem with finer laminae (Figure 2), thereby minimizing the measurement time required for a given timespan.
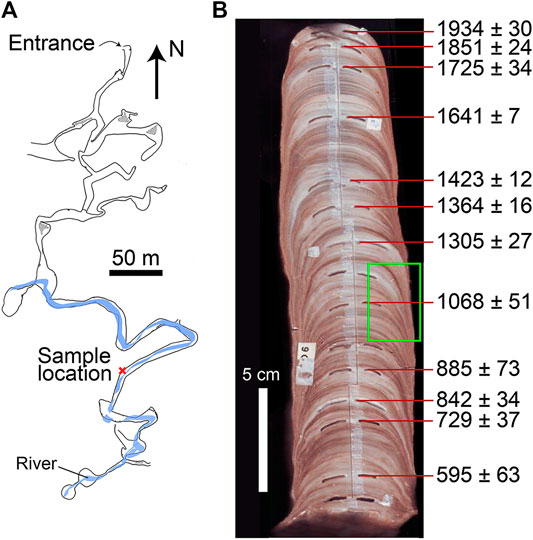
FIGURE 1. (A) Map of the Pau D’Alho cave and (B) optical image of the ALHO6 stalagmite sample. Green region in panel (B) indicates the age range studied in this work. Hashed patches in panel (A) denote collapsed rock piles.
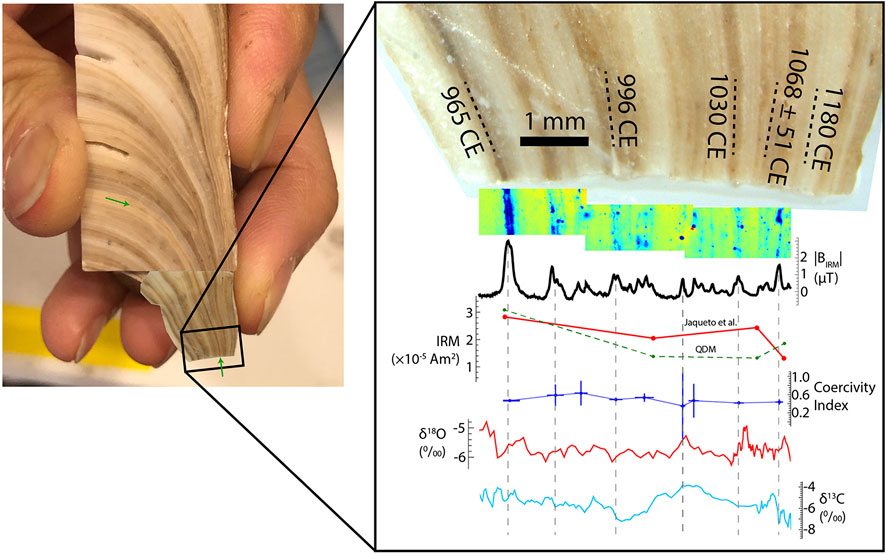
FIGURE 2. Photographs of the measured sections of the ALHO6 speleothem with age dates, magnetic field time series, and δ18O and δ13C data. Age tie point of 1068 CE is based on U-Th dating of laminae while other tie points are interpolated from other U-Th ages based on distances in the speleothem central column. In right panel, first overlay shows the magnetic field map corresponding to a 1.5 T IRM oriented into the mapping plane. BIRM curve is a time series of mean magnetic field intensity computed from the map above. Red and green IRM curves are the bulk samples of Jaqueto et al. (2016) and QDM magnetic field values binned to the same time intervals. Coercivity Index curve is computed for each magnetized band and approximates the fraction of total magnetization with coercivity between 17 and 70 mT. Vertical error bars are 2σ. Oxygen and carbon isotopic data are from Novello et al. (2016). In the left panel, green arrows highlight example of a lamina that shows much stronger coloration in the speleothem flank, although most laminae show greater continuity.
Isotopic studies have shown that kinetic fractionation effects may bias the signal in speleothem flank compared to the central column while paleomagnetic studies have found evidence of grain rotations on inclined speleothem surfaces (Dorale and Liu, 2009; Ponte et al., 2017). However, compiling the anhysteretic remanent magnetization (ARM) susceptibility of 47 speleothem samples with lamina inclination between 34° and 90° showed no correlation between this angle and magnetization intensity (Ponte et al., 2017). Further, all but one prominent dark, magnetized lamina measured in our QDM section can be traced continuously between the speleothem flank and center (Figure 2; see green arrows). The disappearance of this lamina near the central column may be due to a drip water washing effect. Analysis of a speleothem with coarser, flood-deposited detrital particles has shown even stronger effects of drip water washing with pervasive depletion of detrital layers near the central column (Feinberg et al., 2020). Together, these observations imply that the central column of speleothems may not retain the most complete record of detritus deposition and that speleothem flanks should be preferred for measurements of particulate enrichment. We therefore argue that our choice to analyze the speleothem flank does not imply a lower fidelity record of detrital enrichment events compared to analysis of the central column and that changes in the deposition surface angle within our speleothem sample is unlikely to affect the relative intensities of measured peaks.
The compressed spatial scale of the speleothem flank section permitted our measurements, consisting of three tiled fields of view, to cover a 174 year interval between 957 CE and 1131 CE with temporal resolution ranging between 0.08 and 0.93 years per pixel. This period covers the Medieval Climate Anomaly (MCA) that occurred between 950 CE and 1250 CE. In tropical South America, this event was characterized a relatively dry climate caused by a weakened South American Summer Monsoon [SASM; (Vuille et al., 2012; Campos et al., 2019)]. This effect likely had widespread consequences for climate patterns across the South American continent as the SASM is responsible for ∼70% of the rainfall over South America and is considered a key driver for climate variability over the continent.
Each QDM magnetic field map was acquired in an instantaneous bias magnetic field of 0.9 mT, which was reversed repeatedly during the course of measurement to provide a near-zero net bias field [Figure 3; (Glenn et al., 2017)]. As a result, each QDM experimental run produces two magnetic field maps simultaneously. The first map shows the fields resulting from remanent magnetization carried by ferromagnetic grains with coercivity greater than the 0.9 mT instantaneous bias field while the second map shows the induced magnetic field corresponding to the instantaneous bias field. For the measurements analyzed here, field reversals during measurement resulted in a residual bias field of ≤0.7 µT. The resulting pair of maps therefore show the remanent magnetization in a ≤0.7 µT bias field and the induced magnetization in a 0.9 mT bias field.
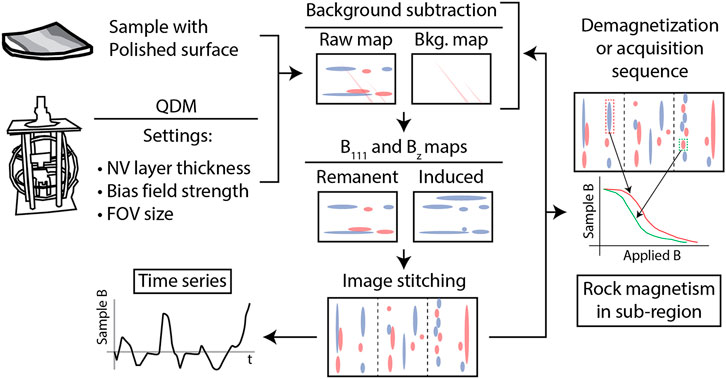
FIGURE 3. Flowchart summary of experimental procedure. After we obtain a raw map of the magnetic field in the <111> crystallographic direction (B111), we apply background subtraction where necessary, convert to Bz using a Fourier domain transform, and stitch adjacent fields of view using the optical image associated with each magnetic field map. A time series of magnetic field strength, which is a proxy for magnetization, can be obtained with an age model. Repeated imaging of the same field(s) of view combined with a demagnetization or remanence acquisition sequence can be used to construct demagnetization or acquisition curves for small sub-regions.
We ran the QDM in projective magnetic microscopy (PMM) mode to maximize the signal-to-noize ratio (Glenn et al., 2017). The resulting raw maps therefore show the magnetic field strength in the <111> crystallographic direction, which is oriented toward 12 o’clock and 35.26° out of the mapping plane. For further analysis, we recomputed the maps to show the magnetic field component perpendicular to the surface (Bz) using a Fourier algorithm (Fu et al., 2020).
To recover rock magnetic information from speleothem samples, we first subjected the sample to a 1.5 T isothermal remanent magnetization (IRM) directed into the mapping plane. Previous rock magnetic characterization suggests that this treatment should result in a near-saturation magnetization carried by all but a small population of goethite or fine-grained hematite (Jaqueto et al., 2016). We then measured a backfield IRM acquisition sequence for a single field of view in steps of 2–10 mT up to 60 mT, at which point the magnetization in the QDM maps appeared to have fully reversed except for isolated regions (Figure 4). We further conducted a highly condensed backfield IRM acquisition experiment for all three ALHO6 fields of view by mapping the magnetic field after exposure to a downward 1.5 T IRM followed by upward 17 and 70 mT IRMs. Although speleothems typically have low concentrations of magnetic particles (Lascu and Feinberg, 2011), the applied IRMs resulted in generally strong magnetic field signals. We therefore used integration times of 30–60 min for our QDM magnetic field maps.
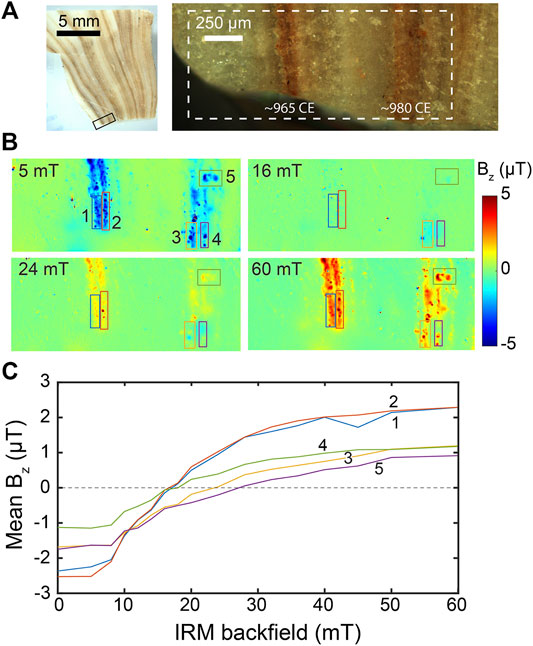
FIGURE 4. Backfield IRM acquisition experiment from one field of field. (A) Reflected light, crossed polarizer images of the mapped region. (B) Vertical component of the magnetic field after the application of a 1.5 pulse IRM into the mapping plane and an IRM of the indicated strength out of the plane. Mapped region corresponds to white dashed box in panel (A). (C) Backfield IRM acquisition curves of the five rectangular regions indicated in panel (B).
Due to artifacts arising from internal strain in the field-sensitive layer of the QDM diamond, we obtained blank magnetic field maps of an empty, polished quartz plate and subtracted it from the maps of speleothem magnetic fields (Figure 5). To construct time series extending beyond the coverage of a single QDM field of view, we imaged the magnetic fields in three tiled fields of view near the edge of the polished ALHO6 sample surface, using pixels located over empty space past the edge of the sample to calibrate the zero magnetic field value. We then stitched together the magnetic field maps by matching features in an optical image taken over the overlapping region. These optical images, which are taken using the QDM camera and optics, permit registration between the magnetic field maps and optical or electron microscope images with <5 µm accuracy.
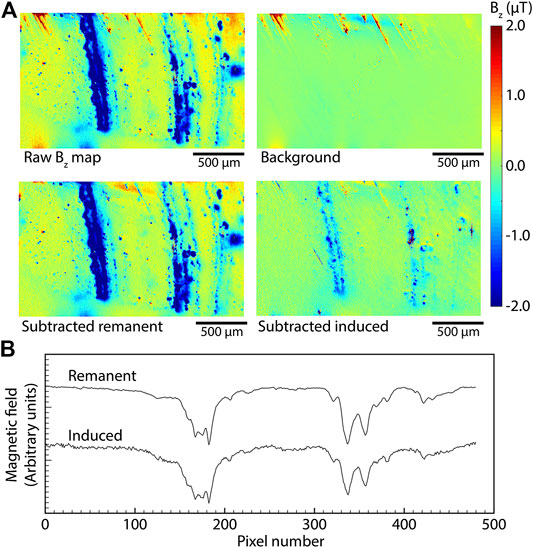
FIGURE 5. Examples of high-resolution remanent and induced magnetization maps and demonstration of background subtraction. (A) Map of magnetic fields over the oldest of three mapped sections of the ALHO6 speleothem corresponding to approximately the 957–987 CE interval with time progressing toward the right. Sample has been imparted with a 1.5 T IRM in the into-the-plane (negative) direction. Positive and negative values denote the intensity of the magnetic field component out of and into to the mapping plane, respectively. (B) Field values in the remanent and induced field maps averaged across lines of equal deposition time.
Quantifying variations in the concentration of ferromagnetic minerals ultimately requires finding the per unit volume magnetization intensity. Although the magnetization intensity of unidirectionally magnetized sources such as the speleothem subjected to a saturation IRM can be determined uniquely (Feinberg et al., 2020), this technique cannot be used for backfield experiments that contain both positively and negatively oriented magnetizations. We therefore use the magnetic field strength observed at a fixed height above the sample as a proxy for the magnetization. This procedure requires repeatable positioning of the sample to the sensing diamond surface such that differences in sensor-to-sample distance do not bias the inferred intensity of magnetization. Using visible interference fringes between the polished sample surface and the diamond, we achieved reproducibility of 2 µm in the sensor-to-sample distance. Given the 10 µm thickness of the nitrogen-vacancy layer over which the magnetic field signal is averaged and the ∼0.5 µm thickness of the speleothem sections, these variations result in negligible magnetic field changes due to sample positioning.
From the calibrated and stitched maps, we averaged the magnetic field value from pixels along lines parallel to visible laminae to produce a curve for the mean magnetic field intensity as a function of time (Figure 3). We assigned calendar year ages to each data point in the time series of magnetic field strength using linear interpolations between U-Th ages obtained from the same speleothem (Novello et al., 2016). The QDM-mapped time interval included a single U-Th age tie point at 1,068 ± 51 CE and is bracketed by two additional tie points at 885 ± 73 CE and 1,305 ± 27 CE. We note that these age uncertainties are not relevant to comparisons between our QDM-derived magnetic field time series and other datasets from ALHO6 such as bulk specimens magnetization and isotopic data as these time series are cross-referenced based on visible features on the speleothem itself.
To complement these magnetic field imaging data, we quantified the coloration of the speleothem section analyzed using the QDM by converting a diffusely illuminated optical image to grayscale and averaging the brightness value along each lamina. We then rescaled the brightness data such that the maximum value is one and pure black is 0. To further support interpretation of the speleothem mineral assemblage, we obtained reflected light photomicrographs under crossed polar illumination on a Leica DM750 petrographic microscope and elemental maps of Si, Ca, and Mg using energy dispersive spectroscopy (EDS) on a JEOL 7900F electron microprobe at the Harvard Center for Nanoscale systems.
Finally, we performed spectral analysis to identify periodicities in the magnetic field time series using REDFIT (Schulz and Mudelsee, 2002) and wavelet analyses (Torrence and Compo, 1998) implemented in the software PAST (Hammer et al., 2001). All QDM remanence magnetic field maps and integrated magnetic field time series are available on the Harvard Dataverse (Fu, 2020).
Results
Our time series of remanence-associated magnetic field over the ALHO6 speleothem extends over 174 years and shows strong concentrations of signal over narrow zones of high magnetic particle content (Figure 5). Compared to magnetization measured from bulk specimens (Jaqueto et al., 2016), the QDM-derived time series when binned at the same resolution appears to show a similar decrease in ferromagnetic content during the full analyzed interval between 957 CE and 1131 CE (Figure 2). The zones of high magnetization correlate clearly (Pearson correlation coefficient of r2 = 0.37; P value of P = 3.0 × 10⁻⁹) with the speleothem color with darker laminae consistently showing stronger magnetic signal (Figure 6).
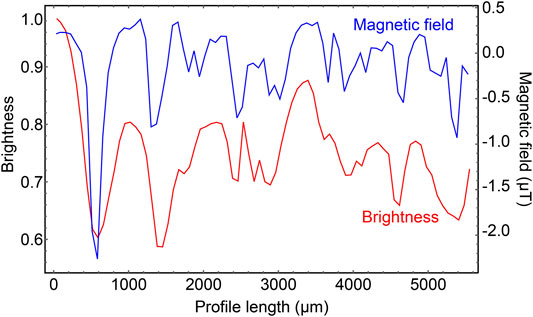
FIGURE 6. Comparison between magnetic field intensity and grayscale brightness over the full QDM mapped profile with time progressing toward the right. The brightness levels have been normalized such that the maximum value is one and black is 0. Note that more negative values of magnetic field correspond to stronger magnetization due to the negative direction of the applied IRM. Both datasets have been binned in 48 µm intervals. Values on x-axis denote distance from the youngest end of the mapped profile.
The laminae-scale resolution of the QDM time series can inform the interpretation of magnetization variations observed in the bulk specimens analysis. Specifically, the concentration of magnetic signal in a small subset of laminae suggests that the majority of magnetic particles are deposited during discrete events. Further, each strongly magnetic band is typically divided into between 2 and 6 identifiable and laterally continuous fine laminae with enhanced magnetic signal (Figure 5), revealing that the detrital events responsible for the magnetic particle enrichment interval were clustered in time. Although the major magnetized bands are generally associated with visually dark laminae, the fine-scale magnetized laminations are not identifiable in optical imagery and would not have been identifiable using lower resolution SQUID microscopy (Figure 7). Most prominently, the highly magnetic laminae corresponding to 965 CE may be responsible for the elevated ferromagnetic signal observed in the corresponding bulk specimens (Figure 2). As such, bulk specimen analyses of the ALHO6 and similar speleothems are effectively documenting the intensity and frequency of discrete events that lead to enhanced deposition of magnetic particles.
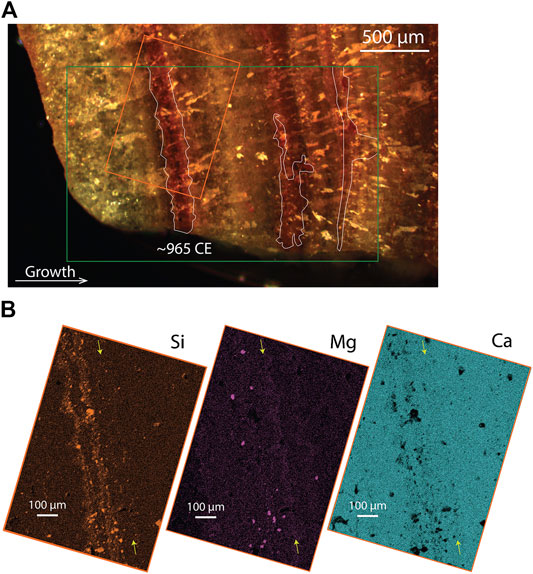
FIGURE 7. Optical and electron microprobe analyses of a speleothem region covering the magnetically enriched 965 CE lamination. (A) Reflected light photomicrograph with crossed polarizers. Green box denotes the QDM field of view shown in Figure 5. Thin white outlines indicate the strongly magnetized regions. (B) EDS elemental composition maps of the orange boxed region in panel (A). Yellow arrows indicate position of zone with enriched Mg in all three maps.
Comparing the full backfield acquisition curves over a mapped area can identify the spatial context of different grain populations. While a 70 mT backfield IRM is apparently sufficient to re-saturate most ferromagnetic grains, two sub-regions of the ∼980 CE band show weaker magnetic signal after application of a 70 mT backfield IRM compared to after the original 1.5 T IRM (Figure 4, sub-regions 3 and 5). This behavior implies that these sub-regions contain a distinct, high-coercivity ferromagnetic mineral, which likely corresponds to the goethite or hematite phase detected in bulk sample analyses (Jaqueto et al., 2016). The coexistence of these mineral populations within the same laminae shows that both low-coercivity minerals, likely pedogenic magnetite (Jaqueto et al., 2016), and high-coercivity minerals, possibly weathered from overlying bedrock, are enriched simultaneously in the speleothem during the same depositional episode. Similarly, the spatially resolved backfield curves also indicate variations in the coercivity of remanence (HCR), which corresponds to the x-axis cross value of the curve, within the same lamina (Figure 4, sub-regions 4 and 5). These observations suggest that the low and high-coercivity grain types sample the same source population of detrital material.
These contrasts among the coercivity spectra of specific locations within the same detritus-rich laminae demonstrate that localized regions within laminae may not be representative of the layer as a whole. We therefore quantified both the mean and dispersion of coercivity for each magnetized band to construct our coercivity time series. We first conducted a highly condensed backfield IRM experiment, which consists of negative near-saturation IRM, a single intermediate IRM near the approximate HCR value (17 mT), and a positive near-saturation IRM (Figure 2). We then defined a parameter called the coercivity index that can be computed for each lamina in all three fields of view. This coercivity index is equal to the difference in magnetic field intensity between the final and the intermediate IRMs normalized by the difference between the positive and negative near-saturation IRMs. As such, this parameter effectively quantifies the fraction of remanence with coercivity above 17 mT.
We computed the mean coercivity index in four, equally sized sub-sections of each magnetized lamina. The scatter in the coercivity index among the four sub-sections is then used to compute a standard deviation around the combined mean value. Accounting for this scatter within individual laminae, we find no significant change in the coercivity index of successive magnetized laminae (Figure 2).
Another potential source of rock magnetic information about the speleothem laminae is the comparison between maps of remanent and induced magnetic fields, which can be obtained simultaneously on each field of view. This analysis for the ALHO6 fields of view found close similarity between the magnetic field pattern generated by a saturation remanence and by the induced magnetization (Figure 5). From this observation we infer that the bulk of remanent magnetization and low-field induced magnetization are carried by the same grain population, which likely consists of fine-grained magnetite (Jaqueto et al., 2016). In agreement with the coercivity index analysis above, differences in the ratio of induced to remanent magnetization are not clearly resolved between successive laminae.
Discussion
Our QDM-based analysis of the ALHO6 section has provided an annually resolved time series quantifying variations in both the concentration and coercivity of ferromagnetic detrital particles. We now use these observations to investigate the mechanisms driving variations in magnetization and their paleoenvironmental implications. The concentration of most magnetic field signal in discrete, strongly magnetized laminae is similar to the magnetization pattern observed in a North American speleothem taken from Spring Valley Caverns, Minnesota and analyzed using the SQUID microscope (Feinberg et al., 2020). Well-defined magnetized horizons in that speleothem correspond to major flooding events, some of which were known from the historical record.
By analogy, episodic flooding events are a candidate source of detrital grains in the ALHO6 sample. However, no independent record of flooding exists for the Pau D’Alho cave in the investigated time interval to provide a direct test of this hypothesis. As a potentially relevant proxy record, δ18O values, which are most likely governed by the amount effect resulting in more negative values during times of stronger precipitation (Novello et al., 2016), do not show any consistent positive or negative excursions corresponding to the most magnetic laminae in our sample (Figure 2). This lack of strong correlation between δ18O and speleothem magnetism has been noted in previous observations (Font et al., 2014), although Jaqueto et al. (2016) found evidence for limited correspondence between high δ18O values and high magnetization intensity at multi-decadal timescales in the ALHO6 sample. However, δ18O is partially controlled by regional and global factors uncorrelated with local precipitation, while major flooding events are associated with high precipitation on multiple timescales and may not be well-predicted by short-term precipitation alone (Seiler et al., 2002; Lachniet, 2009). Therefore, the δ18O record is unlikely to provide a high-fidelity record of past flooding in the Pau D’Alho cave, and its lack of correlation with the magnetic signal does not provide evidence in favor of or against a flood origin for the detritus-rich layers.
Our QDM magnetic field imaging of the ALHO6 speleothem may aid in testing a flood mechanism for the concentration of magnetic particles. Previous researchers have used the occurrence of dissolution features (Railsback et al., 2013; Frisia, 2015) and the presence of coarse detrital clay particles as evidence for a flood origin (Dasgupta et al., 2010). At the ≤100 µm scale, our maps show that the magnetized horizons are sub-divided into thin, continuous laminae with enhanced magnetic signal (Figure 5). Optical observations of dark laminae that correspond to the stronger magnetized horizons also show no evidence for dissolution such as microcavities (Figures 1, 7). Although the strongly magnetized bands indeed show enrichment in coarse detrital silicates as expected for flood deposits (Figure 7B), they occur in much lower concentrations than in known flood deposits (Dasgupta et al., 2010).
In addition, because more severe flood events are able to loft and transport coarser grain sediments, the most prominent flood-related detrital layers are expected to contain coarser grains than minor layers (González-Lemos et al., 2015). The presence of a coarser grain population, which is more likely to exhibit multidomain behavior, in the most prominent flood layers would likely result in a shift toward softer coercivities (Dunlop and Ozdemir, 1997). Further, a shift in the grain size distribution is likely to change the relative abundance of magnetite and higher coercivity goethite and hematite particles, which are unlikely to have the same grain size distribution. Such a compositional shift would result in additional change in coercivity. Our QDM mapping, however, reveals no resolvable correlation between coercivity and the intensity of magnetization in magnetized laminae (Figure 2). Instead, the coercivity index time series suggests that the same population of ferromagnetic particles was incorporated throughout the analyzed time interval.
Finally, although the ALHO6 speleothem was sampled at a relative narrow corridor in Pau d’Alho cave close to a river stream that is subjected to episodic floods (Figure 1), the water from this river was observed to be predominantly limpid during a 13-months cave monitoring study (Novello et al., 2016). Therefore, it is unlikely for floods from this river to deposit allochthonous mineral grains on nearby stalagmites. Combining these observations, we find that flood events are an unlikely explanation for the formation of magnetized bands in the ALHO6 speleothem.
Aside from flood events, a hiatus or slowdown in speleothem deposition may also lead to concentration of detrital particles, leading to layers with high Fe content that are difficult to distinguish from flood-deposited horizons (Wassenburg et al., 2012; Denniston and Leutscher, 2017). As an additional factor, vegetation retreat during dry intervals may enhance soil erosion, further enhancing detrital particle delivery to the speleothem during periods of slow growth. Focusing first on the morphology of magnetized layers imaged in the QDM, most magnetized horizons are thin (<50 µm), continuous, and occur in groups that include one or more strongly magnetized layers. This morphology is most similar to L-type layer bounding surfaces deposited during intervals of reduced or halted speleothem growth. Such aridity-induced features are associated with fine-grained detritus and typically include groups of laminae that show smaller progressively separation [Figure 5; (Railsback et al., 2013)].
The observation of constant coercivity through time, which is inconsistent with a flood origin as discussed above, may be more consistent with a hiatus or slow deposition origin for the detritally enriched horizons. In this scenario, brief decreases or hiatuses in the speleothem growth rate would have led to the concentration of detrital particles, forming the thin, <20 µm detritus-enriched layers observed in the QDM maps (Figures 1, 4). Meanwhile, prolonged slowdowns in growth would have caused the major magnetized bands. Given the location of the ALHO6 speleothem far from the cave entrance, the ultimate source of the accumulating particles was likely epikarstic soil washed down into the cave and carried by drip water instead of airborne dust (Herman et al., 2012). In either case, the source population of detrital grains is controlled by the composition of surrounding soils and not expected to covary with speleothem growth rate. This formation mechanism is therefore compatible with the observation of indistinguishable coercivities in major and minor magnetized bands.
Our analyses of crystal habit and elemental composition in the ALH6 speleothem may provide additional tests for the hypothesis that magnetized zones are associated with hiatuses or slow deposition. Reflected light imaging through crossed polarizers shows that strongly magnetic horizons are associated with fine grained (≤10 µm), unoriented calcite crystals intermixed with 10 µm scale silicate grains (Figure 7). These horizons immediately precede columnar calcite with 100–400 µm length grains. Although by itself not a conclusive indicator of past moisture environment, fine-grained calcite layers with fine detrital enrichment followed in time by coarse, pure columnar calcite growth have been associated with hiatuses in other studied speleothems (Frisia, 2015; González-Lemos et al., 2015; Vanghi et al., 2019). Further, one textural study at sub-annual resolution has suggested that cycles of fine-grained calcite followed by columnar habits correspond to higher and lower calcite saturation in the drip water, respectively (Mattey et al., 2008). If the textural changes in the ALHO6 sample are caused by a similar mechanism, it would provide support for an association between fine-grained, highly magnetic zones with low moisture.
Similarly, variations in calcite Mg/Ca ratios can indicate shifts in local hydroclimate. Specifically, higher Mg/Ca is frequently attributed to prior calcite precipitation (PCP), which refers to the exsolution of calcite out of percolating water prior to deposition on the speleothem. Because increased PCP implies higher calcite saturation in the drip water, higher Mg/Ca is indicative of dryer conditions or low pCO2 in the cave environment (Hellstrom and McCulloch, 2000; Huang and Fairchild, 2001; Cruz et al., 2007; Fairchild and Treble, 2009; Oster et al., 2012). Our electron microprobe imaging of the ∼965 CE magnetized horizon revealed higher Mg counts in the interval corresponding to strong magnetizations while Ca counts remained constant throughout. Some Mg enrichment, especially as strong isolated sources, are correlated with Si enrichment. These Mg sources can be attributed to detrital particle enrichment and are unrelated to PCP-induced shifts in the Mg/Ca ratio. However, the Mg map also shows diffuse enrichment not clearly associated with Si signal (Figure 7B), which suggests a distinct, non-detrital enrichment mechanism. In addition, regions of diffuse Si enrichment do not correlate with high Mg, implying that fine silicate particles are not detectable in the Mg map and cannot explain the regions of diffuse Mg enrichment. These observations strongly suggest that the higher Mg/Ca ratios in ratios of diffusely enriched Mg are due to higher Mg/Ca in the host carbonate. If this shift is due to increased PCP, it most likely suggests the occurrence of drier conditions during the deposition of magnetic intervals because cave pCO2, which is an alternative driver of Mg/Ca change, typically varies on much shorter, sub-annual timescales (Baldini et al., 2008; Oster et al., 2012).
As a further test for the dry interval hypothesis of magnetic enrichment, we examine the δ18O record, which may document variations in ancient precipitation. Our high temporal resolution time series does not show a significant correlation between magnetization and δ18O (r2 = −0.003), in contrast with the work of Jaqueto et al. (2016) on the same speleothem at coarser resolution (Figure 2). As discussed in the Materials and Methods section, the fact that our samples derive from the flank of the speleothem while the δ18O record was taken from the central column is unlikely to explain the lack of correlation.
The specific time interval chosen for the analysis, which corresponds to the MCA (Vuille et al., 2012), may contribute to the lack of correlations between magnetic and δ18O records, as the strongest correlation between bulk specimens magnetization and δ18O was observed prior to 900 CE and after 1450 CE. Further, the mechanisms controlling variations in magnetization and δ18O may not respond to climate forcings on the same timescales, resulting in decoupling at the highest resolution. For example, local δ18O may be influenced by the composition of upstream rainwater within a single watershed, leading to a spatial and temporal averaging effect while magnetization, according to our hypothesis, reflects the balance between local moisture and dust mobilization. Therefore, the lack of correlation between magnetization and δ18O at annual to sub-annual timescales does not support or rule out a connection between speleothem magnetization and local precipitation intensity.
In contrast to our annual resolution study, Jaqueto et al. (2016) observed that strong bulk specimens magnetizations correlate with positive δ18O excursions on multi-decadal to century timescales. Assuming the amount effect as the dominant driver of δ18O variation on annual to decadal timescales, this observation implies that stronger magnetizations occurred during times of reduced precipitation. To explain this correspondence, the previous authors argued that sparser vegetation during drier intervals enhanced erosion in the overlying soil. Similar correspondence between less depleted δ13C compositions and strong bulk specimens magnetizations provided further direct support for an ecosystem shift toward aridity-tolerant grassland plants during times of higher magnetic particle flux.
Although our high-resolution magnetization time series does not show direct correlation with either δ18O or δ13C variations (Figure 2), our aridity-driven hypothesis for the formation of magnetized laminae is compatible with the apparent correspondence between magnetization and these stable isotope proxies at longer timescales. Comparison of our binned data with bulk specimens results as presented above suggests that other periods of strong magnetization in the Jaqueto et al. (2016) analysis likely correspond to more frequent occurrence of magnetized bands. Less depleted δ18O and δ13C signals during these intervals point to a drier environment, which is fully consistent with our interpretation that decrease or hiatus in the rate of speleothem deposition leads to magnetic particle enrichment.
Finally, speleothem coloration, which in our sample is correlated with magnetic particle content (Figure 6), has been suggested as an indicator of past hydroclimate in other speleothems. Several studies have found darker coloration to be associated with enrichment in organics and wetter conditions (van Beynen et al., 2001; Martínez-Pillado et al., 2020), which, if applicable to the ALHO6 sample, would contradict our interpretation of aridity-driven magnetic particle enrichment. However, the presence of fine detrital particles, associated with flooding or hiatus, may also lead to darker coloration (Dasgupta et al., 2010; González-Lemos et al., 2015). This coloration mechanism is consistent with optical and electron microprobe observations of ALHO6 that reveal enrichment of silicate minerals and visible opaque phases corresponding to magnetized zones (Figure 7).
However, not all magnetic horizons can be associated with detrital horizons visible in optical or electron microscopy. This lack of corresponding visible grains may be because the remanence-carrying ferromagnetic grains are smaller than the resolution of these microscopy techniques, which is consistent with the pseudo-single domain behavior of the bulk rock magnetic samples (Jaqueto et al., 2016). At the same time, magnetic field measurements are sensitive to ferromagnetic particles buried beneath the polished surface and is indicative of the detrital particle concentration throughout a larger volume than optical or electron microscopy. We therefore argue that magnetization in the ALHO6 sample is a more sensitive indicator of detrital particle enrichment than coloration alone.
Our observation that the magnetic signal is concentrated in distinct 10–100 µm intervals demonstrates that enhancements in speleothem magnetization occurred in multiple discrete events. This behavior suggests that magnetic particle concentration was driven by individual hiatuses instead of solely by generally enhanced soil erosion during dry intervals, which is caused by vegetation changes and likely to be elevated during the full duration of aridity (Jaqueto et al., 2016). Fine-scale magnetic imaging of the ALHO6 speleothem, therefore, shifts the emphasis from soil erosion to the speleothem growth rate as the primary driver of detrital enrichment (Jaqueto et al., 2016). We note, however, that slow speleothem growth and enhanced soil erosion are likely to occur simultaneously during arid intervals and may both contribute to the enhancement of detrital content in ALHO6.
Although no significant correlation exists between our magnetic field data and previously published δ18O and δ13C time series [see above; (Novello et al., 2016)], the two datasets may contain overlapping peaks in the frequency domain. To test this, we performed spectral analysis on the full magnetic field time series using the REDFIT routine, which revealed periodicities between 18 and 45 years with ≥99% significance level (Figure 8A). Our complementary wavelet analysis confirmed the existence of significant periodicity in this frequency range throughout the entire time interval of our data (Figure 8B). In comparison, the ALHO6 oxygen isotopic record from an approximately 1,600 year interval found a dominant periodicity of 208 years along with other significant periodicities of 83, 31, 18–16, 11, 9 and 7–3 years. Most of these periodicities were interpreted to be associated with solar cycles influencing the SASM. Comparison to the magnetic field data shows that both datasets contain significant power with ∼30 and ∼18 years periodicity, although the latter is only significant during the early part of the magnetically analyzed interval. The dominant periodicity in the δ18O data could not be recovered from the magnetic field time series due the short, 174 years duration of the latter. This correspondence between the spectral content of the two time series despite a lack of time domain correlation may be due to an offset in their age calibrations over part of the time interval. Regardless, the similar spectral characteristics of the magnetic field and δ18O data suggests that the two quantities may respond to similar drivers, including environmental moisture.
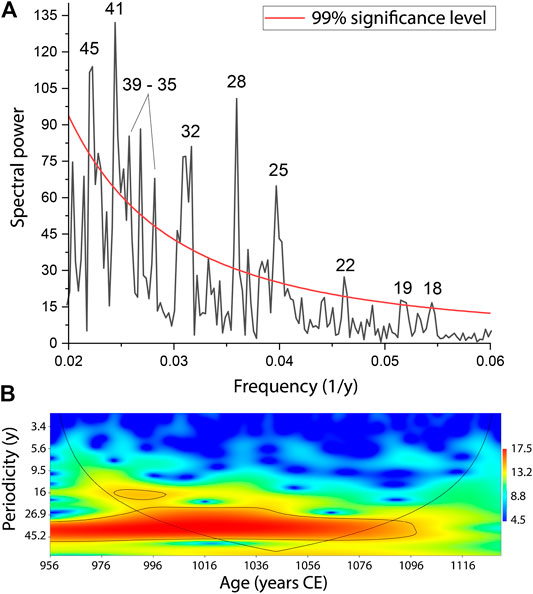
FIGURE 8. Spectral analysis of the magnetic field time series. (A) Spectral analysis (REDFIT) performed on the magnetic time series (in units of μT and with equally spaced 0.25 years intervals) using the software PAST2 (Hammer et al., 2001). The parameters used were: window: rectangle; oversample: 2; segment: 5. The red line represents the 99% χ2 confidence level. The number above the picks indicates the periodicity values in years. (B) Wavelet analysis performed on the magnetic field time series using the software PAST and the Morlet mother wavelet (Torrence and Compton, 1998). Black lines indicate the 95% significance level and the cone of influence, inside of which the record is of sufficient length to interpret results.
The occurrence of thin magnetically enriched horizons both before and after major magnetized bands suggests that, if detrital particle enrichment was due to dryness as argued above, these sets of magnetized layers during multi-year dry intervals during which speleothem growth rate gradually slowed to minimum, possibly null, rate and recovered over a similar interval. The preservation of an apparent transitional period prior to the main magnetized laminae indicates the lack of dissolution during the interval of peak aridity, which is supported by the lack of erosion and replacement features such as microcavities (Railsback et al., 2013). Future high-resolution U-Th dating of the speleothem combined with QDM analysis of magnetic particle concentration may allow quantification of the aridity onset timescale. Comparison between the present dataset, which reflects drier, weak monsoon conditions during the MCA, and the magnetization record outside of the MCA may help to determine to what degree the severity and the frequency of drought each contributed to the enhanced aridity during this anomalous period.
Summary and Outlook
Our QDM magnetic field imaging of the ALHO6 speleothem has produced the first time series of multiple rock magnetic parameters with annual to sub-annual resolution. We find that the distribution of ferromagnetic content within the speleothem is highly non-uniform, with virtually all resolvable signal occurring in 10–100 µm scale horizons of high magnetic field intensity (Figure 5). The coercivity of magnetic particles as determined by backfield IRM acquisition experiments vary within individual laminae, indicating that magnetic hard and soft grain populations were deposited simultaneously and therefore likely sample the same detrital particle source.
The averaged coercivity of discrete magnetized regions does not show resolvable variation over the 174 years interval of measurements. This lack of covariance between the amplitude and detrital grain size of magnetized layers, coupled with the clustered nature of magnetized horizons and the lack of coarse detrital material, suggests that magnetized layers formed due to detritus accumulation during times of slow or halted speleothem growth instead of during flood events.
This aridity-driven origin of magnetization is also compatible with apparent correlations at longer timescales between the speleothem magnetization and positive δ18O excursions assuming that the amount effect is the primary driver of δ18O variability (Jaqueto et al., 2016). Finally the change in calcite crystal habit and higher Mg/Ca ratios in highly magnetized zone provide further support for dryness, which is likely accompanied by vegetation retreat and enhanced soil erosion, as the driver of magnetic particle enrichment. If the association between magnetization and aridity is correct, the presence of multiple thin (∼20 µm) magnetized horizons pre- and post-dating the main magnetized laminae suggests that the arid intervals occurred with gradual onset and resolution.
Future QDM imaging of speleothems from Pau D’Alho and surrounding caves during other time intervals can test the consistency of the detrital particle enrichment mechanism. In particular, because our analyzed time period occurred during a generally drier interval in central Brazil corresponding to the MCA (Vuille et al., 2012), data from wetter intervals may show different controls on the occurrence and intensity of magnetic enhancement.
Other future QDM-based studies can be used to characterize the micrometer-scale morphology and rock magnetism of speleothem samples from other cave systems and climate regions. In particular, extra-tropical speleothems from North America and China have been described with positive correlations between speleothem magnetism and inferred paleoprecipitation (Bourne et al., 2015; Zhu et al., 2017), which is the opposite of the relationship found in the ALHO6 sample. QDM magnetic field imaging of these samples may provide insight into the mechanism of detrital enrichment. For example, inference of anomalously coarse mineral grains in major detrital horizons through coercivity analysis would provide support for paleofloods as the main delivery mechanism (González-Lemos et al., 2015). Meanwhile, magnetization due to dispersed magnetic grains sampling a single source population would suggest that bulk speleothem magnetization is modulated by the flux of fine particles carried into the cave via drip water. Such studies would provide a foundation toward understanding the diverse processes influencing the concentration of detrital material in speleothems and inform the paleoclimate interpretations of observed variations.
High‐resolution time series provided by QDM analyses would also permit novel comparisons between magnetization and other measurements or proxies taken at annual to sub-annual resolutions. Importantly, QDM-produced time series can match or exceed the temporal resolution of δ18O records, enabling testing of the mechanisms that drive stable isotope fractionation at short timescales. At the same time, direct comparison between QDM-generated time series and historical records such as rain gauge data may produce conclusive tests regarding the mechanism of magnetic particle enrichment, at least in specific cave settings. If such studies can establish a consistent relationship between past precipitation conditions and speleothem magnetization, QDM imaging may be able to provide annually resolved records of local moisture over thousand-year timespans.
Data Availability Statement
The original contributions presented in the study are included in the article while all raw data are availble in the Harvard Dataverse (Fu, 2020).
Author Contributions
RF: Managed project, performed most measurements and analysis, and wrote paper. KH: Performed measurements and analysis. Edited paper. PJ: Provided samples, helped with analysis, and edited paper. VN: Provided discussions and edited paper. TK: Provided key discussions and edited paper. RT: Provided samples, managed project, and edited paper. NS: Provided key discussions and edited paper. FC: Provided samples. OD: Provided technical support with magnetic field measurements.
Funding
Funding for RF and KH was provided by the Lemann Brazil Fund and NSF Grant PHY-1843727. This work was performed in part at the Harvard Center for Nanoscale Systems (CNS), which is supported by the National Science Foundation under NSF Award 1541959. Further support for this work was provided by the São Paulo Research Foundation Grants 2016/24870-2, 2019/0670-9 and by the Serrapilheira Institute (Serra-1812-27990). Two reviewers contributed their valuable insights to this work.
Conflict of Interest
The authors declare that the research was conducted in the absence of any commercial or financial relationships that could be construed as a potential conflict of interest.
Acknowledgments
We are grateful to Instituto Brasileiro do Meio Ambiente e dos Recursos Renováveis for permission to collect stalagmite samples. We thank T. Cavanaugh for help with electron microscopy.
References
Baldini, J. U. L., McDermott, F., Hoffmann, D. L., Richards, D. A., and Clipson, N. (2008). Very high-frequency and seasonal cave atmosphere PCO2 variability: implications for stalagmite growth and oxygen isotope-based paleoclimate records: Earth Planet. Sci. Lett. 272, 118–129. doi:10.1016/j.epsl.2008.04.031
Bloemendal, J., King, J. W., Hall, F. R., and Doh, S.-J. (1992). Rock magnetism of Late Neogene and Pleistocene deep-sea sediments: relationship to sediment source, diagenetic processes, and the sediment lithology. J. Geophys. Res. 97, 4361–4375. doi:10.1029/91JB03068
Blundell, A., Hannam, J. A., Dearing, J. A., and Boyle, J. F. (2009). Detecting atmospheric pollution in surface soils using magnetic measurements: a reappraisal using an England and Wales database. Environ. Pollut. 157, 2878–2890. doi:10.1016/j.envpol.2009.02.031
Bourne, M. D., Feinberg, J. M., Strauss, B. E., Hardt, B., Cheng, H., Rowe, H. D., et al. (2015). Long-term changes in precipitation recorded by magnetic minerals in speleothems. Geology 43, 595–598. doi:10.1130/G36695.1
Campos, J. L. P. S., Cruz, F. W., Ambrizzi, T., Deininger, M., Vuille, M., Novello, V. F., et al. (2019). Coherent South American Monsoon variability during the last millennium revealed through high‐resolution proxy records: Geophys. Res. Lett. 46, 8261–8270. doi:10.1029/2019GL082513
Cruz, F. W., Burns, S. J., Jercinovic, M., Karmann, I., Sharp, W. D., and Vuille, M. (2007). Evidence of rainfall variations in Southern Brazil from trace element ratios (Mg/Ca and Sr/Ca) in a Late Pleistocene stalagmite. Geochem. Cosmochim. Acta. 71, 2250–2263. doi:10.1016/j.gca.2007.02.005
Dasgupta, S., Saar, M. O., Edwards, R. L., Shen, C.-C., Cheng, H., and Alexander, E. C. (2010). Three thousand years of extreme rainfall events recorded in stalagmites from Spring Valley Caverns, Minnesota. Earth Planet Sci. Lett. 300, 46–54. doi:10.1016/j.epsl.2010.09.032
Denniston, R. F., and Leutscher, M. (2017). Speleothems as high-resolution paleoflood archives. Quat. Sci. Rev. 170, 1–13. doi:10.1016/j.quascirev.2017.05.006
Dorale, J. A., and Liu, Z. (2009). Limitations of the Hendy test criteria in judging the paleoclimatic suitability of speleothems and the need for replication. J. Cave Karst Stud. 71, 73–80.
Dunlop, D. J., and Ozdemir, O. (1997). Rock magnetism: fundamentals and Frontiers. Cambridge, United Kingdom: Cambridge University Press, 573.
Fairchild, I. J., and Treble, P. C. (2009). Trace elements in speleothems as recorders of environmental change. Quat. Sci. Rev. 28, 449–468. doi:10.1016/j.quascirev.2008.11.007
Feinberg, J. M., Lascu, I., Lima, E. A., Weiss, B. P., Dorale, J. A., Alexander, E. C., et al. (2020). Magnetic detection of paleoflood layers in stalagmites and implications for historical land use changes: Earth Planet. Sci. Lett. 530, 115946. doi:10.1016/j.epsl.2019.115946
Font, E., Veiga-Pires, C., Pozo, M., Carvallo, C., de Siquiera Neto, A. C., Camps, P., et al. (2014). Magnetic fingerprint of southern Portuguese speleothems and implications for paleomagnetism and environmental magnetism. J. Geophys. Res. Solid Earth 119, 7993–8020. doi:10.1002/2014JB011381
Frisia, S. (2015). Microstratigraphic logging of calcite fabrics in speleothems as tool for palaeoclimate studies. Int. J. Speleol. 44, 1–16. doi:10.5038/1827-806X.44.1.1
Fu, R. R, Lima, E. A., Volk, M. W. R., and Trubko, R. (2020). High sensitivity moment magnetometry with the quantum diamond microscope. Geochem. Geophys. Geosyst. 21, e2020GC009147. doi:10.1029/2020GC009147
Fu, R. (2020). Replication data for: High-resolution environmental magnetism using the quantum diamond microscope (QDM): application to a tropical speleothem. Harvard Dataverse, V1. doi:10.7910/DVN/BQ1LCB
Glenn, D. R., Fu, R. R., Kehayias, P., Le Sage, D., Lima, E. A., Weiss, B. P., et al. (2017). Micrometer-scale magnetic imaging of geological samples using a quantum diamond microscope. Geochemistry, Geophysics, Geosystems 18, 2017GC006946. doi:10.1002/2017GC006946
González-Lemos, S., Müller, W., Pisonero, J., Cheng, H., Edwards, R. L., and Stoll, H. M. (2015). Holocene flood frequency reconstruction from speleothems in northern Spain. Quat. Sci. Rev. 127, 129–140. doi:10.1016/j.quascirev.2015.06.002
Hammer, O., Harper, D. A. T., and Ryan, P. D. (2001). Paleontological statistics software package for education and data analysis. Palaeontol. Electron 4, 1–9.
Hellstrom, J. C., and McCulloch, M. T. (2000). Multi-proxy constraints on the climatic significance of trace element records from a New Zealand speleothem. Earth Planet Sci. Lett. 179, 287–297. doi:10.1016/S0012-821X(00)00115-1
Herman, E. K., Toran, L., and White, W. B. (2012). Clastic sediment transport and storage in fluviokarst aquifers: an essential component of karst hydrogeology. Carbonates Evaporites 27, 211–241. doi:10.1007/s13146-012-0112-7
Huang, Y., and Fairchild, I. J. (2001). Partitioning of Sr2+ and Mg2+ into calcite under karst-analogue experimental conditions. Geochem. Cosmochim. Acta. 65, 47–62. doi:10.1016/S0016-7037(00)00513-5
Jaqueto, P., Trindade, R. I. F., Hartmann, G. A., Novello, V. F., Cruz, F. W., Karmann, I., et al. (2016). Linking speleothem and soil magnetism in the Pau d’Alho cave (central South America). J. Geophys. Res. Solid Earth 121, 7024–7039. doi:10.1002/2016jb013541
Lachniet, M. (2009). Climatic and environmental controls on speleothem oxygen-isotope values. Quat. Sci. Rev. 28, 412–432. doi:10.1016/j.quascirev.2008.10.021
Lascu, I., and Feinberg, J. M. (2011). Speleothem magnetism. Quat. Sci. Rev. 30, 3306–3320. doi:10.1016/j.quascirev.2011.08.004
Liu, Q., Deng, C., Torrent, J., and Zhu, R. (2007). Review of recent developments in mineral magnetism of the Chinese loess. Quat. Sci. Rev. 26, 368–385. doi:10.1016/j.quascirev.2006.08.004
Liu, Q., Roberts, A. P., Larrasoaña, J. C., Banerjee, S. K., Guyodo, Y., Tauxe, L., et al. (2012). Environmental magnetism: principles and applications. Rev. Geophys. 50, RG4002. doi:10.1029/2012RG000393
Maher, B. A., Mutch, T. J., and Cunningham, D. (2009). Magnetic and geochemical characteristics of gobi desert surface sediments: implications for provenance of the Chinese loess plateau. Geology 37, 279–282. doi:10.1130/G25293A.1
Maher, B. A., Thompson, R., and Zhou, L. P. (1994). Spatial and temporal reconstructions of changes in the Asian palaeomonsoon: a new mineral magnetic approach. Earth Planet Sci. Lett. 125, 461–471. doi:10.1016/0012-821X(94)90232-1
Martínez-Pillado, V., Yusta, I., Iriarte, E., Álvaro, A., Ortega, N., Aranburu, A., et al. (2020). The red coloration of Goikoetxe Cave’s speleothems (Busturia, Spain): an indicator of paleoclimatic changes. Quat. Int. 566-567, 141–151. doi:10.1016/j.quaint.2020.04.006
Mattey, D., Lowry, D., Duffet, J., Fisher, R., Hodge, E., and Frisia, S. (2008). A 53 year seasonally resolved oxygen and carbon isotope record from a modern Gibraltar speleothem: reconstructed drip water and relationship to local precipitation: Earth Planet. Sci. Lett. 269, 80–95. doi:10.1016/j.epsl.2008.01.051
McDermott, F. (2004). Palaeo-climate reconstruction from stable isotope variations in speleothems: a review. Quat. Sci. Rev. 23, 901–918. doi:10.1016/j.quascirev.2003.06.021
Novello, V. F., Vuille, M., Cruz, F. W., Stríkis, N. M., de Paula, M. S., Edwards, R. L., et al. (2016). Centennial-scale solar forcing of the South American Monsoon System recorded in stalagmites. Sci. Rep. 6, 24762. doi:10.1038/srep24762
Oster, J. L., Montañez, I. P., and Kelley, N. P. (2012). Response of a modern cave system to large seasonal precipitation variability. Geochem. Cosmochim. Acta. 91, 92–108. doi:10.1016/j.gca.2012.05.027
Ponte, J. M., Font, E., Veiga-Pires, C., Hillaire-Marcel, C., and Ghaleb, B. (2017). The effect of speleothem surface slope on the remanent magnetic inclination. J. Geoph. Res. Solid Earth 122, 4143–4156. doi:10.1002/2016JB013789
Railsback, L. B., Akers, P. D., Wang, L., Holdridge, G. A., and Voarintsoa, N. R. (2013). Layer-bounding surfaces in stalagmites as keys to better paleoclimatological histories and chronologies. Int. J. Speleol. 42, 167–180. doi:10.5038/1827-806X.42.3.1
Roberts, A. P. (2015). Magnetic mineral diagenesis. Earth Sci. Rev. 151, 1–47. doi:10.1016/j.earscirev.2015.09.010
Schulz, M., and Mudelsee, M. (2002). REDFIT: estimating red-noise spectra directly from unevenly spaced paleoclimatic time series. Comput. Geosci. 28, 421–426. doi:10.1016/S0098-3004(01)00044-9
Seiler, R. A., Hayes, M., and Bressan, L. (2002). Using the standardized precipitation index for flood risk monitoring. Int. J. Climatol. 22, 1365–1376. doi:10.1002/joc.799
Slotznick, S. P., Swanson-Hysell, N. L., and Sperling, E. A. (2018). Oxygenated Mesoproterozoic lake revealed through magnetic mineralogy. Proc. Natl. Acad. Sci. U. S. A 115, 12938–12943. doi:10.1073/pnas.1813493115
Torrence, C., and Compo, G. P. (1998). A practical gruide to wavelet analysis. Bull. Am. Meteorol. Soc. 79, 61–78. doi:10.1175/1520-0477(1998)079<0061:APGTWA>2.0.CO;2
van Beynen, P., Bourbonniere, R., Ford, D., and Schwarcz, H. (2001). Causes of colour and fluorescence in speleothems. Chem. Geol. 175, 319–341. doi:10.1016/S0009-2541(00)00343-0
Vanghi, V., Borsato, A., Frisia, S., Howard, D. L., Gloy, G., Hellstrom, J., et al. (2019). High-resolution synchrotron X-ray fluorescence investigation of calcite coralloid speleothems: elemental incorporation and their potential as environmental archives. Sedimentology 66, 2661–2685. doi:10.1111/sed.12607
Verosub, K. L., and Roberts, A. P. (1995). Environmental magnetism: past, present, and future. J. Geophys. Res. 100, 2175–2192. doi:10.1029/94JB02713
Vuille, M., Burns, S. J., Taylor, B. L., Cruz, F. W., Bird, B. W., Abbott, M. B., et al. (2012). A review of the South American Monsoon history as recorded in stable isotopic proxies over the past two millennia: Clim. Past Discuss. 8, 637–668. doi:10.5194/cpd-8-637-2012
Wassenburg, J. A., Immenhauser, A., Richter, D. K., Jochum, K. P., Fietzke, J., Deininger, M., et al. (2012). Climate and cave control on Pleistocene/Holocene calcite-to-aragonite transitions in speleothems from Morocco: elemental and isotopic evidence. Geochem. Cosmochim. Acta. 92, 23–47. doi:10.1016/j.gca.2012.06.002
Keywords: speleothem, environmental magnetism, paleoclimate, rock magnetism, drought
Citation: Fu RR, Hess K, Jaqueto P, Novello VF, Kukla T, Trindade RIF, Stríkis NM, Cruz FW and Ben Dor O (2021) High-Resolution Environmental Magnetism Using the Quantum Diamond Microscope (QDM): Application to a Tropical Speleothem. Front. Earth Sci. 8:604505. doi: 10.3389/feart.2020.604505
Received: 09 September 2020; Accepted: 04 December 2020;
Published: 14 January 2021.
Edited by:
Junsheng Nie, Lanzhou University, ChinaReviewed by:
Qingsong Liu, Chinese Academy of Sciences (CAS), ChinaYu-Min Chou, Southern University of Science and Technology, China
Copyright © 2021 Fu, Hess, Jaqueto, Novello, Kukla, Trindade, Stríkis, Cruz and Ben Dor. This is an open-access article distributed under the terms of the Creative Commons Attribution License (CC BY). The use, distribution or reproduction in other forums is permitted, provided the original author(s) and the copyright owner(s) are credited and that the original publication in this journal is cited, in accordance with accepted academic practice. No use, distribution or reproduction is permitted which does not comply with these terms.
*Correspondence: Roger R. Fu, cm9nZXJmdUBmYXMuaGFydmFyZC5lZHU=