 Miriam Christina Reiss1*
 James D. Muirhead2
 Amani S. Laizer3Frederik Link1Emmanuel O. Kazimoto3
 Cynthia J. Ebinger4Georg Rümpker1
- 1Institute of Geosciences, Goethe University Frankfurt, Frankfurt, Germany
- 2School of Environment, University of Auckland, Auckland, New Zealand
- 3Department of Geology, University of Dar es Salaam, Dar es Salaam, Tanzania
- 4Department of Earth and Environmental Sciences, Tulane University, New Orleans, LA, United States
Constraining the architecture of complex 3D volcanic plumbing systems within active rifts, and their impact on rift processes, is critical for examining the interplay between faulting, magmatism and magmatic fluids in developing rift segments. The Natron basin of the East African Rift System provides an ideal location to study these processes, owing to its recent magmatic-tectonic activity and ongoing active carbonatite volcanism at Oldoinyo Lengai. Here, we report seismicity and fault plane solutions from a 10 month-long temporary seismic network spanning Oldoinyo Lengai, Naibor Soito volcanic field and Gelai volcano. We locate 6,827 earthquakes with ML −0.85 to 3.6, which are related to previous and ongoing magmatic and volcanic activity in the region, as well as regional tectonic extension. We observe seismicity down to ∼17 km depth north and south of Oldoinyo Lengai and shallow seismicity (3–10 km) beneath Gelai, including two swarms. The deepest seismicity (∼down to 20 km) occurs above a previously imaged magma body below Naibor Soito. These seismicity patterns reveal a detailed image of a complex volcanic plumbing system, supporting potential lateral and vertical connections between shallow- and deep-seated magmas, where fluid and melt transport to the surface is facilitated by intrusion of dikes and sills. Focal mechanisms vary spatially. T-axis trends reveal dominantly WNW-ESE extension near Gelai, while strike-slip mechanisms and a radial trend in P-axes are observed in the vicinity of Oldoinyo Lengai. These data support local variations in the state of stress, resulting from a combination of volcanic edifice loading and magma-driven stress changes imposed on a regional extensional stress field. Our results indicate that the southern Natron basin is a segmented rift system, in which fluids preferentially percolate vertically and laterally in a region where strain transfers from a border fault to a developing magmatic rift segment.
Introduction
Continental rifting is a geodynamic process in plate tectonics. However, the forces enabling the onset of rifting of comparatively strong, cold, thick continental lithosphere and the relative importance of magmatic and extensional processes remain poorly understood (e.g., Bialas et al., 2010; Brune et al., 2017). A key question is how strain accommodation is partitioned between faulting and magmatism (e.g., Ebinger and Casey, 2001; Thybo and Nielsen, 2009; Marzen et al., 2020). Tectonic thinning is commonly accompanied by decompression melting and the rise of volatiles and magma through the lithosphere (White and McKenzie, 1989; Weinlich et al., 1999; Rooney, 2010; Lee et al., 2016). Therefore, intrusion of magma and volatile release are thought to play a pivotal, yet interacting, role in the continental rifting process (Lindenfeld et al., 2012a; Wright et al., 2012; Muirhead et al., 2016; Weinstein et al., 2017).
The magma-assisted rifting model by Buck (2004) describes how, if a steady supply of magma is available, extensional strain can be largely accommodated by dike intrusion at a fraction of the force required for tectonic faulting, which reduces activity on rift-bounding border faults (also see Keir et al., 2006). Dike intrusions are enabled by the buoyancy of magma, which ascends from basaltic melt generation zones in the mantle toward a neutral buoyancy level at the base of the crust. Faulting and dike intrusion accommodate extension in the upper crust (Rubin and Pollard, 1988; Rowland et al., 2007; Baer et al., 2008; Trippanera et al., 2019), while released magmatic volatiles can weaken lithosphere through increased pore fluid pressures (Sibson, 2000; Reyners et al., 2007) and/or hydration mineral reactions (Moore and Rymer, 2007). All of these processes enhance the frequency of seismic activity and drive localization of fault-related strain (e.g., Muirhead et al., 2016; Chiodini et al., 2020).
Regions of active and evolving continental extension represent ideal locations to test the role of magma and magmatic volatiles in controlling rift processes (Wright et al., 2012; Lee et al., 2016; Hunt et al., 2017; Oliva et al., 2019a; Kämpf et al., 2019). For example, the distribution of seismicity observed in tectonically active systems can provide unprecedented constraints on the 3D distribution of deformation associated with the magmatic, tectonic, and volcanic systems that interact to achieve continental extension (Geissler et al., 2005; Lambotte et al., 2014; Hurst et al., 2016; Nakai et al., 2017). These can be compared to geologically constrained models of state-of-stress from extensional stress and surface, internal, and subsurface density contrasts that load the plate (e.g., Karlstrom et al., 2010; Oliva et al., 2019b).
Geological, geodetic, geochemical and geophysical investigations of magma-rich rift systems in East Africa have revealed arguably the most dynamic magmatic-tectonic interactions observed in any such setting (e.g., Keir et al., 2006; Ebinger et al., 2010; Rooney et al., 2014; Wauthier et al., 2015). Combined geodetic and seismic observations reveal that magma systems situated within the center of rift segments can feed up to 45 km-long lateral dike injections (Wright et al., 2006). Stress changes associated with these dike intrusions drive shallow normal faulting (Rowland et al., 2007) and can trigger eruptions from magma chambers situated tens of kilometers from the initial point of magma injection (Wright et al., 2006; Ayele et al., 2009). Seismicity and InSAR observation of active intrusions in the Erta Ale rift segment (Ethiopia) reveal that ∼10 km-spaced magma chambers can synchronously feed eruptions through laterally connecting dikes (Pagli et al., 2012). Observations in the Kenya Rift reveal transient uplift and subsidence from nearby sources at some volcanoes, which is interpreted to represent magma migration through laterally connected melt bodies (Biggs et al., 2009, 2016).
This study utilizes a densely spaced seismic network in the southern Natron basin to provide unprecedented constraints on the 3D distribution of seismicity in an active magma-rich continental rift, which allows us to interpret the geometry and dynamics of the plumbing system. The early-stage Natron rift basin (∼3 Ma; Foster et al., 1997) contains Earth’s only active natrocarbonatite volcano Oldoinyo Lengai and represents a region of recent dike and fault activity (Calais et al., 2008; Biggs et al., 2013). This volcano and a volcanic field are located in the interaction zone between a border fault-controlled rift segment and a developing rift magmatic segment (Muirhead et al., 2015, 2016; Roecker et al., 2017; Weinstein et al., 2017), where mantle fluids drive hydraulic fracturing and associated fluid ascent along active fault systems (Lee et al., 2016; Oliva et al., 2019a). Specifically, we report on ten months of seismicity and related focal mechanisms from the temporary SEISVOL network (Seismic and Infrasound Networks to study the volcano Oldoinyo Lengai) from 2019. These data are examined to discriminate zones of active intrusion and fluid migration and to understand how these processes control spatial variations in local stress states, rift kinematics and volcanic activity.
Tectonic Setting
Oldoinyo Lengai is located in the North Tanzanian Divergence, which is part of the East African Rift System (EARS, Figure 1). This is the longest continental rift worldwide with relatively slow extension rates, which are typically between 1–7 mm yr−1 in the present day in the North Tanzanian Divergence (Saria et al., 2014). In the North Tanzanian Divergence, magmatism initiated at ∼6 Ma (Mana et al., 2012), with evidence for faulting in the Natron basin region since 3 Ma (Foster et al., 1997), which in the present day is assisted by fluids rising through the plate as evidenced by earthquake swarms (Albaric et al., 2014; Lee et al., 2016; Weinstein et al., 2017). These interpretations are corroborated by soil CO2 flux as well as carbon and helium isotope data from springs in the Natron basin, Tanzania, and Magadi basin, Kenya, revealing that magmatic CO2 ascends to the surface along deeply penetrating faults in parts of the EARS (Lee et al., 2016; Lee et al., 2017; Muirhead et al., 2020).
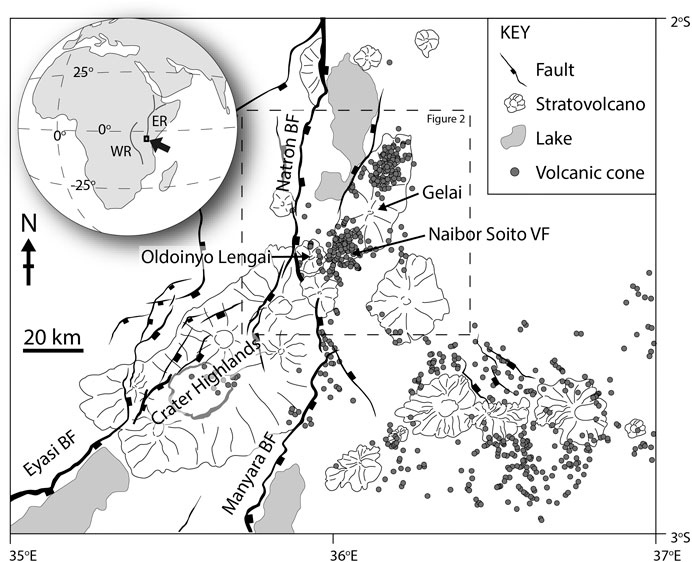
FIGURE 1. Tectonic map of the research area with volcanoes and faults. The dashed line denotes the outline of Figure 2. The inset shows the two branches of the East African Rift system with the rectangle denoting the research area.
The North Tanzanian Divergence hosts the 200 km-wide Ngorongoro-Kilimanjaro Volcanic Belt, a diachronous belt of volcanoes that formed since ∼6 Ma, and shows an eastward younging trend (Le Gall et al., 2008; Mana et al., 2015; Muirhead et al., 2015, Figure 1). It consists of a large number of basaltic shields and composite cones that have a wide range of lava compositions including basanites, melilitites, basalts, nephelinites, phonolites, as well as carbonatites, implying multiple source depths and both asthenospheric and (dominantly) lithospheric mantle material (e.g., Dawson, 1992; Mana et al., 2015; Mollex et al., 2018). The unusual carbonatitic magmas are likely sourced from an enriched cratonic mantle lithosphere that experienced extensive metasomatism, with or without an asthenospheric melt component (Foley et al., 2012; Mollex et al., 2018; Muirhead et al., 2020). The magmas produced at these volcanoes exhibit high CO2 contents, probably derived from small partial melting of a metasomatized mantle source (Fischer et al., 2009; Mana et al., 2015). Oldoinyo Lengai is situated at the southern end of the Natron basin and adjacent to its western border fault. In its immediate vicinity is Naibor Soito volcanic field, a monogenetic cone field with metasomatized mantle xenoliths, and the ∼1 Ma Gelai volcano (Dawson et al., 1995; Aulbach et al., 2011; Muirhead et al., 2016; Figure 1).
Eruptions at Oldoinyo Lengai initiated at ∼0.37 Ma (Dawson et al., 1995; Sherrod et al., 2013). Recent explosive volcanism occurred in 1917, 1940–1941, 1966–1967 and 2007–2008, and generally involved nephelinitic silicate magma (Dawson et al., 1995; Klaudius and Keller, 2006; Keller et al., 2010). The 2007–2008 explosive Oldoinyo Lengai eruption sequence was preceded and accompanied by a July-September 2007 earthquake swarm (70 earthquakes with M > 4) associated with a dike intrusion below the Naibor Soito volcanic field and the inactive Gelai volcano (Baer et al., 2008; Calais et al., 2008; Biggs et al., 2009; Kervyn et al., 2010; Biggs et al., 2013). This was the first diking event to be captured geodetically in the region (Baer et al., 2008; Calais et al., 2008). Field and InSAR observations showed extensive surface deformation, which is best explained by slip on a normal fault and successive dike-opening by stress unclamping (Calais et al., 2008; Biggs et al., 2009; Biggs et al., 2013). InSAR data also support a second diking event 3.4 km below Oldoinyo Lengai between October and December 2007 (Biggs et al., 2013). Both events were accompanied by the emptying of a shallow magmatic reservoir in close proximity as inferred from InSAR data (Calais et al., 2008; Biggs et al., 2009; Biggs et al., 2013).
The 2007 events at Oldoinyo Lengai sparked new debate on the magmatic plumbing system and the volcano’s connection with Gelai, the Naibor Soito volcanic field and surrounding rift faults (Biggs et al., 2013; Weinstein et al., 2017; Jones et al., 2019). Authors suggested that an undetected dike sourced from a deep-seated magma chamber predated the initial fault slip detected during the 2007 unrest period (Baer et al., 2008; Biggs et al., 2013). From petrological observations, magma volume estimates and stress calculations, the 2007 eruptions could not have been sourced by a single shallow magmatic reservoir (Kervyn et al., 2010; Biggs et al., 2013). Instead, the volcanic-tectonic event was most likely driven by a pressurized deep magma chamber, and magma was then distributed from there in the shallow crust, and fed into the Oldoinyo Lengai chamber, according to the local background stress (Baer et al., 2008; Biggs et al., 2013). Since then, a tomographic inversion by Roecker et al. (2017) imaged a low velocity, high Vp/Vs body interpreted as a single magma chamber between both volcanoes below a depth of 15 km. The combined tomography and seismicity data sets imaged two elliptical low velocity, high seismicity zones interpreted as sills that might have fed the 2007 dike intrusion, and triggered the eruption at Oldoinyo Lengai (Oliva et al., 2019a). Coulomb stress changes related to the volcanic-intrusive sequence may have also unclamped a section of the western Natron border fault, with the resulting slip detected on a local GPS network in early 2008 (Jones et al., 2019).
Data and Methods
Data
The SEISVOL project (Seismic and Infrasound Networks to study the volcano Oldoinyo Lengai) is a temporary station deployment with 33 seismic and four infrasound stations. The deployed stations form a seismic network and array (Figure 2) that were operative from February/March 2019 to June 2020. The seismic network and array comprised 10 Trillium Compact 120 and 20 Mark L4-3D seismometers, three 3D 4.5-Hz geophones and 33 Digos Cube 3-channel data loggers from the Geophysical Instrument Pool Potsdam (GIPP) and Goethe University Frankfurt. The infrasound stations consisted of four MB2017 sensors (ISTerre) and four Digos Cube 3-channel data loggers from Goethe University Frankfurt. All seismic stations recorded data at 100 Hz. Due to harsh field conditions, batteries as well as GPS antennas had to be replaced on a regular basis, and resulted in occasional downtimes for many stations (Figure 3A). Here, we use data from March 1st to December 31st, 2019, as the remaining data were inaccessible due to the Covid-19 pandemic.
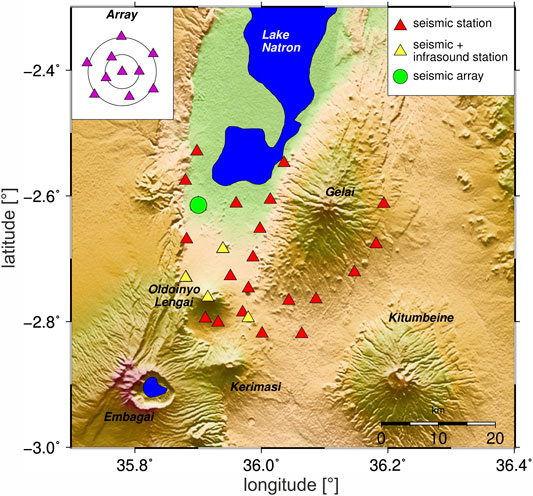
FIGURE 2. Seismic stations are red triangles, and co-located seismic and infrasound stations are yellow triangles. The green circle denotes the seismic array which is shown in the upper left corner. Volcanoes are written in bold black letters.
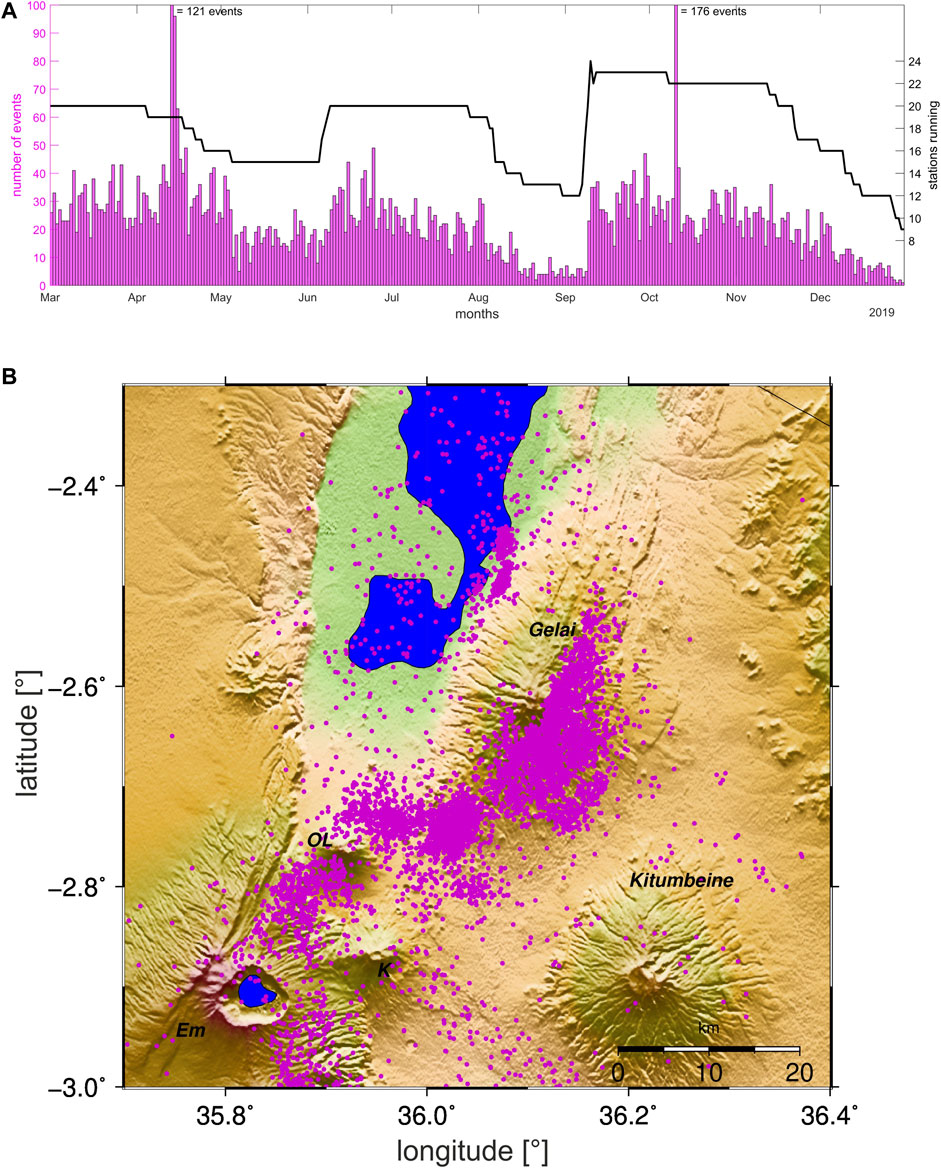
FIGURE 3. (A) Histogram of well-located earthquakes per day (left y-axis) and superimposed numbers of running stations (right y-axis). (B) Seismicity map, small circles show earthquakes.
Earthquake Locations
We used the python software QuakeMigrate (Bacon et al., 2019) to detect, trigger, and locate earthquakes automatically. This software is based on the Coalescence Microseismic Mapping technique (Drew et al., 2013) and reports earthquake locations as well as P-and S-wave picks on the vertical and horizontal components, respectively. We analyzed the data using a bandpass filter of 1–25 Hz and the 1D velocity model from Albaric et al. (2010). We then filtered these results by the earthquakes’ global covariance error in x, y and z directions and kept only earthquakes with less than 5 km horizontal and 7 km vertical uncertainties.
To obtain accurate hypocenter locations, we then relocated these chosen events with the probabilistic, nonlinear earthquake code NONLINLOC (Lomax et al., 2000) using the 3D-velocity model by Roecker et al. (2017) for the North Tanzanian Divergence. The final seismicity catalog consists only of earthquakes between −2.3° and −3.0° Latitude and from 35.7° to 36.4° Longitude, and with location errors less than 5 km in the horizontal and 7 km in the vertical direction as calculated from final NONLINLOC location uncertainties and at least six picks. We report 6827 earthquakes with average location errors of 1.57 km in longitude, 1.59 km in latitude and 3.8 km in depth. We have ensured the location accuracy by comparing the automatically obtained earthquake locations with a subset of manually picked and located events, as well as comparing the differences between using a 1D and 3D velocity model. We can support the assertion by Weinstein et al. (2017) that differences in earthquake locations between both models are inconsequential and mostly within the horizontal and vertical errors.
Magnitudes
Magnitudes were calculated automatically in QuakeMigrate after Greenfield et al. (2018): after de-meaning and tapering the data, the instrument response is removed on each waveform. Then, waveforms are convolved with the response of a Wood-Anderson seismograph with the corrected gain of 2080 (Urhammer, 1982). For all network stations, the maximum zero-to-peak amplitude is picked on both horizontal components. Amplitudes are only picked if the maximum amplitude is greater than twice the standard deviation of a 10 s window of the data before the P-wave onset. Accordingly, only good recordings contribute to the calculated magnitude. These were then calculated on the local magnitude scale using the formula:
where Mi is the local magnitude of earthquake i, Aijk the amplitude recorded at each station j and component k, and the second terms denotes that we normed the magnitudes by a magnitude 3 earthquake in 17 km distance, using the hypocentral distance rij and the attenuation parameters K and n (Hutton and Boore, 1987). K and n were derived for Tanzania by Langston et al. (1998) and are suitable given the small distance range for which they lead to equivalent magnitudes as compared to the parameters reported by Weinstein et al. (2017). Reported magnitudes are an average of all horizontal components per event (Greenfield et al., 2018).
Focal Mechanisms
We manually inspected the automatic earthquake catalog for suitable earthquakes for the calculation of focal mechanisms. We visually inspected waveforms for those earthquakes with more than 11 automatic P-and S-wave picks. We re-picked P- and S- wave arrival times on unfiltered waveforms for those events, which show little noise contamination using the SEISAN software (Havskov and Ottemöller, 1999), and relocated these earthquakes with the in SEISAN implemented HYPOCENTER algorithm by Lienert and Havskov (1995). We used the 1D velocity model by Albaric et al. (2010) as SEISAN only permits 1D velocity models. Given our previous analysis, location differences to the 3D model are negligible. We continue to use only those earthquakes with azimuthal gaps smaller than 180° and at least eight P-wave polarity picks, which we picked on raw vertical traces.
Fault plane solutions were then derived using the FOCMEC algorithm by Snoke et al. (1984), which is also implemented in SEISAN. This is a grid search algorithm to find the orientation of nodal planes using a double-couple solution. We started our analysis with a grid of 5° and tested whether a unique solution can be obtained. If this is the case, we refine the grid down to 1° where possible. If a unique solution cannot be obtained, but solutions for a larger grid show a preferred mechanism, we manually picked SV/P amplitudes on the vertical component and included those in the inversion. We repeated our grid search for a grid of 5° and allowed for larger deviations in the amplitude ratios given large local attenuation effects. We only included those solutions that are unique for a grid of 5°, but refined the grid where possible. This procedure allowed us to constrain these fault-plane solutions accurately and enables us to report focal mechanisms for more earthquakes than using P-wave polarities alone (for categorization examples, see Supplementary Figure S1). In total, we report 281 fault plane solutions corresponding to three categories. 48% consist of solutions using only P-wave polarities, 48% are solutions using SV/P amplitude ratios additionally, and in 4% of cases we had to allow for one polarity error. We estimated the uncertainty of solutions by calculating a 95% confidence level for P/T plunges and trends using all solutions per event and found no systematic differences between small and large magnitude events.
Results
Earthquake Locations
We located 6,827 earthquakes within and in the vicinity of our network (Figure 3; Supplementary Table S1). On average, we report 22 earthquakes per day, but the number of running stations heavily biases the number of reported events (Figure 3A). The locations of failed stations also impact the number of detected earthquakes. This effect is especially pronounced for stations at the network border, i.e. east of Gelai. During a period when the original setup of 20 stations was running, we detected 29 earthquakes per day on average. Figure 3A clearly shows two periods in time (April 13–15th, and October 10th) that greatly exceeded the average earthquake number per day. During these periods, two seismic swarms were observed, which will be discussed in (Swarms).
The observed seismicity is heavily clustered beneath volcanic centers (Figure 3B). More than half of the earthquakes are located beneath the eastern flank of Gelai, which is also the location for the first earthquake swarm. There is a separate cluster beneath the Naibor Soito monogenetic cone field. Earthquakes also cluster north and south of Oldoinyo Lengai, but locations below the border fault are poorly constrained given the station setup. Scattered seismicity appears beneath Lake Natron, with two distinct clusters between the lake and adjacent to the western flank of Gelai. One of these clusters corresponds to a discrete seismic swarm recorded in October 2019. Most of the seismicity occurs at a depth of 5–10 km (Figure 4A).
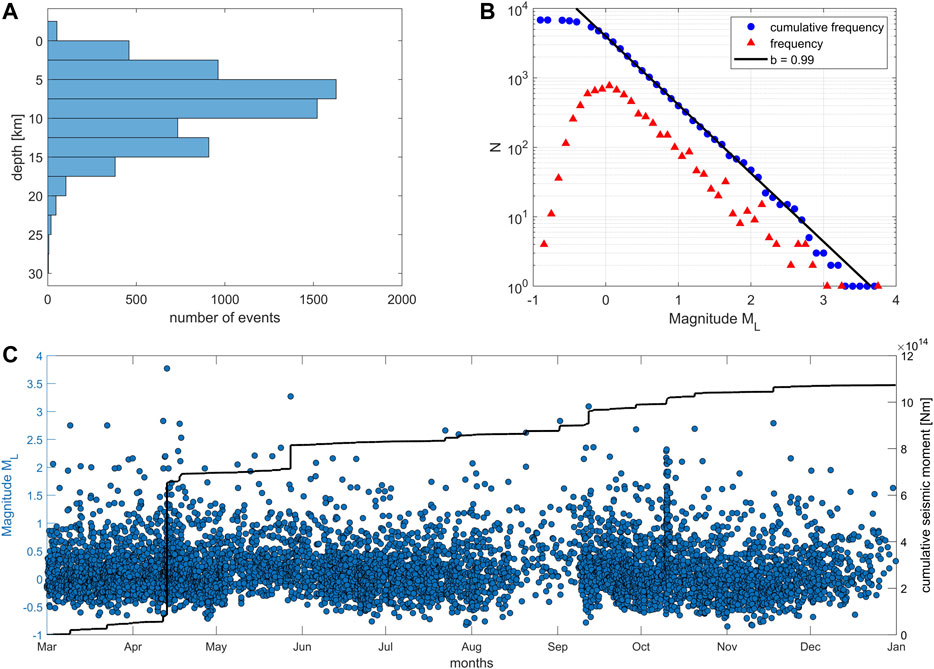
FIGURE 4. (A) Depth distribution of earthquakes. (B) Cumulative magnitude-frequency and magnitude-frequency distribution. The b-value was calculated after determining MC using the adjusted maximum curvature method of Woessner and Wiemer (2005). (C) Magnitude distribution per day over the reported 10 months of data overlain by the cumulative seismic moment estimate.
Magnitudes and B-Value
Local magnitudes ML range between −0.85 and 3.6. The largest magnitude earthquake is part of the first seismic swarm in April 2019 beneath the eastern flank of Gelai (see (Swarms), Figure 4). We sort the magnitudes into 0.1 ML bins and find that the four most populated bins lie between −0.2 and 0.2 ML, which corresponds to 40% of the data. We derive the magnitude of completeness (MC) using the maximum curvature method and apply the 0.2 correction factor of Woessner and Wiemer (2005) to obtain an MC value of 0. We calculate the b-value by a robust, linear least squares fit to be ∼0.99 (Figure 4B). We note that our b-value estimate changes slightly throughout the observational period, as the detection threshold for small magnitude events strongly depend on the number of running stations (see Supplementary Figure S2).
The calculated local magnitudes were used to estimate the cumulative seismic moment release throughout the 10 months observation period (Figure 4C). Given the sparse number of calibrated earthquakes, we adopt the crude assumption that the moment magnitude MW = ML. This assumption is supported by a comparison of local and teleseismically calculated magnitudes in the study region by Weinstein et al. (2017), who found that 2 ML 4.7 and 4.7 earthquakes on June 3, 2013 corresponded to body wave magnitude mb 4.5 and mb 4.6 events documented in the National Earthquake Information Center (NEIC) catalog. Indeed, mb is expected to closely resemble Mw for earthquakes of mb ≤ 5 (Gasperini et al., 2013). Our results show that seismic moment release is nearly constant over time, but dominated by the 3.6 ML event on April 13, 2019.
Spatial Distribution
Here, we focused only on well-constrained events close to and within the network by removing all earthquakes at distances larger than 2.5 km from the seismic network boundaries. A total of 5,658 earthquakes occurred within the defined boundary, with horizontal and vertical errors of 1.5 and 3.7 km, respectively. The depth distribution of seismicity varies spatially within our focus site. To illustrate these depth variations, we project the seismicity along three profiles through all clusters (Figure 5).
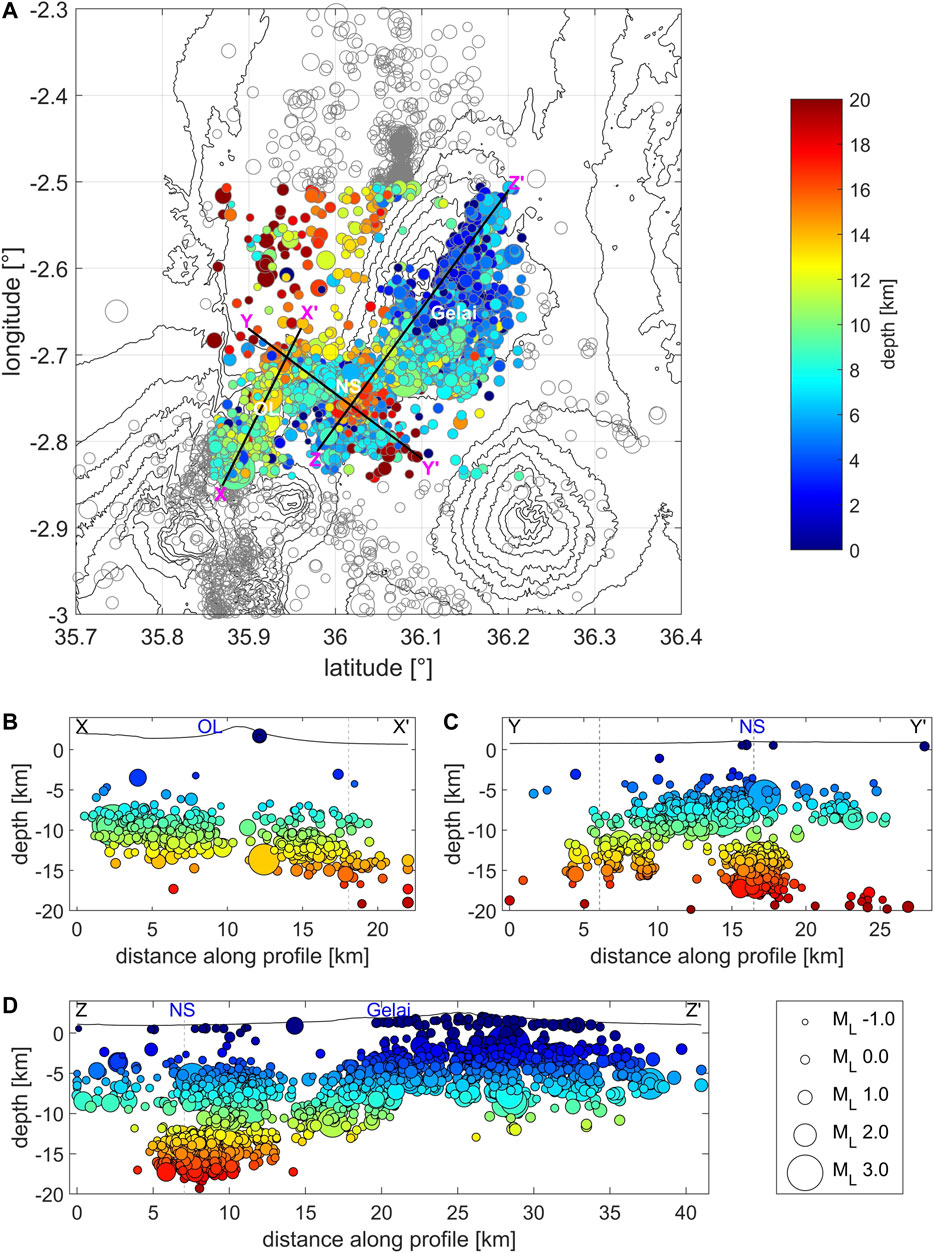
FIGURE 5. (A) Map view of well-located earthquakes scaled by their magnitude and colored by their depth. (B) Enlarged vertical cross-section along the profile of X-X’. (C) Enlarged vertical cross-section along the profile of Y-Y’. (D) Enlarged vertical cross-section along the profile of Z-Z’. Intersections between profiles are marked with a gray dashed line. Color scale is saturated at 20 km for better visibility, as few events occur beneath 20 km depth.
Profile X-X’ transects the two clusters south and north of Oldoinyo Lengai (Figure 5B). Seismicity in the south, close to the border fault, typically occurs between 8 and 13 km depth and gradually deepens northward, with earthquake depths ranging ∼13–17 km at the northern end of the profile. Similar earthquake depths are observed farther north of Oldoinyo Lengai below Lake Natron, with most events here ranging 12–20 km depth (Figure 5B). Directly beneath Oldoinyo Lengai is a notable seismic gap. Magnitudes along this profile are mostly between −0.3 and −0.2 with one larger event at ML = 3.27.
Profile Y-Y’ runs southeast from the cluster north of Oldoinyo Lengai through the Naibor Soito volcanic field (Figure 5C). In the center of the profile, the seismicity is located only in shallow depths of 5–10 km. Below the Naibor Soito volcanic field there are two clusters of seismicity, one at 5–10 km depth and another at 13–18 km depth. There is a noticeable gap between the deep cluster in the North (as seen in X-X’) and the deep cluster beneath Naibor Soito. Toward the southeast end of profile Y-Y’, seismicity is less abundant with scattered shallow (5–7 km) and deep (18–20 km) events. Overall, earthquake magnitudes along this profile are slightly smaller (∼0.1 ML) than in profile X-X’, with the biggest event ML = 2.83.
Profile Z-Z’ runs from the southwest end of the Naibor Soito volcanic field northward along the eastern flank of Gelai (Figure 5D). This profile reveals an area of intense seismicity. Earthquakes at the southwestern edge of the Naibor Soito volcanic field are generally shallow, with depths ranging from 3 to 10 km. As with profile B-B’, shallow and deep seismicity clusters are present at 5–10 km and 13–18 km depth, respectively, below the Naibor Soito volcanic field. This is followed by an abrupt seismic gap at 13–16 km along the profile. Beneath the gap, seismicity is first between depths of 10–13 km, and then gradually becomes shallower toward the center of Gelai. Seismicity beneath Gelai is mostly between 3–10 km, and the largest event with ML = 3.6 is visible at ∼ 28 km along the profile.
Focal Mechanisms
Following our procedure described in Data and Methods, we report 281 well-constrained focal mechanisms (see Supplementary Table S2). We use the plunge of the P- and T-axis to categorize the solutions into the three main faulting types: strike-slip (blue symbols; P- and T-axis plunge 0–45°), normal (red symbols; P- and T-axis plunge 45–90° and 0–45, respectively) and reverse mechanisms (green symbols; P- and T-axis plunge between 0–45° and 45–90°; see Figure 6A). Fault plane solution are dominantly strike-slip (57%), with normal mechanisms making up 39% of the data, and rare occurrences of reverse mechanisms (4%). The mean direction of T-axes is NW-SE (Figure 6B).
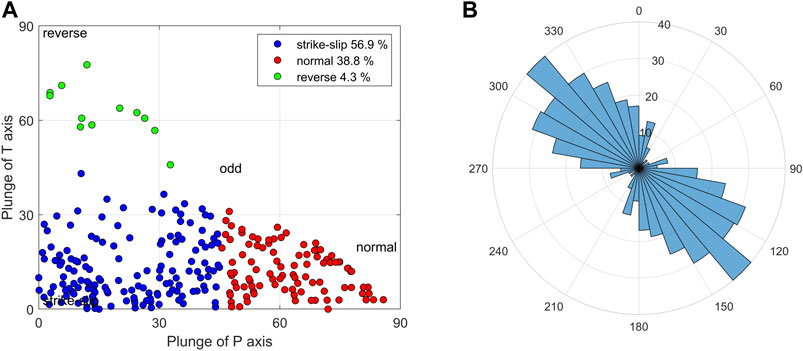
FIGURE 6. (A) Classification and distribution of all focal mechanisms on the basis of P- and T-axis plunge. (B) Rose histogram of T-axis direction of all focal mechanisms.
For ease of visualization, we show the best 50 solutions on a map only. We define those as being well constrained with a fine grid by using only P-wave polarizations, thus giving these focal mechanisms more importance than those constrained with amplitude ratios, and have at least 15 polarity picks (Figure 7, see Supplementary Figure S1 for categories). Focal mechanisms around Oldoinyo Lengai are purely strike-slip, with T-axis trends varying between N-S to E-W. Above the Naibor Soito volcanic field and at Gelai volcano, normal faulting dominates with minor strike-slip mechanisms. The northernmost focal mechanism at Gelai is part of the first swarm. T-axis directions are ∼ N-S or NW-SE. Three normal faulting events were constrained below the southern shore of Lake Natron. Owing to the network design, we cannot constrain focal mechanisms in other areas.
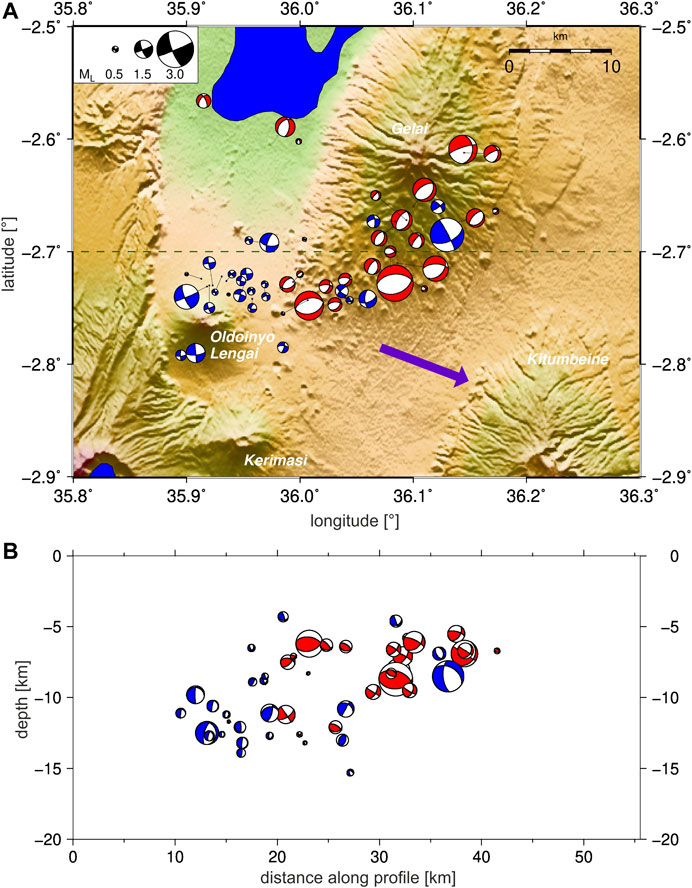
FIGURE 7. Map and cross-section of best focal mechanisms. Blue and red beach balls show strike-slip and normal mechanisms, respectively. The size of the beach balls is given by their magnitude. (A) Map view. The green line denotes the cross-section shown in (B). The purple vector show the GPS velocity of 1.1 mm/year from Saria et al. (2014). (B) Cross section.
To study the direction of extension more closely, we plot the T-axis direction as a bar centered on the earthquake location and group the data into different depth bins (Figure 8). Here, we omit all T-axes with confidence level widths above 40° while the remaining 82% have an uncertainty smaller than 10°. We constrain only a few mechanisms above 5 km depth of which most are located beneath Gelai in a NW-SE direction. This is more evident between 5–7 km depth and persists down to 9 km. T-axis directions below Naibor Soito volcanic field are very mixed throughout the 5–7 km, 9–11 km and below 13 km depth slices. North and East of Oldoinyo Lengai, T-axes can be divided into two groups: N-S and E-W directions. In 7–11 km depth, axes east of Oldoinyo are mostly N-S, while in 9–13 km, axes north of Oldoinyo are E-W.
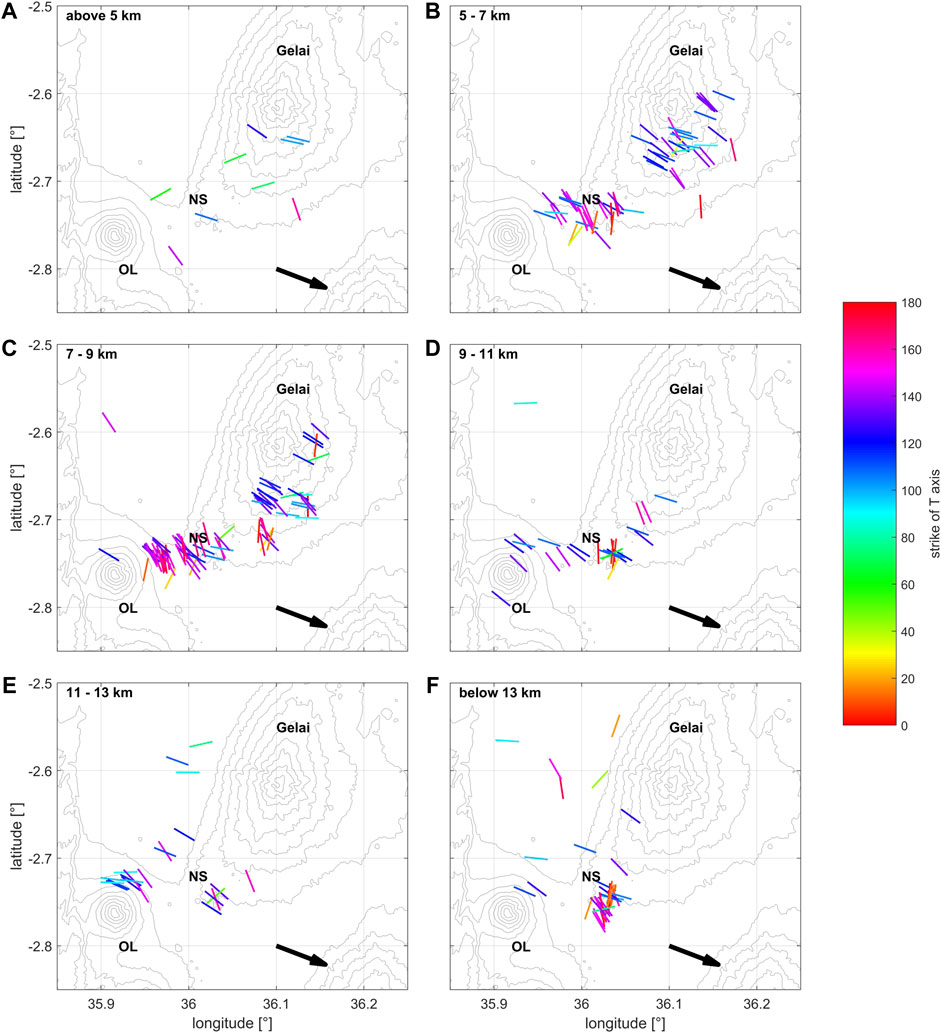
FIGURE 8. Map view of T-axis direction of focal mechanisms. Axes are centered on earthquake location and colored by their azimuth. (A) 0–5 km depth. (B) 5–7 km depth. (C) 7–9 km depth. (D) 9–11 km depth. (E) 11–13 km depth. (F) below 13 km depth.
Swarms
We observed two 1–3 days-long seismic swarms within the 10 months of data acquisition. During these swarms, the study region experienced a 5- to 8-fold increase in the number of earthquakes in a single day (Figure 3A), most of which were confined to a <10 km2 area (Figure 9). The first swarm occurred April 13th–15th 2019 on the eastern flank of Gelai. We re-picked all swarm events manually, including amplitudes, in SEISAN and relocated them in NLL (see Supplementary Table S3). The swarm consists of 266 well-located earthquakes with a spatial distribution resembling a ∼2 × 2 km-wide and ∼11 km-deep pipe-like structure between 2 and 9 km depth (Figure 9A). Mean location errors are 0.8, 1.1 and 4 km in latitude, longitude and depth, respectively. Among the very first earthquakes was a 3.6 ML event, which was located at the lower depth bound of the swarm pattern. The swarm has a b-value of 1.01 (see Supplementary Figure S3 for the magnitude-frequency relation and distribution of magnitudes over time). There is no clear pattern in the distribution of seismicity in space or time, with events distributed throughout the interpreted pipe-like feature occurring the entire duration of the swarm. We are unable to constrain a fault plane solution for the largest event (ML = 3.6), due to a small arrival before the P-wave. The second largest event with ML = 2.2, which occurred on April 15th at 05:47, was a normal faulting event. We constrain seven mechanisms in total, with four normal, two strike-slip and one reverse mechanism (Figure 9A left). All mechanisms, except the reverse faulting event, have a T-axis trend of NW-SE.
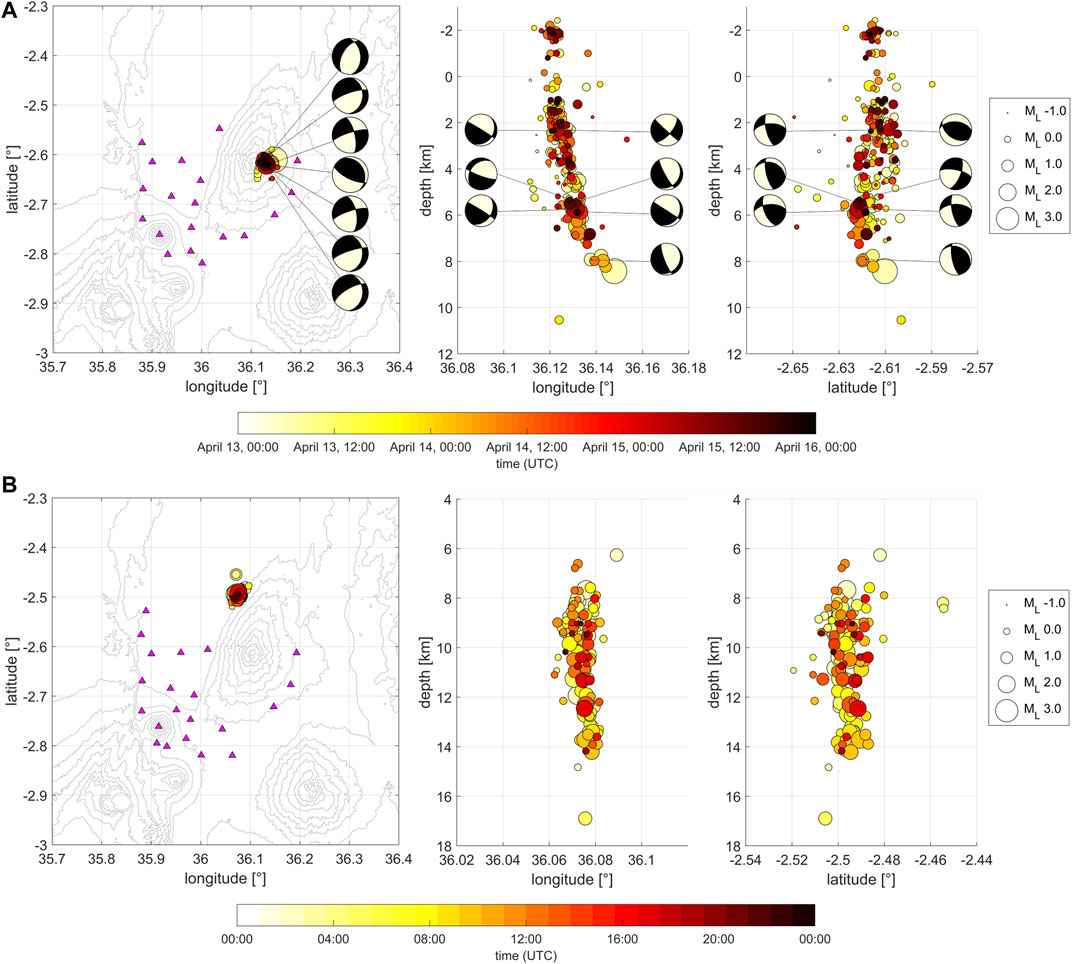
FIGURE 9. (A)Left: Map view of first seismic swarm April 13th–15th 2019. Purple triangles are seismic stations running at the time. Circles are earthquakes colored by time and their size corresponds to their magnitude. Center: Enlarged vertical cross-sections of earthquakes along x-axis of left. Right: Enlarged vertical cross-section of their appearance in earthquakes along y-axis of left). In every subpanel, focal mechanisms are shown in the margins and connected to the hypocenters with black lines. (B)Left: Map view of first seismic swarm on October 10th, 2019. Purple triangles are seismic stations running at the time. Circles are earthquakes colored by time and their size correspond to their magnitude. Center: Enlarged vertical cross-sections of earthquakes along x-axis of left. Right: Enlarged vertical cross-section of their appearance in earthquakes along y-axis of left.
The second seismic swarm comprises 151 events that occurred on October 10th, between Lake Natron and the western Gelai flank (Figure 9B). We did not manually re-pick this swarm as it is north of the network and the two closest stations were not running. The locations and depth are likely less well-constrained, although average location uncertainties are 1 km in longitude, 1.5 km in latitude and 4.5 km in depth. Earthquakes in this swarm were located between 6–15 km depth and their distribution resembles a 2 × 2 km-wide pipe-like structure. Given the distance to the closest seismic stations, we likely do not observe many earthquakes below ML = 0. Our b-value estimate is 0.72 (see Supplementary Figure S4 for the magnitude-frequency relation and distribution of magnitudes over time), and we cannot constrain any focal mechanisms for this swarm.
Discussion
Here we discuss our observations in relation to previous studies. Seismicity observations from the southern Natron basin are sparse, and are only available for part of the 2007–2008 eruption (Calais et al., 2008; Albaric et al., 2010) and a 13-months deployment in 2013–2014 (Weinstein et al., 2017; Oliva et al., 2019a), which marked a time of relatively little activity at Oldoinyo Lengai as inferred from satellite data (Coppola et al., 2016; Mirova, 2020). As discussed below, our results show that some seismicity patterns observed during these previous deployments are consistent over decadal timescales, while previously unrecognized patterns reveal shorter-term variability in local magmatic-tectonic processes.
Generally, seismicity clusters below the volcanic centers, and as such we define five areas of seismic activity: 1) Oldoinyo Lengai, 2) Naibor Soito volcanic field, 3) Gelai, 4) Crater Highlands, and 5) Lake Natron (Figure 10A). Given our network design, the detailed 3D seismicity patterns are best constrained and show the greatest detail below areas (1), (2) and (3), which will be the focus of the following sections. The networks lacks resolution for earthquakes below the Crater Highlands (4), which is located at the SE edge of the network, and thus we largely omit these data from further discussion. Comparatively little seismic activity is observed below Lake Natron (5) associated with the east-dipping western border fault. This is consistent with the findings of Weinstein et al. (2017), and suggests that recent extensional strain accommodation has been facilitated through magmatic activity (e.g., dike, sill intrusions) rather than slip along border faults. The only major seismic swarm observed below Lake Natron correlates with a west-dipping fault at the western edge of Gelai volcano. This fault is characterized by sets of fault-parallel springs exhibiting high 3He/4He ratios and diffuse soil CO2 discharges, indicative of tectonic degassing of deep mantle volatiles (Lee et al., 2016; Lee et al., 2017).
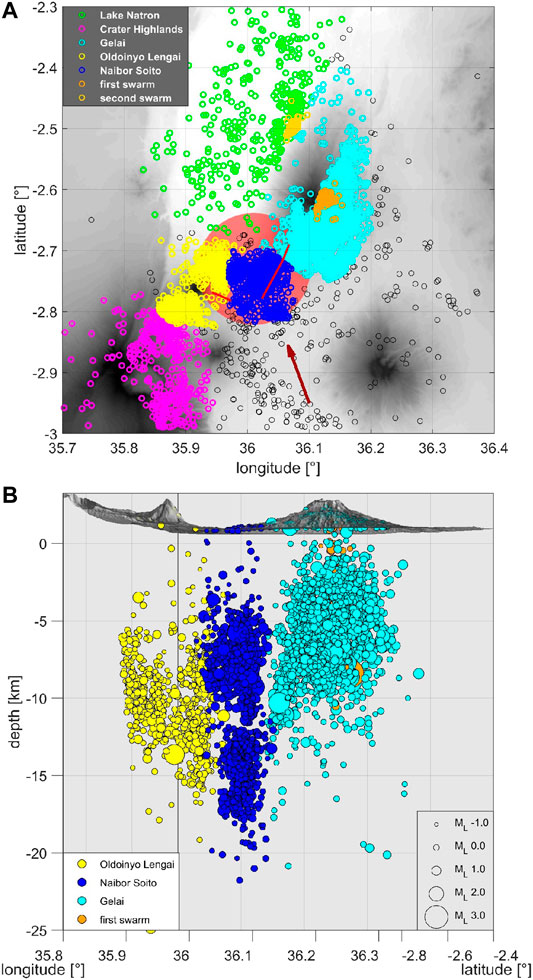
FIGURE 10. (A) Map view of earthquakes (open circles) grouped by area: (1) yellow for Oldoinyo Lengai, (2) blue for Naibor Soito, (3), cyan for Gelai, (4) magenta for Crater Highlands, (5) green for Lake Natron. The two swarms are shown in orange and gold. Inferred dikes are shown as red lines (Calais et al., 2008; Biggs et al., 2013) and roughly dimensioned magma chamber in shaded-red inferred from Roecker et al. (2017). Purple arrow shows view angle in (B). (B) Vertical Cross-section of (A) looking −20°N. Circles show earthquakes and are colored by group and scaled by their magnitude.
Tectonic vs Fluid-Driven Seismicity in the Natron Basin
The southern Natron basin appears to have experienced persistent earthquake activity for the last 13 years, with likely more than 1,000 events of >0 ML occurring every year (Calais et al., 2008; Albaric et al., 2010; Weinstein et al., 2017; this study). Our results indicate an increase in b-value from 2013–2014 of 0.87 (Weinstein et al., 2017) to 0.99, which is consistent with the 10–15 years eruptive cycle of Oldoinyo Lengai and increasing pressurization on the system. This persistent seismicity likely reflects the influence of a crustal magma plumbing system on the rifting process. For example, in many continental rift settings, crustal strain is accommodated by a combination of magmatism and faulting (e.g. Buck, 2004). Melting via decompression may be generated by large lateral gradients in topography at the lithosphere-asthenosphere boundary (LAB) with or without the influence of an anomalously hot upper mantle (e.g. Ebinger and Sleep, 1998). Basaltic magma is less dense than the mantle lithosphere, and rises to the base of the crust of equivalent density (Watanabe et al., 1999). Here, these magmas will temporarily pond as melt bodies that, depending on magma flux and the efficiency of heat transfer through the lithosphere, may induce further heating and melting of surrounding rock before eventually freezing as an underplate (e.g., Thybo and Artemieva, 2013; Karakas and Dufek, 2015; Rooney et al., 2017). Heating and volatile release in these regions serve to localize magmatism, and this heating may reduce crustal strength and further localizes strain (Bialas et al., 2010). Crustal thinning and intrusion of magma cause changes in crustal density, which, in addition to rift basin topography and volcanic construction, generates loads that moderate the tectonic state-of-stress (Karlstrom et al., 2009; Maccaferri et al., 2014). Flexural isostatic compensation for the loads leads to plate bending, and depth-dependent state of stress. Intrusions moderate the stress field in the crust and in large part determine the orientation and location of subsequent intrusions (e.g., Gudmundsson, 1995; Buck et al., 2006; Karlstrom et al., 2009).
Crustal seismicity in magmatic rift zones can therefore reflect a variety of processes, from tectonic- to fluid-driven faulting, magma transport and storage, and pre-, syn- and post-eruption dynamics. Broadly, observed seismicity can roughly be differentiated into 1) fluid processes (e.g., magma ascent in conduits, gas pressurization in conduits, bubble formation) that lead to low frequency, long-period events; or 2) brittle shear failure or shear failure with dilatation, which produce high-frequency events (e.g. McNutt, 2005). Given the comparatively high frequency content of the earthquakes reported here, we assume most earthquakes are associated with brittle deformation, although fluid (over)pressures likely play an important role driving much of the observed seismicity (i.e., Lindenfeld et al., 2012b). Here, we examine seismicity patterns and focal mechanisms for 1) Oldoinyo Lengai, 2) Naibor Soito, and 3) Gelai shield volcano to characterize the extent to which both faulting and magmatic processes are active between eruptions.
Oldoinyo Lengai
First, we discuss the deep crustal seismicity close to Oldoinyo Lengai, which occurs north and south of the volcano. Previously, Albaric et al. (2010) detected seismicity down to 15 km beneath the eastern flank during the early stages of the 2007 eruption, whereas Weinstein et al. (2017) detected a cluster beneath the northern flank from 2013–2014. Seismicity north of the volcano is deeper than in the south (Figures 5, 10) and there is little seismicity in the vicinity of the second, late 2007 dike intrusion inferred from surface deformation patterns (Biggs et al., 2013). In Iceland, deep crustal seismicity (e.g., below the brittle-ductile transition down to 25 km) has been interpreted to represent brittle failure resulting from melt migration (e.g. Hudson et al., 2017; Greenfield et al., 2018). Weinstein et al. (2017) assume a weakly hydrated mafic granulite lower crustal composition based on crustal xenoliths from the study region, and estimate the brittle-ductile transition at ∼16 km depth. Seismicity could also be caused by fluid-driven fracturing due to magmatic degassing (e.g. Lindenfeld et al., 2012b) or be related to the down-dip extension of the border fault below the volcano, along which deeply-sourced fluids such as CO2 abundantly escape (Lee et al., 2016; Muirhead et al., 2020) and may cause fault zone weakening (Reyners et al., 2007). To conclude, seismicity at 15–20 km could thus be indicative of volatile or magmatic fluid movement.
Focal mechanisms at Oldoinyo Lengai are purely strike-slip. Similar strike-slip kinematics have been observed at other volcano-tectonics settings (e.g., Ágústsdóttir et al., 2016; Haug et al., 2018) and may be explained through a variety of mechanisms. In Afar, Pagli et al. (2019) show how linking rift segments can produce strike-slip tectonics. Dering et al. (2019) confirm the recent geophysical evidence for dike-parallel shear failure that can occur in the host rocks surrounding intruding dykes. Considering magmatic interactions, Hill (1977) suggests that observed strike-slip mechanisms result from the joining of offset opening cracks where hypocenters are located at the edges of interacting dike segments. Similarly, moment-tensor solutions from the 2014 Bárðarbunga-Holuhraun dike intrusion support strike-slip motions parallel to the advancing dike tip (Ágústsdóttir et al., 2016). Roman (2005) support a model where strike-slip earthquakes occur in the walls of inflating dikes. In this example, dike inflation causes a 90° rotation of P-axes from that predicted by the regional tectonic stress field, which allows for strike-slip motions. In all these examples, the regional extensional stress deviates locally during periods of magma influx, leading to strike-slip mechanisms as the predominant slip mode.
Support for a local magma-driven stress field around Oldoinyo Lengai comes from the spatial pattern of P-axes for strike-slip mechanisms around the volcano. These exhibit a sub-radial pattern, with the trends of the P-axes converging near the center of the volcanic edifice (Figure 11) in accordance with vent lineament data associated with the Naibor Soito volcanic field (Muirhead et al., 2015). This local stress pattern would also be enhanced by loading associated with both Oldoinyo Lengai and the Crater Highlands (Oliva et al., 2019b). Notably, the strike of the late 2007 dike intrusion beneath Oldoinyo Lengai also matches a predicted radial pattern, which may be best explained by a combination of the effects of magma overpressures in the volcanic feeder system and edifice loading (Biggs et al., 2013; Roman and Jaupart, 2014; Muirhead et al., 2015). Numerical studies investigating these effects (e.g. Karlstrom et al., 2009; Oliva et al., 2019b) reveal that edifice loading exerts a greater influence on the local stress state in the shallow upper crust, whereas magmatic overpressures exert the dominant stress control in vicinity of magma chambers at depth. These processes play a critical role in driving local stress rotations and controlling fracture and dike orientations (e.g., Kervyn et al., 2009). In our study region, the depth of the strike-slip events (<9 km) and their proximity to magma pathways below the volcano support a role of magmatic pressures in controlling local stress deviations at depth, thereby capturing the effects of the Oldoinyo Lengai magmatic system on the surrounding stress state. Of note, our interpretation is somewhat limited by the fact we cannot utilize surface deformation patterns (e.g. InSAR data) as an additional independent dataset to support our arguments above, as the source depths of the analyzed focal mechanisms are not conducive to any detectable surface deformation.
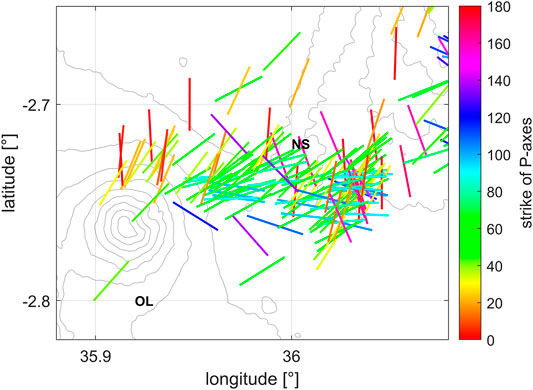
FIGURE 11. Map view of P-axis directions of focal mechanisms below Oldoinyo Lengai and Naibor Soito. Axes are centered on their earthquake location and colored by their azimuth.
Naibor Soito
Beneath Naibor Soito volcanic field, seismicity is divided into a shallower (5–10 km depth) and deeper cluster (12–18 km depth), with comparatively little seismicity occurring at depths of 10–12 km, except for a fine structure seemingly connecting both (Figures 5, 10B). Both clusters were observed in 2012–2013 (Weinstein et al., 2017). The seismicity cluster between 12 and 18 km occurs on top of a S-wave low velocity and high Vp/Vs zone, which has been interpreted previously as a lower crustal magma body (Roecker et al., 2017). In agreement with previous authors, we assume that the seismicity detected adjacent to and above this low-velocity zone represents fluid-triggered fracturing, resulting from one or a combination of devolatization of magmas and the migration of melt from lower crustal reservoirs (Roecker et al., 2017; Weinstein et al., 2017). The shallow, disc-shaped seismicity pattern was interpreted as a complex of pressurized, hot sills likely fed by the deeper magma source (Weinstein et al., 2017). These shallow sills in-turn may have sourced the 2007 dike intrusion (Calais et al., 2008; Weinstein et al., 2017). The recurring non-double couple source mechanisms suggest that numerous intrusions from the same complex have occurred since 1995 (Oliva et al., 2019a). Thus, our and previous observations support a central, deep magmatic source which drives the volcanism locally.
Below the Naibor Soito volcanic field, our high-resolution observations allow us to distinguish a complex pattern of focal mechanisms and T/P-axis directions. Above the magma chamber (below 13 km) and in the pressurized sill complex (5–7 km; 9–11 km), there is no dominant mechanism or stress direction. Between 7 and 9 km depth, T-axes are ∼ N-S (or nearly E-W P-axes, Figure 11), which represents a rotation of local stress away from the regional ESE-WNW extension direction (Saria et al., 2014). Both observations are best explained by magmatic processes associated with melt transported from the deeper magmatic body to the shallow sill complex. While the pressurized magmatic bodies exert a changing stress field depending on their state (i.e. inflation or deflation), earthquakes in the walls of the inflating intrusions show a local horizontal stress change according to Roman (2005). This is also supported by the findings of Oliva et al. (2019b), who predict stress rotation between Oldoinyo Lengai, Naibor Soito and Gelai driven by magmatic intrusions and magma bodies at depth. These fluid driven stress-changes as well as strong shallow and deep seismicity patterns are among the most persistent, clearly imaged features of our dataset through our observational period.
Gelai
All temporary seismic networks have recorded persistent seismic activity beneath Gelai volcano since 2007 (Calais et al., 2008; Albaric et al., 2010; Weinstein et al., 2017). However, the closer station spacing in our network allows examination of seismic activity in greater detail than previous studies (Figures 5, 10). Locations reported by Calais et al. (2008) spread widely, which may largely reflect location uncertainties associated with locating events outside of the network. Albaric et al. (2010) found that seismic activity was primarily focused beneath the southern flank of Gelai, while Weinstein et al. (2017) reported activity beneath the southern and western flanks of Gelai. Overall, these previous results combined with our newly located earthquake data suggest that activity may have migrated northwards below Gelai over time, as the recent activity now reaches the northern end of Gelai (Figure 5). Beneath Gelai, earthquakes show predominantly normal faulting mechanisms (Figure 7) with T-axes sub-parallel to the regional extension direction (Saria et al., 2014; Muirhead et al., 2015; Weinstein et al., 2017), which is consistent with faulting in extensional rifts elsewhere (e.g. Keir et al., 2006; Lindenfeld et al., 2012a). These mechanisms contrast those at Oldoinyo Lengai and the Naibor Soito volcanic field. The strike of faults, dikes and previously determined focal mechanisms at Gelai typically indicate WNW-ESE extension (Calais et al., 2008; Albaric et al., 2010; Muirhead et al., 2015; Weinstein et al., 2017), which is consistent with geodetic data (Saria et al., 2014).
Gelai volcano is also associated with the April 2019 seismic swarm, which exhibits a very narrow, pipe-like shape. This swarm is in line with, and located ∼10 km north of, the 2007 dike intrusion as imaged by InSAR (Calais et al., 2008), which seems to have initiated the recent recorded Gelai seismic activity (Weinstein et al., 2017). However, seismicity associated with dike emplacement and propagation usually follows along a plane and migrates spatially through time in the direction of magma movement (e.g. Ebinger et al., 2010; Ágústsdóttir et al., 2016), and thus the 2019 swarm activity is not interpreted to relate directly to dike emplacement. Though not exhibiting a clear main shock after shock or clear temporal sequence, the 3.6 ML event is the first and second deepest event which seems to start the sequence. Afterward, other earthquakes rupture along the pipe, which is then active along the entire segment. Focal mechanisms show normal faulting representative of the regional stress field. Similar pipe-like seismic swarms were observed by Lindenfeld et al. (2012b) in the Rwenzori region of the Albertine Rift (Uganda) of the western branch of EARS, and were interpreted to originate from fluids and gases, sourced from a magmatic body, rising through the plate. Accordingly, this swarm may be caused by degassing along a currently hidden fault and is feasible given the high amount of CO2 degassing in the entire Natron rift (Lee et al., 2016, Lee et al., 2017; Muirhead et al., 2020). The shape and duration of the April 2019 swarm resembles the October swarm located between Gelai and Lake Natron which, given the nature of the seismicity and associated mantle volatile release at the surface (i.e., Lee et al., 2017), we attribute to ascent of deep mantle volatiles along a pre-existing fault. As crustal fluid speeds based on migrating seismic swarms are typically 10–100 m/day (Ibs-von Seht et al., 2001; Hariri et al., 2010), we assume that these earthquakes represent a mechanical response to subtle pressure changes in the fluid system due to changes in fault permeability (e.g. due mineral precipitation), in the local and/or regional stress state, and/or in the deep fluid flux (Sibson, 2000).
The 3D seismicity pattern beneath Gelai cannot be explained by slip on a single fault plane. Given our observations, the strong microseismicity in the last ∼13 years and repeating earthquake swarms, indicate that fluids and volatile release must play an important role in accommodating the extensional strain, as is evident in this and other rift settings (Lindenfeld et al., 2012b; Wright et al., 2012; Muirhead et al., 2016; Weinstein et al., 2017). Diffuse, high magmatic CO2 degassing from lower crustal intrusions throughout the entire Natron rift could cause significant earthquake activity (Lee et al., 2016; Weinstein et al., 2017). In fact, the latter suggested that the recent locus of strain accommodation has been focused in the central rift valley below Gelai, and that stress field rotation and magmatism below Oldoinyo Lengai and the Naibor Soito volcanic field have facilitated stress transfer from the western Manyara-Natron border fault to a newly developing rift segment beneath Gelai.
Plumbing System
Our detailed 3D seismicity patterns and focal mechanisms allow us to map the magmatic plumbing system associated with Oldoinyo Lengai volcano in unprecedented detail. The persistent pipe-like aseismic structures down to depths of 12 km, as well as well resolved areas of high seismicity, are particularly striking (Figure 10B) and may have implications about the long-debated plumbing system. We have summarized our findings in a sketch (Figure 12), which highlights our conceptual interpretation.
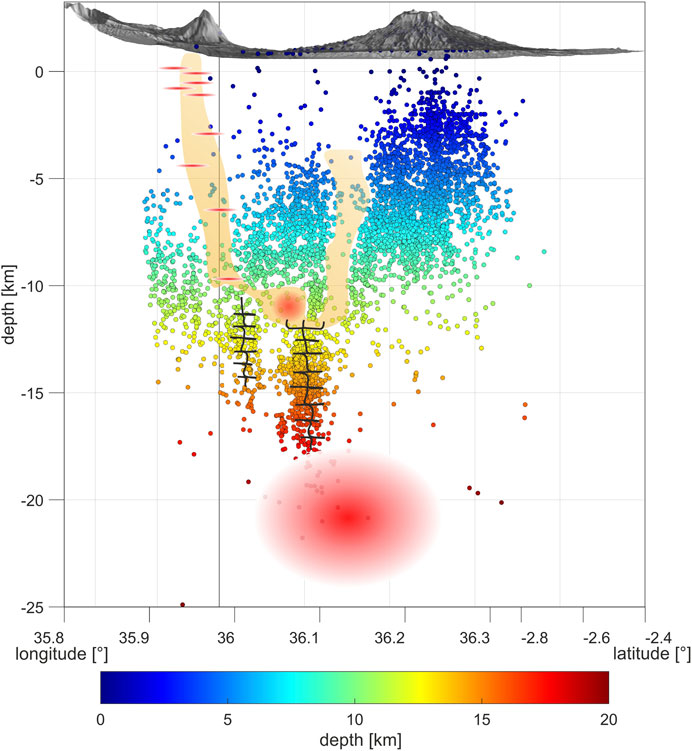
FIGURE 12. Plumbing system of Oldoinyo Lengai with seismicity. The orange shaded areas are seismic gaps interpreted as part of the mushy plumbing system, overlain with small reddish ellipses denoting sill complexes. Black lines denote deep plumbing system, which connect the hydrothermal system to the deep magma chamber inferred from Roecker et al. (2017).
There is a distinct aseismic zone beneath the Oldoinyo Lengai edifice, which extends to a depth of 10 km and becomes successively narrower with depth (Figures 10B, 12). This seismic gap may represent the region of persistent partial melt (i.e., Hudson et al., 2017) that connects the volcano to its deeper plumbing system, and/or has heated nearby country rock resulting in ductile rock behavior for extended time periods in otherwise brittle crust (Castaldo et al., 2019; Parisio et al., 2019). Indeed, renewed and persistent volcanic activity at Oldoinyo Lengai since late 2018, as inferred from satellite data (Massimetti et al., 2020), require open conduits transporting volatiles and melt to the surface. From tomography and complementary receiver function studies (Plasman et al., 2017), the volcano is underlain by a low S-wave anomaly and high Vp/Vs ratios at 5 km depth, which continue well under the rift shoulder (Roecker et al., 2017) and may represent zones of partial melt below the volcano. Alternatively, the spatially varying high and low Vp/Vs and aseismic pipes in this region may, at least in part, reflect the sustained hydrothermal system interpreted for this volcano (Mollex et al., 2018), which is closely associated with its underlying magma plumbing system.
The exact spatial extent and overall geometry of partial melt bodies and hydrothermal fluids below Oldoinyo Lengai volcano are challenging to resolve. Surface deformation observed in InSAR data in late 2007 were modeled as a deflating shallow magma chamber at 3 km depth beneath Oldoinyo Lengai (Biggs et al., 2013), and chemistry from prior eruptions has been previously considered to reflect a two-level system, with magma storage at 0.5 and 3.3 km depth (Petibon et al., 1998). In all, some models of nephelinite and natrocarbonatite magma generation at Oldoinyo Lengai require only one open magma system (de Moor et al., 2013), while others necessitate at least three distinct zones of melt accumulation and storage (Berkesi et al., 2020). Regardless of these uncertainties, our high-resolution observations of earthquake activity below the volcano are best explained by a high temperature zone of partial melt and hydrothermal circulation underlying the edifice, where this zone is too ductile to produce any earthquakes (e.g. Thurber, 1984; Bryan et al., 1999; Castaldo et al., 2019, Figure 12). Additionally, our seismicity data and other geophysical constraints (i.e., Roecker et al., 2017) suggest that the inferred mid-crustal magma chamber for the volcano (i.e., Mollex et al., 2018) might either be located in the aseismic zone beneath Oldoinyo Lengai, or just above the deep-seated seismicity beneath Naibor Soto, where we image a circular aseismic feature (Figures 10, 12).
A second, pipe-like seismic gap separates seismicity patterns between Naibor Soito and Gelai (Figures 10, 12). It is particularly interesting, as there are no detectable surface displacements accompanying volumetric expansion in the upper crust since 2007, and the ∼2.4 m-wide 2007 dike (Biggs et al., 2009) would have long since cooled and solidified. This aseismic zone may instead mark a region of 1) hydrothermally altered rock following the 2007 dike intrusion, 2) a region of currently recognized weak rock or 3) part of the hydrothermal system (e.g., Mollex et al., 2018; Parisio et al., 2019). Considering the large amount of earthquakes beneath Gelai, which may be driven in large parts by fluids or degassing, this aseismic zone may also facilitate fluid transfer from the deeper parts of the plumbing system to the shallow crust beneath Gelai.
In conclusion, we cannot differentiate between different geochemical models of the natrocarbonatite genesis, but our results constrain the magmatic plumbing system of the Natron rift by interpreting areas of high and low seismicity as fluid or melt transport and locally heated, ductile zones, respectively. Focal mechanisms show the influence of magmatic intrusions and magma bodies, which together with seismicity may point to different localities for magma differentiation.
Interactions Between Rift Segments
Our observations are consistent with conceptual models of magmatic rifting revealing enhanced vertical permeability and associated fluid migration within accommodation zones between rift segments (e.g. Corti, 2004; Rowland et al., 2007; Muirhead et al., 2015; Figure 13). Uniquely, the North Tanzania Divergence offers the opportunity to explore strain accommodation between border fault-controlled extension in the Manyara basin, to largely magma intrusion-controlled extension within the central Natron basin, where a new, magmatically controlled segmentation is developing (e.g., Ebinger and Casey, 2001; Muirhead et al., 2015; Oliva et al., 2019a). Stress distributions in border fault-controlled segments are largely controlled by the shape of the basin and flank topography, and the Moho geometry, whereas segments with crustal magma chambers and volcanoes are controlled by crustal thinning, magma bodies, and volcanic loading (Karlstrom et al., 2009; Muirhead et al., 2015; Oliva et al., 2019b).
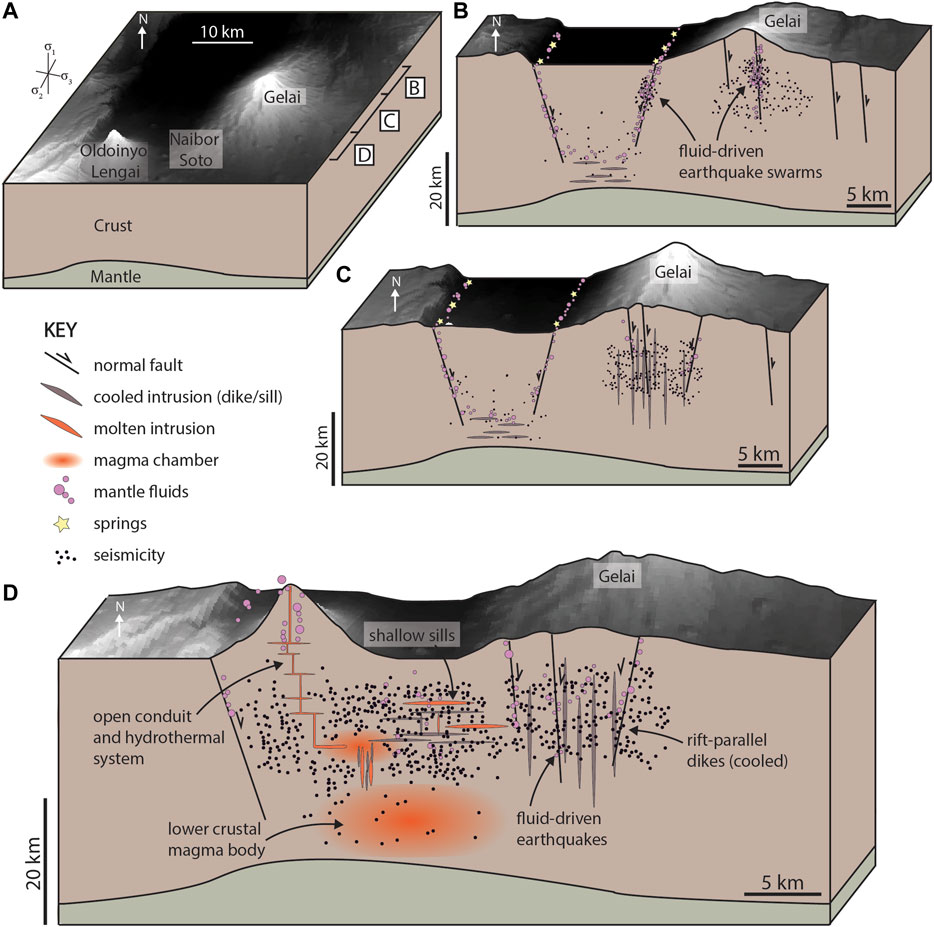
FIGURE 13. Idealized conceptual illustration of magmatic-fluid-tectonic interactions associated with the volcanic plumbing system of the south Natron basin. The structure of the plumbing systems is based on data and interpretations presented in the current study, as well as previous seismicity and geophysical studies by Roecker et al. (2017) and Weinstein et al. (2017). Crustal thicknesses are broadly based on Plasman et al. (2017) and surface topography is from the 90 m SRTM DEM dataset. (A) Surface topography and general crustal structure of the south Natron basin, highlighting the position of the key volcanic features. Letters refer to the presented crustal sections in (B–D). (B) General distribution of seismicity at the northern end of the seismic network. Deep seismicity occurs below Lake Natron, with seismic swarm behavior associated with fluid overpressures and fluid migration through the crust. Helium isotope data of dissolved spring volatiles and carbon isotopes of diffusely degassing CO2 support mantle fluid flow through these fault systems (Lee et al., 2016, Lee et al., 2017; Muirhead et al., 2020). (C) General distribution of seismicity through central regions of the seismic network. Seismicity patterns generally follow those in B and support fluid-driven earthquakes, although no specific seismic swarms have been identified. Cooled dike intrusions represent regions of past magmatic rifting, although no significant melt or active diking is inferred below Gelai volcano currently. (D) General distribution of seismicity throughout the southern end of the seismic network, with deformation patterns strongly influenced by the presence of melt and fluids. The infrequent occurrence of seismicity in the lower crust below the Naibor Soto volcanic field support the presence of lower crustal magma bodies, consistent with the crustal velocity structure presented by Roecker et al. (2017). Distinct seismic gaps below these volcanic systems represent vertical zones of partial melt and/or thermally altered regions, and represent possible connections between partial melt bodies at different crustal depths (Weinstein et al., 2017). Melt bodies and topographic loads impose local stress perturbations (Oliva et al., 2019b) indicated by variations in fault plane solutions observed in this system. Persistent low magnitude seismicity throughout the region supports a model of earthquake activity driven by the percolation of melt and magmatic volatiles, consistent with full moment tensor analyses by Oliva et al. (2019a) who found various non-double couple earthquake source mechanisms.
We image how the complex stress field in the inter-segment transfer zone drives the development of radial and rift-oblique dikes, faults and fracture systems, and how interconnected zones of magmatism feeding into these transfer zones facilitate strain transfer between the rift segments (Figure 13). Our seismicity and fault plane solutions reveal that the high flux of gas-rich magma into these regions produces overpressured magma reservoirs that locally perturbed stress fields. This is supported by vent alignment (Muirhead et al., 2015), InSAR data (Biggs et al., 2013; Wauthier et al., 2013) and temporally consistent earthquake source mechanisms (Oliva et al., 2019a). Furthermore, the shape of crustal thinning, the rift basin and flank topography guide zones of magma upwelling and storage, which promotes the transfer of strain to central volcanic systems (Oliva et al., 2019b). Extension-normal dikes inject into the rift to accommodate regional tectonic extension, while also focusing strain into newly developing rift segments (i.e., below Gelai volcano; Weinstein et al., 2017).
Conclusion
We report seismicity and focal mechanisms from a ten-month deployment in 2019 in the southern Natron basin, which encapsulates recent volcanic activity at the only active natrocarbonatite volcano Oldoinyo Lengai worldwide and repeated seismic swarms consistent with volatile release and dike intrusion. Seismicity patterns beneath Oldoinyo Lengai and Naibor Soito reveal a complex magmatic plumbing system in which melt is transported from a deep-seated magma chamber to the surface, and focal mechanisms reveal the influence of the edifice load, magmatic intrusions at depth and magma-driven stress changes. Seismicity at Gelai is consistent with fluid release and degassing of CO2 and focal mechanisms point to strain accommodation within the regional extensional stress field. Our results indicate that the southern Natron basin is a segmented rift system in which strain is transferred from the western border fault to a developing rift segment. The rift basin functions as a magmatic accommodation zone where fluids preferentially percolate vertically and thus prescribe the location of magma intrusion, storage and eruptive centers. These findings provide a framework for understanding and modeling complex interactions between tectonic and magmatic processes during continental rift initiation and development.
Data Availability Statement
The datasets generated for this study can be found at https://dx.doi.org/10.6084/m9. The dataset is archived at GEOFON Data Center, https://dx.doi.org/10.14470/4W7564850022.
Author Contributions
MCR is the PI of the SEISVOL project, processed the data, composed Figures 2–12, and wrote the first manuscript. JDM composed Figures 1, 13. MCR, ASL, FL, and GR acquired the field data, with substantial support by EOK, MCR, and GR conceived and designed the seismic and infrasound networks. All authors contributed to the interpretation of the results and writing of the paper.
Funding
MCR is funded by the DFG (German Research Council), grant number RE 4321/1-1. JDM received funding through an NSF EAR GeoPRISMS Program grant 1654518. Additional support for fieldwork and instrumentation was provided through funds from Goethe University to GR.
Conflict of Interest
The authors declare that the research was conducted in the absence of any commercial or financial relationships that could be construed as a potential conflict of interest.
Supplementary Material
The Supplementary Material for this article can be found online at: https://www.frontiersin.org/articles/10.3389/feart.2020.609805/full#supplementary-material.
Acknowledgments
We highly appreciate everyone involved in the fieldwork, especially members of Engaresero Village. We thank the Tanzania Commission for Science and Technology (COSTECH) for supporting us and providing the research permits. Instruments were kindly provided by the Geophysical Instrument Pool Potsdam (GIPP) and the Goethe University Frankfurt, and data were archived by GEOFON (GEOFON Data Center, 1993). We thank the developers of QuakeMigrate for technical support and Luca De Siena for constructive discussions. We thank both reviewers for their insightful comments.
References
Ágústsdóttir, T., Woods, J., Greenfield, T., Green, R. G., White, R. S., Winder, T., et al. (2016). Strike-slip faulting during the 2014 Bárðarbunga-Holuhraun dike intrusion, central Iceland. Geophys. Res. Lett. 43, 1495–1503. doi:10.1002/2015GL067423
Albaric, J., Deverchere, J., Perrot, J., Jakovlev, A., and Deschamps, A. (2014). Deep crustal earthquakes in North Tanzania, East Africa: interplay between tectonic and magmatic processes in an incipient rift. Geochem. Geophys. Geosyst. 15, 374–394. doi:10.1002/2013GC005027
Albaric, J., Perrot, J., Deverchere, J., Deschamps, A., Le Gall, B., Ferdinand, R. W., et al. (2010). Contrasted seismogenic and rheological behaviours from shallow and deep earthquake sequences in the North Tanzanian Divergence, East Africa. J. Afr. Earth Sci. 58, 799–811. doi:10.1016/j.jafrearsci.2009.09.005
Aulbach, S., Rudnick, R. L., and McDonough, W. F. (2011). Evolution of the lithospheric mantle beneath the East African Rift in Tanzania and its potential signatures in rift magmas. Geol. Soc. Am. Bull. 478, 105–125. doi:10.1130/2011.2478(06)
Ayele, A., Keir, D., Ebinger, C., Wright, T. J., Stuart, G. W., Buck, W. R., et al. (2009). September 2005 mega‐dike emplacement in the Manda‐Harraro nascent oceanic rift (Afar depression). Geophys. Res. Lett. 36 (20), 1–5. doi:10.1029/2009GL039605
Bacon, C. A., Smith, J. D., Winder, T., Hudson, T., Greenfield, T., and White, R. S. (2019). “QuakeMigrate: a modular, open-source Python package for earthquake detection and location,” AGU Fall Meeting, San Francisco, CA, October, 2019. [Abstract].
Baer, G., Hamiel, Y., Shamir, G., and Nof, R. (2008). Evolution of a magma driven earthquake swarm and triggering of the nearby Oldoinyo Lengai eruption, as resolved by InSAR’a, ground observations and elastic modeling, East African Rift. Earth Planet Sci. Lett. 272, 339–352. doi:10.1016/j.epsl.2008.04.052
Berkesi, M., Bali, E., Bodnar, R. J., Szabó, Á., and Guzmics, T. (2020). Carbonatite and highly peralkaline nephelinite melts from Oldoinyo Lengai Volcano, Tanzania: the role of natrite-normative fluid degassing. Gondwana Res. 85, 76–83. doi:10.1016/j.gr.2020.03.013
Bialas, R. W., Buck, W. R., and Qin, R. (2010). How much magma is required to rift a continent? Earth Planet Sci. Lett. 292 (1-2), 68–78. doi:10.1016/j.epsl.2010.01.021
Biggs, J., Anthony, E. Y., and Ebinger, C. J. (2009). Multiple inflation and deflation events at Kenyan volcanoes, East African Rift. Geology 37 (11), 979–982. doi:10.1130/G30133A.1
Biggs, J., Chivers, M., and Hutchinson, M. C. (2013). Surface deformation and stress interactions during the 2007–2010 sequence of earthquake, dyke intrusion and eruption in northern Tanzania. Geophys. J. Int. 195 (1), 16–26. doi:10.1093/gji/ggt226
Biggs, J., Robertson, E., and Cashman, K. (2016). The lateral extent of volcanic interactions during unrest and eruption. Nat. Geosci. 9 (4), 308–311. doi:10.1038/NGEO2658
Brune, S., Heine, C., Clift, P. D., and Pérez-Gussinyé, M. (2017). Rifted margin architecture and crustal rheology: reviewing Iberia-Newfoundland, central South Atlantic, and South China Sea. Mar. Petrol. Geol. 79, 257–281. doi:10.1016/j.marpetgeo.2016.10.018
Bryan, C. J., Sherburn, S., Bibby, H. M., Bannister, S. C., and Hurst, A. W. (1999). Shallow seismicity of the central Taupo Volcanic Zone, New Zealand: its distribution and nature. N. Z. J. Geol. Geophys. 42 (4), 533–542. doi:10.1080/00288306.1999.9514859
Buck, W. R. (2004). Consequences of asthenospheric variability on continental rifting. in Rheology and deformation of the lithosphere at continental margins: MARGINS theoretical and experimental Earth science series. (New York, NY: Columbia University Press), 1–30.
Buck, W. R., Einarsson, P., and Brandsdóttir, B. (2006). Tectonic stress and magma chamber size as controls on dike propagation: constraints from the 1975–1984 Krafla rifting episode. J. Geophys. Res.: Solid Earth 111 (B12), 1–5. doi:10.1029/2005JB003879
Calais, E., d'Oreye, N., Albaric, J., Deschamps, A., Delvaux, D., Déverchère, J., et al. (2008). Strain accommodation by slow slip and dyking in a youthful continental rift, East Africa. Nature 456 (7223), 783–787.
Castaldo, R., D’Auria, L., Pepe, S., Solaro, G., De Novellis, V., and Tizzani, P. (2019). The impact of crustal rheology on natural seismicity: campi Flegrei caldera case study. Geoscience Frontiers 10 (2), 453–466. doi:10.1016/j.gsf.2018.02.003
Chiodini, G., Cardellini, C., Di Luccio, F., Selva, J., Frondini, F., Caliro, S., et al. (2020). Correlation between tectonic CO2 Earth degassing and seismicity is revealed by a 10-year record in the Apennines, Italy. Sci. Adv. 6 (35), eabc2938. doi:10.1126/sciadv.abc2938
Coppola, D., Laiolo, M., Cigolini, C., Donne, D. D., and Ripepe, M. (2016). Enhanced volcanic hot-spot detection using MODIS IR data: results from the MIROVA system. Geol. Soc. Lond. Spec. Publ. 426, 181–205. doi:10.1144/sp426.5
Corti, G. (2004). Centrifuge modelling of the influence of crustal fabrics on the development of transfer zones: insights into the mechanics of continental rifting architecture. Tectonophysics 384 (1–4), 191–208. doi:10.1016/j.tecto.2004.03.014
Dawson, J. B., Keller, J., and Nyamweru, C. (1995). “Historic and recent eruptive activity of Oldoinyo Lengai,” in Carbonatite volcanism: Oldoinyo Lengai and the petrogenesis of natrocarbonatites, IAVCEI proc volcanol 4. Editors K. Bell, and J. Keller (Berlin, Germany: Springer), 4–22.
Dawson, J. B. (1992). Neogene tectonics and volcanicity in the north Tanzania sector of the gregory rift valley: contrasts with the Kenya sector. Tectonophysics 204, 81–83. doi:10.1016/0040-1951(92)90271-7
de Moor, M., Fischer, T. P., King, P. L., Botcharnikov, R. E., Hervig, R. L., Hilton, D. R., et al. (2013). Volatile-rich silicate melts from Oldoinyo Lengai volcano (Tanzania): implications for carbonatite genesis and eruptive behavior. Earth Planet Sci. Lett. 361, 379–390. doi:10.1016/j.epsl.2012.11.006
Dering, M. G., Micklethwaite, S., Cruden, A. R., Barnes, S. J., and Fiorentini, M. L. (2019). Evidence for dyke-parallel shear during syn-intrusion fracturing. Earth Planet Sci. Lett. 507, 119–130. doi:10.1016/j.epsl.2018.10.024
Drew, J., White, R. S., Tilmann, F., and Tarasewicz, J. (2013). Coalescence microseismic mapping. Geophys. J. Int. 195, 1773–1785. doi:10.1093/gji/ggt331
Ebinger, C., Ayele, A., Keir, D., Rowland, J., Yirgu, G., Wright, T.,, and Hamling, I. (2010). Length and timescales of rift faulting and magma intrusion: the Afar rifting cycle from 2005 to present. Annu. Rev. Earth Planet Sci. 38, 439–466. doi:10.1146/annurev-earth-040809-152333
Ebinger, C., and Casey, M. (2001). Continental brekaup in magmatic provinces: an Ethiopian example. Geology 29, 527–530. doi:10.1130/0091-7613(2001)029<0527:CBIMPA>2.0.CO;2
Ebinger, C. J., and Sleep, N. H. (1998). Cenozoic magmatism throughout east Africa resulting from impact of a single plume. Nature 395 (6704), 788–791. doi:10.1038/27417
El Hariri, M., Abercrombie, M. E., Roweland, C. A., and do Nascimento, A. F. (2010). The role of fluids in triggering earthquakes: observationsfrom reservoir induced seismicity in Brazil. Geophys. J. Int. 181 1566–1574.
Fischer, T. P., Burnard, P., Marty, B., Hilton, D. R., Füri, E., Palhol, F., et al. (2009). Upper-mantle volatile chemistry at Oldoinyo Lengai volcano and the origin of carbonatites. Nature 459, 77–80. doi:10.1038/nature07977
Foley, S. F., Link, K., Tiberindwa, J. V., and Barifaijo, E. (2012). Patterns and origin of igneous activity around the Tanzanian craton. J. Afr. Earth Sci. 62 (1), 1–18. doi:10.1016/j.jafrearsci.2011.10.001
Foster, A., Ebinger, C., Mbede, E., and Rex, D. (1997). Tectonic development of the northern Tanzanian sector of the east African Rift system. J. Geol. Soc. 154 (4), 689–700. doi:10.1144/gsjgs.154.4.0689
Gasperini, P., Lolli, B., and Vannucci, G. (2013). Body wave magnitude mb is a good proxy of moment magnitude Mw for small earthquakes (mb < 4.5–5.0). Seismol. Res. Lett. 84 (6), 932–937. doi:10.1785/0220130105
Geissler, W. H., Kämpf, H., Kind, R., Bräuer, K., Klinge, K., Plenefisch, T., and Nehybka, V. (2005). Seismic structure and location of a CO2 source in the upper mantle of the western Eger (Ohře) Rift, central Europe. Tectonics 24 (5), 5001. doi:10.1029/2004TC001672
Greenfield, T., White, R. S., Winder, T., and Ágústsdóttir, T. (2018). Seismicity of the Askja and Bárðarbunga volcanic systems of Iceland, 2009–2015. J. Volcanol. Geoth. Res. 391, 106432. doi:10.1016/j.jvolgeores.2018.08.010
Gudmundsson, A. (1995). Infrastructure and mechanics of volcanic systems in Iceland. J. Volcanol. Geoth. Res. 64 (1-2), 1–22. doi:10.1016/0377-0273(95)92782-Q
Haug, Ø. T., Galland, O., Souloumiac, P., Souche, A., Guldstrand, F., Schmiedel, T., et al. (2018). Shear versus tensile failure mechanisms induced by sill intrusions: implications for emplacement of conical and saucer‐shaped intrusions. J. Geophys. Res.: Solid Earth 123 (5), 3430–3449. doi:10.1002/2017JB015196
Havskov, J., and Ottemöller, L. (1999). Electronic seismologist. SeisAnEarthquake analysis software. Seismol. Res. Lett. 70, 532–534. doi:10.1785/gssrl.70.5.532
Hill, D. P. (1977). A model for earthquake swarms. J. Geophys. Res. 82, 1347–1352. doi:10.1029/JB082i008p01347
Hudson, T. S., White, R. S., Greenfield, T., Ágústsdóttir, T., Brisbourne, A., and Green, R. G. (2017). Deep crustal melt plumbing of Bárðarbunga volcano, Iceland. Geophys. Res. Lett. 44, 8785–8794. doi:10.1002/2017GL074749
Hunt, J. A., Zafu, A., Mather, T. A., Pyle, D. M., and Barry, P. H. (2017). Spatially variable CO2 degassing in the main Ethiopian rift: implications for magma storage, volatile transport, and rift‐related emissions. Geochemistry, Geophysics, Geosystems 18 (10), 3714–3737. doi:10.1002/2017GC006975
Hurst, T., Heise, W., Hreinsdottir, S., and Hamling, I. (2016). Geophysics of the taupo volcanic zone: a review of recent developments. Geothermics 59, 188–204. doi:10.1016/j.geothermics.2015.09.008
Hutton, L. K., and Boore, D. M. (1987). The ML scale in southern California. Bull. Seismol. Soc. Am. 77, 2074–2094.
Ibs-von Seht, M., Blumenstein, S., Wagner, R., Hollnack, D., and Wohlenberg, J. (2001). Seismicity, seismotectonics and crustal structure of the southern Kenya Rift–new data from the Lake Magadi area. Geophys. J. Int. 146(2), 439–453.
Jones, J. R., Stamps, D. S., Wauthier, C., Saria, E., and Biggs, J. (2019). Evidence for slip on a border fault triggered by magmatic processes in an immature continental rift. Geochemistry, Geophysics, Geosystems 20 (5), 2515–2530. doi:10.1029/2018GC008165
Kämpf, H., Broge, A. S., Marzban, P., Allahbakhshi, M., and Nickschick, T. (2019). Nonvolcanic carbon dioxide emission at continental rifts: the bublak mofette area, western eger rift, Czech republic. London, United Kingdom: Geofluids.
Karakas, O., and Dufek, J. (2015). Melt evolution and residence in extending crust: thermal modeling of the crust and crustal magmas. Earth Planet Sci. Lett. 425, 131–144. doi:10.1016/j.epsl.2015.06.001
Karlstrom, L., Dufek, J., and Manga, M. (2009). Organization of volcanic plumbing through magmatic lensing by magma chambers and volcanic loads. J. Geophys. Res.: Solid Earth 114 (B10). doi:10.1029/2009JB006339
Karlstrom, L., Dufek, J., and Manga, M. (2010). Magma chamber stability in arc and continental crust. J. Volcanol. Geother. Res. 190(2–4), 249–270.
Keir, D., Ebinger, C., Daly, E., Stuart, G., Maguire, P., and Ayele, A. (2006). Strain accommodation by magmatism and faulting as rifting proceeds to breakup: seismicity of the northern Ethiopian rift. J. Geophys. Res. 111, B05314. doi:10.1029/2005JB003748
Keller, J., Klaudius, J., Kervyn, M., Ernst, G. G. J., and Mattsson, H. B. (2010). Fundamental changes in the activity of the natrocarbonatite volcano Oldoinyo Lengai, Tanzania. Bull. Volcanol. 72, 893–912. doi:10.1007/s00445-010-0371-x
Kervyn, M., Ernst, G. G. J., Keller, J., Vaughan, G., Klaudius, J., Pradal, E., et al. (2010). Fundamental changes in the activity of the natrocarbonatite volcano Oldoinyo Lengai, Tanzania. II. Eruptive behavior. Bull. Volcanol. 72, 913–931. doi:10.1007/s00445-010-0360-0
Kervyn, M., Ernst, G. G. J., van Wyk de Vries, B., Mathieu, L., and Jacobs, P. (2009). Volcano load control on dyke propagation and vent distribution: insights from analogue modeling. J. Geophys. Res.: Solid Earth 114 (B3), B005653. doi:10.1029/2008JB005653
Klaudius, J., and Keller, J. (2006). Peralkaline silicate lavas at Oldoinyo Lengai, Tanzania. Lithos. 91, 173–190. doi:10.1016/j.lithos.2006.03.017
Lambotte, S., Lyon-Caen, H., Bernard, P., Deschamps, A., Patau, G., Nercessian, A.,, and Adamova, P. (2014). Reassessment of the rifting process in the Western Corinth Rift from relocated seismicity. Geophys. J. Int. 197 (3), 1822–1844. doi:10.1093/gji/ggu096
Langston, C. A., Brazier, R., Nyblade, A. A., and Owens, T. J. (1998). Local magnitude scale and seismicity rate for Tanzania, East Africa. Bull. Seismol. Soc. Am. 88, 712–721.
Le Gall, B., Nonnotte, P., Rolet, J., Benoit, M., Guillou, H., Mousseau-Nonnotte, M., et al. (2008). Rift propagation at craton margin. Distribution of faulting and volcanism in the North Tanzanian Divergence (East Africa) during Neogene times. Tectonophysics 448, 1–19. doi:10.1016/j.tecto.2007.11.005
Lee, H., Fischer, T. P., Muirhead, J. D., Ebinger, C. J., Kattenhorn, S. A., Sharp, Z. D., et al. (2017). Incipient rifting accompanied by the release of subcontinental lithospheric mantle volatiles in the Magadi and Natron basin, East Africa. J. Volcanol. Geoth. Res. 346, 118–133. doi:10.1016/j.jvolgeores.2017.03.017
Lee, H., Muirhead, J. D., Fischer, T. P., Ebinger, C. J., Kattenhorn, S. A., Sharp, Z. D., et al. (2016). Massive and prolonged deep carbon emissions associated with continental rifting. Nat. Geosci. 9 (2), 145–149. doi:10.1038/NGEO2622
Lienert, B. R. E., and Havskov, J. (1995). A computer program for locating earthquakes both locally and globally. Seismol. Res. Lett. 66, 26–36.
Lindenfeld, M., Rümpker, G., Batte, A., and Schumann, A. (2012a). Seismicity from february 2006 to september 2007 at the Rwenzori mountains, East African rift: earthquake distribution, magnitudes and source mechanisms. Solid Earth 3, 251–264. doi:10.5194/se-3-251-2012
Lindenfeld, M., Rümpker, G., Link, K., Koehn, D., and Batte, A. (2012b). Fluid-triggered earthquake swarms in the Rwenzori region, East African rift—evidence for rift initiation. Tectonophysics 566, 95–104. doi:10.1016/j.tecto.2012.07.010
Lomax, A., Virieux, J., Volant, P., and Berge-Thierry, C. (2000). “Probabilistic earthquake location in 3D and layered models,” in Advances in seismic event location. Modern approaches in geophysics. Editors C. Thurber, and N. Rabinowitz (Dordrecht, Netherlands: Springer), 18, 101–134. doi:10.1007/978-94-015-9536-0_5
Maccaferri, F., Rivalta, E., Keir, D., and Acocella, V. (2014). O-rift volcanism in rift zones determined by crustal unloading. Nature 7 (4), 297300. doi:10.1038/NGEO2110
Mana, S., Furman, T., Carr, M. J., Mollel, G. F., Mortlock, R. A., Feigenson, M. D., et al. (2012). Geochronology and geochemistry of the Essimingor volcano: melting of metasomatized lithospheric mantle beneath the North Tanzanian Divergence zone (East African Rift). Lithos. 155, 310–325. doi:10.1016/j.lithos.2012.09.009
Mana, S., Furman, T., Turrin, B. D., Feigenson, M. D., and Swisher, C. C. (2015). Magmatic activity across the east african north Tanzanian divergence zone. J. Geol. Soc. 172, 368. doi:10.1144/jgs2014-072
Marzen, R. E., Shillington, D. J., Lizarralde, D., Knapp, J. H., Heffner, D. M., Davis, J. K., et al. (2020). Limited and localized magmatism in the central atlantic magmatic province. Nat. Commun. 11 (1), 3397–3398. doi:10.1038/s41467-020-17193-6
Massimetti, F., Coppola, D., Laiolo, M., Valade, S., Cigolini, C., and Ripepe, M. (2020). Volcanic hot-spot detection using SENTINEL-2: a comparison with MODIS–MIROVA thermal data series. Rem. Sens. 12, 820. doi:10.14279/depositonce-10003
McNutt, S. R. (2005). Volcanic seismology. Annu. Rev. Earth Planet Sci. 32, 461–491. doi:10.1146/annurev.Earth.33.092203.122459
Mirova, (2020). Near real time volcanic hotspot detection system. Available at: http://www.mirovaweb.it (Accessed September 22, 2020).
Mollex, G., Füri, E., Burnard, P., Zimmermann, L., Chazot, G., Kazimoto, E. O., et al. (2018). Tracing helium isotope compositions from mantle source to fumaroles at Oldoinyo Lengai volcano, Tanzania. Chem. Geol. 480, 66–74. doi:10.1016/j.chemgeo.2017.08.015
Moore, D. E., and Rymer, M. J. (2007). Talc-bearing serpentinite and the creeping section of the San Andreas fault. Nature 448 (7155), 795–797. doi:10.1038/nature06064
Muirhead, J. D., Fischer, T. P., Oliva, S. J., Laizer, A., van Wijk, J., Currie, C. A., et al. (2020). Displaced cratonic mantle concentrates deep carbon during continental rifting. Nature 582 (7810), 67–72. doi:10.1038/s41586-020-2328-3
Muirhead, J. D., Kattenhorn, S. A., and Le Corvec, N. (2015). Varying styles of magmatic strain accommodation across the East African Rift. Geochem. Geophys. Geosyst. 16, 2. doi:10.1002/2015GC005918
Muirhead, J. D., Kattenhorn, S. A., Lee, H., Mana, S., Turrin, B. D., Fischer, T. P., et al. (2016). Evolution of upper crustal faulting assisted by magmatic volatile release during early-stage continental rift development in the East African Rift. Geosphere 12 (6), 1670–1700. doi:10.1130/GES01375.1
Nakai, J. S., Sheehan, A. F., and Bilek, S. L. (2017). Seismicity of the rocky mountains and Rio Grande Rift from the EarthScope Transportable Array and CREST temporary seismic networks, 2008–2010. J. Geophys. Res.: Solid Earth 122 (3), 2173–2192. doi:10.1002/2016JB013389
Oliva, S. J. C., Ebinger, C. J., Rivalta, E., Wauthier, C., Williams, C. A., and Currie, C. A. (2019b). “State-of-stress and stress rotations: quantifying the role of surface topography and subsurface density contrasts in magmatic rift zones (Eastern Rift, Africa),” in AGU Fall Meeting, San Francisco, CA, October, 2019. [Abstract].
Oliva, S. J., Ebinger, C. J., Wauthier, C., Muirhead, J. D., Roecker, S. W., Rivalta, E., et al. (2019a). Insights into fault-magma interactions in an early-stage continental rift from source mechanisms and correlated volcano-tectonic earthquakes. Geophys. Res. Lett. 46 (4), 2065–2074. doi:10.1029/2018GL080866
Pagli, C., Wright, T. J., Ebinger, C. J., Yun, S. H., Cann, J. R., Barnie, T., et al. (2012). Shallow axial magma chamber at the slow-spreading Erta Ale Ridge. Nat. Geosci. 5 (4), 284–288. doi:10.1038/ngeo1414
Pagli, C., Yun, S. H., Ebinger, C., Keir, D., and Wang, H. (2019). Strike-slip tectonics during rift linkage. Geology 47 (1), 31–34. doi:10.1130/G45345.1
Parisio, F., Vinciguerra, S., Kolditz, O., and Nagel, T. (2019). The brittle-ductile transition in active volcanoes. Sci. Rep. 9, 143. doi:10.1038/s41598-018-36505-x
Petibon, C. M., Kjarsgaard, B. A., Jenner, G. A., and Jackson, S. E. (1998). Phase relationships of a silicate-bearing natrocarbonatite from Oldoinyo Lengai at 20 and 100 MPa. J. Petrol. 39, 2137–2151. doi:10.1093/petroj/39.11-12.2137
Plasman, M., Tiberi, C., Ebinger, C., Gautier, S., Albaric, J., Peyrat, S., et al. (2017). Lithospheric low-velocity zones associated with a magmatic segment of the Tanzanian Rift, East Africa. Geophys. J. Int. 210(1), 465–481.
Reyners, M., Eberhart-Phillips, D., and Stuart, G. (2007). The role of fluids in lower-crustal earthquakes near continental rifts. Nature 446 (7139), 1075–1078. doi:10.1038/nature05743
Roecker, S., Ebinger, C., Tiberi, C., Mulibo, G., Wambura, F., Mtelela, K., et al. (2017). Subsurface images of the Eastern Rift, Africa, from the joint inversion of body waves, surface waves and gravity: investigating the role of fluids in early-stage continental rifting. Geophys. J. Int. 210 (2), 931–950. doi:10.1093/gji/ggx220
Roman, A., and Jaupart, C. (2014). The impact of a volcanic edifice on intrusive and eruptive activity. Earth Planet Sci. Lett. 408, 1–8. doi:10.1016/j.epsl.2014.09.016
Roman, D. C. (2005). Numerical models of volcanotectonic earthquake triggering on non-ideally oriented faults. Geophys. Res. Lett. 32, L02304. doi:10.1029/2004GL021549
Rooney, O. T., Lavigne, A., Svoboda, C., Girard, G., Yirgu, G., Ayalew, D., et al. (2017). The making of an underplate: pyroxenites from the Ethiopian lithosphere. Chem. Geol. 455, 264–281. doi:10.1016/j.chemgeo.2016.09.011
Rooney, T. O., Bastow, I. D., Keir, D., Mazzarini, F., Movsesian, E., Grosfils, E. B., et al. (2014). The protracted development of focused magmatic intrusion during continental rifting. Tectonics 33 (6), 875–897. doi:10.1002/2013TC003514
Rooney, T. O. (2010). Geochemical evidence of lithospheric thinning in the southern Main Ethiopian Rift. Lithos. 117 (1–4), 33–48. doi:10.1016/j.lithos.2010.02.002
Rowland, J. V., Baker, E., Ebinger, C. J., Keir, D., Kidane, T., Biggs, J., et al. (2007). Fault growth at a nascent slow-spreading ridge: 2005 Dabbahu rifting episode, Afar. Geophys. J. Int. 171 (3), 1226–1246. doi:10.1111/j.1365-246X.2007.03584.x
Rubin, A. M., and Pollard, D. D. (1988). Dike-induced faulting in rift zones of Iceland and Afar. Geology 16 (5), 413–417. doi:10.1130/0091-7613(1988)016<0413:DIFIRZ>2.3.CO;2
Saria, E., Calais, E., Stamps, D. S., Delvaux, D., and Hartnady, C. J. H. (2014). Present‐day kinematics of the east African Rift. J. Geophys. Res.: Solid Earth 119 (4), 3584–3600. doi:10.1002/2013JB010901
Sherrod, D. R., Magigita, M. M., and Kwelwa, S. (2013). Geologic map of oldonyo Lengai (Oldoinyo Lengai) and surroundings, arusha region, United Republic of Tanzania. U.S. Geol. Surv. Rep. 1306, 65. doi:10.3133/OFR20131306
Sibson, R. H. (2000). Fluid involvement in normal faulting. J. Geodyn. 29 (3–5), 469–499. doi:10.1016/S0264-3707(99)00042-3
Snoke, J. A., Munsey, J. W., Teague, A. C., and Bollinger, G. A. (1984). A program for focal mechanism determination by combined use of polarity and SV-P amplitude ratio data. Earthq. Notes. 55, 51.
Thurber, C. H. (1984). Seismic detection of the summit magma complex of kilauea volcano, Hawaii. Science 223 (4632), 165–167. doi:10.1126/science.223.4632.165
Thybo, H., and Nielsen, C. A. (2009). Magma-compensated crustal thinning in continental rift zones. Nature 457 (7231), 873–876. doi:10.1038/nature07688
Thybo, H., and Artemieva, I. M. (2013). Moho and magmatic underplating in continental lithosphere. Tectonophysics 609, 605–619. doi:10.1016/j.tecto.2013.05.032
Trippanera, D., Ruch, J., Passone, L., and Jónsson, S. (2019). Structural mapping of dike-induced faulting in Harrat Lunayyir (Saudi Arabia) by using high resolution drone imagery. Front. Earth Sci. 7, 168. doi:10.3389/feart.2019.00168
Urhammer, R. A. (1982). The optimal estimation of earthquake parameters. Phys. Earth Planet. In. 4, 1369–1379. doi:10.1016/0031-9201(82)90095-4
Watanabe, T., Koyaguchi, T., and Seno, T. (1999). Tectonic stress controls on ascent and emplacement of magmas. J. Volcanol. Geoth. Res. 91 (1), 65–78. doi:10.1016/S0377-0273(99)00054-2
Wauthier, C., Cayol, V., Poland, M., Kervyn, F., d’Oreye, N., Hooper, A., and Smets, B. (2013). Nyamulagira’s magma plumbing system inferred from 15 years of InSAR. Geol. Soc. Spec. Publ. 380 (1), 39–65. doi:10.1144/SP380.9
Wauthier, C., Smets, B., and Keir, D. (2015). Diking‐induced moderate‐magnitude earthquakes on a youthful rift border fault: the 2002 Nyiragongo‐Kalehe sequence, DR Congo. Geochemistry, Geophysics, Geosystems 16 (12), 4280–4291. doi:10.1002/2015GC006110
Weinlich, F. H., Bräuer, K., Kämpf, H., Strauch, G., Tesař, J., and Weise, S. M. (1999). An active subcontinental mantle volatile system in the western Eger rift, Central Europe: gas flux, isotopic (He, C, and N) and compositional fingerprints. Geochem. Cosmochim. Acta 63 (21), 3653–3671.
Weinstein, A., Oliva, S. J., Ebinger, C. J., Roecker, S., and Tiberi, C. (2017). Fault-magma interactions during early continental rifting: seismicity of the Magadi-Natron-Manyara basins, Africa. Geochem. Geophys. Geosyst. 18 (10), 3662–3686. doi:10.1002/2017GC007027
White, R., and McKenzie, D. (1989). Magmatism at rift zones: the generation of volcanic continental margins and flood basalts. J. Geophys. Res.: Solid Earth 94 (B6), 7685–7729. doi:10.1029/JB094iB06p07685
Woessner, J., and Wiemer, S. (2005). Assessing the quality of earthquake catalogues: estimating the magnitude of completeness and its uncertainty. Bull. Seismol. Soc. Am. 95 (2), 684–698. doi:10.1785/0120040007
Wright, T. J., Ebinger, C., Biggs, J., Ayele, A., Yirgu, G., Keir, D., et al. (2006). Magma-maintained rift segmentation at continental rupture in the 2005 Afar dyking episode. Nature 442 (7100), 291–294. doi:10.1038/nature04978
Keywords: local stress field changes, magmatic plumbing systems, volcano-rift interactions, rift seismicity, volcano seismicity
Citation: Reiss MC, Muirhead JD, Laizer AS, Link F, Kazimoto EO, Ebinger CJ and Rümpker G (2021) The Impact of Complex Volcanic Plumbing on the Nature of Seismicity in the Developing Magmatic Natron Rift, Tanzania. Front. Earth Sci. 8:609805. doi: 10.3389/feart.2020.609805
Received: 24 September 2020; Accepted: 09 December 2020;
Published: 23 February 2021.
Edited by:
Cecile Doubre, Université de Strasbourg, FranceReviewed by:
Joël Ruch, Université de Genève, SwitzerlandFrancesco Mazzarini, Istituto Nazionale di Geofisica e Vulcanologia (INGV), Italy
Copyright © 2021 Reiss, Muirhead, Laizer, Link, Kazimoto, Ebinger and Rümpker. This is an open-access article distributed under the terms of the Creative Commons Attribution License (CC BY). The use, distribution or reproduction in other forums is permitted, provided the original author(s) and the copyright owner(s) are credited and that the original publication in this journal is cited, in accordance with accepted academic practice. No use, distribution or reproduction is permitted which does not comply with these terms.
*Correspondence: Miriam Christina Reiss, cmVpc3NAZ2VvcGh5c2lrLnVuaS1mcmFua2Z1cnQuZGU=