 Wenxu Liao
 Yi Fan
 Shoupeng Zhu1,2,3
- 1Collaborative Innovation Center on Forecast and Evaluation of Meteorological Disasters, Nanjing University of Information Science and Technology, Nanjing, China
- 2School of Atmospheric Sciences, Nanjing University of Information Science and Technology, Nanjing, China
- 3Key Laboratory of Meteorological Disaster, Ministry of Education, Nanjing University of Information Science and Technology, Nanjing, China
- 4Southern Marine Science and Engineering Guangdong Laboratory (Zhuhai), Zhuhai, China
The influence of ENSO events on winter precipitation anomalies in the Philippines has been well known since decades, but whether this effect is different between months needs further exploration. In this study, the monthly variations of precipitation over the Philippines in winter during the mature phases of ENSO events are investigated with datasets of reanalysis and observations from 1979 to 2019. Results indicate that only the eastern Pacific (EP) El Niño shows different influences on the Philippines winter precipitation among different months. In December during mature EP El Niño events, precipitation deficiency is not significant over the whole Philippines, whereas in January and February, precipitation decreases significantly over the southern Philippines as well as the areas to the southeast of the Philippines. Besides, the correlation between consecutive dry days over the southeast Philippines and ENSO is significantly positive in January and February but not in December. The eastward propagation of EP El Niño–related anomalous anticyclone over the western North Pacific (WNPAC) from December to February is proved responsible for the changed relationship between EP El Niño and precipitation. In December, the center of the WNPAC is located to the southeast of the Indo-China Peninsula, inducing weak lower-level wind anomalies and, consequently, weak vertical movement and water vapor transport anomalies over the Philippines, which exerts limited influence on the local precipitation. In January and February, by contrast, the center of WNPAC is located to the southeast of the Philippines, and therefore the southern Philippines is occupied by anticyclonic moisture transports and downward vertical motions, favoring less precipitations and larger than normal consecutive dry days over there.
Introduction
El Niño–Southern Oscillation (ENSO) is characterized by anomalous sea surface temperature (SST) in the tropical Pacific Ocean, exerting significant influence on global climate. During the life cycle of a typical El Niño event, SST anomalies develop in the boreal autumn, reach the peak in the subsequent winter, and decay in summer, which is often mentioned as the phase-locking of ENSO (Neelin et al., 2000; Chen and Jin, 2020). Accordingly, the boreal winter is often considered as the El Niño mature phase, during which an anomalous anticyclone over the western North Pacific (WNPAC) is resulted from the Rossby wave feedback exerted from the warmer than normal eastern Pacific Ocean and the Kelvin wave response from the warm Indian Ocean (Zhang et al., 1999; Wang et al., 2000; Xie et al., 2009; Wen et al., 2019). The anomalous WNPAC modifies the climatological wind over Southeast Asia at the level of 850 hPa, inducing anomalous precipitation and extreme climate. Besides, it has been pointed out that ENSO influences the South China Sea (SCS) summer monsoon onset (Zhou and Chan, 2010; Zhu and Li, 2017), the western North Pacific tropical cyclones, and the interannual variation of precipitation (Du et al., 2011; Ge et al., 2016). Negative correlation exists between ENSO and the winter precipitation in Southeast Asia (Wang et al., 2020). However, previous studies about the ENSO influence on Southeast Asia precipitation have mainly concentrated on seasonal averages, while the sub-seasonal characteristics have not yet been comprehensively revealed. In fact, the influence of Pacific SST anomalies on northeast Asia summer precipitation has been reported non-consistent during the whole summer and sometimes shows significant sub-seasonal variations (Xu et al., 2017). The El Niño–related precipitation anomalies over Southeast Asia is different between periods of early and late summer (Fan et al., 2019). Therefore, to investigate the ENSO-related winter precipitation anomaly from a monthly perspective is of great importance.
Recently, a center type of ENSO has gained worldwide attention (Larkin and Harrison, 2005; Yu and Kao, 2007; Ashok and Yamagata, 2009; Zhang et al., 2011; Zhang et al., 2019). The extraordinary SST anomalies during a classic ENSO are confined to the eastern tropical Pacific Ocean, which is hereafter abbreviated as eastern Pacific (EP) ENSO, while the center Pacific (CP) ENSO represents events with dominant SST anomalies over the central Pacific Ocean. These two types of ENSO have been demonstrated to have different influences on the atmospheric circulation, temperature, and precipitation over East Asia (e.g., Zhu et al., 2013; Li et al., 2018). Nevertheless, previous studies on ENSO-related precipitation anomalies over Southeast Asia seldom make the two types of ENSO distinguished. In order to investigate the impact of a certain type of ENSO on the precipitation in Southeast Asia in more details, we calculated the precipitation anomalies during EP ENSO and CP ENSO first. It is found that only the EP-El Niño event has considerable different influences on Philippines precipitations in different winter months (figure not shown). Therefore, the following study only focuses on the monthly variations of precipitation anomalies over the Philippines during mature phase of the EP El Niño.
The Philippines is located in the Southeast of Asia with tropical climate. Warm temperature and abundant precipitation features developed agriculture economy in the Philippines. It is pointed out that the extreme dry events mostly occur in winter over the Southeast Asia (Yao et al., 2010), and the strongest influence of El Niño on Southeast Asia is also in winter. Precipitation deficiency and long consecutive dry days without rainfall highly impact the irrigation and human activity. Therefore, this study concentrates on the precipitation anomalies during the winter of El Niño mature phases, and to further investigate the anomalous precipitation over the Philippines during EP-El Niño in a monthly view is of great importance to the prediction source and provide theoretical support for local disaster prevention and mitigation and climate prediction.
The rest of this article is organized as follows: Datasets and methods are introduced in Datasets and methods; the monthly variation of precipitation anomalies and consecutive dry days (CDD) around the Philippines in winter during the mature phase of ENSO is revealed in Precipitation anomalies during mature phase of El Niño, and the responsible reasons are analyzed in Reason analysis; a conclusion and discussion is made finally in Conclusion and Discussion.
Datasets and Methods
Monthly precipitation datasets used in this study are derived from the Climate Prediction Center Merged Analysis of Precipitation (CMAP) with a horizontal resolution of 2.5 ° × 2.5 °over both land and ocean (https://psl.noaa.gov/data/gridded/data.cmap.html), which have been proven predominant in the tropical areas (Xie and Arkin, 1997). Besides, the monthly Climatic Research Unit (CRU) Time-Series version 4.04 land precipitation data (https://crudata.uea.ac.uk/cru/data/hrg/) with a finer horizontal resolution of 0.5 ° × 0.5 ° (Harris et al., 2020) are also employed to validate the CMAP results and eliminate the uncertainty brought from data. Both datasets cover the study period of 1979–2019. The corresponding circulation and moisture data are obtained from the NCEP/DOE Reanalysis II with a resolution of 2.5 ° × 2.5 ° (https://psl.noaa.gov/data/gridded/data.ncep.reanalysis2.html). The outgoing long radiation dataset is provided by the NOAA Interpolated Outgoing Longwave Radiation (OLR) dataset (https://psl.noaa.gov/data/gridded/data.interp_OLR.html).
The historical EP El Niño events (1979–1980; 1982–1983; 1986–1988; 1991–1992; 1997–1998; 2006–2007; 2014–2016) are defined by the National Climate Center, China Meteorological Administration (https://cmdp.ncc-cma.net/pred/cn_enso_index.php). The EP ENSO index is calculated as
where INiño3 and INiño4 represent the SST anomalies averaged over the Niño three region (150 °W–90 °W, 5 °S–5 °N) and the Niño four region (160 °W–150 °W, 5 °S–5 °N). To be noted, α equals 0.4 when INiño3 and INiño4 are consistently positive or negative, otherwise α equals 0. An EP El Niño is determined when IEP is larger than 0.5 °C for at least three months. The CDD is defined as the number of consecutive dry days (when precipitation <1.0 mm) during a certain period, and the monthly dataset of CDD is derived from the Met Office Hadley Centre observation dataset HadEX3 (https://www.metoffice.gov.uk/hadobs/hadex3/download.html). The CDD index over the southeast of the Philippines is calculated as the spatial average of CDD values over the area of 5 °N–15 °N, 122 °E–127 °E.
In this study, winter is defined as the period from December of the previous year to February of the current year. For example, winter for 1980 refers to December of 1979 and January and February of 1980. The two-tailed Student’s t-test is used to test the significance of the difference and correlation between two samples, with the significance level set as 0.05 in the current study.
Result
Precipitation Anomalies During Mature Phase of El Niño
Aiming at more accurate investigations on the impact of a certain type of ENSO on the precipitation over the Philippines, we calculate the precipitation anomalies during EP and CP ENSO. Among four types of ENSO events (EP El Niño, CP El Niño, EP La Niña, and CP La Niña), only the influence from EP El Niño features considerable monthly variations (figures not shown). Therefore, the following analyses focus on the precipitation anomalies in winter months during the mature phase of EP El Niño.
As shown in Figures 1 and 2, El Niño shows weak impact on the simultaneous precipitation in December, whereas significant influence can be detected in January and February. In December during mature El Niño events, precipitation deficiency over the Philippines is not significant, while in January and February, precipitation decreases significantly over the southern Philippines and the ocean to the southeast of the Philippines (Figure 1). The ocean to the east of the Philippines is covered by stronger negative precipitation anomalies in January and February (Figures 1B,C) than in December (Figure 1A). The maxima anomalous center of precipitation is located at around 128 °E and 12 °N in December with an intensity of around –3 mm per day (Figure 1A), while the maxima anomalous center of precipitation is located at around 128 °E and 9 °N in January and February with a negative value stronger than –4 mm per day. Moreover, similar results are also derived from land precipitation dataset with a finer resolution (Figure 2). In December, precipitation anomalies are relatively weak and not significant over the Philippine Islands (Figure 2A). In January and February, by contrast, significantly negative anomalies of precipitation occupy the southeast of the Philippines (Figures 2B,C).
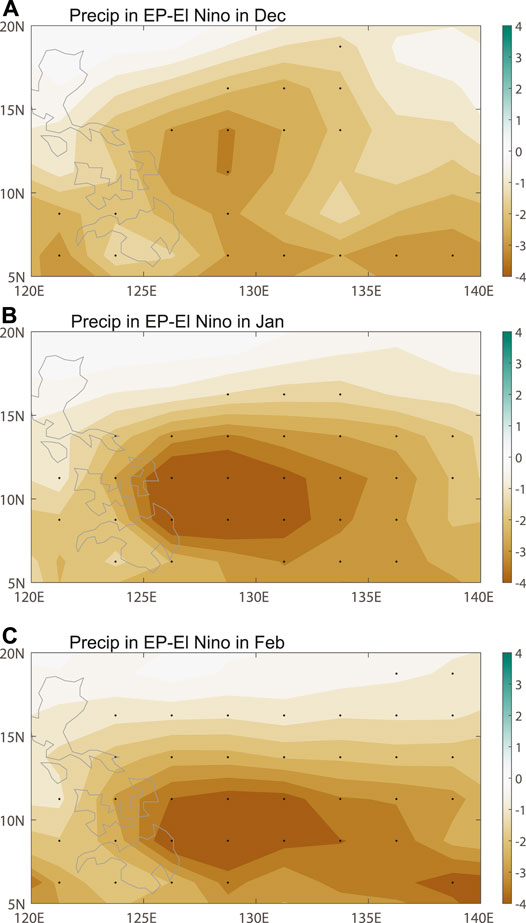
FIGURE 1. Composite precipitation anomalies (units: mm day−1) derived from the CMAP dataset during El Niño mature phases in (A) December, (B) January, and (C) February. Dotted areas indicate the 0.05 significance level.
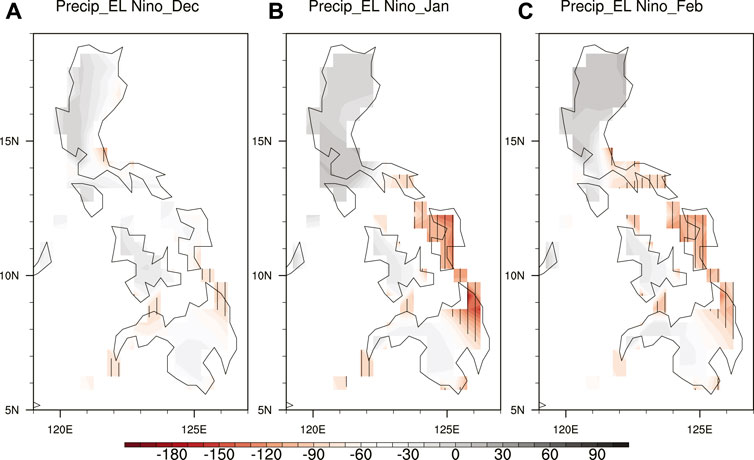
FIGURE 2. Composite precipitation anomalies (units: mm month−1) derived from the CRU dataset during El Niño mature phases in (A) December, (B) January, and (C) February. Shaded areas indicate the 0.05 significance level.
Furthermore, the significant precipitation deficiency over the southeast of the Philippines in January and February during the mature phase of El Niño is accompanied by anomalous CDD over there. The CDD index over the southeast Philippines is calculated and compared with the Niño 3.4 index as shown in Figure 3 for different months in winter. To be noted, limited by the length of valid data, the CDD index only covers a period of 1978–2009. In December, the ENSO index shows nonsignificant correlation with the CDD index with a correlation coefficient of 0.19 (Figure 3A), whereas in January and February, the correlations are significant with correlation coefficients of 0.55 and 0.48, respectively (Figures 3B,C). That is, in consistent with the monthly mean precipitation anomaly, the extreme events in terms of CDD also show monthly variations in winter under influences of El Niño. Relationship between El Niño and the CDD index over the southeast Philippines is weak in December but intense in January and February.
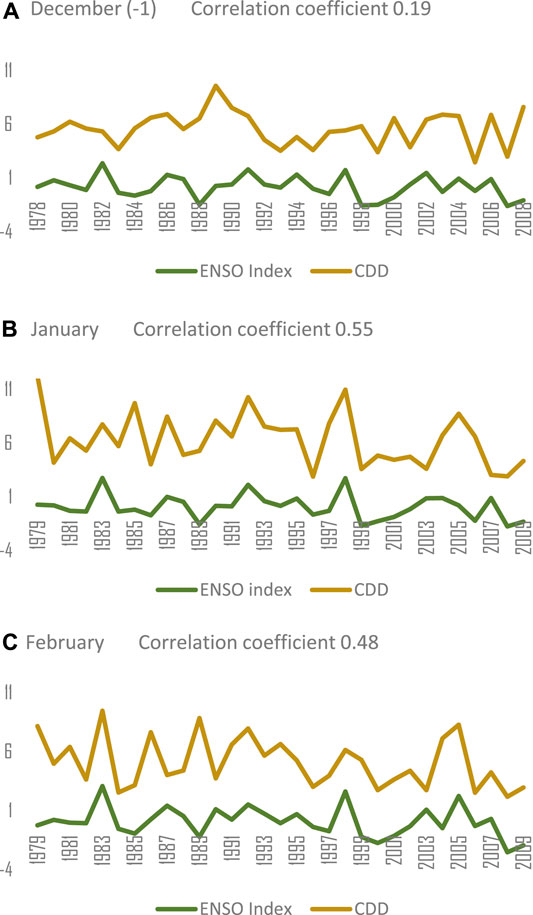
FIGURE 3. Time series for CDD index (orange) over the southeast Philippines and ENSO index (blue) in (A) December, (B) January, and (C) February.
Reason Analysis
Analysis in (Precipitation anomalies during mature phase of El Niño) reveals that El Niño exerts relatively weak influence on the precipitation anomalies around the Philippines in December while strong influence in January and February. The possible underlying mechanisms for such a monthly variation are further explored in this subsection. Previous studies have pointed out that the WNPAC is an important linkage between El Niño and precipitation anomalies in Southeast Asia (Zhang et al., 1999; Wang et al., 2000). As a Rossby wave feedback of the warmer than normal eastern Pacific Ocean, anticyclonic wind anomalies occupy the Philippines during El Niño mature phase, leading to less precipitation over there. The SST anomaly over the SCS and the position of the WNPAC evolve from the El Niño developing autumn to its mature phase: warm (cold) SST anomaly over the SCS increases (decreases) rapidly and the anticyclonic anomaly moves eastward from the Indian Ocean to the SCS (Wu et al., 2003; Huang et al., 2013). Similar pattern is also detected in the evolution of the WNPAC from December to February in the winter during mature El Niño (Figure 4). Warm SST anomalies expand to the SCS from December to January and finally cover the whole SCS in February. Meanwhile, cold SST anomalies withdraw from the SCS and move eastward to the western North Pacific Ocean. Consistently, the WNPAC marches eastward from the SCS to the southeast of the Philippines (Figure 5). Such eastward motion of the WNPAC could be attributed to the air–sea interactions induced by the changing SST anomalies over the SCS (Chen et al., 2007) and modulate the local circulation and precipitation over the Philippines.
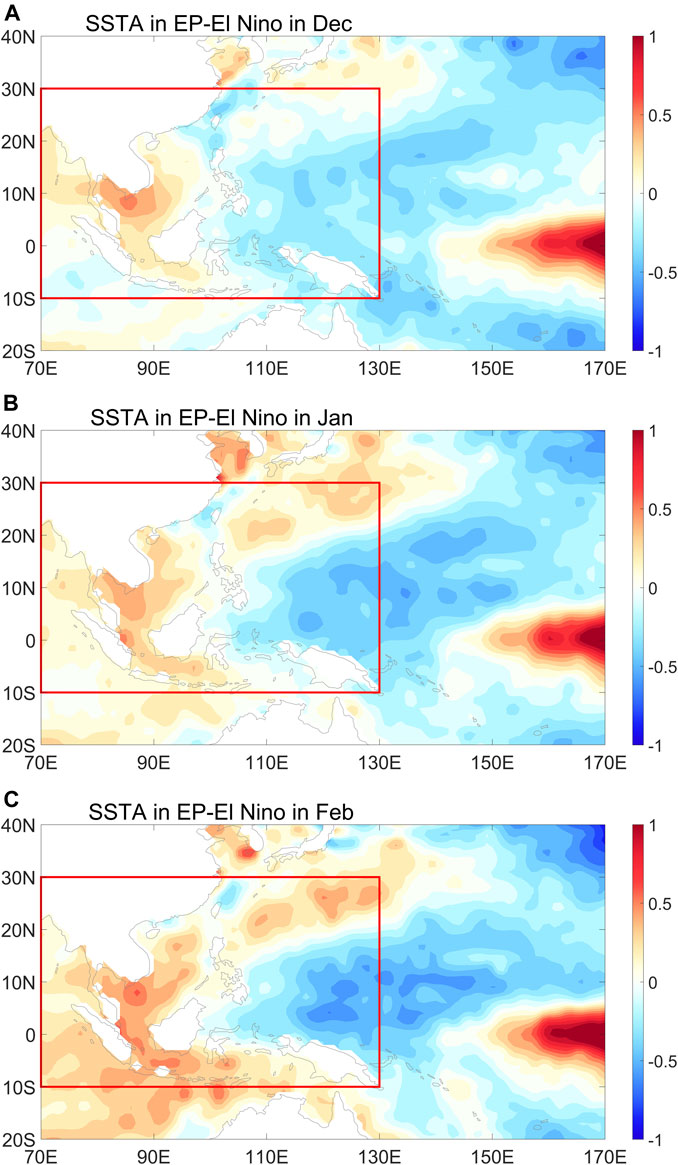
FIGURE 4. SST anomalies (units: k) during El Niño mature phases in (A) December, (B) January, and (C) February. The red box indicates the study area.
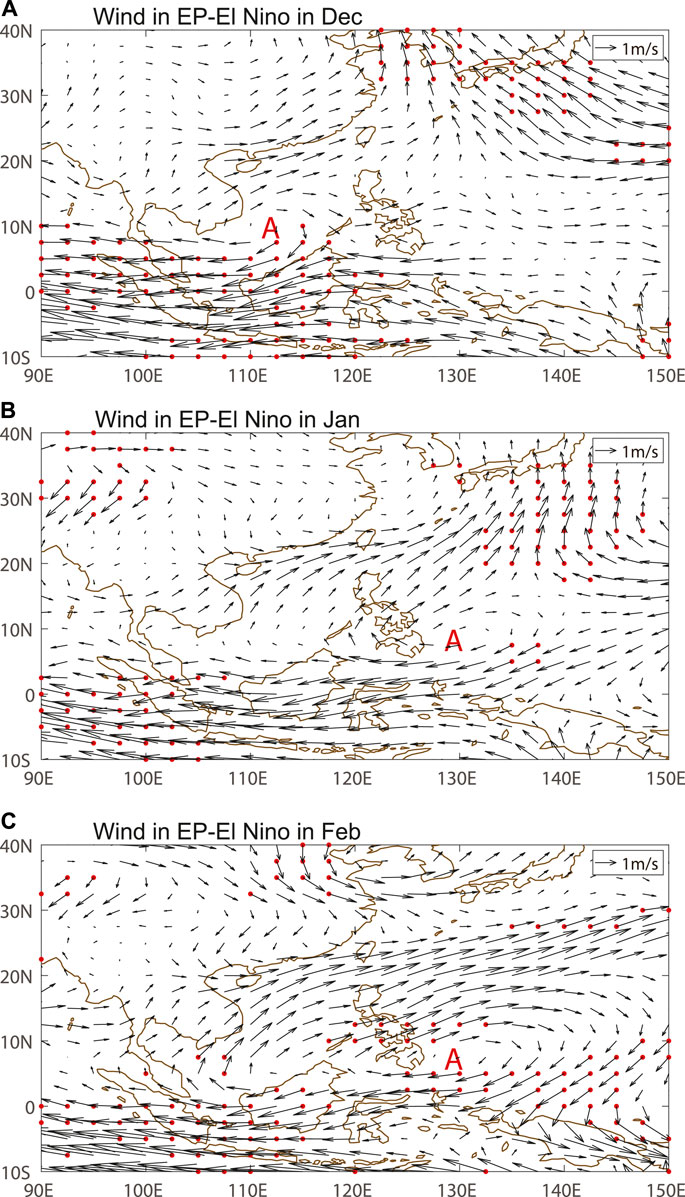
FIGURE 5. 850 hPa wind anomalies (units: m s−1) during El Niño mature phases in (A) December, (B) January, and (C) February. Dotted areas indicate the 0.05 significance level. “A” indicates the center of an anticyclone.
In December, the center of the WNPAC is located at around 111 °E and 10 °N to the southeast of the Indo-China Peninsula, showing relatively weak influence on the lower-level wind anomalies over the Philippines with nonsignificant wind anomalies at 850 hPa (Figure 5A). In January and February, the center of the WNPAC shifts to the east of 128 °E dominating the Philippines (Figures 5B,C), which tends to suppress the local precipitation. Considering that the upward motion and sufficient water vapor are crucial conditions favoring precipitation, further analyses focus on the OLR, vertical velocity, and water vapor transport anomalies during El Niño mature phase for December, January, and February, respectively. The negative (positive) OLR represents the enhanced (suppressed) convection and hence more (less) cloud coverage. As shown in Figure 6, in winter during mature phase of El Niño, the southern Philippines is occupied by positive OLR anomalies. The anomalous OLR in January (Figure 6B) and February (Figure 6C) are stronger than that in December (Figure 6A), showing more favorable conditions for the occurrence of precipitation deficiency in January and February. Besides, vertical velocity anomalies over the Philippines are almost zero in December during the mature phase of El Niño (Figure 7A). By contrast, significant positive vertical velocity anomalies with magnitudes of ∼0.02 Pa s−1 occur over the southeast to the Philippines in January (Figure 7B) and February (Figure 7C). That is, significant descending anomalies dominate the Philippines in January (Figure 7B) and February (Figure 7C) and reduce the local precipitation, while the downward motion is rather weak and not significant in December (Figure 7A). Moreover, Figure 8 describes the lower-level water vapor transport anomalies over Southeast Asia to present the conditions of moisture supply. In December during the winter of El Niño mature phase, anticyclonic water vapor transport anomalies are located over the center of the SCS, exerting limited influence on the Philippines (Figure 8A). With respect to January (Figure 8B) and February (Figure 8C), the anomalous anticyclonic water vapor transport occurs over the southeast to the Philippines, which is favorable for negative precipitation anomalies.
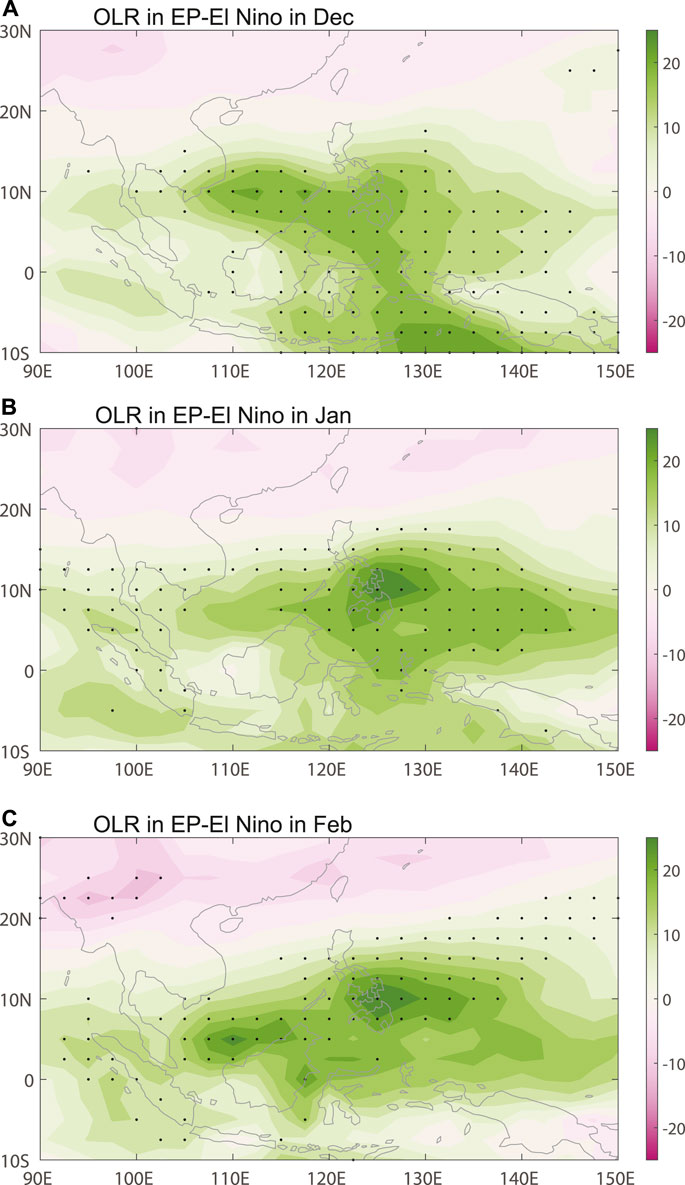
FIGURE 6. OLR anomalies (units: W m −2) during El Niño mature phases in (A) December, (B) January, and (C) February. Dotted areas indicate the 0.05 significance level.
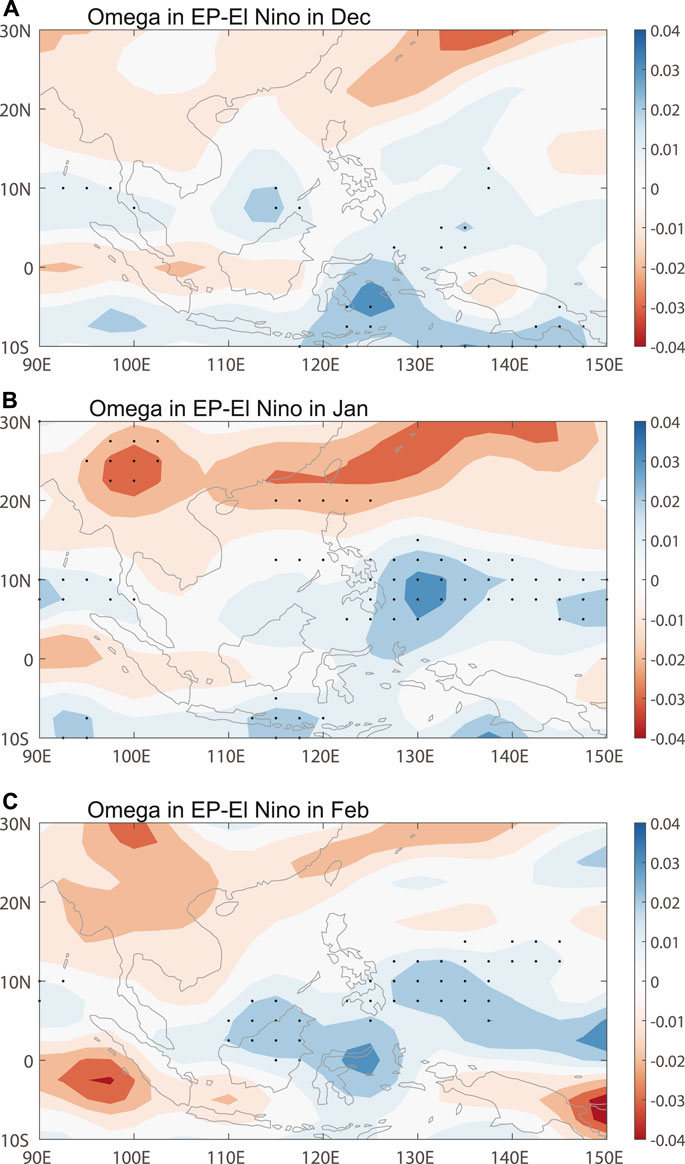
FIGURE 7. Vertical velocity anomalies (units: Pa s−1) during El Niño mature phases in (A) December, (B) January, and (C) February. Dotted areas indicate the 0.05 significance level.
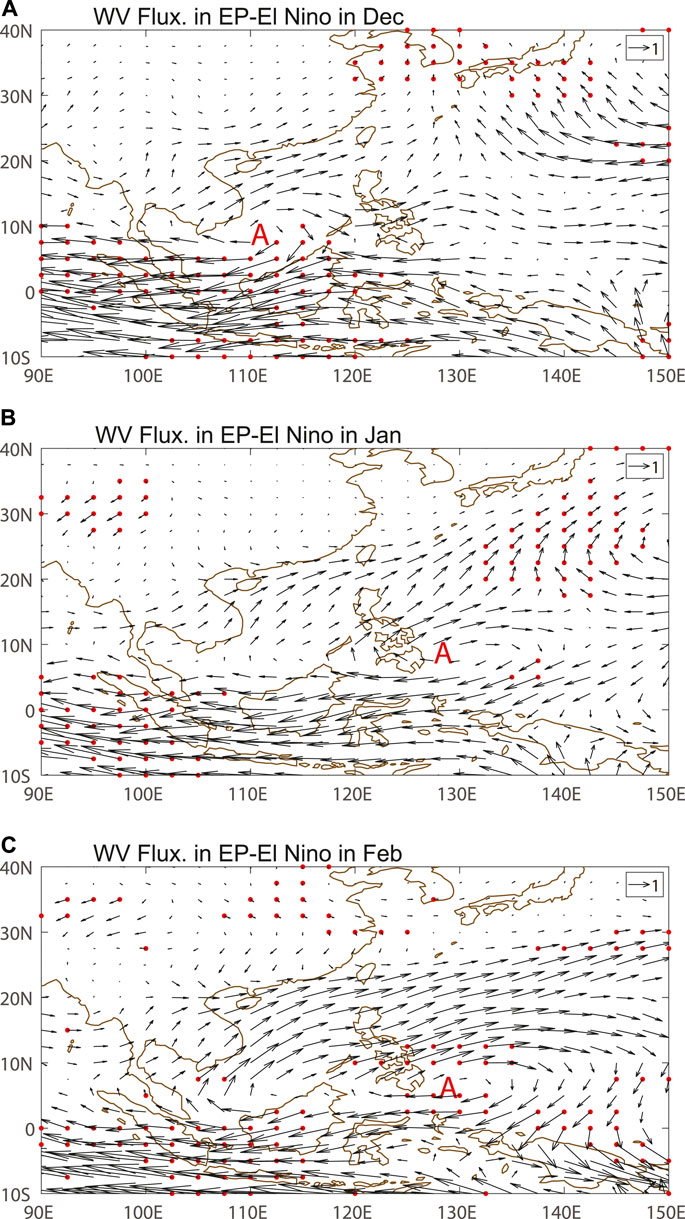
FIGURE 8. Water vapor transport anomalies (units: kg m−1 s−1) during El Niño mature phases in (A) December, (B) January, and (C) February. Dotted areas indicate the 0.05 significance level. “A” indicates the center of an anticyclone.
Conclusion and Discussion
Based on multiple datasets of reanalysis and observation, this study reveals a sub-seasonal variation of the El Niño–related precipitation anomalies over the Philippines from December to February. The present study emphasizes the evolutions of relationship between El Niño and monthly precipitation in winter, reflecting the importance to reveal the source of sub-seasonal climate variation and sub-seasonal predictions. Compared with previous studies, there have been greater focuses on the month-to-month variation of ENSO influences on specific regions. In the December during EP El Niño mature phase, precipitation anomalies are relatively weak over the Philippines and its surrounding areas. In January and February, by contrast, significant precipitation anomalies are detected over the southeast Philippines and the sea surface to the east of the Philippines. Besides, the relationship between ENSO and the consecutive dry days (CDD) over southeast of the Philippines in December is nonsignificant with a correlation coefficient of 0.19, whereas the correlation coefficients between ENSO and CDD in January and February are 0.55 and 0.48, respectively, being significant according to the Student’s t-test at the 0.05 significance level. Such a sub-seasonal variation of precipitation anomalies could be attributed to the eastward moving of the WNPAC. The WNPAC induced by El Niño–related warm SST anomalies is located to the south of Indo-China Peninsula in December, while over the south Philippines in January and February (Figure 4), corresponding well to previous studies which indicate that from autumn to winter during El Niño events, the warm SST over the SCS increases rapidly along with the anticyclonic anomaly moving eastward from the Indian Ocean to the SCS (Wu et al., 2003; Huang et al., 2013). Therefore, in December, the weak circulation anomalies show limited influence on the OLR (Figure 6), vertical velocity (Figure 7), and the water vapour transport over the Philippines (Figure 8), and finally result in nonsignificant precipitation anomalies. In January and February, by contrast, the suppressed convection (Figure 6), downward motion (Figure 7), as well as the unfavorable moisture conditions induced by the anomalous anticyclonic water vapour transport over the Philippines (Figure 8) jointly lead to deficient precipitation and larger CDD.
It has been pointed out that the Kuroshio anticyclonic anomalies can significantly modulate the influences of ENSO on the western Pacific winter climate (Gong et al., 2019). The existence of the Kuroshio anticyclone may decrease the pressure gradient between East Asia and the North Pacific, which facilitates the northward extension of the southerly wind anomalies from the anticyclone over the Philippines. Therefore, the intensity of the ENSO-related Kuroshio anticyclone might be a factor influencing the winter precipitation over the Philippines, which is to be further investigated in the future. Besides, model simulations of the Coupled Model Intercomparison Project are effective in investigating the impact of ENSO on climate variability (Gong et al., 2014, 2015). Therefore, the state-of-the-art models would also be employed for associated simulations and predictions in the future. To be noted, the study only focuses on the El Niño mature phases, but how the other phases of El Niño exert influences on the local sub-seasonal climate is in need of further investigation.
Data Availability Statement
Publicly available datasets were analyzed in this study. These data can be found here: https://psl.noaa.gov/data/gridded/data.cmap.html.
Author Contributions
All authors equally collaborated in the research presented in this publication by making the following contributions. WL and YF: research conceptualization, methodology, formal analysis, data curation, writing original draft preparation, writing—review, and editing. SZ, YH, and YL: methodology, data curation, writing—review, and editing.
Funding
This work was jointly supported by the Major Program of the National Natural Science Foundation of China (Grant No. 41991283), National Key Research and Development Program of China (Grant No. 2016YFA0600703) and National Natural Science Foundation of China (Grant No. 42088101, No. 42025502 and No. 41805056).
Conflict of Interest
The authors declare that the research was conducted in the absence of any commercial or financial relationships that could be construed as a potential conflict of interest.
Acknowledgments
We thank the supports from the Startup Foundation for Introducing Talent of NUIST.
References
Ashok, K., and Yamagata, T. (2009). The El Niño with a difference?. Nature 461, 481–484. doi:10.1038/461481a
Chen, H., and Jin, F. (2020). Fundamental behavior of ENSO phase locking. J. Clim. 33, 1953–1968. doi:10.1175/JCLI-D-19-0264.1
Chen, J., Li, T., and Shih, C. (2007). Fall persistence barrier of sea surface temperature in the south China sea associated with ENSO. J. Clim. 20, 158–172. doi:10.1175/JCLI4000.1
Du, Y., Yang, L., and Xie, S. (2011). Tropical Indian ocean influence on northwest pacific tropical cyclones in summer following strong El Niño. J. Clim. 24, 315–322. doi:10.1175/2010JCLI3890.1
Fan, Y., Fan, K., Zhu, X., and Fraedrich, K. (2019). El Niño–related summer precipitation anomalies in Southeast Asia modulated by the atlantic multidecadal oscillation. J. Clim. 32, 7971–7987. doi:10.1175/JCLI-D-19-0049.1
Ge, F., Zhi, X., Babar, Z., Tang, W., and Chen, P. (2016). Interannual variability of summer monsoon precipitation over the Indochina Peninsula in association with ENSO. Theor. Appl. Climatol. doi:10.1007/s00704-015-1729-y
Gong, H., Wang, L., Chen, W., et al. (2015). Diverse influences of ENSO on the East Asian-western Pacific winter climate tied to different ENSO properties in CMIP5 models. J. Clim. 28, 2187–2202. doi:10.1175/JCLI-D-14-00405.1
Gong, H., Wang, L., Chen, W., et al. (2014). The climatology and interannual variability of the East Asian winter monsoon in CMIP5 models. J. Clim. 27, 1659–1678. doi:10.1175/JCLI-D-13-00039.1
Gong, H., Wang, L., and Chen, W. (2019). Recently strengthened influence of ENSO on the wintertime east asian surface air temperature. Atmosphere 10, 720. doi:10.3390/atmos10110720
Harris, I., Osborn, T., Jones, P., and Lister, D. (2020). Version 4 of the CRU TS monthly high-resolution gridded multivariate climate dataset. Sci. Data. 7, 109. doi:10.1038/s41597-020-0453-3
Huang, Z., Du, Y., Wu, Y., et al. (2013). Asymmetric response of the south China sea SST to El Niño and La Niña. J. Ocean Univ. China 12, 272–278. doi:10.1007/s11802-013-2169-x
Larkin, N., and Harrison, D. (2005). On the definition of El Niño and associated seasonal average U.S. weather anomalies. Geophys. Res. Lett. 32, L13705. doi:10.1029/2005GL022738
Li, J., Huang, D., Li, F., et al. (2018). Circulation characteristics of EP and CP ENSO and their impacts on precipitation in South China. J. Atmos. Sol. Terr. Phys. 179, 405–415. doi:10.1016/j.jastp.2018.09.006
Neelin, J., Jin, F., and Syu, H. (2000). Variations in ENSO phase locking. J. Clim. 13, 2570–2590. doi:10.1175/1520-0442(2000)013<2570:VIEPL>2.0.CO;2
Wang, B., Luo, X., and Liu, J. (2020). How robust is Asian precipitation-ENSO relationship during the industrial warming period (1901–2017)?. J. Clim. 33, 2779–2792. doi:10.1175/JCLI-D-19-0630.1
Wang, B., Wu, R., and Fu, X. (2000). Pacific–east asian teleconnection: how does ENSO affect east asian climate?. J. Clim. 13, 1517–1536. doi:10.1175/1520-0442(2000)013<1517:PEATHD>2.0.CO;2
Wen, N., Liu, Z., and Li, L. (2019). Direct ENSO impact on East Asian summer precipitation in the developing summer. Clim. Dynam. 52, 6799–6815. doi:10.1007/s00382-018-4545-0
Wu, R., Hu, Z., and Kirtman, B. (2003). Evolution of ENSO-related rainfall anomalies in east Asia. J. Clim. 16, 3742–3758. doi:10.1175/1520-0442(2003)016<3742:EOERAI>2.0.CO;2
Xie, P., and Arkin, P. (1997). Global precipitation: a 17-year monthly analysis based on gauge observations, satellite estimates, and numerical model outputs. Bull. Am. Meteorol. Soc. 78, 2539–2558. doi:10.1175/1520-0477(1997)078<2539:GPAYMA>2.0.CO;2
Xie, S., Hu, K., Hafner, J., Tokinaga, H., Du, Y., Huang, G., et al. (2009). Indian ocean capacitor effect on Indo–western pacific climate during the summer following El Niño. J. Clim. 22, 730–747. doi:10.1175/2008JCLI2544.1
Xu, Z., Fan, K., and Wang, H. (2017). Role of sea surface temperature anomalies in the tropical Indo-Pacific region in the northeast Asia severe drought in summer 2014: month-to-month perspective. Clim. Dynam. 49, 1631–1650. doi:10.1007/s00382-016-3406-y
Yao, C., Qian, W., Yang, S., and Lin, Z. (2010). Regional features of precipitation over Asia and summer extreme precipitation over Southeast Asia and their associations with atmospheric–oceanic conditions. Meteorol. Atmos. Phys. 106, 57–63. doi:10.1007/s00703-009-0052-5
Yu, J.-Y., and Kao, H.-K. (2007). Decadal changes of ENSO persistence barrier in SST and ocean heat content indices: 1958–2001. J. Geophys. Res. 112, D13106. doi:10.1029/2006JD007654
Zhang, R., Sumi, A., and Kimoto, M. (1999). A diagnostic study of the impact of El Niño on the precipitation in China. Adv. Atmos. Sci. 16, 229–241. doi:10.1007/BF02973084
Zhang, W., Jin, F., Li, J., and Ren, H. (2011). Contrasting impacts of two-type El Niño over the western North Pacific during boreal autumn. J. Meteor. Soc. Japan. 89, 563–569. doi:10.2151/jmsj.2011-510
Zhang, W., Wang, Z., Stuecker, M., et al. (2019). Impact of ENSO longitudinal position on teleconnections to the NAO. Clim. Dynam. 52, 257–274. doi:10.1007/s00382-018-4135-1
Zhou, W., and Chan, J. (2010). ENSO and the South China Sea summer monsoon onset. Int. J. Climatol. 27, 157–167. doi:10.1002/joc.1380
Zhu, J., Huang, D., Zhang, Y., et al. (2013). Decadal changes of Meiyu rainfall around 1991 and its relationship with two types of ENSO. JGRA. tmospheres 118, 9766–9777. doi:10.1002/jgrd.50779
Keywords: El Niño, the Philippines, precipitation, WNPAC, consecutive dry days
Citation: Liao W, Fan Y, Zhu S, Huang Y and Lv Y (2021) Monthly Variations of the Winter Precipitation over the Philippines During the Mature Phase of Eastern Pacific El Niño. Front. Earth Sci. 8:625455. doi: 10.3389/feart.2020.625455
Received: 03 November 2020; Accepted: 21 December 2020;
Published: 05 March 2021.
Edited by:
Bin Yu, Government of Canada, CanadaReviewed by:
Hainan Gong, Institute of Atmospheric Physics (CAS), ChinaDebashis Nath, Sun Yat-sen University, Zhuhai Campus, China
Copyright © 2021 Liao, Fan, Zhu, Huang and Lv. This is an open-access article distributed under the terms of the Creative Commons Attribution License (CC BY). The use, distribution or reproduction in other forums is permitted, provided the original author(s) and the copyright owner(s) are credited and that the original publication in this journal is cited, in accordance with accepted academic practice. No use, distribution or reproduction is permitted which does not comply with these terms.
*Correspondence: Yi Fan, ZmFueWlAbnVpc3QuZWR1LmNu