 Miriam Römer1*
 Martin Blumenberg2
 Katja Heeschen3Stefan Schloemer2
 Hendrik Müller2Simon Müller2Christian Hilgenfeldt1Udo Barckhausen2
 Katrin Schwalenberg2
- 1MARUM – Center for Marine Environmental Sciences and Department of Geosciences, University of Bremen, Bremen, Germany
- 2BGR – Federal Institute for Geosciences and Natural Resources, Hannover, Germany
- 3Helmholtz Centre Potsdam, German Research Centre for Geosciences (GFZ), Potsdam, Germany
This study focuses on seafloor methane seep sites and their distribution in the northwestern part of the German North Sea. Methane seepage is a common phenomenon along marine shelves and known to occur in the North Sea, but proof of their existence was lacking in the study area. Using a ship-based multibeam echosounder we detected a minimum of 166 flares that are indicative for free gas releases from the seafloor in the German “Entenschnabel” area, which are not related to morphologic expressions at the seafloor. However, a group of small depressions was detected lacking water column anomalies but with indications of dissolved fluid release. Spatial analysis revealed that flares were not randomly distributed but show a relation to locations of subsurface salt diapirs. More than 60% of all flares were found in the vicinity of the salt diapir “Berta”. Dissolved methane concentrations of ∼100 nM in bottom waters were ten times the background value in the “Entenschnabel” area (CH4 < 10 nM), supporting the finding of enhanced seepage activity in this part of our study area. Furthermore, locations of flares were often related to acoustic blanking and high amplitude reflections in sediment profiler echograms, most prominently observed at location Berta. These hydroacoustic signatures are interpreted to result from increased free gas concentrations in the sediments. Electromagnetic seabed mapping depicts local sediment conductivity anomalies below a flare cluster at Berta, which can be explained by small amounts of free gas in the sediment. In our area of interest, ten abandoned well sites were included in our mapping campaign, but flare observations were spatially not related to these wells. Naturally seeping methane is presumably transported to the seafloor along sub-vertical faults, which have formed concurrently to the updoming salt. Due to the shallow water depths of 30 to 50 m in the study area, flares were observed to reach close to the sea surface and a slight oversaturation of surface waters with methane in the flare-rich northeastern part of the working area indicates that part of the released methane through seepage may contribute to the atmospheric inventory.
Introduction
Seafloor methane (CH4) seepage is widely known to occur along almost all continental margins. This includes the diffusion or advection of dissolved methane from the sediment into the bottom water or the expulsion of free methane gas bubbles. Known natural seep areas in the North Sea, a shelf sea with an average water depth of 95 m, include: (1) Tommeliten seep area in the Norwegian Exclusive Economic Zone (EEZ; Hovland, 1993; Niemann et al., 2005), (2) Dutch Dogger Bank seep area in Netherlands EEZ (Schroot et al., 2005; Römer et al., 2017), (3) pockmarks in the Witch Ground Basin in the EEZ of United Kingdom (Judd et al., 1994; Böttner et al., 2019), and (4) the German Helgoland Reef pockmark field (Krämer et al., 2017; locations see Figure 1A). The North Sea comprises large areas where shallow gas is being trapped in Cenozoic deltaic and marine sediments and has been detected as “bright spots” in seismic data (Müller et al., 2018). The observed bright spots are characterized by high amplitude seismic reflections, which can indicate a change in pore space filling (White, 1975). Hydrocarbon migration and accumulation are often related to salt diapirism, associated faulting and gas-charged sand-filled ice-scours and channels (Woodbury et al., 1980; Schroot and Schüttenhelm, 2003). Since the Pleistocene, the area has been effected by climate and sea level variations, leading to deposits of glacial-interglacial sediments that are characterized by abundant subglacial tunnel valleys related to melt water flows (Lutz et al., 2009). In our study area, several clusters of bright spots were identified above known salt diapirs, suggesting that salt diapirism lead to fracturing of the overburden strata and formation of migration pathways as well as anticlinal structures for hydrocarbon accumulation (Müller et al., 2018).
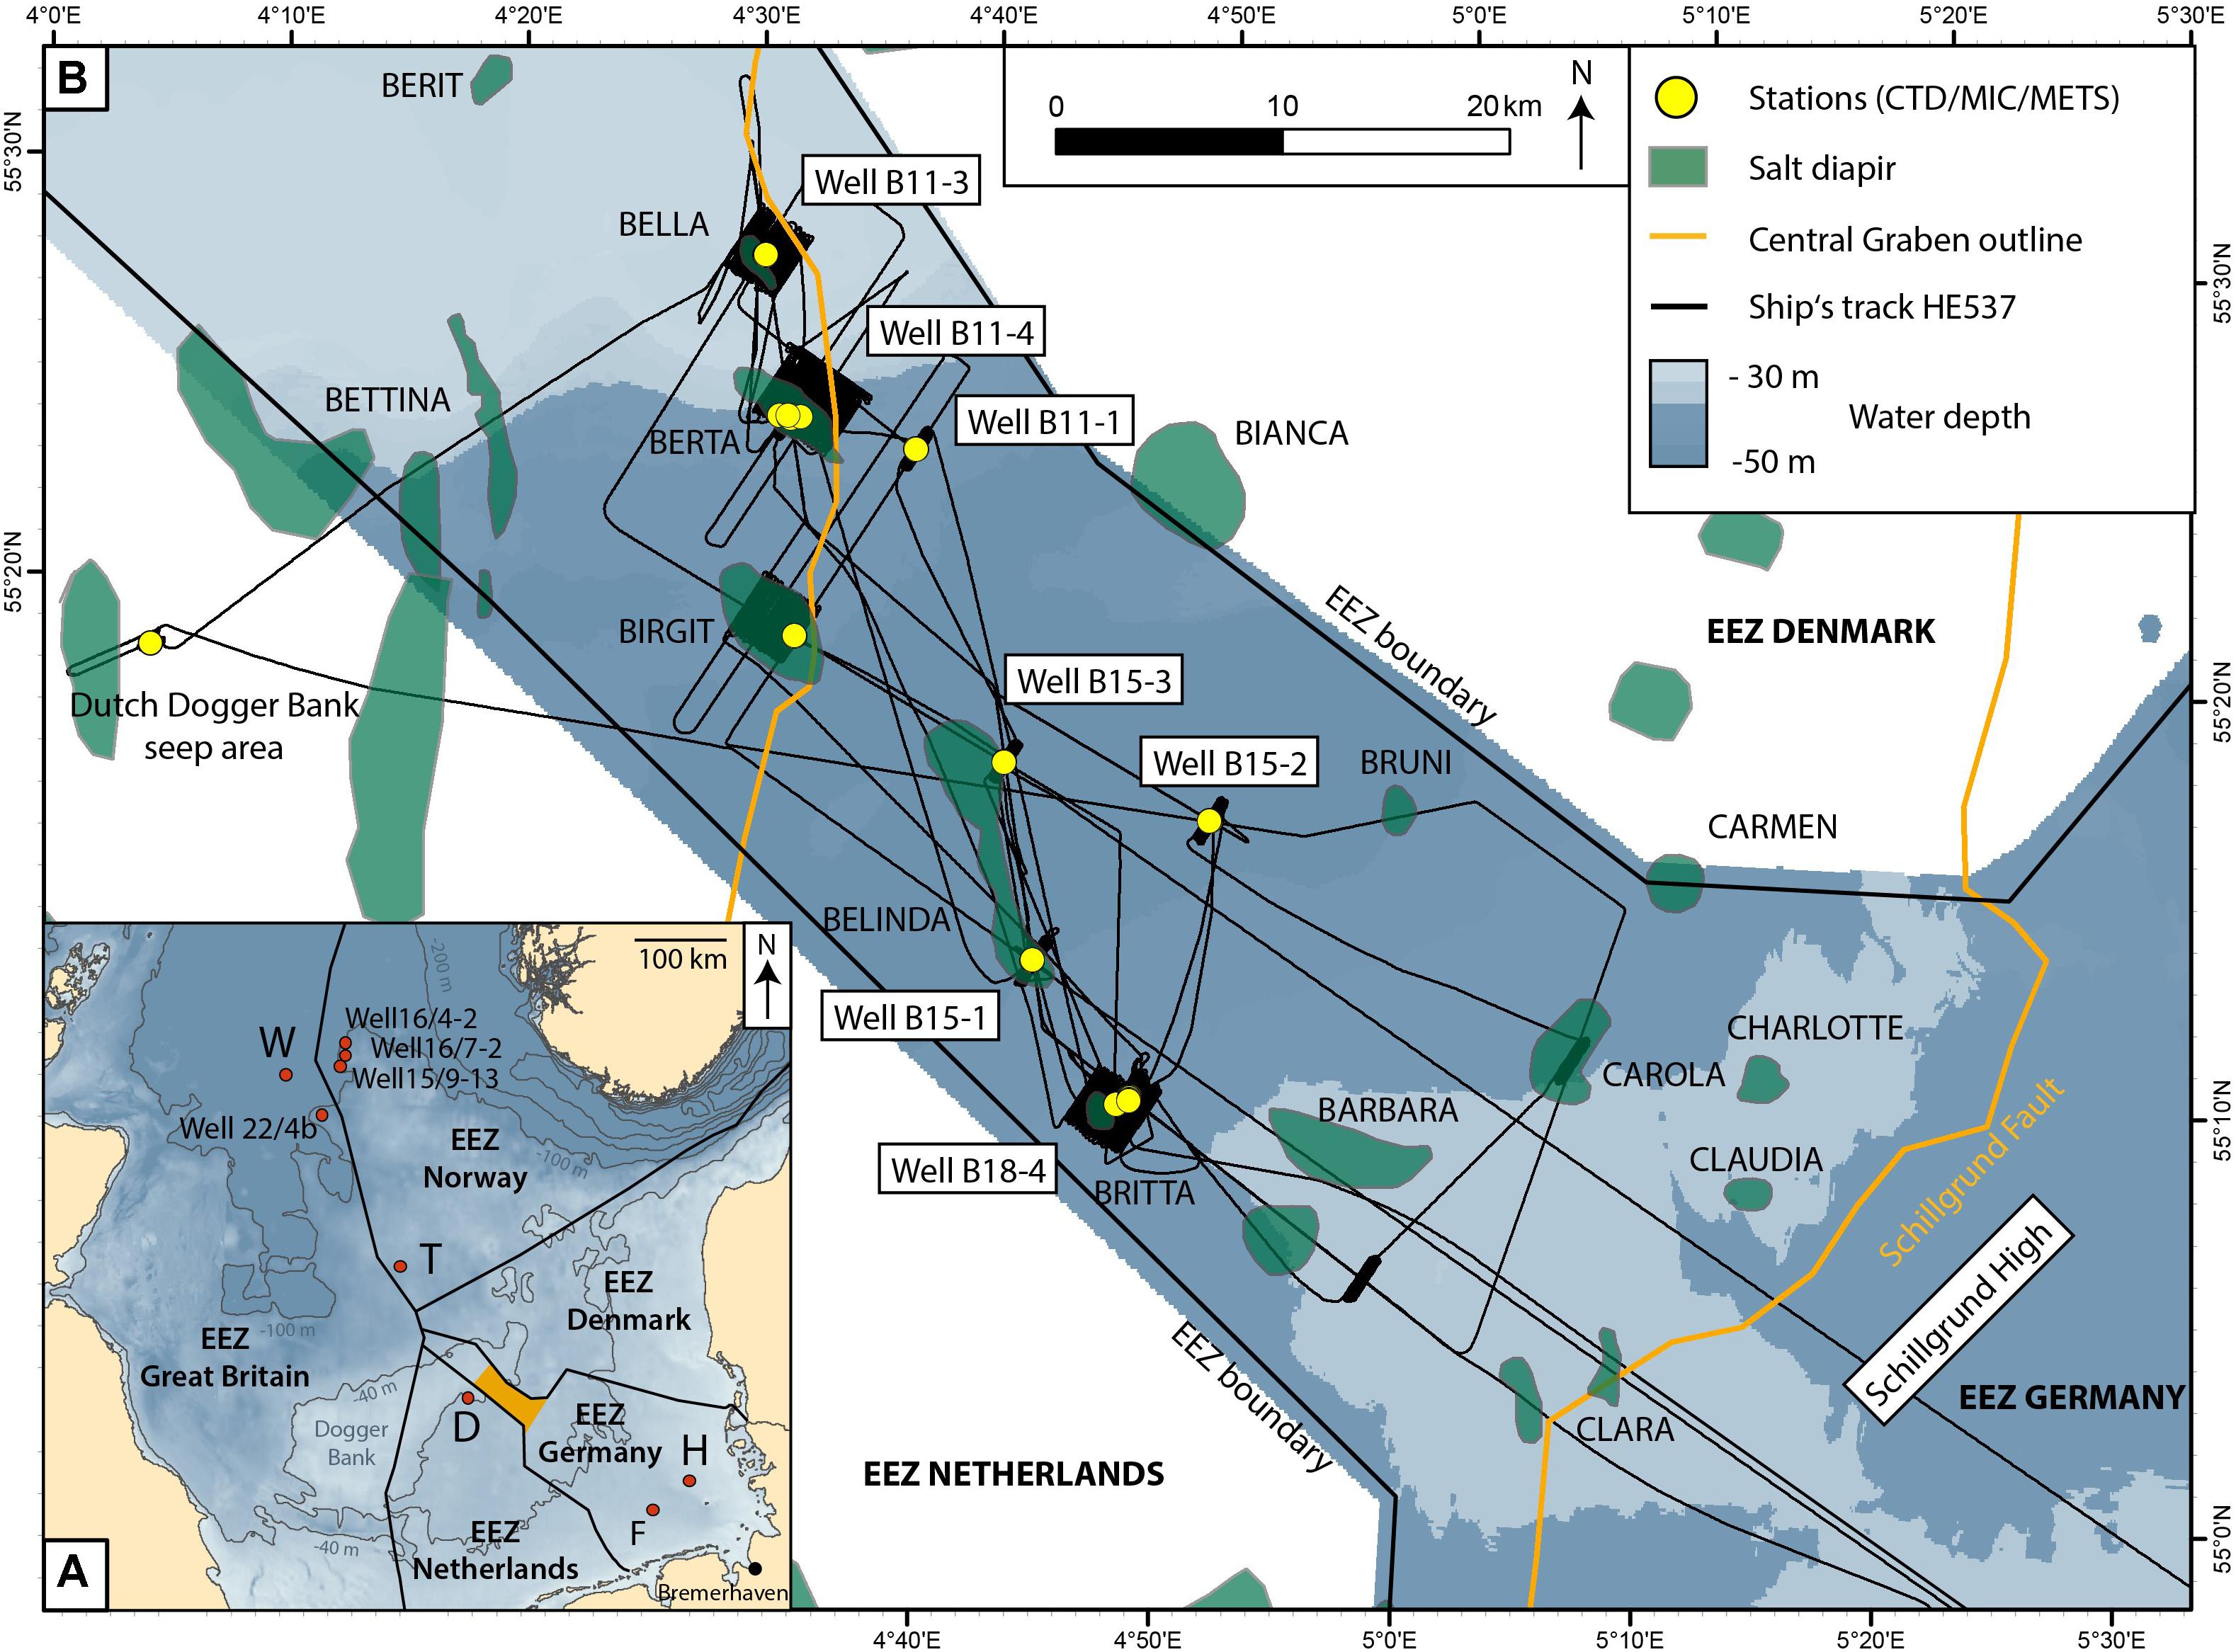
Figure 1. (A) Overview of the study area in the German Exclusive Economic Zone [EEZ, Flanders Marine and Institute (2019)] of the North Sea (orange area). Known seep sites are marked as red dots. D: Dutch Dogger Bank seep area (Schroot et al., 2005), F: Figge-Maar (Thatje et al., 1999), H: Helgoland Reef pockmark field (Krämer et al., 2017), T: Tommeliten seep area (Hovland, 1993), and W: Witch Ground Basin (Judd et al., 1994). Bathymetry downloaded from www.gebco.net. (B) Overview of the study area in the “Entenschnabel,” the northwestern part of the German EEZ. Major structural features depicted from Arfai et al. (2014) are the Central Graben (outlined in orange) and salt diapirs in the subsurface (green areas). Yellow dots point to sampling and measurement stations during R/V Heincke cruise HE537 conducted at seven abandoned well sites, a reference site at salt diapir Birgit, and the Dutch Dogger Bank seep area for comparison. Bathymetry downloaded from www.gpdn.de.
Indications of elevated methane concentrations in the North Sea have been deduced from continuous surface water measurements (Rehder et al., 1998) and atmospheric measurements (Judd, 2015), both conducted while crossing our study area in the “Entenschnabel” (local term of that area, meaning “Duck’s Bill,” because of the shape of its outline, Figure 1A). Methane sources were thought to be related to natural seafloor seepage or alternatively to an anthropogenic well (Judd, 2015). Abandoned wells have been suggested to act as focused migration pathways for hydrocarbons after decommissioning and several recent studies on onshore boreholes have proven the release of hydrocarbons from former gas and oil wells (Kang et al., 2014; Boothroyd et al., 2016; Townsend-Small et al., 2016; Schout et al., 2019). The relative importance of this phenomenon is a matter of discussion [e.g., Schout et al. (2019) found 1 of 29 onshore wells to leak methane]. In a marine setting Vielstädte et al. (2015) studied three well sites in the North Sea and found gas bubbles emitting methane in varying amounts (1–19 tons of CH4 per year per well). The authors demonstrated by stable carbon isotope analyses that the methane originates from shallow, microbial sources rather than the gas reservoirs. They concluded that mechanic disruption by drilling operations is responsible for methane leakages from shallow, methane-loaded sediments, and that such processes may hold for one third of wells in the North Sea. By extrapolating their observations to the roughly 11,000 abandoned well sites in the North Sea, Vielstädte et al. (2017) estimated that 3–17 kt year–1 methane potentially escape from the seafloor, which highly exceeds naturally released methane in this area. A recent study by Böttner et al. (2020) suggests that gas release from 1792 investigated decommissioned hydrocarbon wells in the United Kingdom sector of the North Sea is with 0.9–3.7 kt year–1 a major source of methane in the North Sea. Even larger amounts of methane are emitted through well site 22/4b that experienced a man-made blowout in 1990 (Leifer and Judd, 2015 and references therein; Rehder et al., 1998). Leifer (2015) calculated an emission of 25 kt year–1 of methane through gas bubbles even 22 years after the blowout.
Shallow seas such as the German sector of the North Sea may potentially be prone to natural and anthropogenic methane leakages into the sea-air boundary layer, because bubbles may reach shallow water layers and the sea surface. Gas exchange leads to fast dissolution of methane out of the bubbles during their ascent in the water column but shallow seep sites are expected to transport some fraction of the methane up to the sea surface and contribute to the atmospheric methane inventory (Leifer and Patro, 2002). It has been shown for the nearby Dutch Dogger Bank seep area, located in ∼40 m water depth, that released bubbles reached the sea surface and elevated methane concentration could be detected in the air above the most intense flare areas (Römer et al., 2017). The vertical transport of dissolved methane is highly restricted by the density stratification in the water column and strong summer thermoclines can also limit the vertical gaseous transport (Schmale et al., 2010; Mau et al., 2015). For example, at the 70 m deep Tommeliten area in the Norwegian sector of the North Sea, a summer thermocline constrained methane transport to the atmosphere, and numerical modeling showed that during the summer season less than 4% of the gas initially released as bubbles at the seafloor reaches the mixed layer (Schneider Von Deimling et al., 2011). An even smaller fraction of only 3% of the total water column inventory of dissolved methane was located in the mixed surface layer above the crater of the blowout well 22/4b, revealing that methane transfer across the thermocline was strongly impeded (Sommer et al., 2015).
The area of our investigation is located in the northwestern part of the German North Sea Sector. The geology there is characterized by a prominent Mesozoic rift-structure, the so-called Central Graben. The Central Graben is genetically a half-graben, whose eastern flank is formed by a major fault array, the Schillgrund Fault, and whose western flank is dominated by a series of horst and graben structures (Arfai et al., 2014). During several Mesozoic rifting phases, organic-rich marine mudstones were deposited that are important source rocks of the southern North Sea area and pose a possible source for thermogenic gas (Wong, 2007). The Central Graben is therefore a major hydrocarbon province in the North Sea (Littke et al., 2008; Pletsch et al., 2010) and was the target area of extended oil and gas exploration and drilling activities, which resulted in more than 49 exploration drill sites in the “Entenschnabel” since 1976 (see Lower Saxony’s borehole database: www.lbeg.niedersachsen.de).
This study reports on the first detection of methane seepage in the “Entenschnabel” located in the North Sea with water depths between 30 and 50 m. An extensive hydroacoustic mapping campaign including water column recording and sediment profiling has been conducted to determine the presence and distribution of flares indicative for gas bubble releases, as knowledge on the integrity of respective deep wells and the occurrence of natural seep sites is so far limited. Continuous and discrete measurements of dissolved methane concentrations in the water column were retrieved to support identification of seepage from the seafloor. A major focus was the investigation of gas emission in relation to subsurface salt diapir locations, seismically identified gas accumulations and abandoned well sites. Our interdisciplinary approach enabled a first characterization of the seepage detected in the work area in the North Sea.
Materials and Methods
The data for this study were acquired during R/V Heincke cruise HE537 in July 2019. The track line shown in Figure 1B shows the hydroacoustic mapping strategy in the study area and illustrates the surveys focusing at six dedicated salt diapirs and seven abandoned well sites. Sediment and water samples were taken at five different salt diapir structures and two further abandoned well sites (yellow dots in Figure 1B). A detailed electromagnetic (EM) survey of the shallow seafloor has been analyzed at salt diapir Berta. Finally, methane sensor (METS) deployments were conducted at salt diapirs Bella, Berta, Belinda and Britta as well as the two other abandoned well sites. An example of the survey and sampling strategy is shown in the Supplementary Figure 1.
Hydroacoustic Data
The Kongsberg EM710 is a shallow to mid-water specific multibeam echosounder (MBES) operating between 70 and 100 kHz and an optimal depth range from 10 to 1,200 m. With a transducer configuration of 1 by 2 degrees, this system has 200 beams, with 400 soundings in high density mode, measuring both bathymetry and backscatter. The system was operated with a swath angle of 130° (65° to both sides). Vessel speed was at maximum (during transit times) 8–10 knots, however, was reduced for hydroacoustic mapping in the work area to 3–5 knots. Between the surveys, CTD profiles were carried out and used to calculate sound velocity profiles that were inserted in the acquisition software Seafloor Information System. The open source software package MB-System (Caress and Chayes, 2017) has been utilized to post-process the bathymetric and backscatter data. The investigation of active gas emission sites on the seafloor where gas bubbles can be detected hydroacoustically in the water column (flares) was enabled by analyzing the water column data generated by the EM710. Post-cruise analyses with the FM Midwater module of QPS Fledermaus allowed for manual flare identification and geo-picking of flare sources.
Geographical visualization and statistical analysis were performed using ESRI ArcMap 10.4. The spatial analyst tool “near” was used to obtain distances of all flare positions to outlines of salt diapirs, bright spots and abandoned well sites. All results were further normalized using the ships track (distances of 10-m points to the same features) to account for the different coverages and survey focus during cruise HE537. Maps included in this study were spatially projected in UTM zone 32N (WGS84).
During the second half of cruise HE537, the hull-mounted SES-2000 medium (Innomar Technologies) sediment echosounder system was used to image shallow sedimentary structures and gas indications. The SES-2000 employs the parametric effect to achieve a small signal opening angle of about 2° at relatively low frequencies between 4 and 15 kHz. The data used in this study were recorded at 6 kHz and penetration depths down to ∼25 m below seafloor were achieved. The raw data were converted to SEGY-format using the custom PS32SGY software (Hanno Keil, University of Bremen). The data were loaded into the commercial software package Kingdom Software (IHS) for display and interpretation (i.e., mean amplitude grid calculation and horizon mapping of gas indications). Conversions from two-way-traveltime to depth have been calculated using a sound velocity of 1,500 m/s.
Electromagnetic Data
Sediment-physical properties of the seabed were mapped with MARUM’s benthic EM profiler NERIDIS III, dedicated for EM seafloor classification. The bottom-towed sled has dimensions of 5.2 × 1.2 × 0.8 m, and a weight of approx. 250 kg in water. It is equipped with a horizontal EM induction-loop sensor (1 m diameter), an Attitude-Heading-Reference-System (AHRS), and conductivity-temperature-depth probe (CTD) with turbidity sensor (Müller et al., 2011). The profiler was towed in contact with the seabed at speeds of 2–4 kn (1–2 m/s). The position of the EM-sensor was determined from triangulation using the ship’s differential GPS coordinates, tow cable length and water depths. EM data were measured at salt diapir Berta along 11 parallel profile lines with 50 m line spacing, covering an area of 2,300 × 600 m. Comparison of the CTD depth-profile of the bottom-towed sled with echosounder bathymetry allows to assess the position accuracy of EM soundings. Error propagation of DGPS-, layback-, and AHRS-uncertainty results in sensor positioning with about 5 m accuracy.
The central loop EM method coevally quantifies electric and magnetic properties in the topmost 1–2 m of the sediment by measuring the EM response at seven frequencies (range: 75–10 kHz) with stable sensor elevation of 25 cm (pitch varies between −0.5° and 1°). A half-space inversion method (Müller et al., 2012) was used to convert calibrated raw-data into appropriate SI units of apparent electric conductivity and magnetic susceptibility (the term apparent is used to specify that this value is derived from EM data modeling and no vertical layering is considered). The apparent conductivity of the highest (10 kHz) frequency was despiked to remove local high-amplitude anomalies of metallic objects in the subsurface and median filtered (25 samples per second raw data, 2 s median). Data were interpolated on a regular grid of 10 m cell size using inverse distance gridding (100 m search radius). A directional cosine and a 100 m low pass filter was applied to remove small line-to-line errors and noise.
Gas saturation is often calculated from EM conductivities using Archie’s empirical porosity-resistivity relation (Archie, 1942) for a three-phase porous system of sediment grains, pore-fluid and resistive hydrocarbons such as gas or gas-hydrate (e.g., Schwalenberg et al., 2020):
where σg is the electric bulk conductivity of the sediment section derived by inversion from EM data, σw the conductivity of the pore fluid (usually close to bottom water conductivity measured by the CTD probe), ϕ the sediment porosity and Sg the gas saturation of the pore space. Equation (1) contains empirical constants that are usually determined from physical properties measured in boreholes and on sediment samples, where a describes the tortuosity, m the cementation factor and n the saturation exponent. The latter varies from 1.8 to 4.0 but is often found close to 2.0 (e.g., Schwalenberg et al., 2017). Assuming that the lithology does not change between gas-charged and gas-free sediment sections, Eq. (1) simplifies to:
where σ0 is the background conductivity of the pore water saturated sediment and σg the bulk conductivity of the gas-charged sediment section (both derived by inversion from EM data). Assuming the widely used gas saturation parameter n = 2.0 one can estimate the gas-saturation from electric conductivity anomalies without actual porosity determination, although local sediment compaction or dilution is omitted.
Water Sampling
The hydro-geochemistry (e.g., temperature, oxygen saturation, fluorescence, and transmission) was analyzed and samples were taken using a CTD SBE911plus and carousel water sampler SBE32 equipped with additional sensors including oxygen sensors (SBE43), fluorometer (Wetlabs, EcoFLR), transmissiometer (Webtabs CStar, 25 cm). Bottom waters were sampled with a Mini-Multicorer (MIC). Samples from the water sampler were taken immediately and bubble free after retrieval using a silicon tube. Samples were directly transferred into 118 ml glass bottles and were acidified with 2 ml 37% HCl. The bottles were sealed with a Teflon coated butyl rubber seal and were closed with aluminum crimp caps. Dissolved gas concentrations were determined applying a headspace equilibration technique described in detail by Schloemer et al. (2018). 25 ml of the water samples were replaced by laboratory grade Helium (5.9) and the samples equilibrated to ambient temperature varying from 23° to 28°C (since the laboratory was not air-conditioned) for at least 2 h on a laboratory shaker. After equilibration, the total headspace pressure was measured using a pressure transducer (range 0 to 160, 0.8 kPa accuracy). For gas chromatography analysis of methane and higher hydrocarbons up to i-/n-butane in the headspace a Shimadzu 14B gas chromatrograph with splitless injection was used and 1 ml of the equilibrated gas was injected with a gas-tight syringe. Compounds were separated on a 3 m packed column (1/8” Porapak Q) using nitrogen as carrier gas and detected on a flame ionization detector. Methane was calibrated with a 10 ppm standard air (Linde Minican) and laboratory air diluted with helium down to 0.09 ppm CH4. The concentrations of the dissolved methane, and if present of higher hydrocarbons, were calculated using the partial pressure, derived from fractional concentration and total headspace pressure, temperature of the sample, volume of headspace gas (25 ml) and remaining water (93 ml) applying the Henry’s Law constant of methane. A correction for the salting-out effect was applied using a total salinity of 0.59 mol/L and the Setchenow constant for the analyzed components. The relative error of the GC analysis is around ± 3% and for the total analyses ∼ ± 10%.
Methane Sensor Deployment
The METS from the company Franatech was mounted at a frame (together with CTD, video cameras, forward looking sonar, altimeter, and USBL transponder), which was towed 0.5–2 m above the sea floor at tow speeds of only 0.5–1 knots. The detector is a semiconductor, which is in contact with a gas-filled chamber that is separated from the surrounding water by a sintered disk supporting a gas-permeable membrane. This allows for the separation of dissolved gases from the water where the gas flow is driven by diffusion following Fick’s Law. To support a constant flow of water at the outside of the membrane, a Seabird 5 M pump is used. The listed measuring range of the METS is 1–500 nM, which covers methane maxima as well as open ocean background values. The reaction time of the sensor is limited by the diffusion through the membrane. Accuracy and precision of calculated concentrations are further dependent on the response time of the temperature sensor (Pt100), listed with T90 = 1–30 min as the response of a semiconductor exposed to a target gas is highly temperature sensitive. Since the frame was towed in a nearly horizontal direction, temperatures were comparably stable and an equilibrium reached shortly after descending the frame. The sensor was calibrated by Franatech just before the HE537 cruise. Excluding the temperature dependency, the measured conductivity has a linear relationship with gas concentration. The precision of a Pt100 sensor is commonly ± 0.05°C, which induces an error of 5 nM at temperatures between 9.0 and 9.8°C as measured in the bottom water of the working area in bottom depths of 40–44 m.
Results and Discussion
Gas Flare Occurrence in the “Entenschnabel”-Area
Gas emissions were detected and identified as flares in water column echograms of the MBES. Due to the limited coverage of the swath for water column observations, the total area covered for flare imaging was roughly 65 km2. In total, 315 water column anomalies were recorded in the “Entenschnabel,” in the northwestern part of the German North Sea (Supplementary Table 1). Flare observations were classified according to their appearance being certainly caused by gas bubble emissions or having an uncertainty of being misinterpreted and caused by schools of fish, which may have a similar appearance in the echogram as a flare. Relatively weak appearing anomalies or anomalies with anomalous shapes (deviant from a continuous linear feature) were therefore classified as uncertain. This uncertainty increases during bad weather conditions causing enhanced noise in the echogram or when gas emissions occur in pulses of bubble release that show up as single anomalies within the water column instead of continuous linear flares that are connected to the seafloor. Consequently, 210 flares were classified as certain flare observations, whereas 105 anomalies appeared too weak or unclear for being undoubtedly interpreted to be caused by gas bubbles. As some areas were studied multiple times, flare observations were partly repeated and flare numbers have been corrected for probable double counting. The numbers reduce to 269 detected water column anomalies of which 166 were classified as certain flare observations and 103 uncertain anomalies. Although double detection during different survey times suggests that most flares may be spatially and temporally stable, about 50 certain flares (30%) that were passed more than once were non-recurring. Natural gas emissions have often been observed to be highly transient in a variety of time scales in both the marine and freshwater settings (e.g., Tryon et al., 1999; Boles et al., 2001; Torres et al., 2002; Varadharajan and Hemond, 2012; Kannberg et al., 2013; Römer et al., 2016). It was argued that the variability of methane fluxes might be controlled by fluid flow rates mediated by microbial processes or physical changes in bottom pressure by, e.g., tides, bottom water currents, storms, swell, or earthquakes (Fechner-Levy and Hemond, 1996; Leifer and Boles, 2005; Scandella et al., 2011). Long-term monitoring or repeated observations would allow for evaluation of the variability of gas emissions and provide evidence for the controlling mechanisms in our study area.
Flare height determination is generally limited by the swath geometry, and the upper parts of most flares detected in this study are cut off in about 5–15 m below surface. Flares were detected in heights from less than 10 m and ending within the water column (as seen in Figure 2A) to more than 30 m to shallow water depths (e.g., the flare shown in Figure 2B would have probably reached the surface, if a full view would allow imaging the upper parts). Flares were detected at seafloor depths of 31 to 48 m. Bubbles released in such shallow depths are expected to reach the surface and contain some fraction of their initial methane content when reaching the sea surface, where the bubbles burst and directly contribute to the atmospheric methane inventory (Leifer and Patro, 2002). This has been measured and visually observed, e.g., at the nearby Dutch Dogger Bank seep area with a water depth of ∼40 m. In this seep area, flares were observed to reach the surface, and air measurements above some of the seep sites confirmed a transport of methane into the atmosphere (Römer et al., 2017). During the HE537 cruise, measurements of dissolved methane confirmed an oversaturation of methane in surface waters at the Dutch Dogger Bank seep area (see below). Surface water and atmospheric underway measurements reported in earlier studies from Rehder et al. (1998) and Judd (2015) passing through our “Entenschnabel” study area as well as our own measurements also detected elevated methane concentrations in surface waters (as described in section “Dissolved methane in the water column and bottom waters”), which would support the suggestion that the detected flares transport methane from the seafloor to the atmosphere.
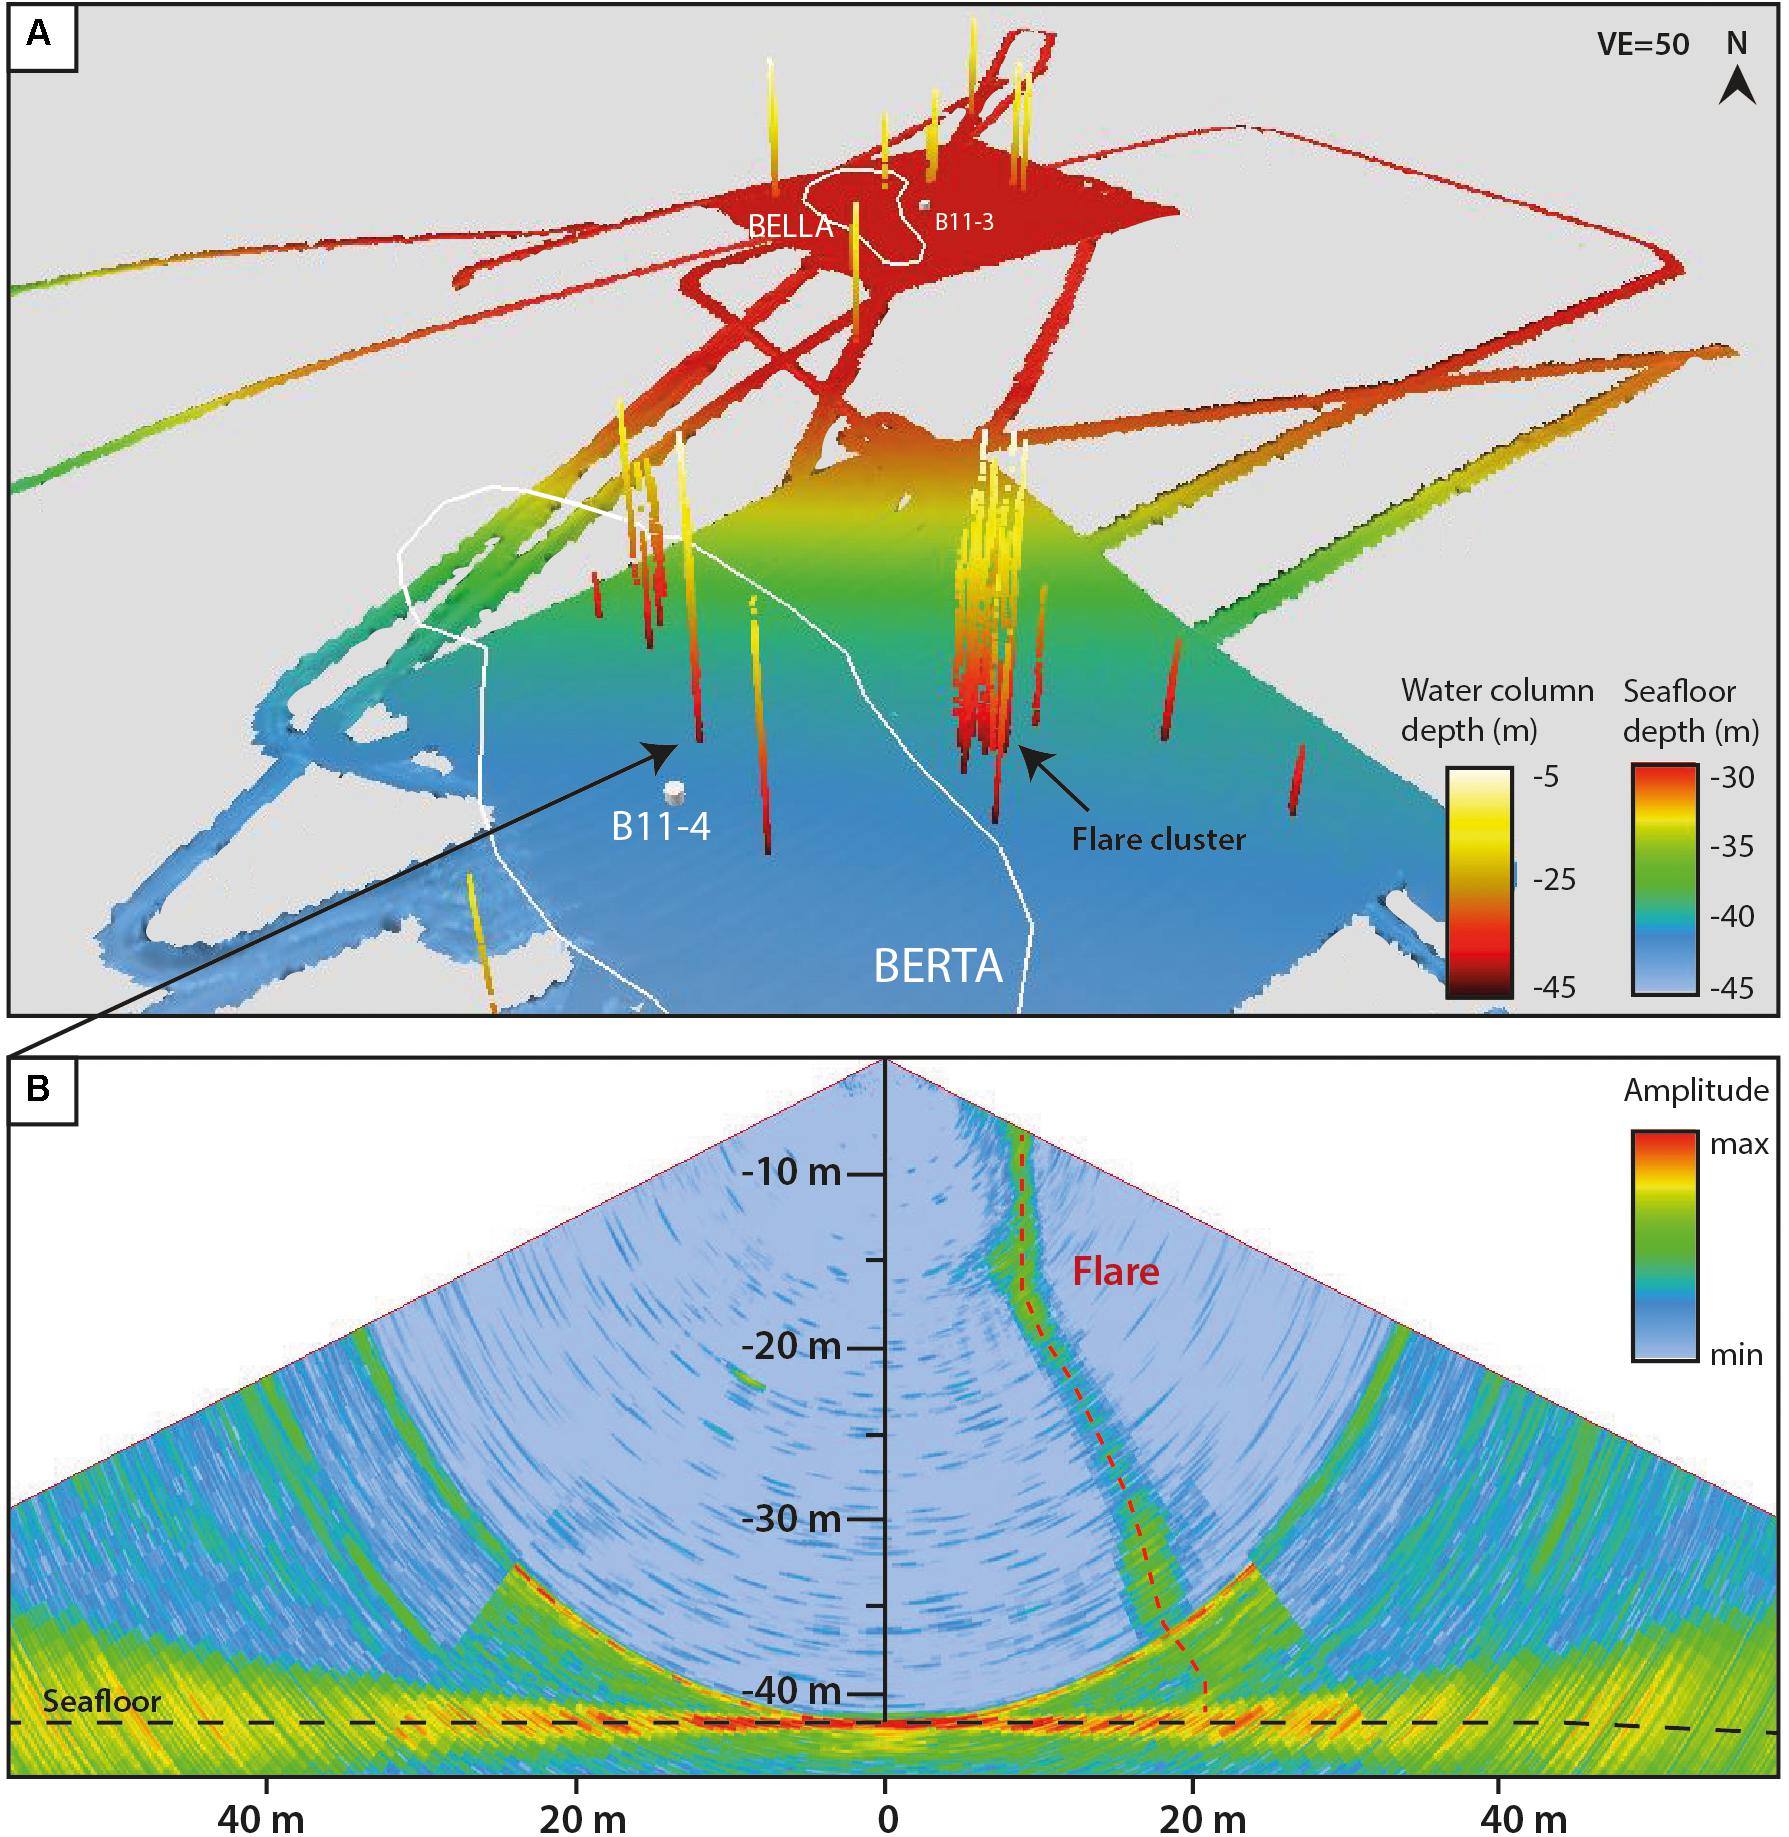
Figure 2. (A) Flares extracted from the water column data imaged with the bathymetric data, recorded by ship-based multibeam echosounder Kongsberg EM710 during R/V Heincke cruise HE537. White outline: subsurface salt diapirs (Arfai et al. (2014), white dots: abandoned well sites (from Lower Saxony’s borehole database: www.lbeg.niedersachsen.de). (B) Swath image of the water column data illustrating a flare detected above salt diapir Berta. The flare represents the pathway of gas bubbles released in 42 m water depth through almost the entire water column.
Bathymetric mapping of the study area revealed that flare locations are not related to morphological seafloor indications (e.g., mounds, pockmarks, and linear cracks) or seafloor backscatter anomalies (due to, e.g., authigenic carbonate precipitation or colonization) that might be indicative for gas seepage. The seafloor is generally flat, between 30 and 50 m deep and smoothly slopes down from the Schillgrund High in the SE toward the Central Graben and further up at the northern part of the study area NW of the Central Graben. In the area of salt diapir Britta, however, we found several depressions that could have been formed by fluid release. No flares were detected in the Britta area despite several site surveys and station work. Nevertheless, the current lack or inactivity of gas release may not restrict its presence in the past forming such depressions. More than 17 depressions have been detected of which 13 appear in a semi-circular arrangement southeast of well B18–4 (Figure 3A). Some are partly intercalated, forming linear or composite depressions. Four other depressions were detected in distances between 460 and 980 m southwest and east of the well site (not shown). The depressions are circular to subcircular in shape with dimension of a few meters to maximal 25 m cross sections. Their shape is funnel-like with slopes of 1–5° and depths of up to ∼50 cm (Figure 3C). Backscatter mapping additionally revealed elevated backscatter patches related to the depressions (Figure 3B). Although most prominent hydrocarbon seeps have surface relief manifestations such as pockmarks (Judd and Hovland, 2007), other examples of seep areas lacking morphological features were described from the North Sea, including the Dutch Dogger Bank seep area (Schroot et al., 2005; Römer et al., 2017) and the “Heincke” seep area [Gullfaks in the Norwegian North Sea, Hovland (2007)]. It has been speculated that coarse-grained material of gravel/sand beach deposits might prevent pockmark formation (Hovland, 2007). Known natural seep sites in the North Sea correlated with pockmark formation include the large pockmarks in the Witch Ground Basin (Judd et al., 1994; Böttner et al., 2019), complex pockmarks in the Nyegga area (Hovland et al., 2005), the temporally dynamic Helgoland Reef pockmark field (Krämer et al., 2017), and small depressions at the Tommeliten seep area (Schneider Von Deimling et al., 2011). In addition, artificially created blowout events formed large depressions in the North Sea. Examples are the well site 22/4b, which displays a 50 m wide and 20 m deep depression formed in 1990 (Schneider Von Deimling et al., 2007; Leifer and Judd, 2015), and the so-called “Figge-Maar” with a depression of 400 m width and an initial depth of ∼30 m depth after a carbon dioxide eruption in 1964 (Thatje et al., 1999; see location in Figure 1A). The depressions detected in this study at salt diapir Britta are located in distances of 30 to 750 m of the abandoned well site B18–4, which does not exclude nor prove a generic relationship.
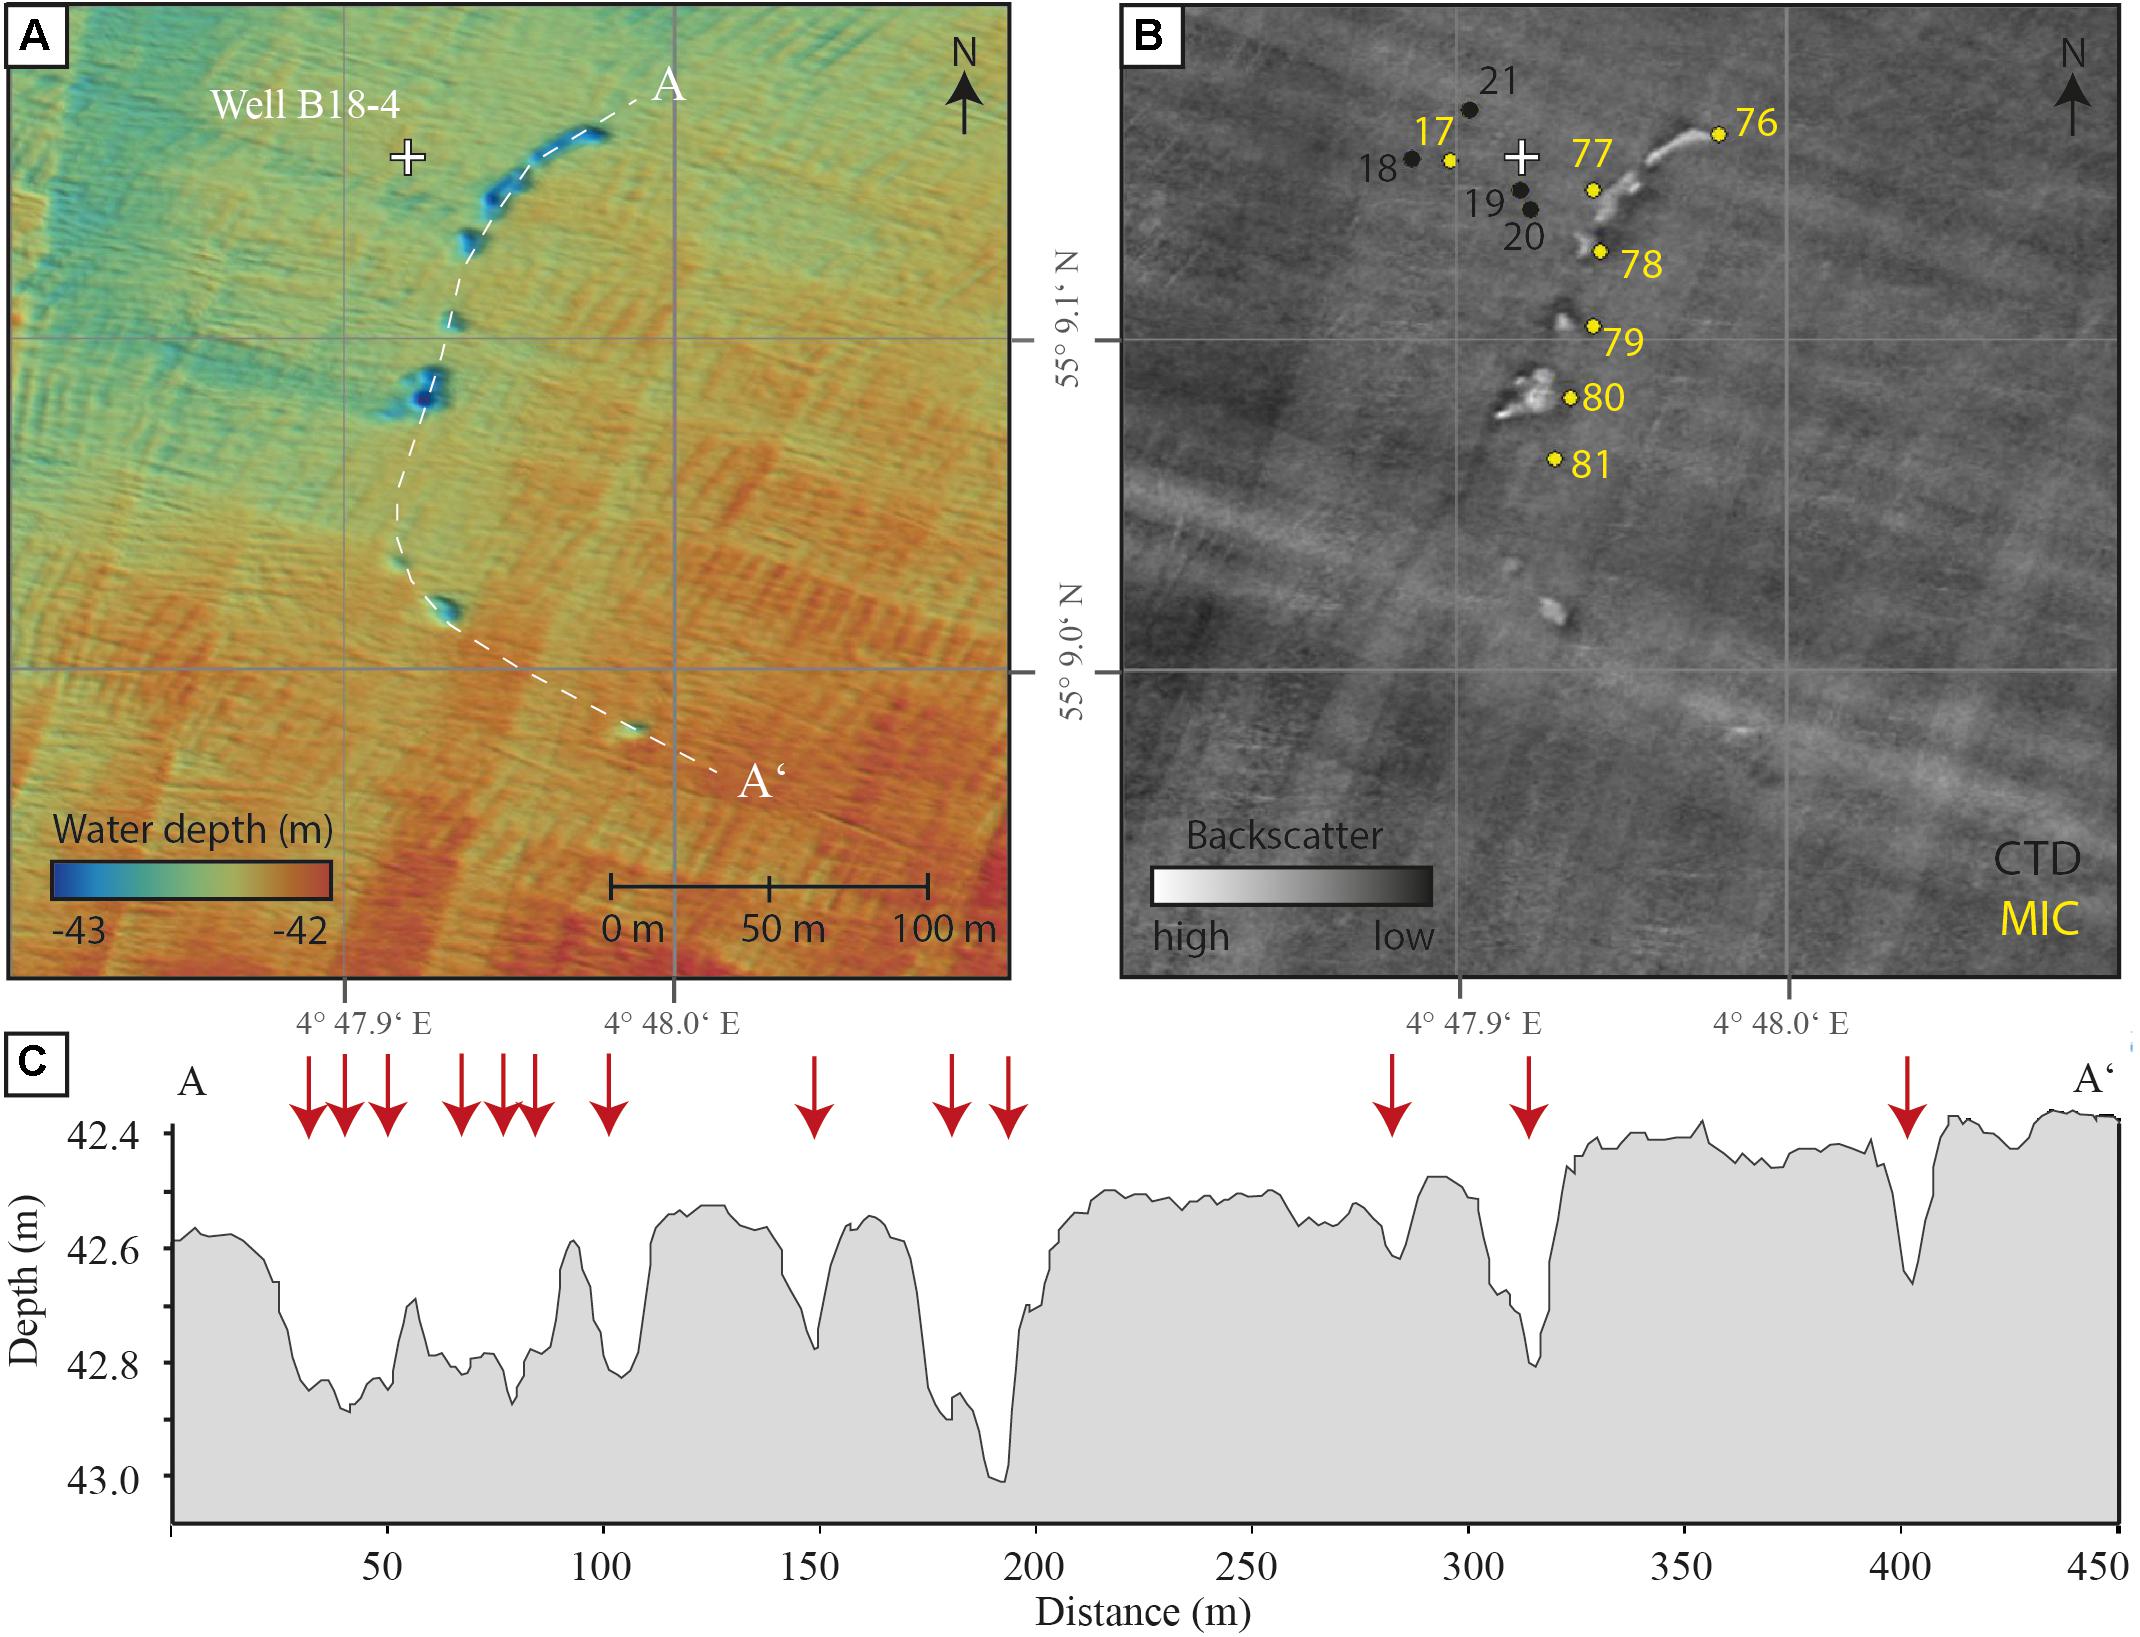
Figure 3. (A) Bathymetric map of the area at salt diapir Britta, where several depressions were detected. Grid cell size is 2 m. Note: linear features in cm-scale vertically are artifacts. (B) The backscatter map shows that depressions are characterized by high backscatter signals (white patches). The area around well B18–4 and the depressions have been sampled for water (CTD casts) and bottom water (MIC stations) with station numbers (Supplementary Table 2). (C) Bathymetric profile crossing the depressions (marked by red arrows) from A to A’ (A), indicating their sizes, depths, and shapes.
Dissolved Methane in the Water Column and Bottom Waters
Dissolved methane concentrations measured in bottom waters (sampled with MIC) and waters below the pycnocline (sampled with CTD) at the salt diapir Berta (close to well B11–4) were 10 to 13 times higher (max. 120 nM) than background values of about 9 nM detected in the “Entenschnabel” (Figure 4A and Supplementary Table 2). These elevated methane concentrations extended approximately 500 m to the east and west of the well site and did not increase toward the well. Slightly increased methane values of 20–30 nM also existed southeast of Berta close to abandoned well site B11–1. Well B11–1 is unlikely the origin of methane seepage, since no flares were detected near the site by hydroacoustics (coverage: 1,000 × 300 m), and we consider that diffuse seafloor venting would have led to a different methane profile with the highest amounts in the bottom water layer. However, the measured methane profiles showed slightly decreasing values with increasing depth and lower concentrations in the bottom water (Figure 4A and Supplementary Table 2). Since the most distant CTD cast from B11–1 exhibited highest methane concentrations in the deep water layer, and area B11–1 is ∼3 km apart from salt diapir Berta, a horizontal input from, e.g., the Berta seep area is feasible. Data extracted from the Operational Circulation Model of the BSH (Dick et al., 2001) show that a transport of water masses originating from the Berta area is feasible due the strong tidal currents. At the time of sampling, the current had only just switched directions after a period (5 h) of steady easterly currents (up to 24 cm/s). Compared to the Berta area the methane concentrations at the nearby Dutch Dogger Bank seep area were much higher and more variable. Here, values in the deepest water samples reached up to 2,085 nM (Figure 4A), which is 200 times the background value and compares well with the published concentrations of up to 1,628 nM by Mau et al. (2015). Bottom water samples, taken from MIC sampling, reached values of up to 11.14 μM. This compares to 113 nM measured at the Berta seep area (Figure 4A).
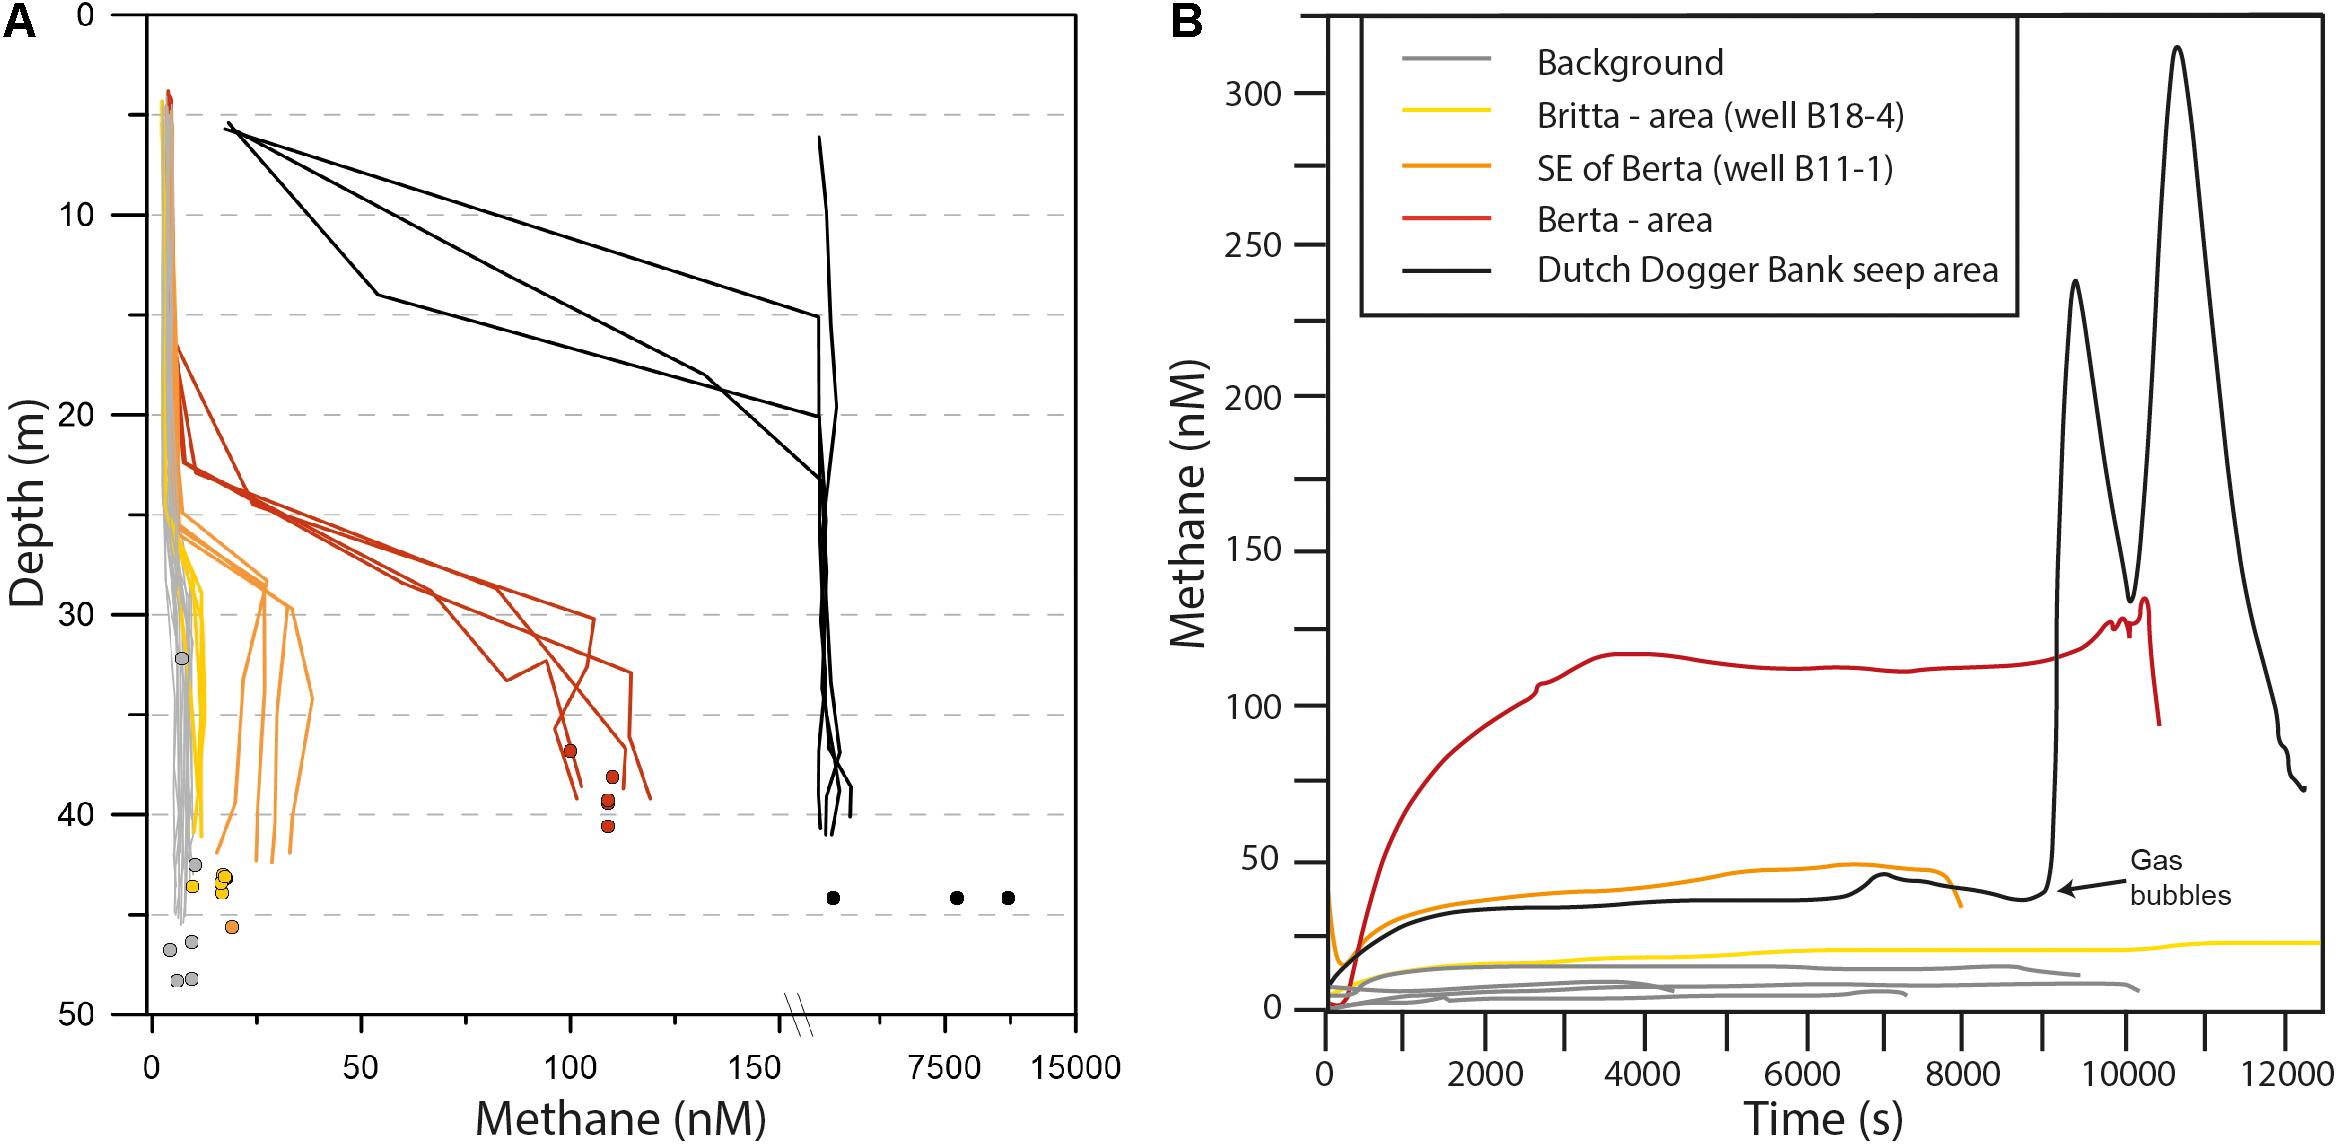
Figure 4. (A) Profiles of methane in the water column of the “Entenschnabel” study area and for comparison of the Dutch Dogger Bank seep area (Please note break in the x-axis to address the different ranges of methane concentrations) as well as of concentrations in bottom waters (dots, MIC water samples) close to water column stations. Light gray samples represent background values at the reference site at salt diapir Birgit and four abandoned wells (wells B15–1, B15–2, B15–3, and B11–3). (B) Methane concentrations measured with the METS during towed deployments in seven areas in the “Entenschnabel” and the Dutch Dogger Bank seep area while passing a known flare cluster for comparison.
The water column methane profiles generally decrease quickly in the CTD casts toward the surface but methane concentrations vary between areas. Table 1 shows mean values for each studied area and zones of the water column (above pycnocline, surface and bottom waters). By far the highest surface water concentrations of methane are restricted to the Dutch Dogger Bank. Here, methane concentrations at 3–6 m water depth were about 18 nM in three CTD casts (Figure 4A) but reached up to 263 nM at one station, clearly indicating gas emissions reaching surface waters. No shallower samples were taken due to rough weather conditions. Based on water temperature, salinity and the current atmospheric methane concentration of 1,877 ppb (Nov 2019; https://esrl.noaa.gov/gmd/ccgg/trends_ch4/; last visited 27.03.2020), methane concentrations in equilibrium with the overlaying air (air saturated sea water; ASSW) are in the range of 2.6 nM calculated after Wiesenberg and Guinasso (1979). In the southern “Entenschnabel” area with water sampling above salt diapirs Britta and Belinda, methane surface values were only very slightly oversaturated (Supplementary Table 1). The observed oversaturation increased slightly toward this northwestern part of the working area, reaching up to 5 nM at locations Berta and Bella (Supplementary Figure 2), representing a small source of methane to the atmosphere. This is in agreement with the increased numbers of gas flares found here compared to the southern working area and measurements by Rehder et al. (1999) of slightly elevated surface concentrations in the region.
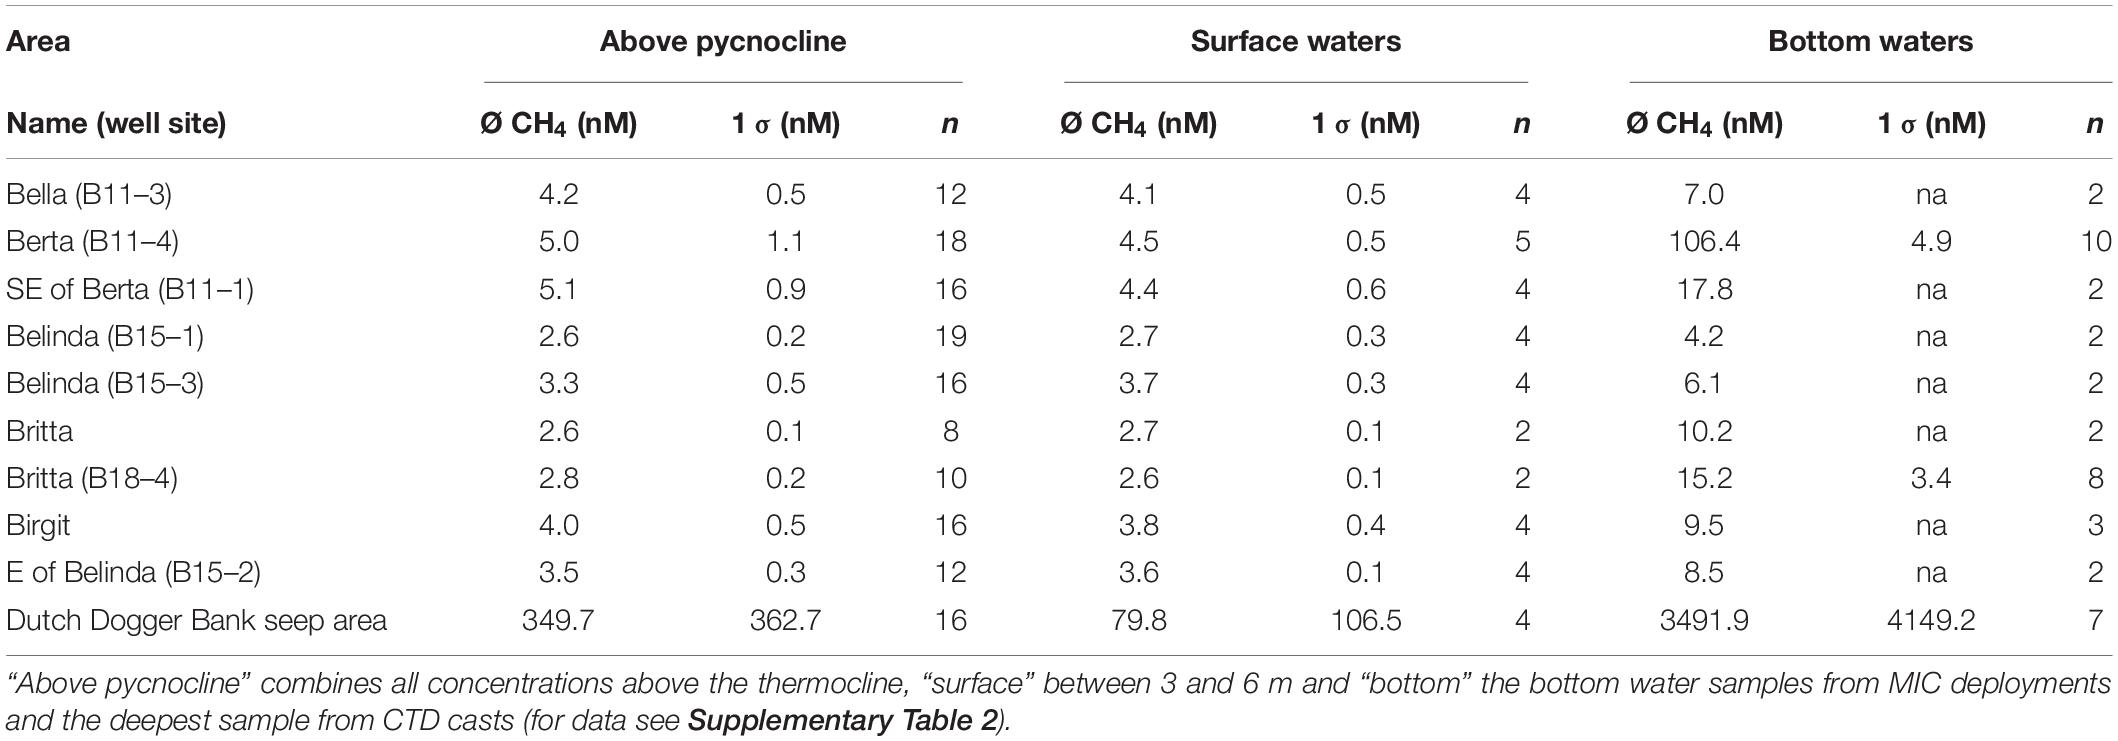
Table 1. Mean values of dissolved methane in the studied areas and in the water column zones.
Ethane, the only higher hydrocarbon detected, was found in trace amounts at two sites, one of them the Dutch Dogger Bank site. The second site is located above the Britta salt diapir in the southern part of the “Entenschnabel.” Here, bottom water samples collected from all six MIC cores contained traces of ethane. The MIC sample taken close to well site B18–4 was devoid of ethane and showed methane concentrations close to the background (9.8 nM). The MICs with ethane originated from a series of depressions occurring in a linear array near the well site B18–4, extending further to the south (as described above, see Figure 3B). In addition, methane values of bottom and deep water samples were slightly elevated with concentrations of 18 nM and 12 nM, respectively. Flares were absent in the region of these depressions, and considering the very low absolute concentrations, we assume the depressions to be pockmarks characterized by diffuse fluid transport or episodically occurring gas emissions. Trace amounts of ethane are common in biogenic gases in different environments and usually methane/ethane ratios in such samples are high (>>100). We assume that the low observed methane/ethane ratios found in the depressions at Britta (∼40) are the result of the preferential oxidation of methane compared to ethane occurring during a slow diffusive ascend of the fluid. Equally low methane/ethane ratios were assigned to partly oxidized biogenic gases in ground waters based on enrichments in 13C isotopes of methane (Schloemer et al., 2018). Propane, which would be an indicator for a migrated deeper sourced thermal (natural) gas, was not found, neither in the samples from the depressions in the Britta area nor in bottom waters at the Dogger Bank seep site.
The METS data are in good agreement with discrete water sampling from vertical CTD casts. Like the CTD casts, the METS profiles do not indicate any seepage of methane at salt diapir Belinda (well sites B15–3 and B15–2) and salt diapir Bella (well site B11–3; light gray lines in Figure 4B). At salt diapir Britta the deployments crossing the line of pockmarks detected slightly elevated methane concentrations of up to 20 nM in relatively flat time-series (Figure 4B) confirming a small methane flux into the water column. The pattern is similar close to well B11–1 with elevated concentrations of up to 40 nM. At Berta, where numerous gas flares were observed, the METS detected methane concentrations of ∼120 nM throughout most of the deployment (Figure 4B), indicating a strong oversaturation with methane over a wider area despite no active seepage having been crossed. The METS time series at Berta is relatively flat with no spikes. This is unlike a profile measured at the Dutch Dogger Bank seep area, where two clear peaks occurred during the crossing of a prominent flare cluster (Figure 4B). The METS data not only confirm the results from the discrete water sampling but show, that methane oversaturation extend beyond the small grid covered by the CTD stations.
Subsurface Gas Indications
Sediment Echosounder Profiling
Due to increased impedance contrasts resulting from enriched free gas content in the pore-space, gas in the subsurface becomes visible in sediment echosounder profiles as enhanced reflectors with high amplitudes and acoustic signal blanking appearing as vertical zones lacking any reflectors underneath these high amplitude reflections. Subsurface gas indications such as acoustic blanking and high amplitude reflections interpreted as gas pockets have been widely found and described in the Dutch North Sea sector including the nearby Dutch Dogger Bank seep area (Schroot et al., 2005; Römer et al., 2017). Subsurface acoustic blanking in our study area has been observed as (1) narrow vertical chimneys (examples shown with red arrows in Figures 5A,B), and (2) below subsurface seafloor incisions filled by sediments (Figure 5C). Chimneys were documented to reach within ∼3 m of the seafloor and are commonly few tens of meters wide. The most prominent chimney has been detected below the flare cluster at salt diapir Berta with a width of about 200 to 300 m (Figures 5A,B). Acoustic blanking below sediment-filled channels or basins becomes visible below the incised structure and follows the flanks up to the shallow subsurface (Figure 5C). This type of acoustic blanking is generally more extensive than the narrow chimneys. Acoustic blanking interpreted to result from increased free gas content were described also in relation to Pleistocene glacial valley-fills in the Netherlands EEZ (Schroot and Schüttenhelm, 2003; Schroot et al., 2005). In several sediment-filled incisions, blanking also pierces through the bottom of the channel or basin and is accompanied by high amplitude reflections at their upper limit (Figure 5C), where the gas appears to be hindered from further upward migration and accumulated. High amplitude reflections also occur in areas close to acoustic blanking in about 20 m depth below seafloor and were interpreted to represent gas pockets (Figures 5A,B). Another type of high amplitude reflections was frequently observed close to the seafloor connecting gas chimneys with flare observations in the water column (Figures 5A–C), appearing as narrow vertical lineations.
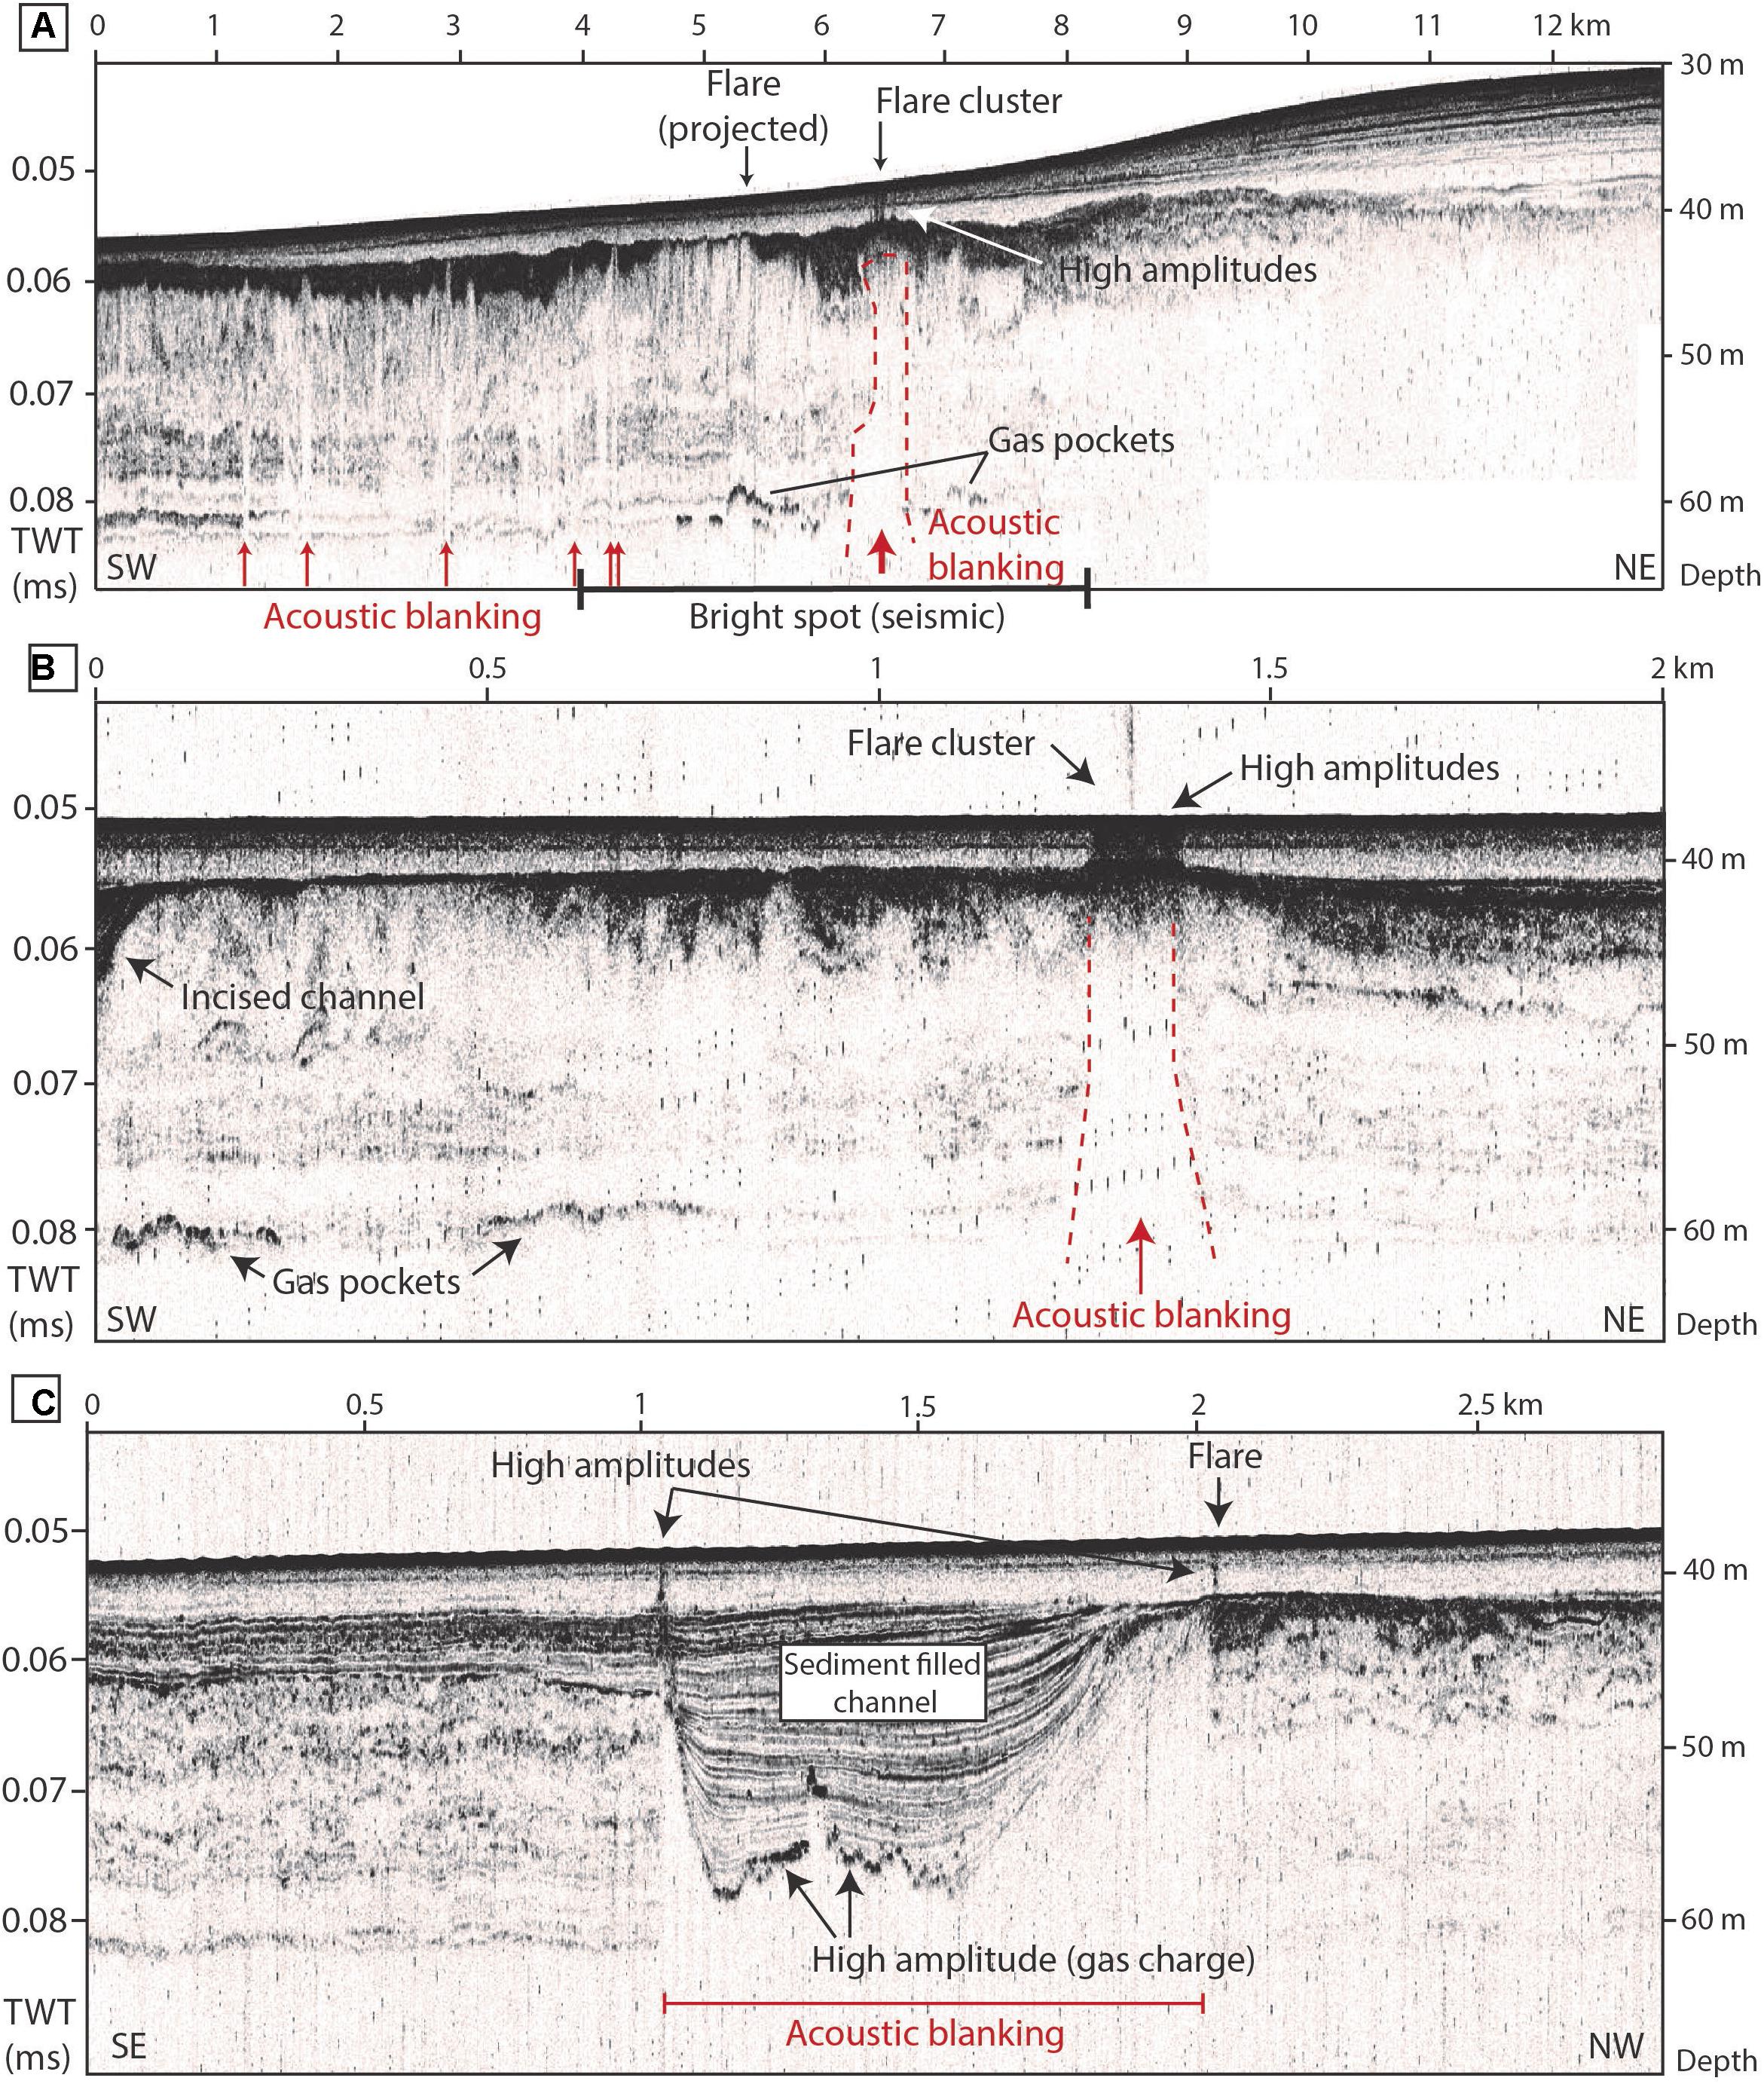
Figure 5. Subbottom profiles recorded with the sediment echosounder Innomar SES-2000 during R/V Heincke cruise HE537 in the area close to salt diapir Berta. See Figure 6B for locations. Depth conversion has been estimated using a sound velocity of 1,500 m/s. (A) Profile covering the bright spot mapped in the deeper subsurface above salt diapir Berta. Acoustic blanking forming chimneys are indicated with red arrows, with the widest chimney below the flare cluster detected in the water column (red dashed line marks the outline). (B) Detailed profile focusing on the chimney (red dashed line), in which the high amplitudes between acoustic blanking and water column flare cluster becomes visible. (C) Detailed profile showing a sediment-filled channel with columnar acoustic blanking and high amplitude reflectors below, indicating increased gas concentrations migrating along the flanks of the channel up to the seafloor.
Gas indications in shallow sediments are most concentrated at but not restricted to the area at salt diapir Berta. The mean amplitude calculated in a sediment depth interval between 10 and 15 meters below seafloor (mbsf) illustrates differences in the “Entenschnabel” (Figure 6A). Whereas the northernmost part of the study area (around salt diapirs Bella and Berta) as well as the southern part (around salt diapirs Britta, Barbara and Carola) shows lowest mean amplitudes, the central part shows overall higher values indicating better sound penetration. Besides being influenced by higher gas concentrations, such differences could be also related to sedimentological differences of the deposits. However, in the central part, areas of highest mean amplitudes are related to the presence of high amplitude reflections in sediments deeper than 10 mbsf, possibly illustrating the occurrence of free gas, which rather accumulated in the subsurface and not percolated throughout the shallowest deposits. Mapping of high amplitude reflections further indicates that their occurrence is restricted to the northern and central parts (blue lines in Figure 6A), suggesting that these areas are influenced by higher gas concentrations. Furthermore, focused acoustic blanking zones were mapped revealing several occurrences apart from salt diapir Berta (red areas in Figure 6A). With few exceptions, acoustic blanking was observed close to the outlines of salt diapirs, e.g., of Birgit, Belinda, Bruni, and Carola. However, the highest abundance of acoustic blanking was detected in the area of salt diapir Berta (Figure 6B). In part, these were related to two sediment-filled incisions (black outlines in Figure 6B), which also show up as elevated mean amplitudes when deeper incised than 10 mbsf. High amplitude reflections and acoustic blanking not related to the sediment-filled incisions were concentrated in the northeastern part of the salt diapir.
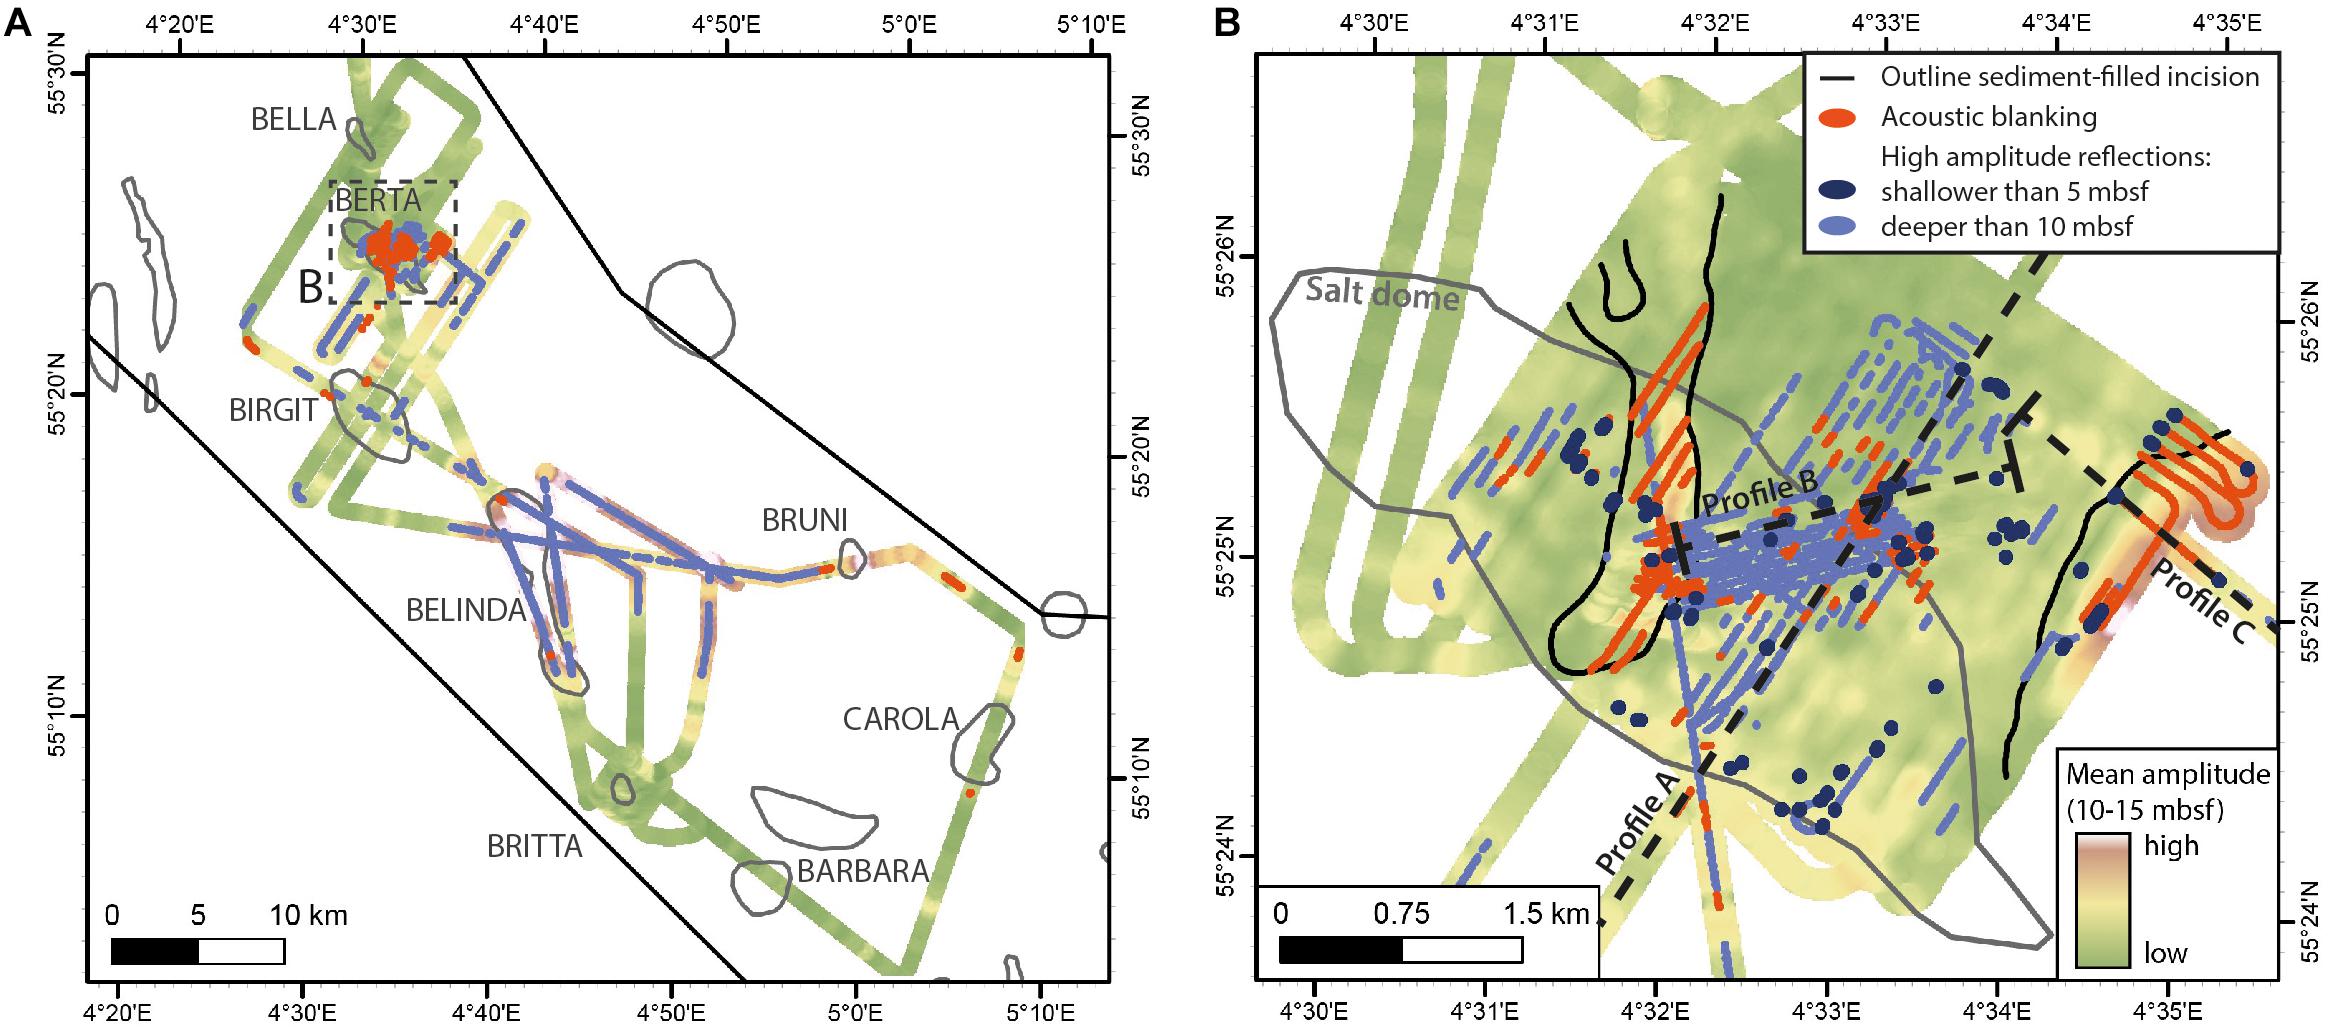
Figure 6. Subbottom analysis maps showing mean amplitude values between 10 and 15 mbsf throughout the entire dataset acquired, the locations of high-amplitude reflections (blue) and acoustic blanking (red). (A) Overview map (interpolated raster surface from track points using kriging, grid cell size is 50 m and maximum point distance is 500 m), (B) detailed map of the area mapped at salt diapir Berta (interpolated raster surface from track points using kriging, grid cell size is 10 m and maximum point distance is 100 m).
Electromagnetic Seabed Mapping
Free gas is considered to reduce the electric conductivity of the subsurface by replacing conductive pore-fluid with resistive gas and blocking of conduction paths through the sediment (Evans et al., 1999). EM methods are therefore used to derive volume estimates of free gas in the sediment (Cheesman et al., 1993; Schwalenberg et al., 2017). However, the sediment electric conductivity is controlled by other factors as well, such as pore-water salinity and temperature, lithology, clay content, grain-size, and sorting (e.g., Winsauer et al., 1952; Jackson et al., 1978).
The survey area at salt diapir Berta including borehole B11–4 (Figure 7A) is dominated by fine sands, with higher (11–20%) clay and silt content in the west, and medium to coarse sands in the northeastern section (Laurer et al., 2012). Apparent electric conductivities of the sediments are in the range of 0.711–0.953 S/m and follow the general sedimentary units with slightly lower values in fine sands in the western part and highest values in coarser sands in the eastern half of the survey area. This trend is interpreted to result from sediment sorting, where porosity is reduced with increasing content of fine particles. The large-scale sedimentary units are interrupted by several distinct electric conductivity lows. A prominent low is associated with acoustic blanking visible in subbottom data (see above) below the flare cluster (Figure 7A and profiles P2 and P3 in Figure 7B). The profile view (Figure 7B) depicts several focused conductivity minima, less than 50 m in diameter, which are smoothed by the gridding interpolation. In profile P3, three local minima are observed, where conductivity drops from background values of 0.82 to 0.74 S/m. Neglecting the saturation term in Eq. 1 we can derive a mean porosity for the study area of approx. 40% from the background conductivity outside the anomaly using Archie coefficients a = 1 and m = 1.6 for medium-fine to coarse sands (e.g., Evans et al., 1999), and a CTD-derived pore water conductivity of 3.7 S/m. According to Eq. 2, the drop in conductivity at the flare cluster relates to a free-gas saturation up to 5% of the pore-space. Similar patterns are observed in profile P2 although less developed and frequent. Another minimum has been mapped further south that appears to follow a SSE trending structure, which roughly mimics the boundary of the salt diapir. Profile P1 identifies a bimodal conductivity anomaly with a similar drop in amplitude, about 30 m to the east of the location of borehole B11–4. Video transects did not reveal changes (e.g., small-scale morphologies or sediment characteristics) of the seafloor sediments in this region. Due to the absence of acoustic blanking in the sediment echosounder profiles, we do not expect free gas to cause this conductivity low and assume over consolidated or contaminated sediments as a result of the drilling operation that took place in 2001. Note that we made the assumption that the sediment matrix (hence porosity) does not change for gas-charged sediments, thereby the gas saturation is a pure function of the conductivity difference and the empirical saturation exponent n, and hence independent from porosity, pore-water conductivity and grain-size. However, Szpak et al. (2012) and Garcia et al. (2014) even observed higher conductivities with highest volumes of gas within pockmarks which they explain by an increase in porosity and fining of the sediment in consequence of gas migration (and potentially by gas-driven microbial activity). Consequently, even higher free-gas concentrations are required to explain the drop in conductivity below the flare clusters. The impact of gas migration on the sediment fabric may be resolved combining electric conductivity mapping with, e.g., high-resolution sediment sampling, magnetic susceptibility mapping, or joint inversion with seismic data (e.g., Müller et al., 2011; Baasch et al., 2017; Attias et al., 2020), which is out of scope in this publication.
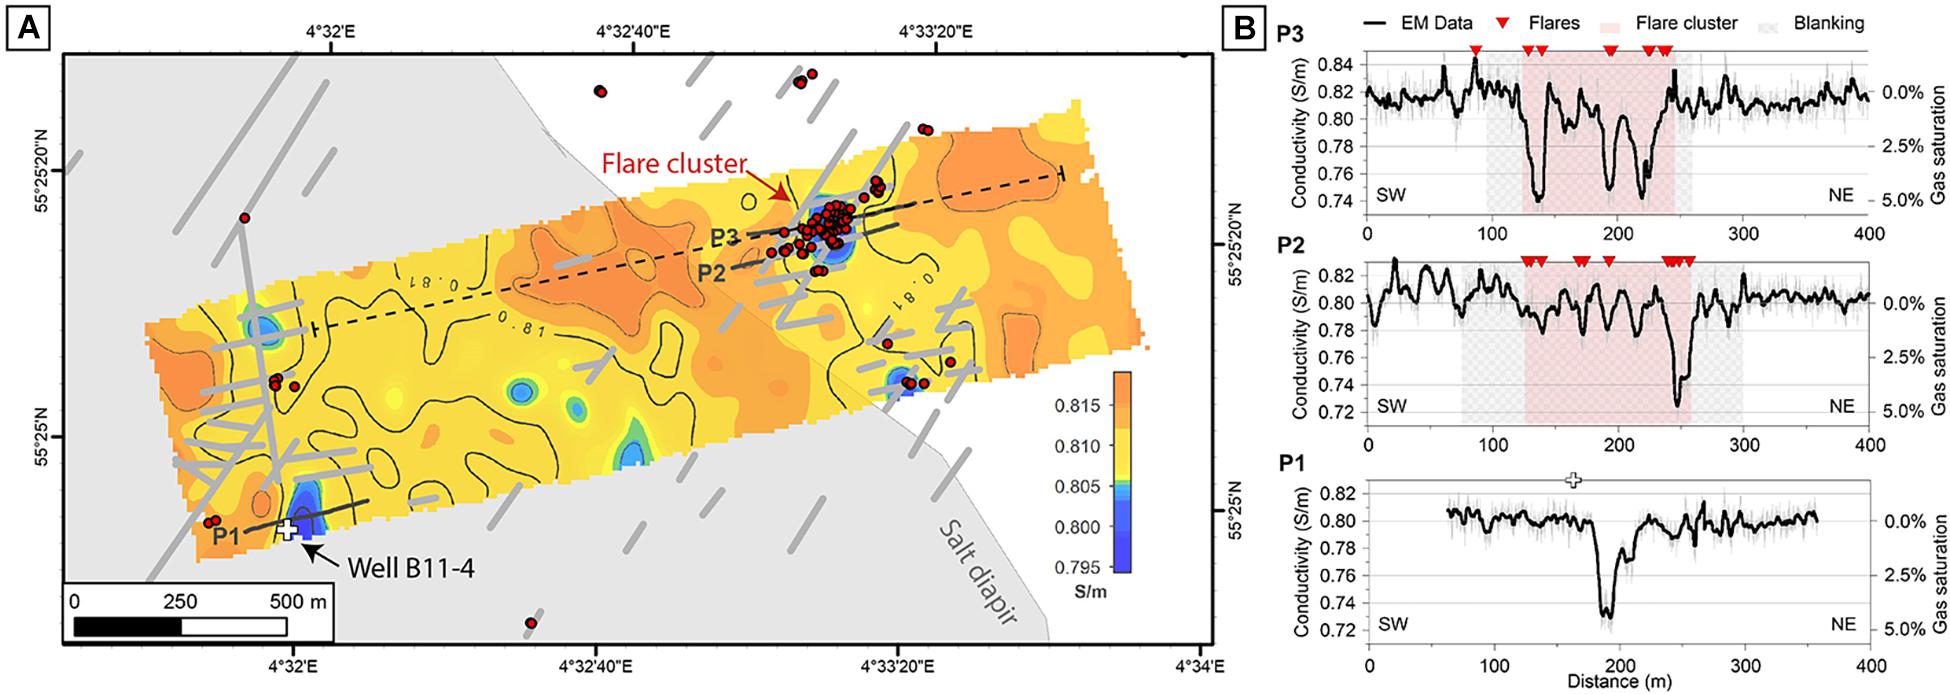
Figure 7. Sediment electric conductivity data of the benthic EM Profiler. (A) Gridded 10 kHz EM conductivity data with flare locations (red dots), acoustic blanking from subbottom data (gray lines), and transect of subbottom profile B (Figure 5B; dashed line). (B) Selected profiles crossing conductivity minima (indicated by black lines in a; gray: raw data, black: median filtered) with projected flare locations. Background colors indicate areas of high flare density and acoustic blanking. Gas saturation estimates are based on the conductivity contrast (Eq. 1). A white cross marks the location of borehole B11–4 in both figures.
Gas Distribution and the Shallow Gas System in the “Entenschnabel”-Area
Flare Distribution in the Study Area
The flares detected during R/V Heincke cruise HE537 were not randomly distributed in the study area. Most flares (149 out of 166 certain flares) were found in the vicinity of subsurface salt diapir structures (Figure 8 and Table 2). Highest abundance of flares were located at or around salt diapir Berta (104 flares) and Bella (19 flares). Five other salt diapirs revealed the presence of 1 to 13 flares. Salt diapirs Clara, Bruni and Bettina did not show any sign of gas bubble seepage. However, they were not mapped with a larger coverage, but passed during transits with partly increased vessel speeds of 5–10 knots, limiting the data quality. In order to account for the different coverage in the study area, the fraction of each defined area that has been mapped for the presence of flares was calculated and related to the number of flare findings (Table 2). The results show that the flare abundance at those salt diapirs with only 1 to 13 flares are similar or only very slightly elevated in relation to transits (areas between salt diapirs). However, even when accounting for the coverage, Bella and especially Berta exhibit elevated flare abundances. The relation of gas seepage to salt diapirs is also known from closely located seep areas: the Tommeliten seep area (Hovland and Judd, 1988) and the Dutch Dogger Bank seep area (Schroot et al., 2005). Seismic studies revealed that shallow gas accumulations seem to be concentrated above salt structures, which act as focal structures for migration (Schroot et al., 2005; Müller et al., 2018). Distances of flare findings related to the outlines of subsurface salt diapirs show a clear peak in flare abundance in a distance of 1 to 500 m (Figures 9A,B). Most flares are actually not located directly above salt diapirs, but just around them. This observation might be interpreted to result from a certain lateral migration of gas along weakening zones or gas migration that is focused along the flanks of the diapir, probably depending on the deformation pattern above the salt diapir. Buoyant gas migrates upward to the seafloor, either along diapir-induced faults or at locations where the gas columns are tall enough that the pressure of the accumulated gas is higher than the capillary entry pressure of the unconsolidated sediments above (Müller et al., 2018). Faults are common structures at the crest of salt diapirs. They form during the growth of salt structures as a result of the deformation of the overburden (Jackson and Hudec, 2017). Shallow gas reservoirs have been detected and imaged as bright spots in about 300 to 800 mbsf (Müller et al., 2018). Distances of flare positions detected during this study were also plotted in relation to bright spot detections revealing a clear relation, with the majority of flares located directly above a bright spot (Figures 9A,B). Only 21% of all detected flares and 13% of flares classified as certain were found without a bright spot in the subsurface, whereas the maximum distance of a certain flare to the closest bright spot was 1.8 km.
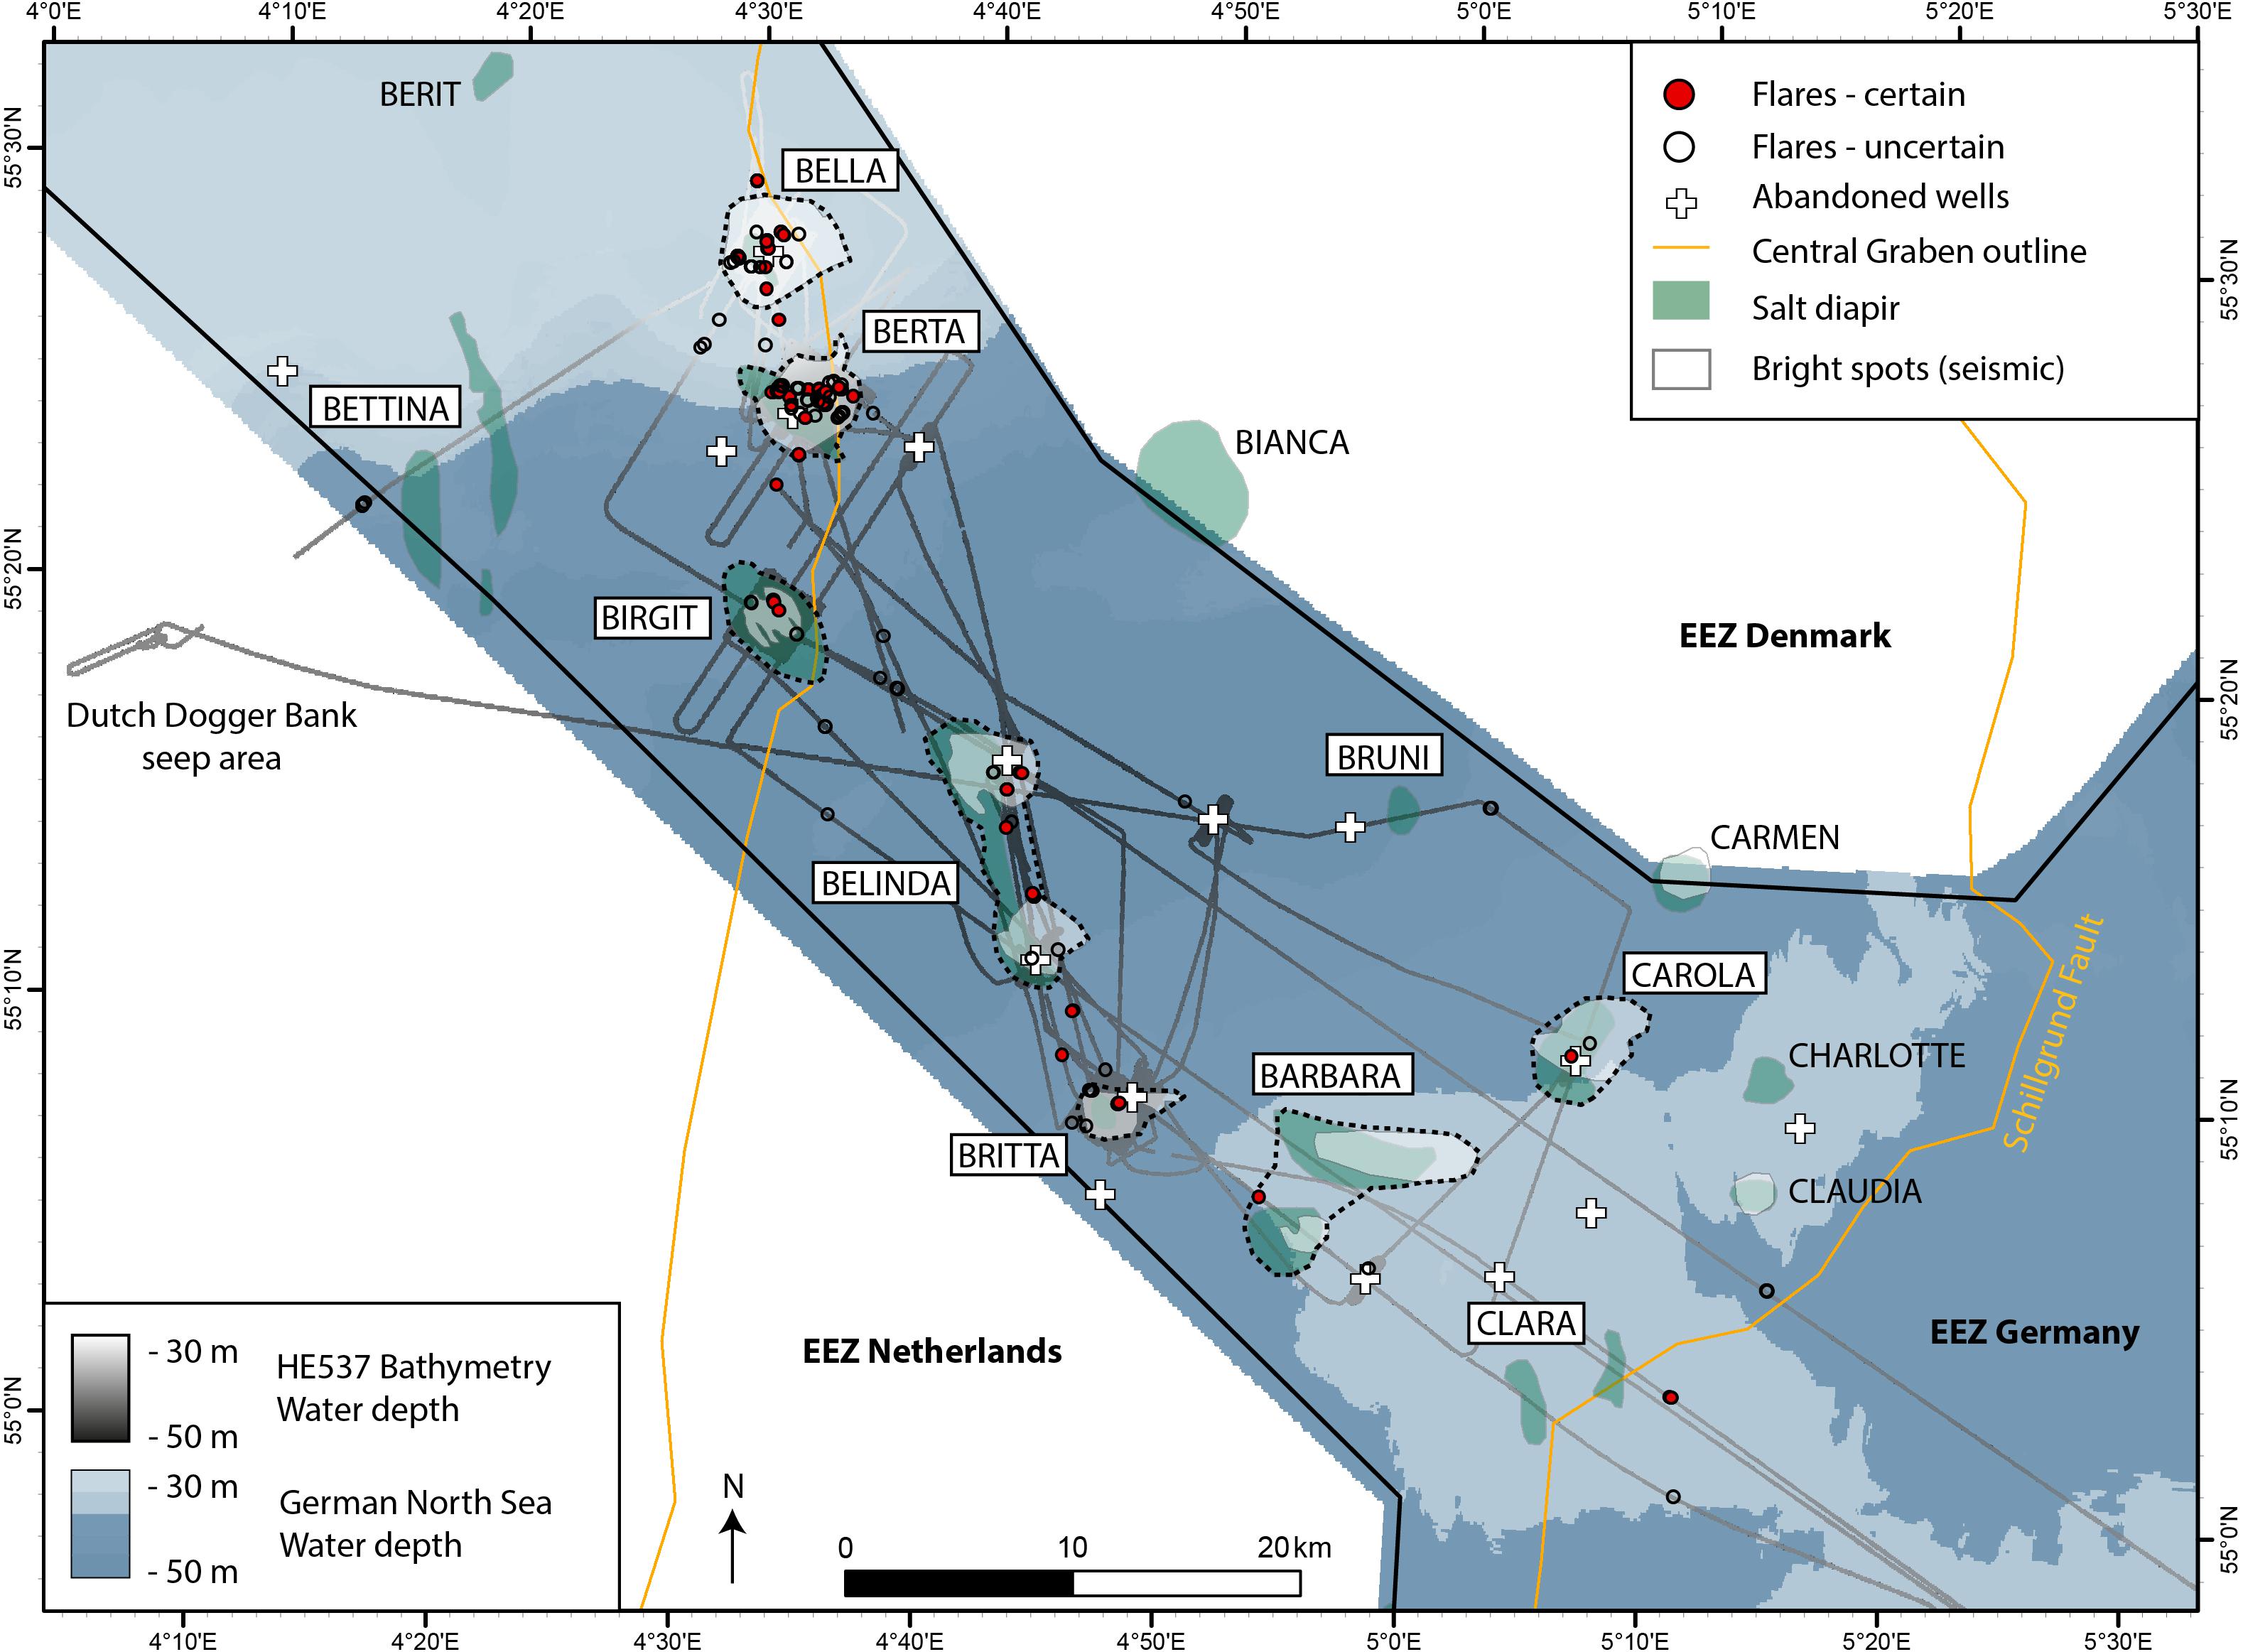
Figure 8. Map compiling flare detections in relation to subsurface salt diapirs and bright spots as well as abandoned wells. Almost 90% of all detected flares were found in the vicinity of subsurface salt diapir structures [depicted from Arfai et al. (2014)]. Note that salt diapir and bright spot areas are slightly transparent to illustrate their extents where overlapping each other. Bathymetry downloaded from www.gpdn.de.
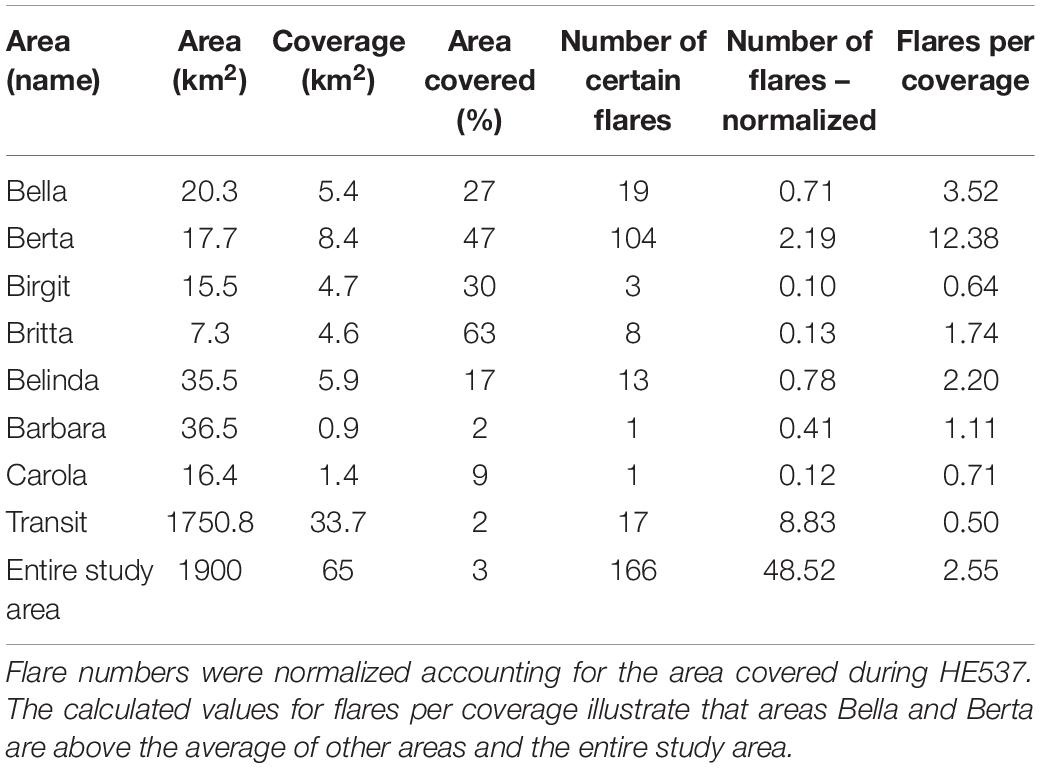
Table 2. Spatial analysis of flare findings at different areas including coverage for water column mapping.
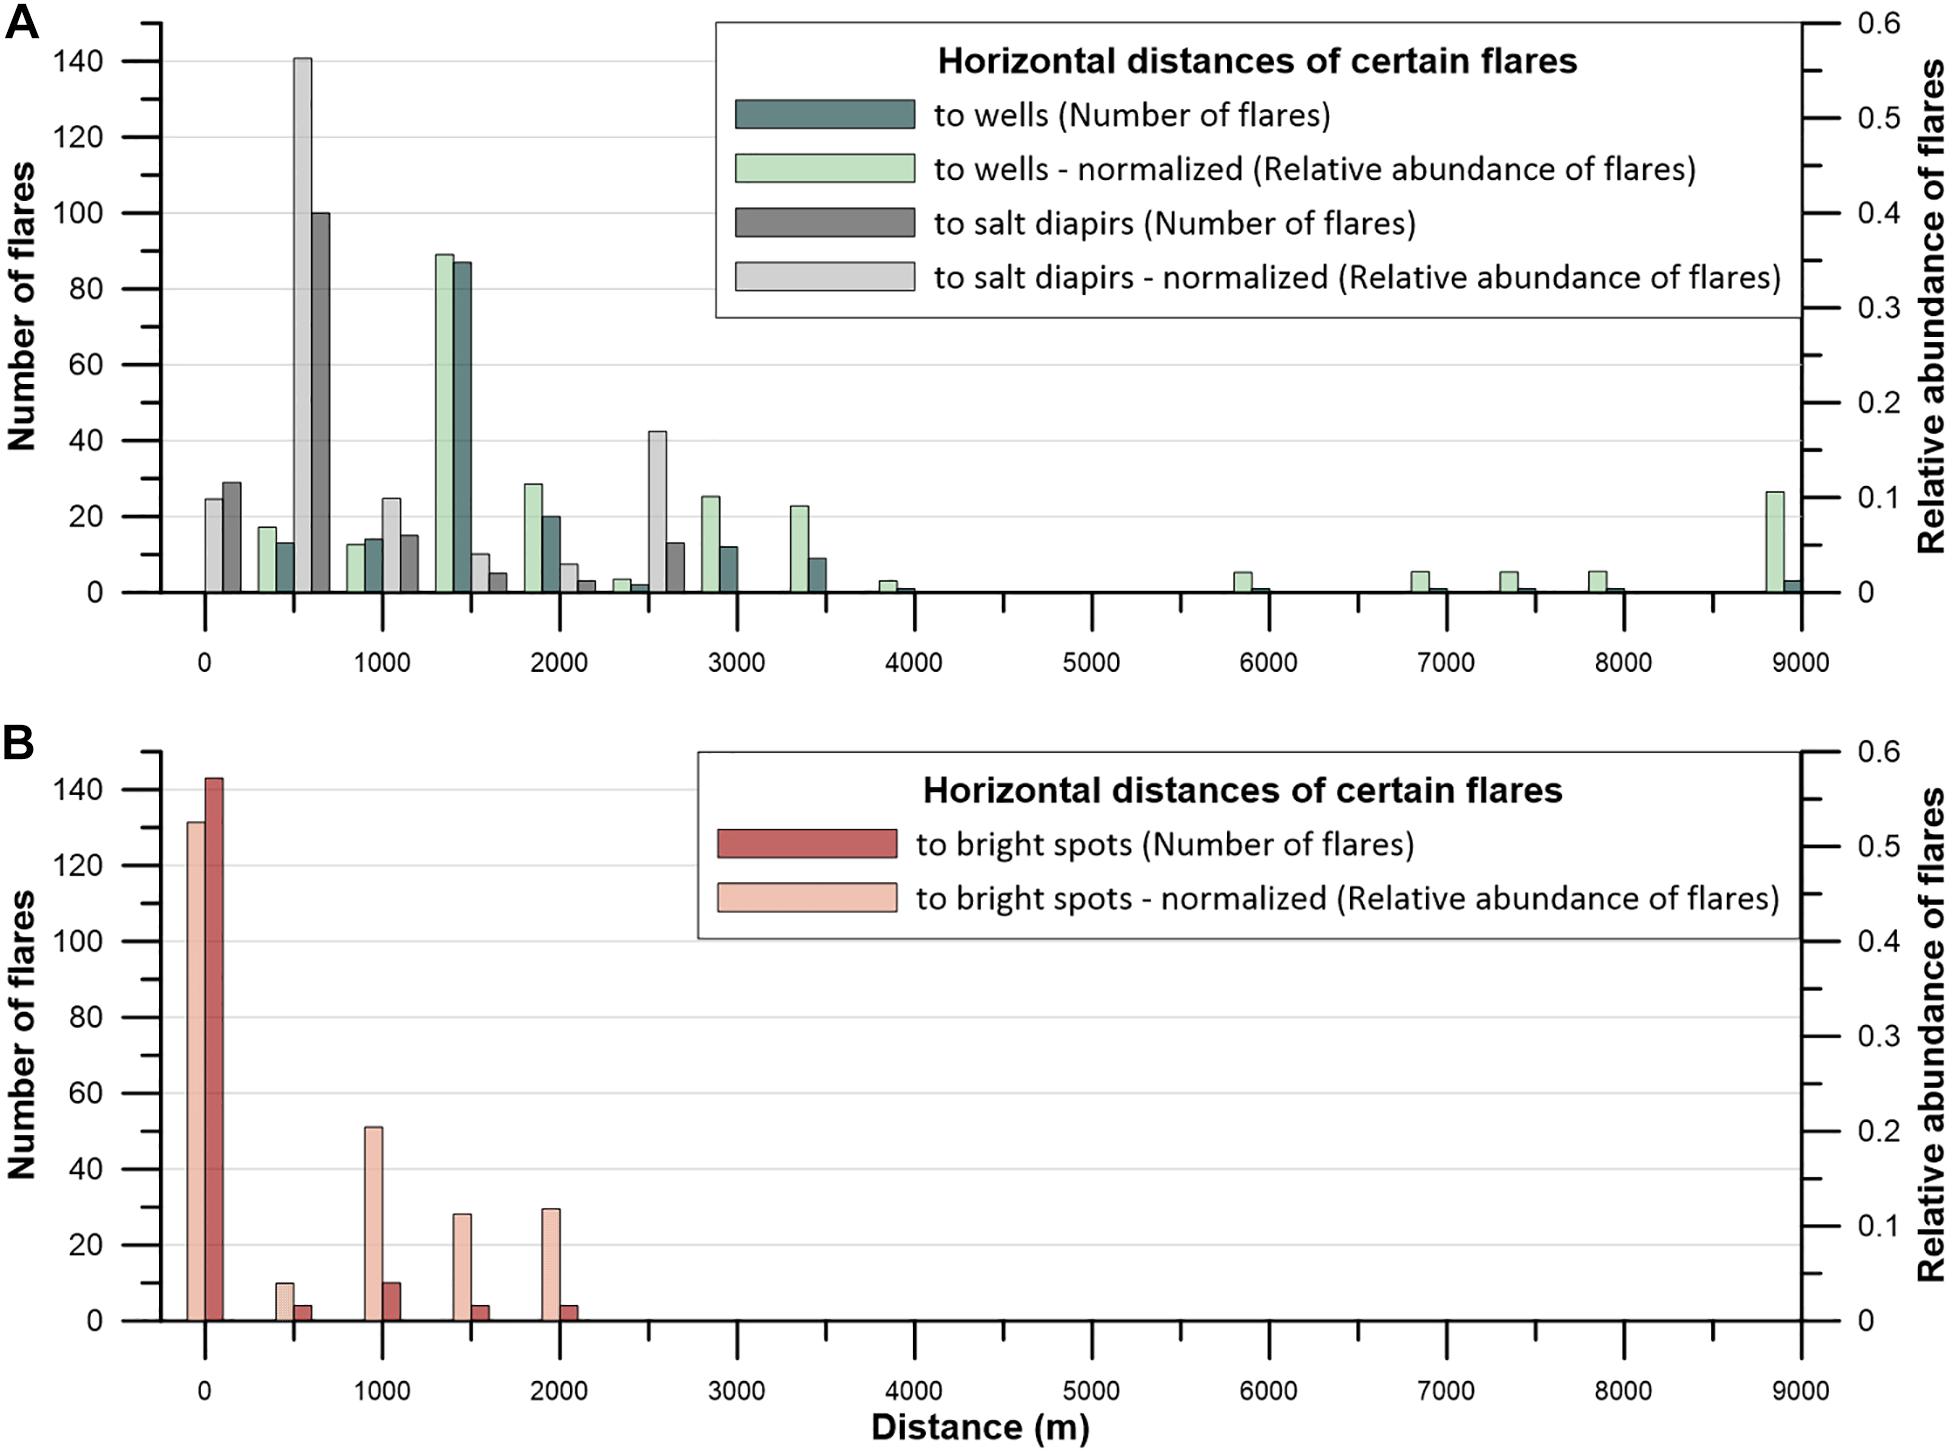
Figure 9. Histogram plots showing the distances of flares to (A) salt diapirs, abandoned wells sites, and (B) bright spots (seismically identified). Only flares classified as certain were included. The histograms were binned at 500 m intervals, with the first bin = 0 m (flares plot above a salt diapir or bright spot area), second bin >0–500 m, third bin >500–1,000 m, ect. Darker colored bars illustrate the total numbers of flares, whereas the lighter colored bars indicate the relative abundance of flares including a normalization by the ship track coverage. The normalization corrects for the non-uniform mapping strategy in the study area.
It was examined if faults play a role as migration pathways for fluids in the “Entenschnabel” area by passing the Schillgrund fault four times during transits. This fault is the southeastern boundary of the Central Graben to the Schillgrund High (Figure 8). Faults and fractures were reported to relate in different ways to fluid flow patterns: acting as seals [i.e., Ligtenberg and Connolly (2003)] or providing temporally efficient migration pathways, as observed, e.g., in the Sea of Marmara (Dupré et al., 2015), the Sea of Okhotsk (Jin et al., 2011), and the Black Sea (Riboulot et al., 2017). The Schillgrund Fault has been shown to provide a pathway for salt diapirism, as salt intrusions south of salt diapirs Clara and Claudia rise up along this fault zone (Arfai et al., 2014). Salt diapirism in the Central Graben area is connected to pre-Zechstein faults (Davison et al., 2000; Ten Veen et al., 2012; Duffy et al., 2013; Arfai et al., 2014). Our water column mapping detected flares during three of the four crossings of the Schillgrund Fault zone, however, only two of the four detected flares were classified as certain. Since the two flares were closely located to salt diapir Clara, a relation of the Schillgrund Fault as active fluid migration pathway might be indicated but not proven.
Potential Gas Release Related to Abandoned Wells
Near distance analysis of flares to abandoned well sites showed a widespread distribution between 125 and 9,500 m (Figure 9A). Most flares were found in a distance of 1 to 1.5 km to a well site. When normalizing the distribution with the coverage during cruise HE537, individual flare findings in larger distances get amplified and the resulting distribution did not suggest a positive correlation with distance to abandoned well sites. No flare has been detected while exactly crossing one of the ten well sites surveyed during R/V Heincke cruise HE537 in the German North Sea. The closest distance of a flare to a well site is 125 m and only 13 certain flares were found in a distance of less than 500 m. However, seismic data acquired at a blowout in a Norwegian North Sea hydrocarbon exploration well indicated that gas entered into a shallow tunnel valley complex and migrated horizontally (Landrø et al., 2019), illustrating the complexity of shallow gas migration. Hence, the lack of correlation of flares with abandoned wells does not exclude any relationship particularly in complex geological settings, but we consider this to argue against a direct or indirect well-origin of gas emissions.
Six of ten wells were located in areas underlain by a bright spot, thus could be potential sites for release of shallow gas from the seafloor. Water column mapping revealed that flares were found in the vicinity of these six wells, but no flares were observed close to the four wells that are not related to a bright spot. Water column methane concentrations measured from samples at seven wells only showed clearly elevated concentrations at well B11–4 (located at salt diapir Berta). However, methane concentrations measured 500 m east and west of the well had similar values, pointing to a rather widespread gas release system above the salt diapir that is not focused at the well site. Methane concentrations were slightly above background (9 nM) in the bottom waters in the areas of wells B11–1 and B18–4 (Table 1 and Figure 4), but leakage at the well sites appears unlikely due to the lack of flares and dissolved methane concentrations in the water column did not increase toward the well positions (see above).
Abandoned wells can act as migration pathways for gas through the sediment column as shown in several studies at onshore wells (Kang et al., 2014; Boothroyd et al., 2016; Townsend-Small et al., 2016; Schout et al., 2019). However, much less is known about their importance as leakage sites of methane release into the water column and subsequently into the atmosphere. In contrast to a study by Vielstädte et al. (2015), who focused on gas release at abandoned wells in the central North Sea, our study suggests that surveyed abandoned wells did not provide clear evidence for fluid release along the wells. The flares found near abandoned well sites in this study were rather interpreted to relate to a system of natural migration pathways. Vielstädte et al. (2017) discuss that one-third of all wells may potentially leak and bring the awareness of a probably unrecognized methane emission pathway contributing to the greenhouse gas inventory. Supporting this estimate, Böttner et al. (2020) could show that 28 out of 43 investigated wells in the United Kingdom sector of the North Sea release gas from the seafloor into the water column. Although our data including abandoned wells in the German EEZ do not replicate these findings, our observations were limited to ten wells and base on infrequent crossing of the wells decades after drilling. Hence, we cannot entirely exclude methane seepage from the well sites nor can we confirm it.
Specific Gas System at Salt Diapir Berta
Flare abundance analysis has shown that the main seepage area in the “Entenschnabel” is located close to salt diapir Berta. In total, 104 flares (out of 166 flares classified as certain) were detected in this area covering about 8.4 km2. The flare distribution shows that gas seepage is not homogeneous across the area, but is concentrated in specific areas. Most prominent is a flare cluster comprising more than half of all detected flares (66 flares) in a small area of about 300 × 100 m (Figure 10). All flares are located above or in the vicinity (with a maximum distance of 1.3 km) of the subsurface salt diapir. The top of the salt diapir is located in approximately 2,000 mbsf (Müller et al., 2018). Whereas 20 flares are located directly above the salt diapir, the flare cluster is about 150 to 450 m northeast of the diapir outline.
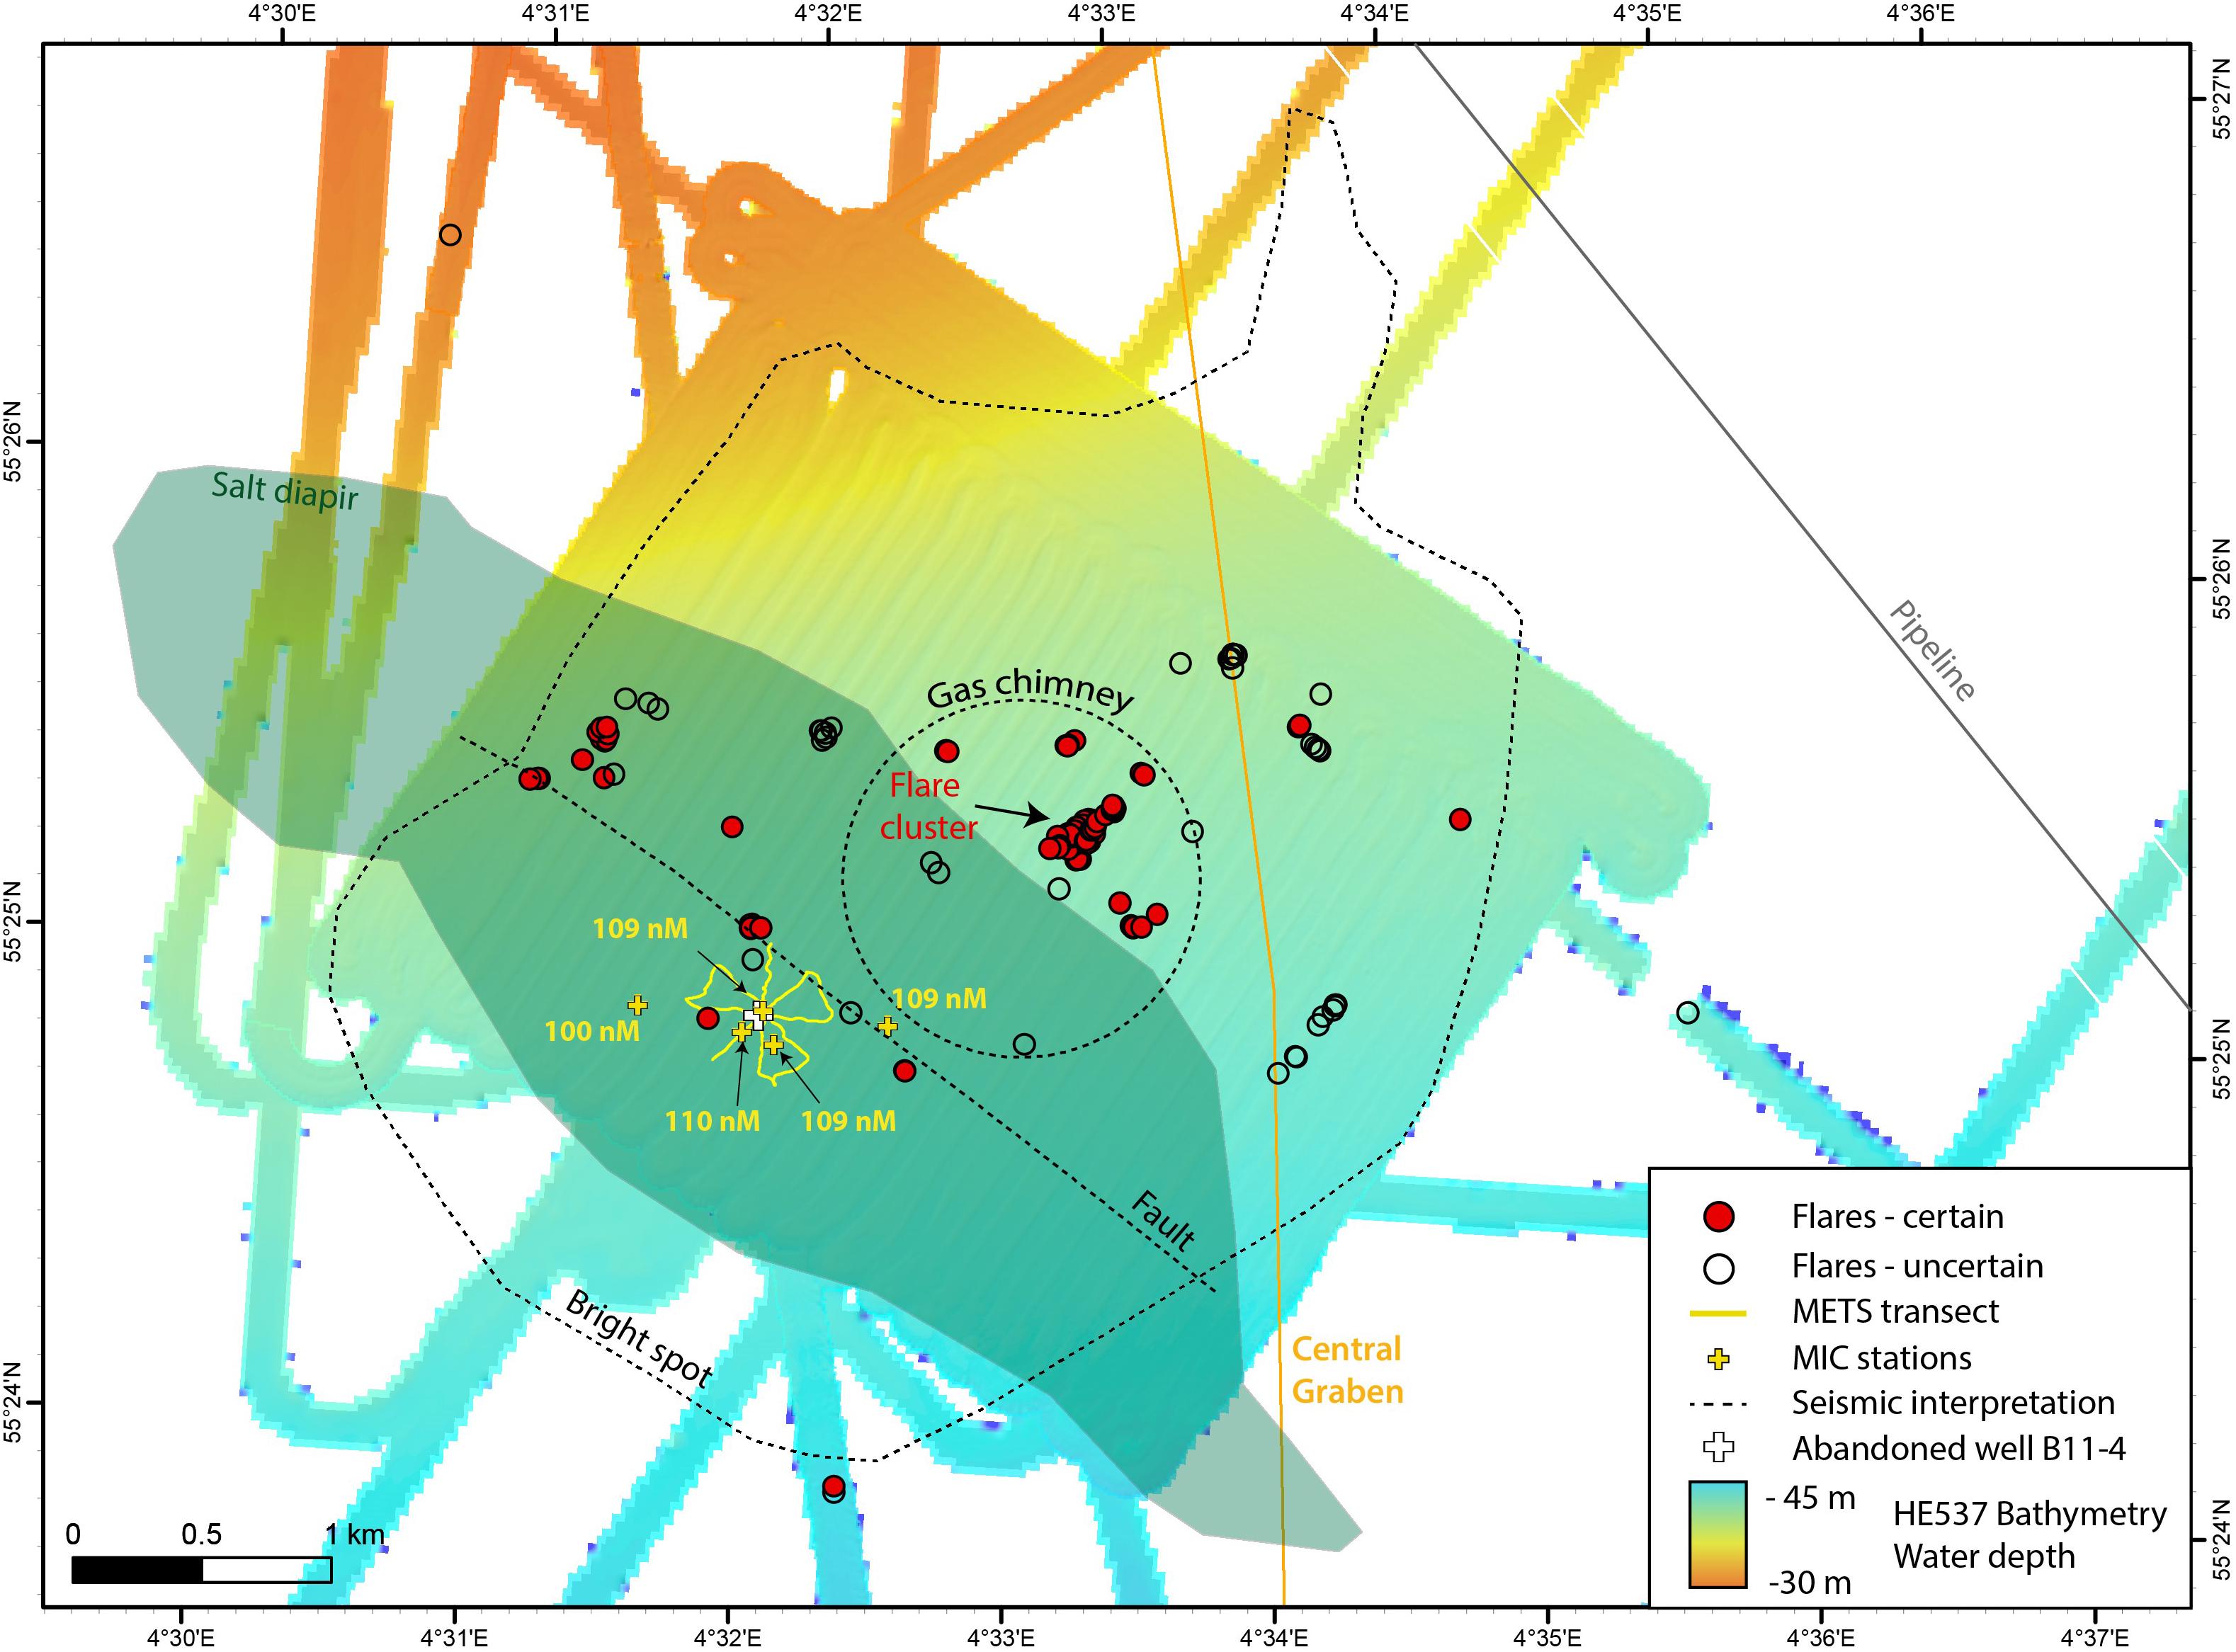
Figure 10. Map compiling data acquired at salt diapir Berta, where most of the flare findings were concentrated. Seismic interpretation (bright spot extent, subsurface fault indication, and gas chimney) was depicted from Figure 7 in Müller et al. (2018). Bottom water methane concentrations (yellow numbers) do not increase toward the well site.
Seismic interpretation including bright spots, faults and gas chimneys [depicted from Figure 7 in Müller et al. (2018)] reveal good correlation to flare locations mapped in this study (Figure 10). Except for one flare, all flares are located in the area underlain by seismically detected stacked bright spots. Eight flares align along the fault plane intersection with the seafloor. Müller et al. (2018) described that the horizons above the salt diapir intersect with a NW-SE striking normal fault. In addition, increased amplitudes at the flank of the fault and at the uppermost reflections above the fault indicated gas migration from the fault toward the seafloor. The flare cluster and 15 other flares (80% of all flares at Berta) plot in the area interpreted by Müller et al. (2018) as a gas chimney, which is indicated by discontinuous low amplitude reflections from the top of the salt diapir to the center of the bright spots. Hence, seepage found at Berta appears mainly focused through naturally evolved pathways related to salt diapirism.
Conclusion and Outlook
Our results show that methane seepage is not uncommon in the German “Entenschnabel” region in the North Sea. An extensive mapping campaign has proven the presence of at least 166 flares. As flares were not observed closer than 125 m to a well site, we conclude that the seepage is focused on naturally evolved pathways related to salt diapirism rather than drill holes and related mechanical sediment disruption. The majority of flares were located at salt diapir Berta, which is characterized by subsurface gas indications such as acoustic blanking, high amplitude reflectors, and sediment electric conductivity anomalies. Geochemical analyses of water samples suggest a shallow, microbial origin of the gas. However, additional deep subsurface imaging is needed to interpret the relation between salt diapirism and seepage into the water column. Our hydroacoustic flare observations imaged gas bubbles rising close to the sea surface and methane concentrations in surface waters were slightly elevated, both suggesting that gas bubbles might be a pathway to transport fractions of methane from the seafloor to the atmosphere.
Based on this study, we suggest to further characterize the nature of the active gas system in the German North Sea including the quantity of emitted methane, the gas source and address the following questions:
1. How much methane is released in form of gas bubbles and dissolved in pore water from the seafloor? Although our study did not systematically investigate the temporal variability, first results do indicate that flares are not stable over times of hours and days. Better understanding this variability and the controlling factors would be crucial to evaluate the gas quantities released.
2. Are the depressions detected at salt diapir Britta formed by fluid release? Are they related to the drilling activities at this site?
3 What is the origin of the methane emissions detected? If related to subsurface gas accumulations above salt diapirs, why is seepage mainly focused on salt diapir Berta?
4. Does methane released from the seafloor in the “Entenschnabel” reach the sea-air interface and contribute to the atmospheric inventory?
5. Is the Schillgrund Fault providing efficient fluid migration pathways
A better knowledge about shallow seep systems along continental shelf margins would be needed to evaluate the importance for gas exchange and fluid fluxes from the seafloor into the water column and eventually into the atmosphere.
Data Availability Statement
The datasets analyzed for this study can be found in the Open Access library PANGAEA (https://www.pangaea.de/). Data associated with the article: Ship’s track HE537: https://doi.pangaea.de/10.1594/PANGAEA.905303. Station list HE537: https://doi.pangaea.de/10.1594/PANGAEA.905303. Sediment echosounder data: https://doi.pangaea.de/10.1594/PANGAEA.910739. Multibeam echosounder data: https://doi.pangaea.de/10.1594/PANGAEA.912849. CTD hydrocast data: https://doi.pangaea.de/10.1594/PANGAEA.907544. METS data: https://doi.pangaea.de/10.1594/PANGAEA.915769, https://doi.pangaea.de/10.1594/PANGAEA.915770, https://doi.pangaea.de/10.1594/PANGAEA.915771, https://doi.pangaea.de/10.1594/PANGAEA.915772, https://doi.pangaea.de/10.1594/PANGAEA.915773, https://doi.pangaea.de/10.1594/PANGAEA.915774, https://doi.pangaea.de/10.1594/PANGAEA.915775, https://doi.pangaea.de/10.1594/PANGAEA.915776, https://doi.pangaea.de/10.1594/PANGAEA.915777, https://doi.pangaea.de/10.1594/PANGAEA.915778, and https://doi.pangaea.de/10.1594/PANGAEA.915779. Electromagnetic data: https://doi.pangaea.de/10.1594/PANGAEA.915602, https://doi.pangaea.de/10.1594/PANGAEA.915605, and https://doi.pangaea.de/10.1594/PANGAEA.915610.
Author Contributions
KS provided funding acquisition as well as cruise preparation and management for R/V Heincke cruise HE537. MR, SM, and UB carried out on board hydroacoustic data collection. MR took care about the hydroacoustic data processing, curation, and archiving. MB, SS, and KH acquired sediment and water sampling. MB and SS conducted gas analysis. KH collected, processed, and archived the hydrological data. KH, MB, HM, and MR interpreted the METS data. HM, CH, and KS conducted, processed, and interpreted electromagnetic measurements. MR, MB, HM, KH, SS, and KS contributed to the interpretation of the results. MR took the lead in writing the manuscript. All authors helped shape the research, analysis and manuscript.
Funding
This study was funded through the Cluster of Excellence “The Ocean Floor – Earth’s Uncharted Interface.” Open access publication fees are funded by the University of Bremen. Grant GPF 18-2_18 MESSAGER ship time R/V Heincke.
Conflict of Interest
The authors declare that the research was conducted in the absence of any commercial or financial relationships that could be construed as a potential conflict of interest.
The reviewer, KM, declared a shared affiliation, with one author, KH, to the handling editor at time of review.
The reviewer, MS, declared a past co-authorship with one of the authors, MR, to the handling editor.
Acknowledgments
We greatly appreciate the shipboard support from the masters and crew of R/V Heincke cruise HE537 and the Leitstelle Deutsche Forschungsschiffe as well as the Gutachterpanel Forschungsschiffe for support to realize the cruise. We kindly acknowledge help onboard by Christian Seeger, Dennis Hagedorn, and Konstantin Reeck, and laboratory support by Daniela Graskamp and Dietmar Laszinski. We would also like to thank four reviewers for their constructive suggestions that helped to improve and strengthen our manuscript.
Supplementary Material
The Supplementary Material for this article can be found online at: https://www.frontiersin.org/articles/10.3389/feart.2021.556329/full#supplementary-material
Supplementary Figure 1 | Survey and sampling strategy conducted during RV HEINCKE cruise HE537 exemplified at well B15–2. The area at and around the well was covered with eleven parallel transect lines and a line spacing of about 50 m for hydroacoustic mapping including water column recording. A MIC station for bottom water sampling was taken close to the well site, whereas CTD stations have been conducted around the well site with distances between 10 and 30 m. The METS sensor was towed close to the seafloor in a star-like pattern crossing the well site four times.
Supplementary Figure 2 | Map of the study area illustrating measured methane concentrations above the pycnocline. Methane concentrations increase from the SE to the NW.
Supplementary Table 1 | List of all flare detections during R/V Heincke cruise HE537 in the “Entenschnabel” area. Date, time, geographical position, and seafloor depth of findings are provided as well as a classification (in certain or uncertain) and the near distance calculation to salt diapirs, seismic bright spots, and abandoned wells.
Supplementary Table 2 | List of CTD and MIC stations taken during R/V Heincke cruise HE537, including geographic position, area name and measured methane and ethane concentrations in the water samples taken. bdl: below detection limit.
References
Archie, G. E. (1942). The electrical resistivity log as an aid in determining some reservoir characteristics. J. Pet. Technol. 146, 54–62. doi: 10.2118/942054-g
Arfai, J., Jahne, F., Lutz, R., Franke, D., Gaedicke, C., and Kley, J. (2014). Late palaeozoic to early cenozoic geological evolution of the northwestern German North Sea (Entenschnabel): new results and insights. Netherlands J. Geosci. 93, 147–174. doi: 10.1017/njg.2014.22
Attias, E., Amalokwu, K., Watts, M., Falcon-Suarez, I. H., North, L., Hu, G. W., et al. (2020). Gas hydrate quantification at a pockmark offshore Norway from joint effective medium modelling of resistivity and seismic velocity. Mar. Pet. Geol. 113:104151. doi: 10.1016/j.marpetgeo.2019.104151
Baasch, B., Müller, H., Dobeneck, T. V., and Oberl, F. K. J. (2017). Determination of grain-size characteristics from electromagnetic seabed mapping data: a NW Iberian shelf study. Cont. Shelf Res. 140, 75–83. doi: 10.1016/j.csr.2017.04.005
Boles, J. R., Clark, J. F., Leifer, I., and Washburn, L. (2001). Temporal variation in natural methane seep rate due to tides, Coal Oil Point area, California. J. Geophys. Res. 106, 27077–27086. doi: 10.1029/2000jc000774
Boothroyd, I. M., Almond, S., Qassim, S. M., Worrall, F., and Davies, R. J. (2016). Fugitive emissions of methane from abandoned, decommissioned oil and gas wells. Sci. Total Environ. 547, 461–469. doi: 10.1016/j.scitotenv.2015.12.096
Böttner, C., Berndt, C., Reinardy, B. T. I., Geersen, J., Karstens, J., Bull, J. M., et al. (2019). Pockmarks in the witch ground basin, central North Sea. Geochem. Geophys. Geosyst. 20, 1698–1719. doi: 10.1029/2018gc008068
Böttner, C., Haeckel, M., Schmidt, M., Berndt, C., Vielstädte, L., Kutsch, J. A., et al. (2020). Greenhouse gas emissions from marine decommissioned hydrocarbon wells: leakage detection, monitoring and mitigation strategies. Int. J. Greenh. Gas Control 100:103119. doi: 10.1016/j.ijggc.2020.103119
Caress, D. W., and Chayes, D. N. (2017). MB-System: Mapping the Seafloor. Available online at: https://www.mbari.org/products/research-software/mb-system (accessed July 1, 2019).
Cheesman, S. J., Law, L. K., and Louis, B. S. (1993). A porosity mapping survey in hecate strait using a seafloor electro-magnetic profiling system. Mar. Geol. 110, 245–256. doi: 10.1016/0025-3227(93)90087-c
Davison, I., Alsop, I., Birch, P., Elders, C., Evans, N., Nicholson, H., et al. (2000). Geometry and late-stage structural evolution of central Graben salt diapirs, North Sea. Mar. Pet. Geol. 17, 499–522. doi: 10.1016/s0264-8172(99)00068-9
Dick, S., Kleine, E., and Müller-Navarra, S. H. (2001). “The operational circulation model of BSH (BSH cmod). model description and validation,” in Berichte des Bundesamtes für Seeschifffahrt und Hydrographie. 29/2001, 48 (Hamburg, Germany: Bundesamtes für Seeschifffahrt und Hydrographie).
Duffy, O. B., Gawthorpe, R. L., Docherty, M., and Brocklehurst, S. H. (2013). Mobile evaporite controls on the structural style and evolution of rift basins: danish central Graben, North Sea. Basin Res. 25, 310–330. doi: 10.1111/bre.12000
Dupré, S., Scalabrin, C., Grall, C., Augustin, J.-M., Henry, P., Şengör, A. M. C., et al. (2015). Tectonic and sedimentary controls on widespread gas emissions in the Sea of Marmara: results from systematic, shipborne multibeam echo sounder water column imaging. J. Geophys. Res. Solid Earth Res. 120, 2891–2912. doi: 10.1002/2014jb011617
Evans, R. L., Law, L. K., St. Louis, B., Cheesman, S., and Sananikone, K. (1999). The shallow porosity structure of the Eel shelf, northern California: results of a towed electromagnetic survey. Mar. Geol. 154, 211–226. doi: 10.1016/s0025-3227(98)00114-5
Fechner-Levy, E. J., and Hemond, H. F. (1996). Trapped methane volume and potential effects on methane ebullition in a northern peatland. Limnol. Oceanogr. 41, 1375–1383. doi: 10.4319/lo.1996.41.7.1375
Flanders Marine and Institute (2019). Maritime Boundaries Geodatabase: Maritime Boundaries and Exclusive Economic Zones (200NM), version 11.
Garcia, X., Monteys, X., Evans, R. L., and Szpak, M. (2014). Constraints on a shallow offshore gas environment determined by a multidisciplinary geophysical approach: the Malin Sea, NW Ireland. Geochem. Geophys. Geosyst. 15, 867–885. doi: 10.1002/2013gc005108
Hovland, M. (1993). Submarine gas seepage in the North Sea and adjacent areas. Pet. Geol. Conf. Proc. 4, 1333–1338. doi: 10.1144/0041333
Hovland, M. (2007). Discovery of prolific natural methane seeps at Gullfaks, northern North Sea. Geo Mar. Lett. 27, 197–201. doi: 10.1007/s00367-007-0070-6
Hovland, M., Svensen, H., Forsberg, C. F., Johansen, H., Fichler, C., Fosså, J. H., et al. (2005). Complex pockmarks with carbonate-ridges off mid-Norway: products of sediment degassing. Mar. Geol. 218, 191–206. doi: 10.1016/j.margeo.2005.04.005
Jackson, M. P. A., and Hudec, M. R. (2017). Salt Tectonics: Principles and Practice. Cambridge: Cambridge University Press.
Jackson, P. D., Taylor Smith, D., and Stanford, P. N. (1978). Resistivity-porosity-particle shape relationships for marine sands. Geophysics 43, 1250–1268. doi: 10.1190/1.1440891
Jin, Y. K., Kim, Y., Baranov, B., Shoji, H., and Obzhirov, A. (2011). Distribution and expression of gas seeps in a gas hydrate province of the northeastern Sakhalin continental slope, sea of Okhotsk. Mar. Pet. Geol. 28, 1844–1855. doi: 10.1016/j.marpetgeo.2011.03.007
Judd, A. (2015). The significance of the 22/4b blow-out site methane emissions in the context of the North Sea. Mar. Pet. Geol. 68, 836–847. doi: 10.1016/j.marpetgeo.2015.07.031
Judd, A., and Hovland, M. (2007). Seabed Fluid Flow. The Impact on Geology, Biology and the Marine Environment. Cambridge: Cambridge University Press, 475.
Judd, A., Long, D., and Sankey, M. (1994). Pockmark formation and activity, UK block 15/25, North Sea. Bull. Geol. Soc. Denmark 41, 34–49.
Kang, M., Kanno, C. M., Reid, M. C., Zhang, X., Mauzerall, D. L., Celia, M. A., et al. (2014). Direct measurements of methane emissions from abandoned oil and gas wells in Pennsylvania. Proc. Natl. Acad. Sci. U. S. A. 111, 18173–18177. doi: 10.1073/pnas.1408315111
Kannberg, P. K., Tréhu, A. M., Pierce, S. D., Paull, C. K., and Caress, D. W. (2013). Temporal variation of methane flares in the ocean above Hydrate Ridge, Oregon. Earth Planet. Sci. Lett. 368, 33–42. doi: 10.1016/j.epsl.2013.02.030
Krämer, K., Holler, P., Herbst, G., Bratek, A., Ahmerkamp, S., Neumann, A., et al. (2017). Abrupt emergence of a large pockmark field in the German bight, southeastern North Sea. Sci. Rep. 7:5150.
Landrø, M., Wehner, D., Vedvik, N., Ringrose, P., Løhre, N. L., and Berteussen, K. (2019). Gas flow through shallow sediments—a case study using passive and active seismic field data. Int. J. Greenh. Gas Control 87, 121–133. doi: 10.1016/j.ijggc.2019.05.001
Laurer, W. U., Naumann, M., and Zeiler, M. (2012). Erstellung der Karte zur Sedimentverteilung auf dem Meeresboden in der deutschen Nordsee nach der Klassifikation von Figge (1981). Geopotenzial Deutsche Nordsee, Hannover/Hamburg, 19 S. Available online at: https://www.gpdn.de/gpdn/wilma.aspx?pgId=337&WilmaLogonActionBehavior=Default (accessed April 14, 2020).
Leifer, I. (2015). Seabed bubble flux estimation by calibrated video survey for a large blowout seep in the North Sea. Mar. Pet. Geol. 68, 743–752. doi: 10.1016/j.marpetgeo.2015.08.032
Leifer, I., and Boles, J. (2005). Turbine tent measurements of marine hydrocarbon seeps on subhourly timescales. J. Geophys. Res. Oceans 110, 1–12. doi: 10.1007/978-3-030-34827-4_1
Leifer, I., and Judd, A. (2015). The UK22/4b blowout 20 years on: investigations of continuing methane emissions from sub-seabed to the atmosphere in a North Sea context. Mar. Pet. Geol. 68, 706–717. doi: 10.1016/j.marpetgeo.2015.11.012
Leifer, I., and Patro, R. K. (2002). The bubble mechanism for methane transport from the shallow sea bed to the surface: a review and sensitivity study. Cont. Shelf Res. 22, 2409–2428. doi: 10.1016/s0278-4343(02)00065-1
Ligtenberg, H., and Connolly, D. (2003). Chimney detection and interpretation, revealing sealing quality of faults, geohazards, charge of and leakage from reservoirs. J. Geochem. Explor. 78–79, 385–387. doi: 10.1016/s0375-6742(03)00095-5
Littke, R., Bayer, U., Gajewski, D., and Nelskamp, S. (2008). Dynamics of Complex Intracontinental Basins: The Central European Basin System. Berlin: Springer.
Lutz, R., Kalka, S., Gaedicke, C., Reinhardt, L., and Winsemann, J. (2009). Pleistocene tunnel valleys in the German North Sea: spatial distribution and morphology. Zeitschrift der Deutschen Gesellschaft für Geowissenschaften 160, 225–235. doi: 10.1127/1860-1804/2009/0160-0225
Mau, S., Gentz, T., Körber, J. H., Torres, M. E., Römer, M., Sahling, H., et al. (2015). Seasonal methane accumulation and release from a gas emission site in the central North Sea. Biogeosciences 12, 5261–5276. doi: 10.5194/bg-12-5261-2015
Müller, H., Von Dobeneck, T., Hilgenfeldt, C., SanFilipo, B., Rey, D., and Rubio, B. (2012). Mapping the magnetic susceptibility and electric conductivity of marine surficial sediments by benthic EM profiling. Geophysics 77, 1JF–Z19.
Müller, H., von Dobeneck, T., Nehmiz, W., and Hamer, K. (2011). Near-surface electromagnetic, rock magnetic, and geochemical fingerprinting of submarine freshwater seepage at Eckernförde Bay (SW Baltic Sea). Geo Mar. Lett. 31, 123–140. doi: 10.1007/s00367-010-0220-0
Müller, S., Reinhardt, L., Franke, D., Gaedicke, C., and Winsemann, J. (2018). Shallow gas accumulations in the German North Sea. Mar. Pet. Geol. 91, 139–151. doi: 10.1016/j.marpetgeo.2017.12.016
Niemann, H., Elvert, M., Hovland, M., Orcutt, B., Judd, A., Suck, I., et al. (2005). Methane emission and consumption at a North Sea gas seep (Tommeliten area). Biogeosciences 2, 335–351. doi: 10.5194/bg-2-335-2005
Pletsch, T., Appel, J., Botor, D., Clayton, C. J., Duin, E. J. T., Faber, E., et al. (2010). Petroleum Geological Atlas of the Southern Permian Basin Area. Houten: EAGE Publications.
Rehder, G., Keir, R. S., Suess, E., and Pohlmann, T. (1998). The multiple sources and patterns of methane in North Sea waters. Aquat. Geochem. 4, 403–427.
Rehder, G., Keir, R. S., Suess, E., and Rhein, M. (1999). Methane in the northern Atlantic controlled by microbial oxidation and atmospheric history. Geophys. Res. Lett. 26, 587–590. doi: 10.1029/1999gl900049
Riboulot, V., Cattaneo, A., Scalabrin, C., Gaillot, A., Jouet, G., Ballas, G., et al. (2017). Control of the geomorphology and gas hydrate extent on widespread gas emissions offshore Romania. Bull. Soc. Geol. Fr. 188, 12–26.
Römer, M., Riedel, M., Scherwath, M., Heesemann, M., and Spence, G. D. (2016). Tidally controlled gas bubble emissions: a comprehensive study using long-termmonitoring data from the NEPTUNE cabled observatory offshore Vancouver Island. Geochem. Geophys. Geosyst. 17, 1312–1338.
Römer, M., Wenau, S., Bohrmann, G., Mau, S., Veloso, M., Greinert, J., et al. (2017). Assessing marine gas emission activity and contribution to the atmospheric methane inventory: a multidisciplinary approach from the Dutch Dogger Bank seep area (North Sea). Geochem. Geophys. Geosyst. 18, 2617–2633. doi: 10.1002/2017gc006995
Scandella, B. P., Varadharajan, C., Hemond, H. F., Ruppel, C., and Juanes, R. (2011). A conduit dilation model of methane venting from lake sediments. Geophys. Res. Lett. 38, 1–6.
Schloemer, S., Oest, J., Illing, C. J., Elbracht, J., and Blumenberg, M. (2018). Spatial distribution and temporal variation of methane, ethane and propane background levels in shallow aquifers – a case study from Lower Saxony (Germany). J. Hydrol. Reg. Stud. 19, 57–79. doi: 10.1016/j.ejrh.2018.07.002
Schmale, O., Schneider, von Deimling, J., Gülzow, W., Nausch, G., Waniek, J. J., et al. (2010). Distribution of methane in the water column of the Baltic Sea. Geophys. Res. Lett. 37:L12604.
Schneider Von, Deimling, J., Brockhoff, J., and Greinert, J. (2007). Flare imaging with multibeam systems: data processing for bubble detection at seeps. Geochem. Geophys. Geosyst. 8, 1–7. doi: 10.1109/joe.2021.3056910
Schneider Von, Deimling, J., Rehder, G., Greinert, J., Mcginnnis, D. F., Boetius, A., et al. (2011). Quantification of seep-related methane gas emissions at Tommeliten. North Sea. Cont. Shelf Res. 31, 867–878. doi: 10.1016/j.csr.2011.02.012
Schout, G., Griffioen, J., Hassanizadeh, S. M., Cardon, de Lichtbuer, G., and Hartog, N. (2019). Occurrence and fate of methane leakage from cut and buried abandoned gas wells in the Netherlands. Sci. Total Environ. 659, 773–782. doi: 10.1016/j.scitotenv.2018.12.339
Schroot, B. M., Klaver, G. T., and Schüttenhelm, R. T. E. (2005). Surface and subsurface expressions of gas seepage to the seabed - examples from the Southern North Sea. Mar. Pet. Geol. 22, 499–515. doi: 10.1016/j.marpetgeo.2004.08.007
Schroot, B. M., and Schüttenhelm, R. T. E. (2003). Expressions of shallow gas in the Netherlands North Sea. Netherlands J. Geosci. 82, 91–105. doi: 10.1017/s0016774600022812
Schwalenberg, K., Gehrmann, R. A. S., Bialas, J., and Rippe, D. (2020). Analysis of marine controlled source electromagnetic data for the assessment of gas hydrates in the Danube deep-sea fan, Black Sea. Mar. Pet. Geol. 120. doi: 10.1016/j.marpetgeo.2020.104650
Schwalenberg, K., Rippe, D., Koch, S., and Scholl, C. (2017). Marine-controlled source electromagnetic study of methane seeps and gas hydrates at opouawe bank, hikurangi margin, New Zealand. J. Geophys. Res. Solid Earth 122, 3334–3350. doi: 10.1002/2016jb013702
Sommer, S., Schmidt, M., and Linke, P. (2015). Continuous inline mapping of a dissolved methane plume at a blowout site in the central North Sea UK using a membrane inlet mass spectrometer – water column stratification impedes immediate methane release into the atmosphere. Mar. Pet. Geol. 68, 766–775. doi: 10.1016/j.marpetgeo.2015.08.020
Szpak, M. T., Monteys, X., O’Reilly, S., Simpson, A. J., Garcia, X., Evans, R. L., et al. (2012). Geophysical and geochemical survey of a large marine pockmark on the Malin Shelf, Ireland. Geochem. Geophys. Geosyst. 13:Q01011.
Ten Veen, J. H., Van Gessel, S. F., and Den Dulk, M. (2012). Thin-and thick-skinned salt tectonics in the Netherlands; a quantitative approach. Netherlands J. Geosci. 91, 447–464. doi: 10.1017/s0016774600000330
Thatje, S., Gerdes, D., and Rachor, E. (1999). A seafloor crater in the German bight and its effects on the benthos. Helgol. Mar. Res. 53, 36–44. doi: 10.1007/pl00012136
Torres, M. E., Mcmanus, J., Hammond, D. E., Angelis, M. A., De, Heeschen, K. U., et al. (2002). Fluid and chemical fuxes in and out of sediments hosting methane hydrate deposits on Hydrate Ridge, or, i?: hydrological provinces. Earth Planet. Sci. Lett. 201, 525–540. doi: 10.1016/s0012-821x(02)00733-1
Townsend-Small, A., Ferrara, T. W., Lyon, D. R., Fries, A. E., and Lamb, B. K. (2016). Emissions of coalbed and natural gas methane from abandoned oil and gas wells in the United States. Geophys. Res. Lett. 43, 2283–2290. doi: 10.1002/2015gl067623
Tryon, M. D., Brown, K. M., Torres, M. E., Tréhu, A. M., McManus, J., and Collier, R. W. (1999). Measurements of transience and downward fluid flow near episodic methane gas vents, hydrate ridge, cascadia. Geology 27, 1075–1078. doi: 10.1130/0091-7613(1999)027<1075:motadf>2.3.co;2
Varadharajan, C., and Hemond, H. F. (2012). Time-series analysis of high-resolution ebullition fluxes from a stratified, freshwater lake. J. Geophys. Res. Biogeosci. 117, 1–15. doi: 10.15504/fmj.2016.18
Vielstädte, L., Haeckel, M., Karstens, J., Linke, P., Schmidt, M., Steinle, L., et al. (2017). Shallow gas migration along hydrocarbon wells-an unconsidered, anthropogenic source of biogenic methane in the North Sea. Environ. Sci. Technol. 51, 10262–10268. doi: 10.1021/acs.est.7b02732
Vielstädte, L., Karstens, J., Haeckel, M., Schmidt, M., Linke, P., Reimann, S., et al. (2015). Quantification of methane emissions at abandoned gas wells in the central North Sea. Mar. Pet. Geol. 68, 848–860. doi: 10.1016/j.marpetgeo.2015.07.030
White, J. E. (1975). Computed seismic speeds and attenuation in rocks with partial gas saturation. Geophysics 40, 224–232. doi: 10.1190/1.1440520
Wiesenberg, D. A., and Guinasso, N. L. (1979). Equilibrium solubilities of methane, carbonmonoxide and hydrogen in water and seawater. J. Chem. Eng. Data 24, 356–360. doi: 10.1021/je60083a006
Winsauer, W. O., Shearin, H. M., Masson, P. H., and Williams, M. (1952). Resistivity of brine saturated sands in relation to pore geometry. Am. Assoc. Pet. Geol. Bull. 36, 253–277.
Woodbury, H. O., Murray, I. B., and Osborne, R. E. (1980). “Diapirs and their relation to hydrocarbon accumulation,” in: Facts and Principles of World Petroleum Occurrence, ed. A.D. Miall. Calgary: Canadian Society of Petroleum Geologists
Keywords: gas emissions, flares, hydroacoustic mapping, subsurface gas indications, North Sea, salt diapirism
Citation: Römer M, Blumenberg M, Heeschen K, Schloemer S, Müller H, Müller S, Hilgenfeldt C, Barckhausen U and Schwalenberg K (2021) Seafloor Methane Seepage Related to Salt Diapirism in the Northwestern Part of the German North Sea. Front. Earth Sci. 9:556329. doi: 10.3389/feart.2021.556329
Received: 27 April 2020; Accepted: 12 April 2021;
Published: 07 May 2021.
Edited by:
Tamara Baumberger, Oregon State University, United StatesReviewed by:
Kai Mangelsdorf, Helmholtz Centre Potsdam, German Research Centre for Geosciences (GFZ), GermanyJames Conrad, United States Geological Survey (USGS), United States
Martin Scherwath, University of Victoria, Canada
Copyright © 2021 Römer, Blumenberg, Heeschen, Schloemer, Müller, Müller, Hilgenfeldt, Barckhausen and Schwalenberg. This is an open-access article distributed under the terms of the Creative Commons Attribution License (CC BY). The use, distribution or reproduction in other forums is permitted, provided the original author(s) and the copyright owner(s) are credited and that the original publication in this journal is cited, in accordance with accepted academic practice. No use, distribution or reproduction is permitted which does not comply with these terms.
*Correspondence: Miriam Römer, bXJvZW1lckBtYXJ1bS5kZQ==