 Prosanta Kumar Khan
 Sarada P. Mohanty
 Partha P. Chakraborty3
- 1Department of Applied Geophysics, Indian Institute of Technology (ISM), Dhanbad, India
- 2Department of Applied Geology, Indian Institute of Technology (ISM), Dhanbad, India
- 3Department of Geology, University of Delhi, Delhi, India
An increase in the number of earthquakes and subsequent clustering in northwest India, particularly around the Delhi-National Capital Region (NCR) and adjacent NW Himalayan front, provides a good opportunity to understand the underpinning tectonic controls and the likelihood of any large earthquake in the future. The 2001 Mw 7.7 Bhuj, 2011 Mw 6.9 Sikkim and 2015 Mw 7.8 and 7.3 Nepal earthquakes (and 2004 Mw 9.2 Sumatra event) are important in this context. We analyzed the seismicity around the Delhi-NCR and the adjoining Himalayan front, including event clustering and the spatio-temporal distribution of b-values, in the context of kinematics and the regional geodynamics. The overall moderate-to-low b-values, both in time and space, since 2016, provide information regarding an increase and subsequent stabilization of the stress field in the study area. The analysis led to the identification of (1) a structurally guided stress field in the region between the Kachchh and the NW Himalaya that coincides with the direction of Indian plate convergence and (2) frequent occurrences of earthquakes particularly in the Delhi, Kangra and Uttarkashi areas. We propose that faults in western Peninsular India, which pass through the margins of the Aravalli Range, the Marwar basin, and the isostatically over-compensated Indo-Gangetic Plains beneath the under-plated Indian lithosphere, act as stress guides; concentrating and increasing stress in regions of lithospheric flexure. This enhanced stress may trigger a large earthquake.
Introduction
An increase in clustering of seismic shocks of magnitudes (ML) ranging from 2.0 to 5.2 around the Delhi-NCR and in the adjacent region surrounding large historical damaging events (Figures 1A,B), has raised alarm in the society and scientific community. The seismicity record between January 2016 and June 2020 includes 414 events of ML ≥ 2.0, of which 135 shocks (ML ≥ 2.0) took place in the first six months of 2020 in the Delhi-NCR and adjacent Himalayan front. The fallout news coverage, claims and counter claims in electronic and print media raised some pertinent scientific questions, e.g., (1) possibility of any great event in the Delhi and adjoining areas in the future, (2) triggering of the recent shocks, and (3) possible role of pre-Himalayan heterogeneities behind the along-strike seismic behaviour of the Himalayan front including the Delhi-NCR region. It is interesting to note that majority of the shocks are concentrated around the regions of historical seismicity in the northern Indian plains, including the Delhi-NCR. Indeed, the catastrophic events of the 2001 Mw 7.7 Bhuj (Figure 1C), 2011 Mw 6.9 Sikkim and the 2015 Mw 7.8 Nepal (Figure 1A) earthquakes are still alive in the minds of population. The fault-bound 2001 Bhuj earthquake occurred at the shallow-level of the lower crust caused widespread damage with a toll of ∼20,000 human lives. Small-to-moderate magnitude aftershocks were recorded in different parts of northern Gujarat till the end of 2014 (Khan et al., 2016; Aggarwal et al., 2016). In addition, the incidences of historical major earthquakes (1819 Mw 7.8 Allahbund and 1956 Mw 6.0 Anjar, Figure 1C) in the Bhuj region had rattled the basic tenet of intraplate origin of damaging earthquakes (Chung and Gao, 1995). Copley et al. (2011) linked the Bhuj event with the subduction and collisional dynamics in the western segment of the Himalayas. It is suggested that the seismogenic Indian crust, extending from Gujarat to the Himalayas, supports the compressive stress linked with the subduction of the Indian plate in the region south of Tibet, and is actively involved in triggering moderate-to-great magnitude earthquakes in these areas. In this backdrop, we have investigated the possible reasons behind the recent incidents of small-to-moderate magnitude earthquakes around the Delhi-NCR and the adjoining Himalayas.
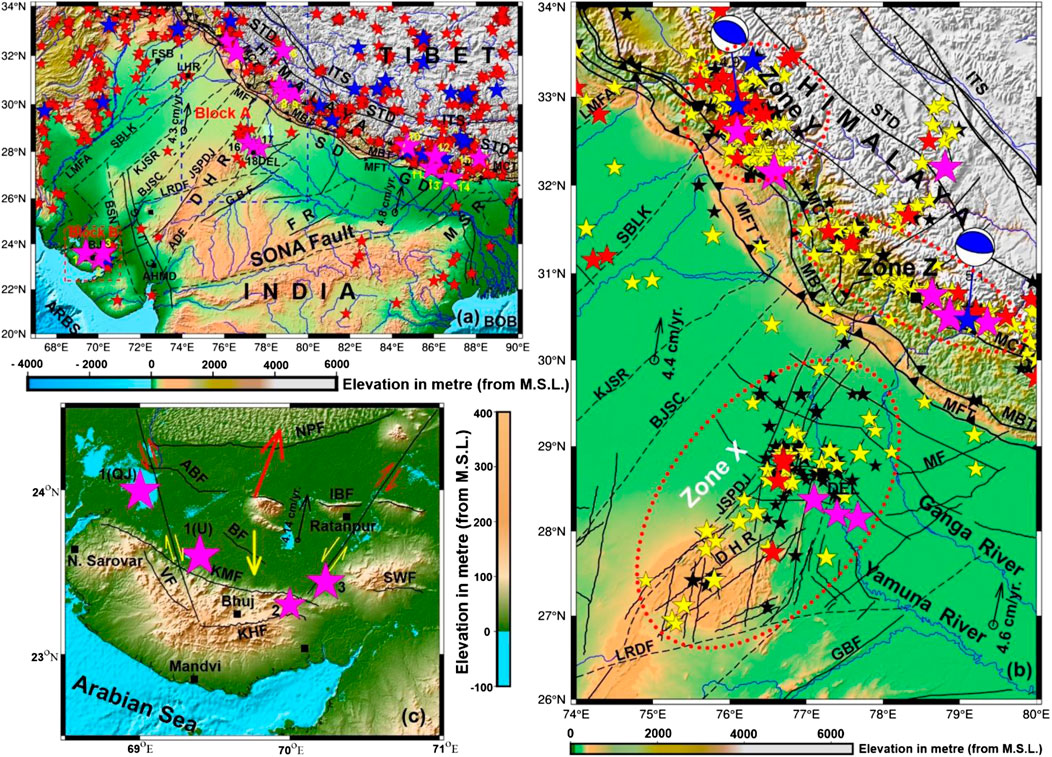
FIGURE 1. (a) Map showing the distributions of earthquake events in northern India including Delhi-NCR area and adjoining mountain front. (b) The enlarged portion of block A (of a) of Delhi and adjoining showing epicentres of earthquakes during 2016–2020. (c) The enlarged portion of block B (of a), the Bhuj area, showing epicentres of historical earthquakes, Magenta stars: the epicenters of historical damaging earthquakes. Yellow arrow represents the compression direction during the 2001 event and associated slip patterns (yellow half arrows) along two regional transverse faults (after Sinha and Mohanty, 2012; Khan et al., 2016). Red arrow along NNE directions represents the predominant stress field (after Aggarwal et al., 2016). Periodic release of stress along the transverse faults results in opposite slip patterns marked by red half arrows (cf. Sinha and Mohanty, 2012). 1: 1819 M 8.3 Kutch (QJ after Quittmeyer and Jacob, 1979; U after Chandra, 1977), 2: 1956 M 6.5 Anjar, 3: 2001 M 7.6 Bhuj, 4: 1945 M 6.27 Chamba, 5: 1905 M 7.8 Kangra 6: 1975 M 6.8 Kinnaur, 7: 1991 M 6.8 Uttarkashi, 8: 1803 M 7.7 Garhwal, 9: 1999 M 6.5 Chamoli, 10: 2015 M 7.9 Nepal, 11: 1833 M 7.6 Nepal, 12: 2015 M 7.3 Nepal, 13: 1988 M 6.8 Nepal-Bihar border, 14: 1934 M 8.1 Nepal–Bihar border, 15: 2011 M 6.9 Sikkim, 16: 1720 M 6.5 Delhi, 17: 1803 M 6.8 Mathura, 18: 1960 M 6.0 Near Faridabad). Black stars in (c): earthquakes with magnitude 2.0 ≤ ML <3.0, yellow stars: 3.0 ≤ ML < 4.0, red stars: 4.0 ≤ ML< 5.0, and blue stars: earthquakes with magnitude between 5.0 and 5.2. Size of the star in each domain varies with magnitude of earthquake. Solid arrow represents the convergence velocity of the Indian Plate against the Eurasian Plate (after DeMets et al., 1994). Positions of faults are reconstructed after Godin and Harris (2014) and Khan et al. (2014), Khan et al. (2017). Abbreviations: FSB, Faisalabad; LHR, Lahore; MFT, Main Frontal Thrust; MBT, Main Boundary Thrust; MCT, Main Central Thrust; STD, South Tibetan Detachment; ITS: Indus–Tsangpo Suture; DEL, Delhi; BJ, Bhuj; AHMD, Ahmedabad; DHR, Delhi–Hardwar Ridge; FR, Faizabad Ridge; MSR, Monghyr–Saharsha Ridge; LMFA, Larkana–Multan–Faisalabad–Akhnoor lineament; SBLK, Sukkur–Bahawalpur–Lahore–Kathua Lineament; KJSR, Kori Creek–Jaisalmer–Suratgarh–Ropar Lineament; BJSC, Bhachau–Jodhpur–Saddarshahar–Chandigarh Lineament; JSPDJ, Jamnagar–Sirohi–Phulad–Degana–Jamuna Lineament; ADF, Agucha–Dariba fault; GBF, Great Boundary Fault; LRDF, Luni–Rupnagar–Dausa–FatehpurSikri lineament; BSN, Bhavnagar–Surendranagar–Nagar Parker Fault; CJG, Cambay–Jaisalmer graben; SONA, Son–Narmada; SD, Sarada Depression; GD, Gandak Depression, ARBS, Arabian Sea; BOB, Bay of Bengal; ABF, Allahbund Fault; BF, Banni Fault; IBF, Island Belt Fault; KHF, Katrol Hill Fault; KMF, Kachchh Mainland Fault; NPF, Nagar Parkar Fault; SWF, South Wagad Fault; VF, Vigodi Fault.
The ∼2500 km long Himalayan orogeny is structurally and tectonically segmented by the trench-orthogonal ridges (Delhi–Hardwar, Faizabad and Monghyr–Saharsa) and depressions (Sarada and Gandak) in the underthrusted Indian plate (Valdiya, 1976; Gahalaut and Kundu, 2012; Hetényi et al., 2016). The segmented orogeny accommodates stress, which triggered several damaging earthquakes (e.g. 1803 M 7.7 Garhwal, 1833 M 7.6 Nepal–Bihar, 1897 M 8.1 Shillong, 1905 M 7.8 Kangra, 1945 M 6.3 Chamba, 1950 M 8.6 Assam, 1975 M 6.8 Kinnaur, 1988 M 6.8 North Bihar, 1991 M 6.8 Uttarkashi, 1999 M 6.5 Chamoli, 2011 M 6.9 Sikkim, 2015 M 7.8 Nepal and 2015 M 7.3 Nepal, Figures 1, 2). The Delhi-NCR region, close to the foothills of the Himalayas, also experienced a few damaging earthquakes (e.g. 1720 M 6.5, 1956 M 6.7, 1960 M 6.0) in the past (Figures 1–3). Our aim is to document the trends of concentrated seismic activities that have been occurring since 2016, and identify the causative factors, selecting the area encompassing the Delhi-NCR and the adjoining mountain front in western India (Figure 1A). We attempt our study with the analysis of seismic b-values in space-time domains. Seismic b-value has been used in a variety of seismological studies, including earthquake forecasting, prediction, and seismic hazard analysis (Kagan and Knopoff, 1987; Rydelek and Sacks, 1989; Geller, 1997; Wiemer and Wyss, 2000; Beauval and Scotti, 2004; Woessner and Wiemer, 2005; Ogata and Zhuang 2006; Khan and Chakraborty, 2007; Felzer, 2008; Khan et al., 2011; Sobolev, 2011; Cheng and Sun, 2018; Peresan and Gentili, 2018). Special emphasis was given to simulate the distribution and the confinement of seismicity around the Delhi-NCR, the adjoining Himalayas, in general, and for three main tectonic domains of interest, i.e., Delhi (Zone X), Kangra (Zone Y) and Uttarkashi (Zone Z) regions, in particular (Figure 1B). We finally integrate all the observations into a holistic seismic model that may account for interpretation of signatures obtained from structurally complicated western Indian plain and the adjoining Himalayan front.
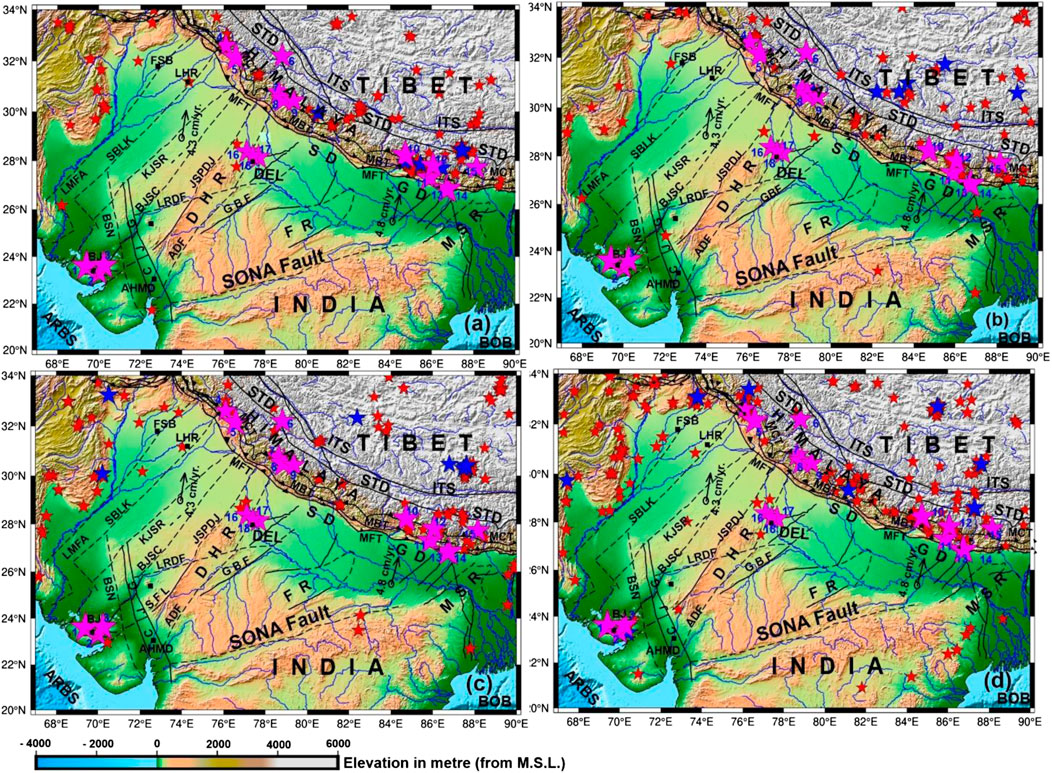
FIGURE 2. Maps showing the distributions of earthquake events in northern India and adjoining regions during 2016–2020: (a) 2016; (b) 2017, (c) 2018, and (d) 2019–2020. Red stars: the epicentres of earthquakes with magnitude 4.0 ≤ M < 5.0. Blue stars: earthquakes with magnitude between 5.0 and 5.8. Size of the star in each domain varies with magnitude of earthquake. Solid black lines represent faults, and black dashed lines represent lineaments. Blue solid lines show the positions of various perennial rivers. Solid black squares represent locations of few important towns. Other abbreviations are similar with Figure 1.
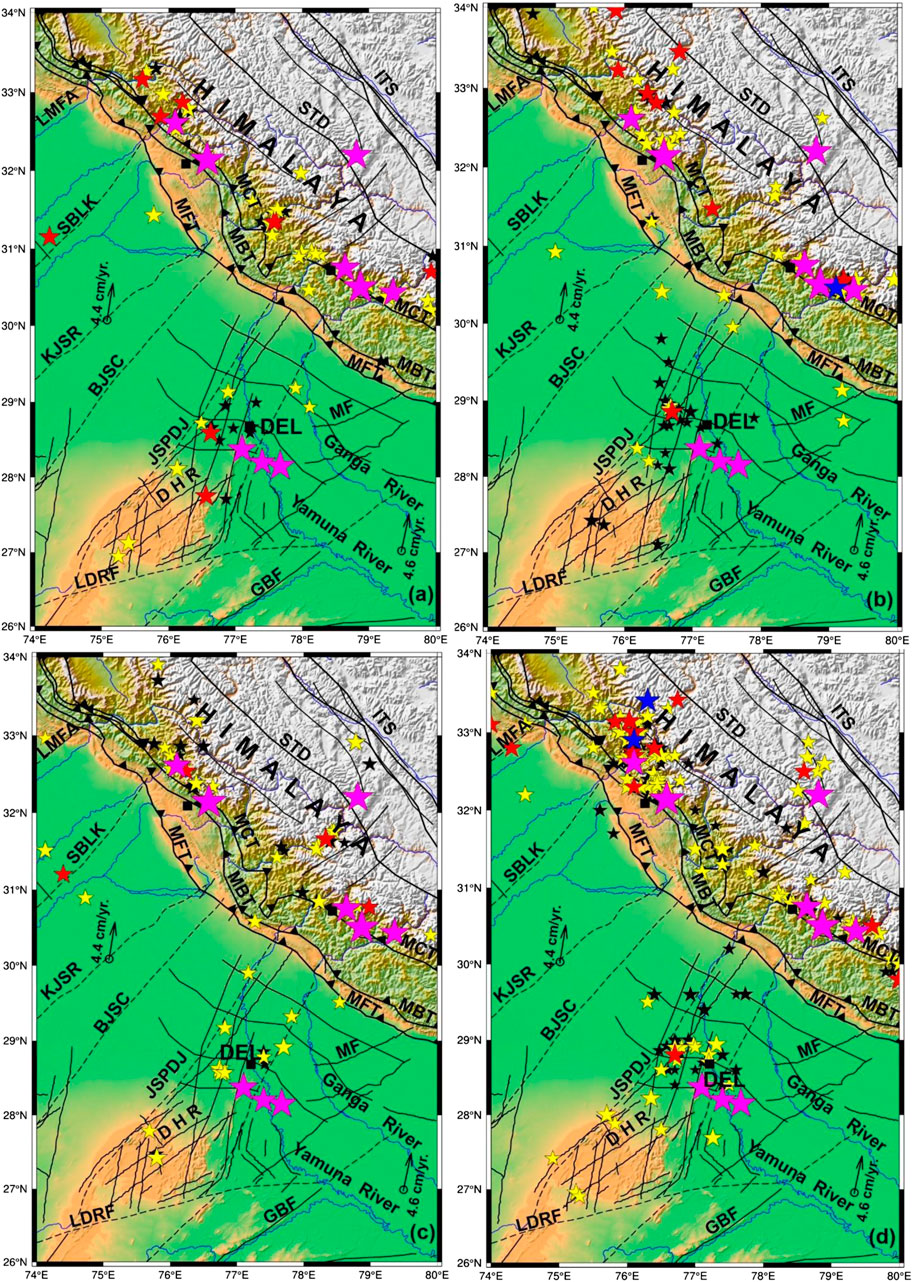
FIGURE 3. Maps showing the distributions of earthquake events in Delhi and adjoining Himalayas: (a) 2016, (b) 2017, (c) 2018, and (d) 2019–20. Stars indicate epicentres of earthquakes (Black stars: magnitude 2.0 ≤ ML < 3.0; yellow stars: 3.0 ≤ ML < 4.0; red stars: 4.0 ≤ ML< 5.0; blue stars: magnitude between 5.0 and 5.2). Size of the star in each domain varies with magnitude of earthquake. Solid black lines represent faults, and black dashed lines represent lineaments. Blue solid lines show the positions of various perennial rivers. Solid black squares represent locations of important places. Other abbreviations are similar with Figure 1.
Regional Tectonic Setup
The Late Mesozoic subduction of the Neotethyan oceanic crust at the leading edge of the Indian Plate below the Eurasian plate and the southward migration of the convergence zone in the Cenozoic gave rise to the evolution of the Himalayas (Patriat and Achache, 1984; Copley et al., 2010). The suturing migrated eastward along the Indus-Tsangpo zone, with concomitant oroclinal bending of the Himalayas (Klootwijck et al., 1985). The Paleozoic–Mesozoic Tethyan sedimentary cover on the subducting Indian plate got mobilized in the Himalayan orogenic front. The deformation, thus initiated, migrated southwards in the form of a series of crustal-scale thrust systems (Chakraborty et al., 2019). From north to south, these include the Main Central Thrust (MCT, between Tehyan Himalayas and Lesser Himalayas), Main Boundary Thrust (MBT, between Lesser Himalayas and Sub-Himalayas) and Main Frontal Thrust (MFT, between Sub-Himalayas and Indo–Gangetic Plains) (Le Fort, 1986). It is presumed that the Main Frontal Thrust (MFT) accommodates the maximum deformation of the southward verging orogeny (Lavé and Avouac, 2000). The MFT, MBT, and MCT are merged in a northward dipping dećollement, i.e., the Main Himalayan Thrust (MHT) (Makovsky et al., 1996; Hauck et al., 1998; Bollinger et al., 2006), which is modeled as a duplex with two north-dipping sub-horizontal planes connected by a system of thrust faults (Mendoza et al., 2019), act as an impediment to the plate convergence.
The convergence rate of the Indian plate near the Himalayan front varies significantly between ∼5.4 cm/yr and 4.2 cm/yr along the east–west direction (DeMets et al., 1994). The hard collision of the Indian plate during the Late Miocene caused the maximum upliftment of the Himalayas and the Tibet (Royer and Gordon, 1997). The enormity of deformation of the orogenic process has resulted in the development of unconformity in the floor of the Bay of Bengal, folding and faulting in the equatorial Indian Ocean, and the evolution of basins and ridges near the foothills of the Himalayas—all in response to tectonic processes in the orogen that evolved during Miocene–Pliocene time (Cochran, 1990; Curray, 2005; Gordon, 2009). Thus, the active resistance to the under thrusting distributes and perturbs the stress fields up to the Indian Ocean, and accounts for occasional incidents of great intraplate earthquakes (Khan et al., 2014; Aggarwal et al., 2016; Khan et al., 2016; Khan et al., 2020). Further, the excess weight of the orogeny is supported in parts by the strength of the Indian plate, which distributes the load by flexing down along the ∼1000 km laterally extended and isostatically over-compensated Indo–Gangetic Plains (e.g., Lyon-Caen and Molnar, 1983; Tandon et al., 2014).
Experiments on deformation and numerical modeling involving tectonic units along collisional boundaries have revealed a complex geometry for sheared suture zone (Beaumont et al., 1996; Selzer et al., 2008). Continental plates, involving collision, get stacked and show the presence of double Moho below the overriding plate (Beaumont et al., 1996; Selzer et al., 2008). In these models, the curved geometry of the crustal elements in plan and cross-section act as the sites for stress accumulation and deformation leading to seismicity. The deformation scenario becomes more complex when the subducting plate inherits tectonic elements at high angles to the regional trend of the mountain belt. Converging plate, containing pre-orogenic anisotropies (e.g., ridge, fault systems, lineaments, etc.), leads to lateral variation of crustal thickness during subduction. The processes may further lead to segmentation of the mountain belt having variable stress-strain patterns (Khan et al., 2014; Hetényi et al., 2016). The northward continuation of the Pre-Himalayan heterogeneities within the converging Indian plate [e.g. the Aravalli Mountain belt as the Delhi-Haridwar ridge (DHR), the Bundelkhand massif as the Faizabad ridge (FR), the Satpura Mountain belt as the Monghyr–Saharsa ridge (MSR)] and the clustering of criss-cross fault systems are the examples of such heterogeneity (Valdiya, 1976; Karunakaran and Ranga Rao, 1979; Valdiya, 2003; Goswami, 2012; Godin and Harris, 2014). Many regional faults and lineaments, viz. the SONA Fault, the Great Boundary Fault (GBF), Bachau–Jodhpur–Saddarshahar–Chandigarh lineament (BJSC), Kori Creek–Jaisalmer–Suratgarh–Ropar lineament (KJSR) and Sukkur–Bahawalpur–Lahore–Kathua lineament (SBLK) parallel to these ridge systems (Figure 1A) define large-scale horsts, grabens and sedimentary basins with crystalline basement and sedimentary fills of variable thickness. Understandably, such heterogeneities cause segmentation in the subducting Indian Plate (Figure 1).
Earthquake Data and Analysis
The present analysis has been carried out using the earthquake data recorded by local network of the National Centre of Seismology (NCS), Government of India, New Delhi (Srivastav et al., 2005; Dattatrayam et al., 2014; Prakash et al., 2020). The seismic network in Delhi NCR and the surrounding region has more than 30 broadband stations (Figure 3 of Prakash et al., 2020), and the earthquake catalogue contains information on origin time/date, latitude and longitude of the epicentre, focal depth and magnitude. The network has a detection and location capabilities down to a magnitude 2.0 (ML) earthquake. Also, the earthquake data in the catalogue have an accuracy of ±2 km in the epicentre. Despite upgradation of basic seismic network in recent time with addition of state-of-the-art broadband sensor having VSAT connectivity (Prakash et al., 2020), the accuracy in focal depth determination is not improved further because of limitation in recording station distribution. This has restricted any analysis based on hypocentre-information available in the catalogue. Taking into consideration the accuracy of locations and magnitudes of the events available in the NCS catalogue, a total of 414 events of ML ≥ 2.0 have been considered (Figure 4B) for detailed analysis of the earthquakes in the present study. Further, regional clustering of events (ML ≥ 4.0) has also been investigated in view of the major damaging earthquakes in different segments of the Himalayas and the Delhi region (Figure 2). We have compiled 441 such events for the duration 2016–19 from the catalogue of International Seismological Centre (ISC), and 84 events for the first 6 months of 2020 from NCS catalogue based on the coverage of recording stations.
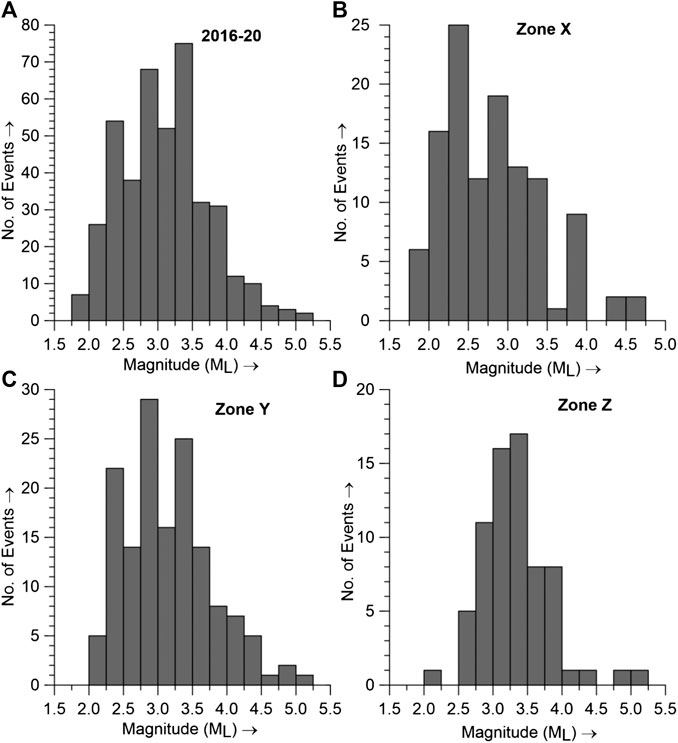
FIGURE 4. Histogram illustrating the level of seismicity in Delhi and adjoining regions. (A) during 2016–2020, (B) Zones X, (C) Zone Y, and (D) Zone Z (Figure 1B). Note the occurrences of maximum magnitude earthquakes in different Zones.
Regional Seismicity Analysis
The elliptical segment of the Nepal–Bihar–Sikkim, a zone of interaction of MSR with the foothills of the Himalayas (shown in Figure 1A), covers the region of past six major earthquakes. Along with the MSR, many regional transcurrent faults (e.g., east and west Patna faults, Pingla fault and many others, Godin and Harris, 2014; Hetényi et al., 2016) passing through this region, have been accommodating the plate movements since the Holocene times (Valdiya, 1976, Valdiya, 2003). These are particularly involved in concentrating and raising the stress field (Sibson, 1980; Marshak and Paulsen, 1997), and occasionally trigger major earthquakes in this part of the Himalayas (Dasgupta et al., 2000; Paul et al., 2015; Singh et al., 2020). The spatially clustered seismic activities in this area (Figure 1A) are caused by occasional release of strain energy through occurrences of aftershocks and other main shocks subsequent to 2015 Mw 7.8 and 7.3 Nepal events.
The great 2001 Mw 7.7 Bhuj earthquake occurred along the Kachchh Mainland Fault (KMF), where another two major earthquakes occurred in 1819 and 1956 (block B, Figures 1A,C), and the aftershocks continued for a period of long-time (Aggarwal et al., 2016; Khan et al., 2017). The strain energy, released in form of earthquakes, apparently has migrated toward the western part, particularly in the northwest Himalaya and adjoining regions. Concentrated activities are noticed in the region with epicentres of major historical earthquake events near Kangra (no. 4, 5) and Delhi (no. 16–18) (Figure 1A).
The regional seismicity has been investigated in some details over four time-domains, viz., 2016 (Figure 2A), 2017 (Figure 2B), 2018 (Figure 2C), and 2019–2020 (Figure 2D). Enhanced clustering of seismicity, few with magnitude more than 5.0, are noticed around the Nepal-Bihar zone, where the 2015 great Nepal event took place (Figure 2). Gradually, the seismic activities shifted toward west, and in 2019–20 maximum activity was recorded around the Delhi-NCR (Figures 1, 2). Even earthquakes of magnitudes one blank> 5.0 are recorded in the western and central segments of the Himalaya including one in Bhuj (14 June, 2020 Mw 5.3 Bhuj) and near the Suleiman Range (March 16, 2019 Mw 5.0 and September 24, 2019 Mw 5.4).
Local Seismicity Analysis
Figure 1B displays the distribution of seismicity (ML ≥ 2.0) for the duration January 01, 2016 to June 30, 2020 (414 events, altogether) in the Delhi and adjoining mountain front (Figures 4A, 5A). Seismicity is found to concentrate within specific areas, namely surrounding the Delhi (120 events, Zone X), Kangra (151 events, Zone Y) and Uttarkashi (87 events, Zone Z) regions (Figures 1, 4, 5). Spatial zone-specific distribution of seismicity, within the Delhi and adjoining Himalayas region, has been further investigated for different time intervals 2016 (59 events, Figure 3A), 2017 (89 events, Figure 3B), 2018 (57 events, Figure 3C), and 2019–2020 (209 events, Figure 3D). The concentration of seismicity in these domains has changed considerably with maximum of 209 in 2019–20; and this number has increased more sharply in 2020 (134 events over first six months). Significant number of events with magnitudes ML ≥ 4.0 has also been recorded in each time-domain. In particular, the Zone Y surrounding the Kangra area records significant number of events with magnitude ML ≥ 4.0 (Figure 4). Although, low-magnitude earthquakes are recorded in high numbers near the Delhi (Zone X) and Uttarkashi area (Zone Z), events with ML ≥ 4.0 are not rare in these areas. Figure 5A shows that the seismic activities are distinctly divided into two time-domains; one over 2016–18 and another over 2019–20, and apparently the energy release is explained to be discontinuous in nature. More or less similar oscillations are also found in Zones X and Y (Figures 5B,C). A distinct cluster of seismic activities with two events of magnitudes ML ≥ 5.0 was associated with the Kangra area since 2019 (Figure 5C). However, such distinct signature of clustering is apparently less prominent in Zone Z (Figure 5D).
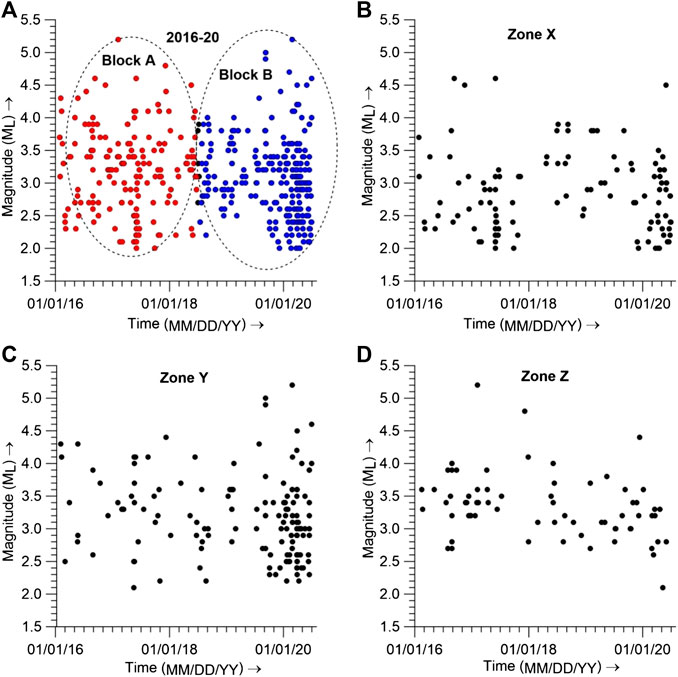
FIGURE 5. Plots illustrating the seismicity in Delhi and adjoining regions. (A) during 2016–2020, (B) Zone X, (C) Zone Y, and (D) Zone Z (Figure 1B). The clustering is also apparent in the three Zones (X, Y and Z). Note the clustered seismicity in blocks A and B, and significant increase in frequency of occurrences in 2019–20.
Seismic b-Value Analysis
Earthquake magnitude-frequency domain is approximated by a power-law distribution as observed for other similar self-organized non-equilibrium systems. Gutenberg and Richter (1954) proposed an empirical relationship (the GR law) between frequencies of occurrence of earthquakes as a function of magnitude, which is expressed mathematically as:
where N(M) is the cumulative number of shocks with magnitude M ≥ 0, and ‘a’ is a measure of the background level of seismic activity/efficiency of the concerned area. It depends on the areal extent of the study-region and duration. The seismic b-value is computed from the slope of the Log10(N) vs. M regression line. It accounts for large-magnitude earthquakes over the number of small-magnitude shocks (Khan and Chakraborty, 2007; Cheng and Sun, 2018), and is inversely related with the differential stress-level (σ1−σ3) and/or shear strength of the materials (Wyss, 1973; Urbancic et al., 1992; Schorlemmer et al., 2005; Spada et al., 2013; Scholz, 2015). It also determines the decay in the rate of occurrences of earthquake events with increasing magnitude. In natural situations, b-values are found to lie between 0.5 and 1.5, depending on the tectonics of a region (Khan et al., 2011).
The temporal and spatial heterogeneity in crust may break the power-law scaling for distribution of earthquakes (Rydelek and Sacks, 2003; Woessner and Wiemer, 2005), and result in anomalous b-value distribution owing to anomalous stress distribution at high and low levels. However, the self-organized and self-similar non-equilibrium condition in the subsurface medium, may still remain valid for earthquake generations (Rydelek and Sacks, 1989; Woessner and Wiemer, 2005; Sobolev, 2011), and stable for eqn. 1 over a definite time-window (Wiemer and Wyss, 2000). The plot systematically deviates from linearity because of rare incidents of large magnitude events at upper bound, and is constrained by the incompleteness of catalogue at lower bound (Rydelek and Sacks, 1989; Taylor et al., 1990; Wesnousky, 1994; Naylor et al., 2010). The latter may be caused by missing a large number of small magnitude earthquakes due to: detection threshold; aftershock (or other shocks) occurrence within the tail of larger events; aseismic slip during nucleation along a creeping fault (Heimpel and Malin, 1998; Vorobieva et al., 2016), or lack of enough stations to record very small magnitude events (Pacheco et al., 1992). Wiemer and Wyss (2000) and Woessner and Wiemer (2005) have examined such limitations, and advocated the essential requirement of minimum magnitudes of completeness (Mc) for seismicity analysis. Although, the Mc varies with time in most of the catalogues for several regions, namely it decreases with increase in the number of recording stations and advancement in the methodology of analysis, it is widely used for b-value estimation over high seismic areas (Rydelek and Sacks, 1989; Wiemer and Wyss, 2000). Further, the GR law needs to be estimated for different segments over the study area in view of self-similar seismotectonic character (Molchan et al., 1997), or distinct locations of geological units (Peresan and Gentili, 2018). Thus, the zonation in the region of present concern is constrained mainly by the self-similar seismotectonic behaviour, and a specific Mc value is determined for each zone.
With all discussed constraints, we carried out the analysis of seismic b-values following frequency-magnitude distribution (FMD, Eq. 1) of Gutenberg and Richter (1954) for understanding the possibilities of major earthquakes in any of the three zones (X, Y and Z, Figure 1A). The technique is being used ubiquitously in different tectonic settings at different levels of depths for several decades considering earthquake catalogues covering from few months to several years. This makes the GR law very effective for analysis of earthquake hazards and also attractive for its theoretical significance. Assuming the self-similarity in the GR law (Mignan and Woessner, 2012), we have performed the analysis for the entire study area and for the three demarcated zones in different time-domains between 2016 and June 30, 2020 (cf. Figures 3, 5A,6). On the basis of spatial clustering of earthquakes epicentres in different time windows, the b-values are clubbed under two blocks A and B (Figure 5A). The uncertainties in the calculations of b-values are based on the model proposed by Shi and Bolt (1982), which can be written as
where σ(b) represents the standard error of b-value calculation, N and
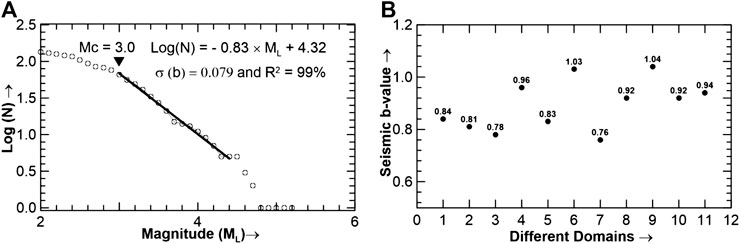
FIGURE 6. Plots illustrating (A) the computation of seismic b-value (after Gutenberg and Richter, 1954) for earthquakes of 2020 and (B) the variation of seismic b-values for seismic zones (X, Y and Z) during different time domains. Index for time domains along the x-axis: 1—2016 (entire area); 2—2017 (entire area); 3—2018 (entire area); 4—2019 (entire area); 5—2020 (entire area); 6—2016–2020 (entire area); 7—Zone X; 8—Zone Y; 9—Zone Z; 10—Block A of Figure 5A; and 11—Block B of Figure 5A. Mc: Completeness magnitude, σ(b): Standard error (after Shi and Bolt, 1982), R2: Coefficient of determination.
Selection of completeness magnitude (Mc) of a sequence of natural shocks is crucial for any statistical analysis (Mignan and Woessner, 2012 and the references therein). The selection of lower value of Mc will normally contaminate the analysis, largely by threshold characteristics of the instruments as well the detection of events, whereas the high value results in under-sampling of the sequence of dataset beyond the Mc value. In the present study, attempt was made for Mc’s selection for different zones with critical examination by visual inspection of departure of linearity (apparent break in the gradient) in the log-linear plot of cumulative FMD of earthquake events. However, the gradual change in the curvature of the plots made the selection of Mc difficult (Mignan and Woessner, 2012), particularly when resorting to maximum curvature method for Mc detection. This typical trend in the cumulative FMD is usually caused by the spatio-temporal heterogeneities in the Mc (Wiemer and Wyss, 2000; Mignan, 2011). Thus, to verify deviations from log-linearity of the FMD distribution, the Mc for each dataset has been computed on the basis on non-cumulative (i.e. computed log10 value of number of events for each magnitude increment) log-linear plot of events (Woessner and Wiemer, 2005; Mignan, 2012; Mignan and Woessner, 2012). The exercise was carried out to avoid the limitation in the selection of Mc threshold from the cumulative log-linear plot of FMD, and to provide a rather conservative specific Mc for each zone (Table 1).
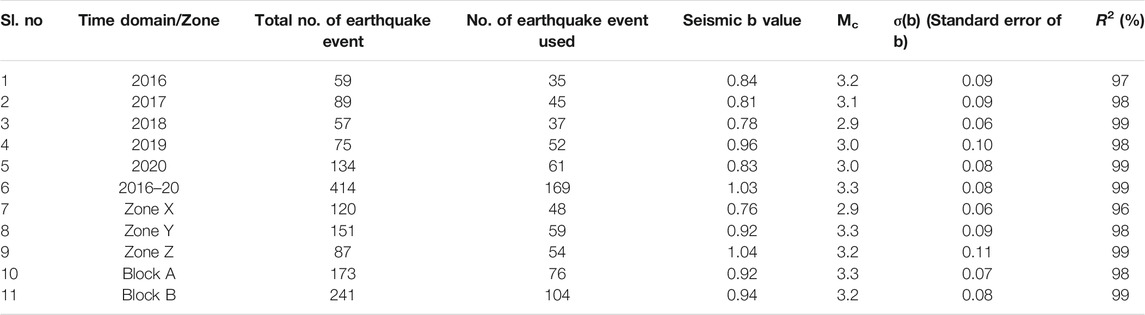
TABLE 1. Details of the earthquake events used for computation of seismic b-values and the corresponding errors.
Results
The maximum computed b-value of 1.04 is recorded in Zone Z (i.e., the Uttarkashi area; Figure 1), and the next low b-value of 1.03 is found for the entire region for the data ranging from 2016 to June 30, 2020 (Figure 6B; Table 1). The minimum b value of 0.76 is found for Zone X (i.e., Delhi-NCR), and the next higher one of 0.78 is noted during 2018. Other b-values lie at moderate-to-low-level with a maximum of 0.96 during 2019 (Figure 6B; Table 1).
We found clustered seismicity in Delhi (Zone X, Figure 5B) and Kangra (Zone Y, Figure 5C) areas but not so strongly at the Uttarkashi area (Zone Z, Figure 5D). Maximum number of events were found in the Kangra region in 2019–20, with the close next at Delhi. Figure 6B and Table 1 illustrate the variations of seismic b-values in different time and space domains. Except a little higher b-value of about 1.0 during 2016–2020 for the entire region and the Uttarkashi area, other b-values in 2016, 2017, 2018, and 2020 are found to be around 0.8, with a minimum of 0.78 in 2018. Different zones such as X, Y and Z (Delhi-NCR, Kangra, Uttarkashi, Figure 1B) also record low to moderate b-values between 0.76 and 1.04 (Table 1). The overall two clustered seismicity in block A and B during 2016–2020 (Figure 5A) also shows moderate b-values of 0.92 and 0.94, respectively (Table 1).
Although we found a little high standard errors (≥0.09) for 2016, 2017, 2019, and Zone Y and Z, all the estimates are well compatible within the range of errors. The large uncertainties for some domains might have been found due to limited available observations and heterogeneities in the dataset; the b-value estimate for zone X, in particular, though being characterized by a pretty low standard error (∼0.06), it has a lower value of coefficient of determination (96%) compared to other zones. The robustness of b-values estimates was also tested with other methods (i.e., maximum likelihood, Aki, 1965) and was found to be compatible within the errors limits; also it was found that such analysis is less sensitive to magnitude upper bound, although producing lower values of coefficient of determination R2.
The persistent moderate (∼1.0) to low b-values (∼0.8–0.76) in all the Zones X,Y and Z, and blocks A and B (Table 1; Figure 6B) invariably account for higher stress accumulation in the entire study-area (cf. Tormann et al., 2012; Spada et al., 2013; Khan et al., 2018). The low b-values, over time and space domains, usually indicate high-strength homogeneous rock-mass, whereas high b-values are found for a large number of small earthquakes expected in regions of low strength and large heterogeneity (Tsapanos, 1990). Low b-value in a region is indicative of high stress accumulation and release of high seismic moment (Scholz, 1968; Wyss, 1973; Cao and Gao, 2002). From stable and unstable friction experiment, Rivière et al. (2018) have shown that the reduction of b-value occurs when shear stress systematically rises before stick-slip failure, and results in large events when faults become highly stressed. Incidences of large number of foreshocks are also reported in such situation (Scholz, 1968; Goebel et al., 2013, Goebel et al., 2015). Scholz (1968) and Wyss (1973) suggested the low b-values to be compatible with release of higher seismic moment energy in an active seismic zone. Scholz (1968) also suggested that the b-value decreases with increasing differential crustal stress (Schorlemmer et al., 2005; Spada et al., 2013; Scholz, 2015; Khan et al., 2018), and the declining b-value accounts for an impending main shock. The increased number of events in 2019–20 (block B, Figure 5A) and an overall moderate-to-low b-value indicate the possibility of increasing stress accumulation in the study area and a future great earthquake.
We also found a cluster of seismic events near the regions where ridges (horsts) and basins (grabens) interact with the Himalayan orogenic front. This observation indicates stress concentrations at the intersection points (Sibson, 1980; Marshak and Paulsen, 1997; Khan et al., 2014). Indeed, concentration of most of the events in the re-entrants (e.g. 1803 M 7.7 Garhwal, 1905 M 7.8 Kangra, 1945 M 6.3 Chamba, 1975 M 6.8 Kinnaur, 1991 M 6.8 Uttarkashi, and 1999 M 6.5 Chamoli), and historical earthquakes along the margins of the regional faults in the Western India (e.g. 1720 M 6.5 Delhi, 1956 M 6.7 Delhi, 1960 M 6.0 Delhi, 1966 M 5.8 Delhi-NCR, 1819 Mw 7.8 Allahbund, 1956 Mw 6.0 Anjar, 1969 Mw 5.3 Mt Abu, 2001 Mw 7.6 Bhuj, 2009 Mw 5.1 Barmer) indicate a link between the seismic events with regional faults striking NNE-SSW and cross-faults forming horsts and grabens in the subducting Indian plate and their interaction with the MHT.
We have also noticed increased frequency of earthquakes of magnitudes ML ≥ 4.0 along the western part of India, particularly in 2019–20 (Figures 1A, 2), with many events associated with the NNE directed lineaments transcend the Himalayan mountain front in the area. The 2012 Mw 5.1 Dholavira and 2020 Mw 5.3 Bhachau earthquakes with five other earthquakes of magnitudes 5.0 and above along the western part of India (Figure 1A) are indicators for increasing stress fields in Delhi and the adjoining regions. The fluctuation and multi-fractality in the sequence of aftershocks of 2001 Bhuj earthquakes (Aggarwal et al., 2015, Aggarwal et al., 2017) bear testimony for the oscillating nature of seismic energy release, and support the chaotic nature of shocks in Delhi and the adjoining regions (Figure 6). Further, the occurrences of earthquakes in a region follow the non-linear, chaotic and scale-invariant pattern, and the non-constraint of self-similarity in the earthquake sequence limits the predictability of large future earthquake (Sykes et al., 1999).
Discussion
The analysis of regional seismicity indicates that the stress-strain patterns in the Himalayas, generating major earthquakes, are apparently linked with the regional structural patterns of the converging Indian plate. It is noted that the crustal heterogeneities are responsible for the lateral segmentation of the 2500 km long orogen into distinct tectonic domains (Valdiya, 1096; Gahalaut and Kundu, 2012; Godin and Harris, 2014; Hetényi et al., 2016). To resolve specific-controls, we have attempted tracking of regional structures in the study area to find their continuity, if any, from Indian plate interior through the foredeep to the Himalayas and the link between these structures and seismicity in the area. Transfer of stress into the Indian plate interior by the regional fault systems is documented and identified as an earthquake trigger in selected domains of the Peninsular India (Copley et al., 2011). One such zone of high seismicity is found in the western part of India, i.e. the Kachchh region. The 2001 Mw 7.6 Bhuj earthquake was considered to be the result of stress propagation from the Himalayas (Copley et al., 2011) or the Suleiman Range (Stein et al., 2002; Khan et al., 2016). The analysis of Khan et al. (2016) indicates that the far-field stress generated by the collision resistance between the Indian and Eurasian plates and anticlockwise rotation of the Indian plate are the main factors behind the stress accumulation in the western India and its periodic release through earthquakes. In addition to the earthquakes in the Kachchh region, two other events (1969 Mw 5.3 Mt. Abu and 2009 Mw 5.1 Barmer at 15 and 39 km depth, respectively) were also reported along regional fault systems demarcating the area (Khan et al., 2016).
With this understanding, we have further attempted an analysis of regional geotectonic backdrop that may have been causing the stress accumulation. Definitely, the northwestern margin of the Indian plate has a crucial role in this. It includes the Aravalli craton, the Indo–Gangetic Plains and the Kachchh–Saurashtra blocks. The eastern boundary of the block is demarcated by the Great Boundary Fault (GBF), and the western margin is defined by the Suleiman Range–Jacobabad Ridge (Figures 1–3). The intervening region is divided into five blocks (from west to east): the Indus basin, Pokhran–Bahawalpur ridge, Jodhpur–Marwar basin, the Aravalli Mountain Range and the Eastern Plains (Mahi–Banas–Chambal basin). The regional faults demarcating the boundaries between the morphotectonic units extend from the Arabian Sea to the Himalayas, and have surface expressions of: Sukkur–Bahawalpur–Lahore–Narowal–Kathua (–Dalhousie) lineament (SBLK; Ravi lineament), Kori Creek–Umarkot–Jaisalmer–Suratgarh–Ropar (–Bilaspur–Mandi) lineament (KJSR), Bhachau–Nagar Parker–Luni–Umednagar (Jodhpur)–Nokha (Nagaur)–Sadarshahar–Sirsa–Pachkula (Chandigarh)–(Kalka–Kufri) lineament (BJSC), Jamnagar–Sirohi–Phulad–Degana–Sikar–Rohtak–Karnal–Jamuna–Khairi lineament (JSPDJ) and East Aravalli dislocation zone (Agucha–Dariba Fault). Though major parts of the region to the west of the Aravalli Mountains is occupied by the eolian sands of Rajasthan desert, the faults and lineaments have been tracked and mapped from surface geomorphic features and shallow surface geophysical signals, viz., straight courses of river systems, regional gravity anomalies and distribution of sedimentary basins on the surface (cf. Balakrishnan, 1997; Sinha-Roy et al., 1998).
In the tectonic map of India by Merh (1995), the SBLK lineament is displayed as the “foredeep zone” and the combined block of the KJSR and BJSC as the “hinge zone”, bordering the “shelf zone” to the west of the areas of the Aravalli–Delhi Fold Mountains. The interaction of alternate ridge (horst) and basins (grabens) with the MHT has led to the development of re-entrants over the ridges (horsts) and salient over the basins (grabens) in the frontal part of the Himalayas (Figure 7), which are manifested as the Dehra Dun re-entrant over the Delhi-Hardwar ridge, Kangra re-entrant over the Pokhran–Bhawalpur ridge and the Nahan salient against the Jodhpur–Marwar basin (graben). Over an area, delimited by the Rann of Kachchh in the west and fault system at the Shillong plateau margin in the east, the undeformed Indian lithosphere records signatures of breaking, in association with its flexure and underplating below the Eurasian plate along the MHT. The interactions between MHT and seismically active fault systems bounding the horsts and grabens present in the flexed Indian lithosphere are acting as zones of stress concentration in this highly dynamic, seismically active terrain. Since, it is argued that the fault systems, with effective coefficient of friction of ∼0.8 in the seismogenic Indian crust, supports the compressive force that transpires through the Indian lithosphere due to subduction process (Copley et al., 2011), it may be logical to think that concentration of additional stress in these stress-equilibrated fault systems is the reason behind recent shallow-focus, low-magnitude events recorded around Delhi-NCR and the adjoining Himalayan front.
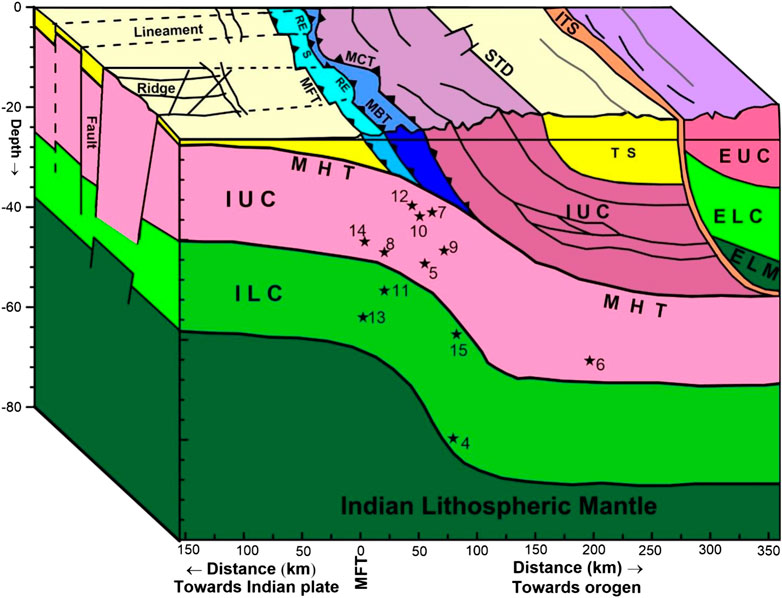
FIGURE 7. Block diagram illustrating the distribution of hypocentres (★) of 12 great damaging earthquakes within the reconstructed subduction profile of the Indian lithosphere (after Ansari et al., 2014). 4: 1945 M 6.27 Chamba, 5: 1905 M 7.8 Kangra 6: 1975 M 6.8 Kinnaur, 7: 1991 M 6.8 Uttarkashi, 8: 1803 M 7.7 Garhwal, 9: 1999 M 6.5 Chamoli, 10: 2015 M 7.9 Nepal, 11: 1833 M 7.6 Nepal, 12: 2015 M 7.3 Nepal, 13: 1988 M 6.8 Nepal–Bihar border, 14: 1934 M 8.1 Nepal–Bihar border, 15: 2011 M 6.9 Sikkim. Abbreviations: MFT—Main Frontal Thrust, MBT—Main Boundary Thrust, MCT—Main Central Thrust, MHT—Main Himalayan Thrust, STD—South Tibetan Detachment, ITS—Indus-Tsangpo Suture, TS—Tethyan Sediment basin, IUC—Indian Upper Crust, ILC—Indian Lower Crust, ELC—Eurasian Lower Crust, EUC—Eurasian Upper Crust. ELM—Eurasian Lithospheric mantle; RE—Re-entrant; S—Salient. Note: The front panel of the diagram is true to the scale, but the topographic-structural variations in the plan are schematic.
Additionally, when hypocentres of major damaging earthquakes are plotted on the reconstructed subduction profile of the Indian plate (Figure 7), they are found to fall in both Upper and Lower Crustal domains, invariably around the flexing zone. This observation raised question on triggering behind high-magnitude deep-focus earthquakes in the area; those, more often than not, are extremely damaging. Crustal heterogeneities including the fault systems may continue up to deep crustal level in the lithosphere, however the role behind generation of great events is still not fully understood (Schulte-Pelkum et al., 2019). Alternatively maximum strength is found to be associated with the bending zone (Kohlstedt et al., 1996; Conrad and Hager, 1999), and can trigger great to mega-shocks along subduction margin (Khan and Chakraborty, 2009; Khan et al., 2012). Using joint inversion of seismic and geodetic data sets, Copley et al. (2011) described the source model of 2001 Mw 7.7 Bhuj earthquake and suggested that the stress associated with event was possibly related to the flexural effects of down-going Indian lithosphere beneath the Himalaya. Buckling of the Indian lithosphere due to the curved geometry, resulting from the underthrust below the Eurasian plate in the Himalayan Mountain Range–Tibetan Plateau, has been identified as the causative factor for the extension of the upper crust and compression in the lower crust; the finite neutral surface of the buckled layer was estimated to be at a depth of 25 ± 5 km (cf. Figure 1 in Copley et al., 2011).
Two alternative possibilities were suggested for the deeper depth of the high-magnitude compressional earthquake events in the Indian lithosphere: (a) increase in strain rate, and/or (b) geometrical hardening of the Indian lithosphere due to along-strike and across-strike curvature related to subduction. Analysis of the distribution of earthquakes in the Indian plate interior is also attributed to the enhanced strain rate, causing a deeper brittle-ductile transition (Mohanty, 2011). Mohanty (2011) has further shown that some of the critically oriented faults (shear zones) in the Indian plate interior are associated with periodic accumulation of high stress/shortening and release of stress/extension. These observations regarding strain-hardening due to high strain rate (∼266 × 10–9 per year along N013°) and alternating sinistral and dextral slip (compression and extension) along the same fault has been corroborated by the field mapping and data analysis of the Bhuj area (Sinha and Mohanty, 2012). The critical fault passes through the epicentres of the 1956 Anjar event and 2001 Bhuj event and continues up to the Himalayas (BJHC in Figure 1A; see also F7.12 in Balakrishnan, 1997).
From above discussion it may be understood that the recent events around Delhi-NCR area cannot be analyzed in isolation without taking into consideration of events in entire northwestern India and associated Himalayan front. Khan et al. (2016) analyzed the frequency of occurrences of aftershocks following the 2001 Bhuj main shock and found it to be decreasing after 2014. The predominant stress direction of the aftershock activities were operative along the NNE direction towards the Himalayan front, passing through the Delhi region (Figure 1C). The self-organized criticality (SOC) behaviour is occasionally persistent over a chaotic nature of sequence of shocks because of gradual restoration of stresses by tectonic loading. Our integrated study involving b-values and operative crustal-scale kinematics and geodynamics, might be accounting for a process-based phenomenon that indicates an impending earthquake in the seismic cycle (Figure 6). Indeed, moderate-to-low ‘b’ values over the study-area and frequent incidents of small-magnitude earthquakes bear indication for a large failure by triggering a great event. The regional crustal-scale heterogeneities including fractures forming the boundaries between NNE–SSW aligned horst and graben structures are found to be the sites for stress-concentration; their interaction with the MHT is enhancing the stress in the bending zone of the subducting Indian lithosphere. Failure is inevitable when the accumulated stress exceeds the yield strength of the materials. Past failures in the bent portion were recorded in 12 disastrous seismic events in the Himalayan region (Figure 7). However, the conjecture drawn from this study can be more robust if results obtained from analysis of b-value clusters are backed with the 3D modeling of a rheological state, taking into account all major structural features involved in the complex structural heterogeneity in the region.
Conclusion
Frequent occurrences of earthquake shocks in Delhi-NCR, adjoining areas and in the immediate Himalayan front pose a serious alarm for population. Although no models are available to predict the impending earthquake in any region, statistical analysis backed by regional kinematics and overall geodynamic understanding can give insights into the details of recent seismic activities. We found that the west -northwestern part of India has been activated by triggering 134 earthquakes of ML ≥ 2.0 over only first half of 2020. The compilation and analysis of well-constrained dataset lead towards understanding of clustering and stabilization of the general moderate-to-low seismic b-values in the study area. The regional structural trends, tectonics in the western India, the operative stress field and seismicity, extended from the Kachchh region, are apparently found to be compatible up to the northwest Himalaya (Figure 1B). The present study, thus, is summarized under the following concluding points:
➢Large number of events of magnitude ML ≥ 2.0 with occasional incidents of earthquakes of magnitudes reaching up to more than 5.0 (Figure 4) indicate high-level stress transmission, accumulation and release in the study area.
➢Spatially clustered seismicity (Figure 1) is cyclic in time as well as in space domains (Figure 5). The incidents of large number of events of ML ≥ 4.0 in the western India are related to the general regional kinematics and tectonics.
➢Moderate-to-low seismic b-values over time and space (Figure 6) indicate stable high stress field, which may lead to fracturing and trigger a large earthquake in the future.
➢The fracture system in the down-flexing, over-compensated Indian lithosphere below the Indo–Gangetic Plains is equally accommodating the stress field, and may initiate nucleation for large earthquake.
➢Insufficient coverage of stations/network for the recorded events under the present study limits the determination of accurate focal depths of the earthquake events within reliable limit of uncertainties. Reliable focal depths of the events would have been more impressive for analysis of stress regime through a 3D structural analysis involving rheological understanding of the area.
➢The heterogeneities appear in the log-linear plots of FMD might be related to the complex structural setup of the study area. The used earthquake catalog seems to be incomplete because of poor coverage of recording stations.
➢The homogeneity of the catalogue could have been achieved by recording more number of low magnitude events and the present study would have been more convincing for forecasting the moderate-to-great earthquakes in this part of the Himalaya based on b-value analysis.
Data Availability Statement
The raw data supporting the conclusion of this article will be made available by the authors, without reservation.
Author Contributions
Seismotectonics of the study area and its in-depth analysis were done by PK. Geology and modeling were done by SM and PC. Data compilation and map reconstruction were done by RS.
Conflict of Interest
The authors declare that the research was conducted in the absence of any commercial or financial relationships that could be construed as a potential conflict of interest.
Acknowledgments
First author is thankful to the University Grant Commission, Government of India, New Delhi for financial support to complete the present work. Authors are also thankful to the National Center of Seismology (NCS), Government of India, New Delhi and International Seismological Center (ISC), United Kingdom. for disseminating the earthquake data to all researchers. Authors are thankful to both the reviewers and Editor for their comments, which have improved the manuscript to a large extent.
References
Aggarwal, S. K., Khan, P. K., Mohanty, S. P., and Roumelioti, Z. (2016). Moment tensors, state of stress and their relation to faulting processes in Gujarat, western India. Phys. Chem. Earth. 95, 19–35. doi:10.1016/j.pce.2016.01.004
Aggarwal, S. K., Lovallo, M., Khan, P. K., Rastogi, B. K., and Telesca, L. (2015). Multifractal detrended fluctuation analysis of magnitude series of seismicity of Kachchh region, Western India. Physica A 426, 56–62. doi:10.1016/j.physa.2015.01.049
Aggarwal, S. K., Pastén, D., and Khan, P. K. (2017). Multifractal analysis of 2001 Mw7.7 Bhuj earthquake sequence in Gujarat, Western India. Physica A 488, 177–186. doi:10.1016/j.physa.2017.06.022
Aki, K. (1965). Maximum likelihood estimate of b in the formula log N=a-bM and its confidence limits. Bull. Earthquake. Res. Inst. Univ. Tokyo. 43, 237–239.
Ansari, M. A., Khan, P. K., Tiwari, V. M., and Banerjee, J. (2014). Gravity anomalies, flexure, and deformation of the converging Indian lithosphere in Nepal and Sikkim–Darjeeling Himalayas. Int. J. Earth Sci. 103 (6), 1681–1697. doi:10.1007/s00531-014-1039-0
Balakrishnan, T. S. (1997). Major tectonic elements of the Indian subcontinent and contiguous areas: a geophysical view. Geological Society of India Memoir, no 38. Bangalore: Geological Society of India, 1–155.
Beaumont, C., Ellis, S., Hamilton, J., and Fullsack, P. (1996). Mechanical model for subduction-collision tectonics of Alpine-type compressional orogens. Geology 24 (8), 675–678. doi:10.1130/0091-7613(1996)024<0675:mmfsct>2.3.co;2
Beauval, C., and Scotti, O. (2004). Quantifying sensitivities of PSHA for France to earthquake catalog uncertainties, truncation of ground motion variability, and magnitude limits. Bull. Seismol. Soc. Am. 94 (5), 1579–1594. doi:10.1785/012003246
Bollinger, L., Henry, P., and Avouac, J. P. (2006). Mountain building in the Nepal Himalaya: thermal and kinematic model. Earth Planet. Sci. Lett. 244 (1–2), 58–71. doi:10.1016/j.epsl.2006.01.045
Cao, A., and Gao, S. (2002). Temporal variations of seismic b-values beneath northeastern japan island arc. Geophys. Res. Lett. 29, 1334. doi:10.1029/2001GL013775
Chakraborty, P. P., Tandon, S. K., and Saha, S. (2019). Development of Phanerozoic sedimentary basins of India. J. Asian Earth Sci. 184, 103391. doi:10.1016/j.jseaes.2019.103991
Chandra, U. (1977). Earthquakes of peninsular India—a seismotectonic study. Bull. Seismol. Soc. Am. 67 (5), 1387–1413.
Cheng, Q.-M., and Sun, H.-Y. (2018). Variation of singularity of earthquake-size distribution with respect to tectonic regime. Geosci. Front. 9 (2), 453–458. doi:10.1016/j.gsf.2017.04.006
Chung, W. Y., and Gao, H. (1995). Source parameters of the Anjar earthquake of July 21, 1956, India and its seismotectonic implications for the Kutch rift basin. Tectonophysics 242 (3, 4), 281–292. doi:10.1016/0040-1951(94)00203-l
Cochran, J. (1990). “Himalayan uplift, sea level, and the record of Bengal fan sedimentation at the ODP leg 116 sites S1,” in Proceedings of the ocean drilling program: scientific results. J. R. Cochran, D. A. V. Stowet al. (Texas: Texas A & M University), 116, 397–414.
Conrad, C. P., and Hager, B. H. (1999). Effects of plate bending and fault strength at subduction zones on plate dynamics. J. Geophys. Res. 104 (B8), 17551–17571. doi:10.1029/1999jb900149
Copley, A., Avouac, J.P., Hollingsworth, J., and Leprince, S. (2011). The 2001 Mw 7.6 Bhuj earthquake, low fault friction, and the crustal support of plate driving forces in India. J. Geophys. Res. 116 (B8), B08405. doi:10.1029/2010jb008137
Copley, A., Avouac, J. P., and Royer, J. Y. (2010). India-Asia collision and the Cenozoic slowdown of the Indian plate: implications for the forces driving plate motions. J. Geophys. Res. 115 (B03410), 1–14. doi:10.1029/2009jb006634
Curray, J. R. (2005). Tectonics and history of the andaman sea region. J. Asian Earth Sci. 25 (1), 187–232. doi:10.1016/j.jseaes.2004.09.001
Dasgupta, S., Pande, P., Ganguly, D., Iqbal, Z., Sanyal, K., Venkataraman, N. V., et al. (2000). Seismotectonic atlas of India and its environs. Special Publication Series 59. Kolkata: Geological Survey of India, 87p.
Dattatrayam, R. S., Suresh, G., Baidya, P. R., Prakash, R., Gautam, J. L., Shukla, H. P., et al. (2014). Standards and methodologies of seismological data generation, processing and archival and guidelines for data sharing and supply. Proc. Indian Nat. Sci. Acad. 80 (3), 679. doi:10.16943/ptinsa/2014/v80i3/55143
DeMets, C., Gordon, R. G., Argus, D. F., and Stein, S. (1994). Effect of recent revisions to the geomagnetic reversal time scale on estimates of current plate motions. Geophy. Res. Lett. 21 (20), 2191–2194. doi:10.1029/94gl02118
Felzer, K. R. (2008). Simulated aftershock sequences for a M 7.8 earthquake on the southern San Andreas fault. Seismol. Res. Lett. 80 (1), 21–25. doi:10.1785/gssrl.80.1.21
Gahalaut, V. K., and Kundu, B. (2012). Possible influence of subduction ridges on the Himalayan arc and on the ruptures of great and major Himalayan earthquakes. Gondwana Res. 21 (4), 1080–1088. doi:10.1016/j.gr.2011.07.021
Geller, R. J. (1997). Earthquake prediction: a critical review. Geophys. J. Int. 131 (3), 425–450. doi:10.1111/j.1365-246x.1997.tb06588.x
Godin, L., and Harris, L. B. (2014). Tracking basement cross-strike discontinuities in the Indian crust beneath the Himalayan orogen using gravity data – relationship to upper crustal faults. Geophys. J. Int. 198 (1), 198–215. doi:10.1093/gji/ggu131
Goebel, T. H. W., Sammis, C. G., Becker, T. W., Dresen, G., and Schorlemmer, D. (2015). A comparison of seismicity characteristics and fault structure between stick–slip experiments and nature. Pure Appl. Geophys. 172 (8), 2247–2264. doi:10.1007/s00024-013-0713-7
Goebel, T. H. W., Schorlemmer, D., Becker, T. W., Dresen, G., and Sammis, C. G. (2013). Acoustic emissions document stress changes over many seismic cycles in stick–slip experiments. Geophys. Res. Lett. 40 (10), 2049–2054. doi:10.1002/grl.50507
Gordon, R. G. (2009). Lithospheric deformation in the equatorial Indian ocean: timing and Tibet. Geology 37 (3), 287–288. doi:10.1130/focus032009.1
Goswami, P. K. (2012). Geomorphic evidences of active faulting in the northwestern Ganga Plain, India: implications for the impact of basement structures. Geosci. J. 16 (3), 289–299. doi:10.1007/s12303-012-0030-7
Gutenberg, B., and Richter, C. F. (1954). Seismicity of the earth and associated phenomenon. Princeton, New Jersey: Princeton University Press.
Hauck, M. L., Nelson, K. D., Brown, L. D., Zhao, W., and Ross, A. R. (1998). Crustal structure of the Himalaya orogen at ∼90° east longitude from INDEPTH deep reflection profiles. Tectonics 17 (4), 481–500. doi:10.1029/98tc01314
Heimpel, M., and Malin, P. (1998). Aseismic slip in earthquake nucleation and self-similarity: evidence from Parkfield, California. Earth Planet. Sci.Lett. 157 (3-4), 249–254. doi:10.1016/s0012-821x(98)00035-1
Hetényi, G., Cattin, R., Berthet, T., Moigne, N. L., Chophel, J., Lechmann, S., et al. (2016). Segmentation of the Himalayas as revealed by arc-parallel gravity anomalies. Sci. Rep. 6 (1), 33866. doi:10.1038/srep33866
Kagan, Y. Y., and Knopoff, L. (1987). Statistical short-term earthquake prediction. Science 236 (4808), 1563–1567. doi:10.1126/science.236.4808.1563
Karunakaran, C., and Ranga Rao, A. (1979). Status of exploration for hydrocarbons in the Himalayan region—contribution to stratigraphy and structure. Geol. Sur. India Pub. 41, 1–66.
Khan, P. K., Ansari, M. A., and Mohanty, S. (2014). Earthquake source characteristics along the arcuate Himalayan belt: geodynamic implications. J. Earth Sys. Sci. 123 (5), 1013–1030. doi:10.1007/s12040-014-0456-6
Khan, P. K., Ansari, A., and Singh, D. (2017). Insights into the great Mw 7.9 april 25, 2015 Nepal earthquake. Curr. Sci. 113 (10), 2014. doi:10.18520/cs/v113/i10/2014-2020
Khan, P. K., Banerjee, J., Shamim, Sk., and Mohanty, M. (2018). Long-term seismic observations along Myanmar–Sunda subduction margin: insights for 2004 Mw > 9.0 earthquake. Int. J. Earth Sci. 107 (7), 2383–2392. doi:10.1007/s00531-018-1603-0
Khan, P. K., and Chakraborty, P. P. (2009). Bearing of plate geometry and rheology on shallow-focus mega thrust seismicity with special reference to 26 December 2004 Sumatra event. J. Asian Earth Sci. 34 (3), 480–491. doi:10.1016/j.jseaes.2008.07.006
Khan, P. K., Chakraborty, P. P., Tarafder, G., and Mohanty, S. (2012). Testing the intraplate origin of mega-earthquakes at subduction margins. Geosci. Front. 3 (4), 473–481. doi:10.1016/j.gsf.2011.11.012
Khan, P. K., and Chakraborty, P. P. (2007). The seismic b value and its correlation with Bouguer gravity anomaly over the Shillong plateau area: a new insight for tectonic implication. J. Asian Earth Sci. 29 (1), 136–147. doi:10.1016/j.jseaes.2006.02.007
Khan, P. K., Ghosh, M., Chakraborty, P. P., and Mukherjee, D. (2011). Seismic b-value and the assessment of ambient stress in Northeast India. Pure Appl. Geophys. 168 (10), 1693–1706. doi:10.1007/s00024-010-0194-x
Khan, P. K., Mohanty, S. P., Sinha, S., and Singh, S. (2016). Occurrences of large-magnitude earthquakes in the Kachchh region, Gujarat, western India: tectonic implications. Tectonophysics 679, 102–116. doi:10.1016/j.tecto.2016.04.044
Khan, P. K., Shamim, S., Mohanty, S. P., and Aggarwal, S. K. (2020). Change of stress patterns during 2004 MW 9.3 off‐Sumatra mega‐event: insights from ridge–trench interaction for plate margin deformation. Geol. J. 55 (1), 372–389. doi:10.1002/gj.3419
Klootwijk, C. T., Conaghan, P. J., and Powell, C. M. (1985). The Himalayan arc: large-scale continental subduction, oroclinal bending, and back-arc spreading. Earth Planet. Sci. Lett. 75 (2, 3), 316–319. doi:10.1016/0012-821x(85)90099-8
Kohlstedt, D. L., Keppler, H., and Rubie, D. C. (1996). Solubility of water in the α, β and γ phases of (Mg,Fe)2SiO4. Contri. Mineral. Pet. 123, 345–357. doi:10.1007/s004100050161
Lavé, J., and Avouac, J. P. (2000). Active folding of fluvial terraces across the siwaliks hills, Himalayas of central Nepal. J. Geophys. Res. 105 (B3), 5735–5770. doi:10.1029/1999jb900292
Le Fort, P. (1986). “Metamorphism and magmatism during the Himalayan collision,” in Collision tectonics. Editors M. P. Coward, and A. C. Ries (London: Geol. Soc., Special Publication), 19, 159–172.
Lyon-Caen, H., and Molnar, P. (1983). Constraints on the structure of the Himalaya from an analysis of gravity anomalies and a flexural model of the lithosphere. J. Geophys. Res. 88 (B10), 8171–8191. doi:10.1029/jb088ib10p08171
Makovsky, Y., Klemperer, S. L., Huang, L., and Lu, D.Project INDEPTH Team (1996). Structural elements of the southern Tethyan Himalaya crust from wide-angle seismic data. Tectonics 15 (5), 997–1005. doi:10.1029/96tc00310
Marshak, S., and Paulsen, T. (1997). Structural style, regional distribution, and seismic implications of midcontinent fault-and-fold zones, United States. Seismol. Res. Lett. 68 (4), 511–520. doi:10.1785/gssrl.68.4.511
Mendoza, M. M., Ghosh, A., Karplus, M. S., Klemperer, S. L., Sapkota, S. N., Adhikari, L. B., et al. (2019). Duplex in the main himalayan thrust illuminated by aftershocks of the 2015 Mw 7.8 gorkha earthquake. Nat. Geosci. 12 (12), 1018–1022. doi:10.1038/s41561-019-0474-8
Mignan, A. (2012). Functional shape of the earthquake frequency-magnitude distribution and completeness magnitude. J. Geophys. Res. Solid Earth. 117 (B8), B08302. doi:10.1029/2012jb009347
Mignan, A. (2011). Retrospective on the accelerating seismic release (ASR) hypothesis: controversy and new horizons. Tectonophysics 505 (1-4), 1–16. doi:10.1016/j.tecto.2011.03.010
Mignan, A., and Woessner, J. (2012). Estimating the magnitude of completeness in earthquake catalogs. Community Online Resour. Statistical Seism. Anal. 4, 1–45. doi:10.5078/corssa-00180805
Mohanty, S. (2011). Crustal stress and strain patterns in the Indian plate interior: implications for the deformation behaviour of a stable continent and its seismicity. Terra Nova. 23 (6), 407–415. doi:10.1111/j.1365-3121.2011.01027.x
Molchan, G. M. (1997). Earthquake prediction as a decision-making problem. Pure Appl. Geophys. 149 (1), 233–247. doi:10.1007/bf00945169
Naylor, M., Orfanogiannaki, K., and Harte, D. (2010). Exploratory data analysis: magnitude, space, and time. Community Online Resour. Stat. Seism. Anal. 3, 5, 7, 37. Available at: http://www.corssa.org. doi:10.5078/corssa-92330203
Ogata, Y., and Zhuang, J. (2006). Space-time ETAS models and an improved extension. Tectonophysics 413 (1, 2), 13–23. doi:10.1016/j.tecto.2005.10.016
Pacheco, J. F., Scholz, C. H., and Sykes, L. R. (1992). Changes in frequency–size relationship from small to large earthquakes. Nature 355 (6355), 71–73. doi:10.1038/355071a0
Patriat, P., and Achache, J. (1984). India-Eurasia collision chronology has implications for crustal shortening and driving mechanism for plates. Nature 311 (5987), 615–621. doi:10.1038/311615a0
Paul, H., Mitra, S., Bhattacharya, S. N., and Suresh, G. (2015). Active transverse faulting within underthrust Indian crust beneath the Sikkim Himalaya. Geophys. J. Int. 201 (2), 1070–1081. doi:10.1093/gji/ggv058
Peresan, A., and Gentili, S. (2018). Seismic clusters analysis in Northeastern Italy by the nearest-neighbor approach. Phys. Earth. Planet. Int. 274, 87–104. doi:10.1016/j.pepi.2017.11.007
Prakash, R., Suresh, G., and Gahalaut, V. K. (2020). Earthquake monitoring in India. Proc. Indian Natl. Sci. Acad. 86, 631–642. doi:10.16943/ptinsa/2020/49819
Quittmeyer, R. C., and Jacob, K. H. (1979). Historical and modern seismicity of Pakistan, Afghanistan, northern India, and southern Iran. Bull. Seismol. Soc. Am. 69 (3), 773–823.
Rivière, J., Lv, Z., Johnson, P. A., and Marone, C. (2018). Evolution of b-value during the seismic cycle: insights from laboratory experiments on simulated faults. Earth Planet. Sci. Lett. 482, 407–413. doi:10.1016/j.epsl.2017.11.036
Royer, J. Y., and Gordon, R. G. (1997). The motion and boundary between the Capricorn and Australian plates. Science 277 (5330), 1268–1274. doi:10.1126/science.277.5330.1268
Rydelek, P. A., and Sacks, I. S. (2003). Comment on “Minimum magnitude of completeness in earthquake catalogs: examples from Alaska, the Western United States, and Japan,” by Stefan Wiemer and Max Wyss. Bull. Seismol. Soc. Am. 93 (4), 1862–1867. doi:10.1785/0120020035
Rydelek, P. A., and Sacks, I. S. (1989). Testing the completeness of earthquake catalogs and the hypothesis of self-similarity. Nature 337, 251–253. doi:10.1038/337251a0
Scholz, C. H. (2015). On the stress dependence of the earthquake b value. Geophys. Res. Lett. 42 (5), 1399–1402. doi:10.1002/2014gl062863
Scholz, C. H. (1968). The frequency-magnitude relation of microfracturing in rock and its relation to earthquakes. Bull. Seismol. Soc. Am. 58 (1), 399–415.
Schorlemmer, D., Wiemer, S., and Wyss, M. (2005). Variations in earthquake-size distribution across different stress regimes. Nature 437 (7058), 539–542. doi:10.1038/nature04094
Schulte-Pelkum, V., Monsalve, G., Sheehan, A. F., Shearer, P., Wu, F., and Rajaure, S. (2019). Mantle earthquakes in the Himalayan collision zone. Geology 47 (9), 815–819. doi:10.1130/g46378.1
Selzer, C., Buiter, S. J. H., and Pfiffner, O. A. (2008). Numerical modeling of frontal and basal accretion at collisional margins. Tectonics 27 (3), TC3001. doi:10.1029/2007tc002169
Ghosh, S., Nandy, D. R., et al. (1991). Geothermal atlas of India. Geol. Surv. India, Spec. Publ. 19, 1–144.
Shi, Y., and Bolt, B. A. (1982). The standard error of the magnitude-frequency b-value. Bull Seismol. Soc. Am. 72 (5), 1677–1687.
Singh, R., Khan, P. K., and Singh, A. P. (2020). Earthquake source dynamics and kinematics of the EIS and adjoining regions. Acta Geophys. 68 (2), 337–355. doi:10.1007/s11600-020-00418-z
Sinha, S., and Mohanty, S. (2012). Spatial variation of crustal strain in the Kachchh region, India: implication on the Bhuj earthquake of 2001. J. Geodyn. 61 (1), 1–11. doi:10.1016/j.jog.2012.07.003
Sinha-Roy, S., Malhotra, G., and Mohanty, M. (1998). Geology of Rajasthan. Bangalore: Geol. Soc. India, 278.
Sobolev, G. A. (2011). Seismicity dynamics and earthquake predictability. Nat. Haz. Earth Sys. Sci. 11 (2), 445–458. doi:10.5194/nhess-11-445-2011
Spada, M., Tormann, T., Wiemer, S., and Enescu, B. (2013). Generic dependence of the frequency-size distribution of earthquakes on depth and its relation to the strength profile of the crust. Geophys. Res. Lett. 40 (4), 709–714. doi:10.1029/2012gl054198
Srivastav, S. K., Prakash, R., Dattatrayam, R. S., Arora, S. K., Bansal, B. K., and Bhattacharya, S. N. (2005). Configuration of an optimum seismological network for India. Mausam 56, 465–472.
Stein, S., Sella, G. F., and Okal, E. A. (2002). “The january 26, 2001 Bhuj earthquake and the diffuse western boundary of the Indian plate,” in Plate boundary zones. Geodynamics Series. Editors S. Stein, and R. Freymneller (Washington: American Geophysical Union), 30, 243–254.
Sykes, L. R., Shaw, B. E., and Scholz, C. H. (1999). Rethinking earthquake prediction. Pure Appl. Geophys. 155, 207–232. doi:10.1007/s000240050263
Tandon, S. K., Chakraborty, P. P., and Singh, V. (2014). “Geological and Tectonic framework of India: providing context to geomorphologic development,” in Landscapes and landforms of India. Editor V. S. Kale (Netherlands: Springer), 1–14.
Taylor, D. W. A., Snoke, J. A., Sacks, I. S., and Takanami, T. (1990). Nonlinear frequency magnitude relationships for the Hokkaido Corner, Japan. Bull. Seismol. Soc. Am. 80 (2), 340–353.
Tormann, T., Wiemer, S., and Hardebeck, J. (2012). Earthquake recurrence models fail when earthquakes fail to reset the stress field. Geophys. Res. Lett. 39 (18), L18310. doi:10.1029/2012gl052913
Tsapanos, T. M. (1990). b-values of two tectonic parts in the circum-Pacific belt. Pure App. Geophys. 134, 229–242. doi:10.1007/bf00876999
Urbancic, T. I., Trifu, C. I., Long, J. M., and Young, R. P. (1992). Space-time correlations of b values with stress release. Pure Appl. Geophys. 139, 449–462. doi:10.1007/bf00879946
Valdiya, K. S. (1976). Himalaya transverse faults and their parallelism with subsurface structures of North Indian planes. Tectonophys 32 (3), 353–386. doi:10.1016/0040-1951(76)90069-x
Valdiya, K. S. (2003). Reactivation of himalayan frontal fault: implications. Curr. Sci. 85(7), 1031–1040.
Vorobieva, I., Shebalin, P., and Narteau, C. (2016). Break of slope in earthquake size distribution and creep rate along the San Andreas Fault system. Geophs. Res. Lett. 43 (13), 6869–6875. doi:10.1002/2016gl069636
Wesnousky, S. G. (1994). The Gutenberg-Richter or characteristic earthquake distribution, Which is it?. Bull. Seismol. Soc. Am. 84, 1940–1959.
Wiemer, S., and Wyss, M. (2000). Minimum magnitude of complete reporting in earthquake catalogs: examples from Alaska, the Western United States, and Japan. Bull. Seismol. Soc. Am. 90 (4), 859–869. doi:10.1785/0119990114
Woessner, J., and Wiemer, S. (2005). Assessing the quality of earthquake catalogues: estimating the magnitude of completeness and its uncertainty. Bull. Seismol. Soc. Am. 95 (2), 684–698. doi:10.1785/0120040007
Keywords: Delhi-NCR, Kangra, Bhuj, clustering of seismicity, seismic b-value
Citation: Khan PK, Mohanty SP, Chakraborty PP and Singh R (2021) Earthquake Shocks Around Delhi-NCR and the Adjoining Himalayan Front: A Seismotectonic Perspective. Front. Earth Sci. 9:598784. doi: 10.3389/feart.2021.598784
Received: 25 August 2020; Accepted: 25 January 2021;
Published: 25 February 2021.
Edited by:
Antonella Peresan, National Institute of Oceanography and Applied Geophysics (Italy), ItalyReviewed by:
Pallabee Choudhury, Institute of Seismological Research, IndiaDenis Anikiev, German Research Centre for Geosciences, Helmholtz Centre Potsdam, Germany
Copyright © 2021 Khan, Mohanty, Chakraborty and Singh. This is an open-access article distributed under the terms of the Creative Commons Attribution License (CC BY). The use, distribution or reproduction in other forums is permitted, provided the original author(s) and the copyright owner(s) are credited and that the original publication in this journal is cited, in accordance with accepted academic practice. No use, distribution or reproduction is permitted which does not comply with these terms.
*Correspondence: Prosanta Kumar Khan, a2hhbnByb3NhbnRhMTk2NkBpaXRpc20uYWMuaW4=, a2hhbnByb3NhbnRhMTk2NkBnbWFpbC5jb20=