 Shuai Chen1
 Zelang Miao
 Qirong Li
- 1School of Geoscience and Info-Physics, Central South University, Changsha, China
- 2Department of Land Surveying and Geo-Informatics, The Hong Kong Polytechnic University, Kowloon, Hong Kong
- 3School of Traffic and Transportation Engineering, Changsha University of Science and Technology, Changsha, China
Machine learning with extensively labeled training samples (e.g., positive and negative data) has received much attention in terms of addressing earthquake-induced landslide susceptibility mapping (LSM). However, the extensive amount of labeled training data required by machine learning, particularly the precise negative data (i.e., non-landslide area), cannot be easily and efficiently collected. To address this issue, this study presents a one-class-classifier-based negative data generation method for rapid earthquake-induced LSM. First, an incomplete landslide inventory (i.e., positive data) was produced with the aid of change detection using before-and-after satellite images and the Geographic Information System (GIS). Second, a one-class classifier was utilized to compute the probability of landslide occurrence based on the incomplete landslide inventory followed by the negative data generation from the low landslide susceptibility areas. Third, the positive data as well as the generated negative data (i.e., non-landslide) were compounded to train a traditional binary classifier to produce the final LSM. Experimental results suggest that the proposed method is capable of achieving a result that is comparable to methods using the complete landslide inventory, and it displays good correspondence with recent landslide events, making it a suitable method for rapid earthquake-induced LSM. The findings in this study would be useful in regional disaster planning and risk reduction.
1 Introduction
Many mountainous areas in the world, such as southwest China, are prone to seismic events and, consequently, landslides (Fan et al., 2018; Cao et al., 2019). Seismic landslides are widely distributed and of large scales, and the damage they cause is often great. In addition, large earthquakes may change the local geological structure and create unstable slopes that may slide in the future (Huang and Li, 2014; Yunus et al., 2020). For instance, after the Wenchuan Mw 7.9 earthquake and Jiuzhaigou Mw 6.5 earthquake, many landslides occurred and brought about extensive damages to southwest China (Gorum et al., 2011; Fan et al., 2018). Therefore, timely monitoring of landslide susceptibility after the earthquake is very critical for post-earthquake rehabilitation and reconstruction as well as early disaster monitoring and prevention (Guzzetti et al., 2006).
Multiple methods have been designed for landslide susceptibility mapping (LSM). Field surveys are utilized with great frequency due to their high accuracy and robustness. This method, however, depends heavily on expert experience and is time-consuming and labor-intensive, so it is not suitable for regional/global LSM (Keefer, 2002). Furthermore, it is challenging for field surveys to map landslide susceptibility at full spatial coverage, particularly for some inaccessible areas. In recent years, automated and/or semi-automated LSM has been developed based on remote sensing technology and the Geographic Information System (GIS), and the methods include the heuristic method (Ruff and Czurda, 2008), deterministic method (Jibson, 1993; Jibson et al., 2000; Tsai et al., 2019), and machine learning method (Reichenbach et al., 2018). By use of the heuristic method, investigators rank and weigh the causative factors based on their importance in causing landslides. The result depends on the investigator’s understanding of the real causative factors, which may lead to subjective LSM results (Mandal and Mandal, 2018). The deterministic method employs the simplified and physically-based landslide modeling schemes to analyze the stability using simple limit equilibrium models (e.g., the Newmark model) or more sophisticated approaches. The accuracy of this method depends on the reliability of the geotechnical and hydrological input data (Dreyfus et al., 2013). The machine learning method comprehensively considers the correlation between landslide distribution and regional geological environment and thus obtains reliable landslide susceptibility map (Reichenbach et al., 2018). It also has the widest application in LSM among the three methods (Pourghasemi et al., 2018).
A complete and accurate coseismic landslide inventory map (LIM) is an important prerequisite for landslide susceptibility analysis. An ideal coseismic LIM would cover the entire earthquake-affected area, accurately locate all the landslides triggered by the earthquake, and depict the true shapes of landslides in the form of a vector polygon (Harp et al., 2011). The landslide distribution information from such inventories can then be used for the seismic landslide susceptibility analysis and other quantitative analyses (Tanyaş et al., 2017). However, it is difficult or even impossible to obtain a detailed and complete landslide inventory after an earthquake. On the one hand, due to the cloudy and rainy weather, the available optical images are limited and do not have sufficient spatial coverage for the whole earthquake area. On the other hand, a large earthquake often induces many landslides, which are widely distributed and often deeply seated. Existing technology thus faces challenges to mapping all these landslides quickly in the short time following the earthquake.
Besides the detailed LIM, massive labeled training data are also important for the machine learning methods. Most statistical learning methods for predicting landslide-prone distribution depend on data sets with both positive (landslide presence) and negative (landslide absence) data (Conoscenti et al., 2016). The positive data are relatively fixed and are mainly selected from the landslide body cells in the inventory. The negative data are usually uncertain and are randomly selected as individual pixels outside of the landslide body. Then, the LSM can be established using the machine learning models trained on both positive and negative data. To improve the LSM reliability, efforts have been made to optimize the selection strategy of negative data. First, we randomly select negative data from the non-landslide area or the area with a certain distance from the landslide body (Su et al., 2017). This is the most commonly used method for generating negative data, but it requires a complete LIM that covers all landslides. Besides, the earthquake changes the local geological structure, resulting in a lot of shatter mountains or unstable slopes, which still belong to the non-landslide area in LIM but are unsuitable to serve as the negative data. Secondly, we convert positive data into negative data by changing the feature space attribute information. The most representative method of this type is the target space exteriorization sampling (TSES) (Xiao et al., 2010). Since the negative data constructed by this method are from the feature space and the corresponding location cannot be found in the real world, it is difficult to conduct field verification. In addition, this method also requires a complete LIM. Lastly, generate the negative data by clustering analysis. This method clusters the data sets into multiple categories based on feature similarities and automatically generates negative data in the category that contains the fewest landslides. The commonly used clustering methods include the self-organizing map (SOM) (Huang et al., 2017) and similarity-based sampling (SBS) Zhu et al. (2019). Since this method is based on feature similarity, a complete LIM is still required to reflect the true feature space of seismic landslides.
All these negative data generation methods require a complete LIM, which is very difficult to obtain in a short time. It is easy to establish an incomplete LIM using remote sensing and GIS technologies. Thus, if the incomplete LIM can be used for generating reliable negative data, rapid LSM after the earthquake is possible. However, there are only a few studies on the LSM based on incomplete LIM, and this is due to the uncertainty in the generation of negative data (Chen et al., 2020). Therefore, efforts should be made on the generation of negative data based on incomplete LIM.
Based on the aforementioned analysis, this study presents a one-class-classifier-based negative data generation method for earthquake-induced LSM. Using the proposed method, we calculate the landslide susceptibility based on the incomplete LIM, and then automatically generate pseudo labeling of negative data from areas with low landslide susceptibility. After that, the generated negative data and the positive data (i.e., the incomplete LIM) are applied to train the traditional binary classifier to produce the final landslide susceptibility map. Figure 1 shows the flowchart of the presented method. The left of this study is organized as follows. Section 2 presents the study area and materials used in this study. Section 3 introduces the proposed one-class-classifier-based negative data generation method for earthquake-induced LSM. Section 4 presents the experimental results and discussions, and Section 5 draws some conclusions.
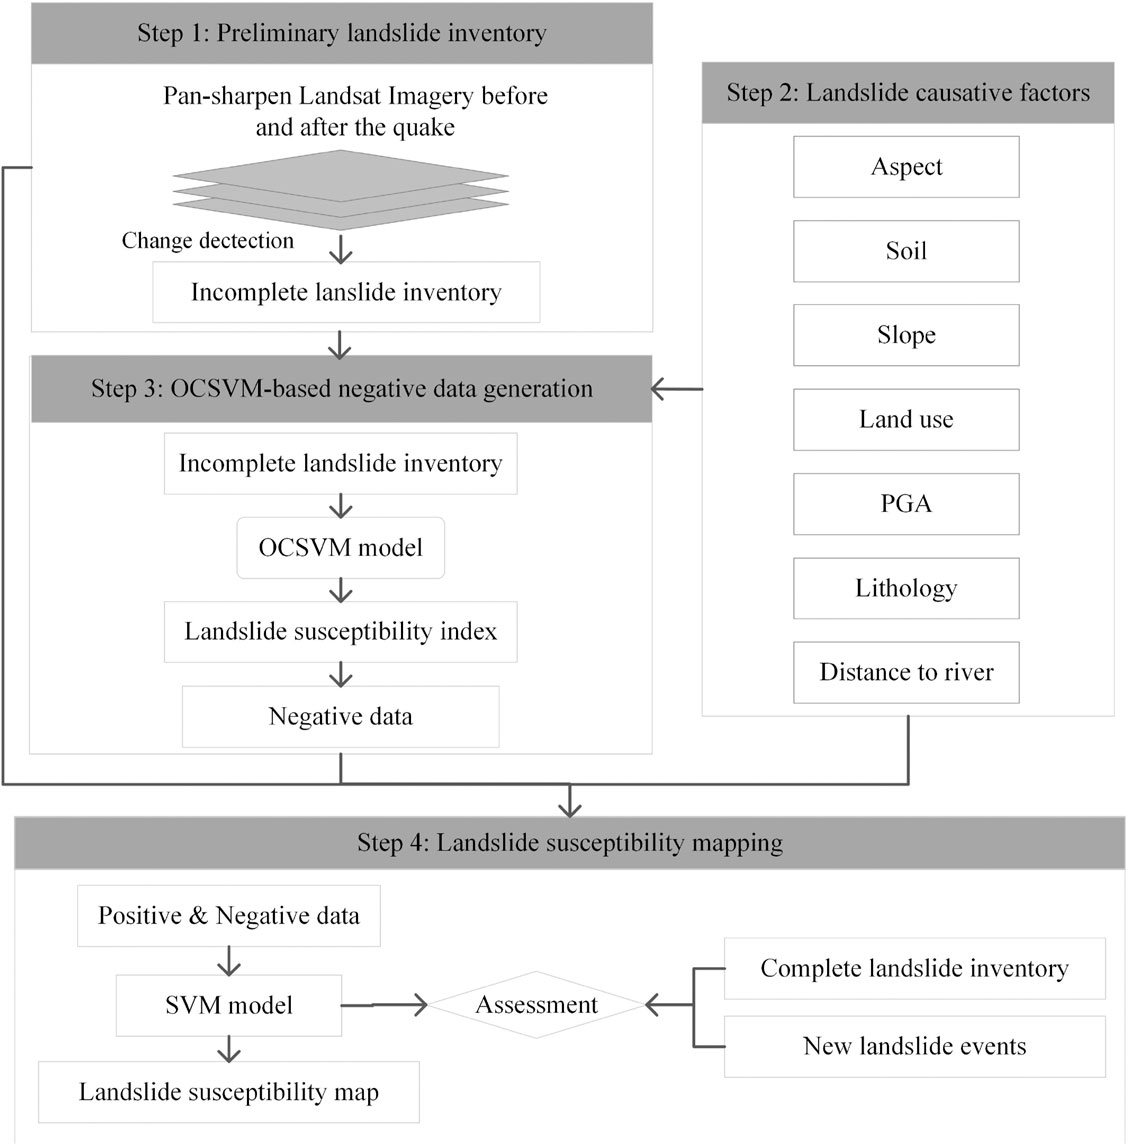
FIGURE 1. Flowchart of the presented method.
2 Study Area and Materials
Wenchuan, situated in Sichuan province, southwest China, has complex terrains and is the site of much intense neotectonic activity. The region features high ridges, lofty mountains, and crisscrossing gorges and valleys. The elevation fluctuates greatly from 782 m to 5,896 m. The neotectonic activities in this area are intense, and the Longmenshan thrust belt, which is composed of three main faults, namely, the Yingxiu-Beichuan fault, Guanxian-Anxian fault, and Mao-wen fault, runs across the whole of Wenchuan. Among them, the Yingxiu-Beichuan fault is inferred as the main structure of the 2008 earthquake (Li et al., 2008). The complex terrain and intense structure make this region a area prone to seismic and geological disasters (Wu et al., 2020). For instance, the 2008 Wenchuan Mw7.9 earthquake occurred in this region and induced a large number of coseismic landslides, see Figure 2.
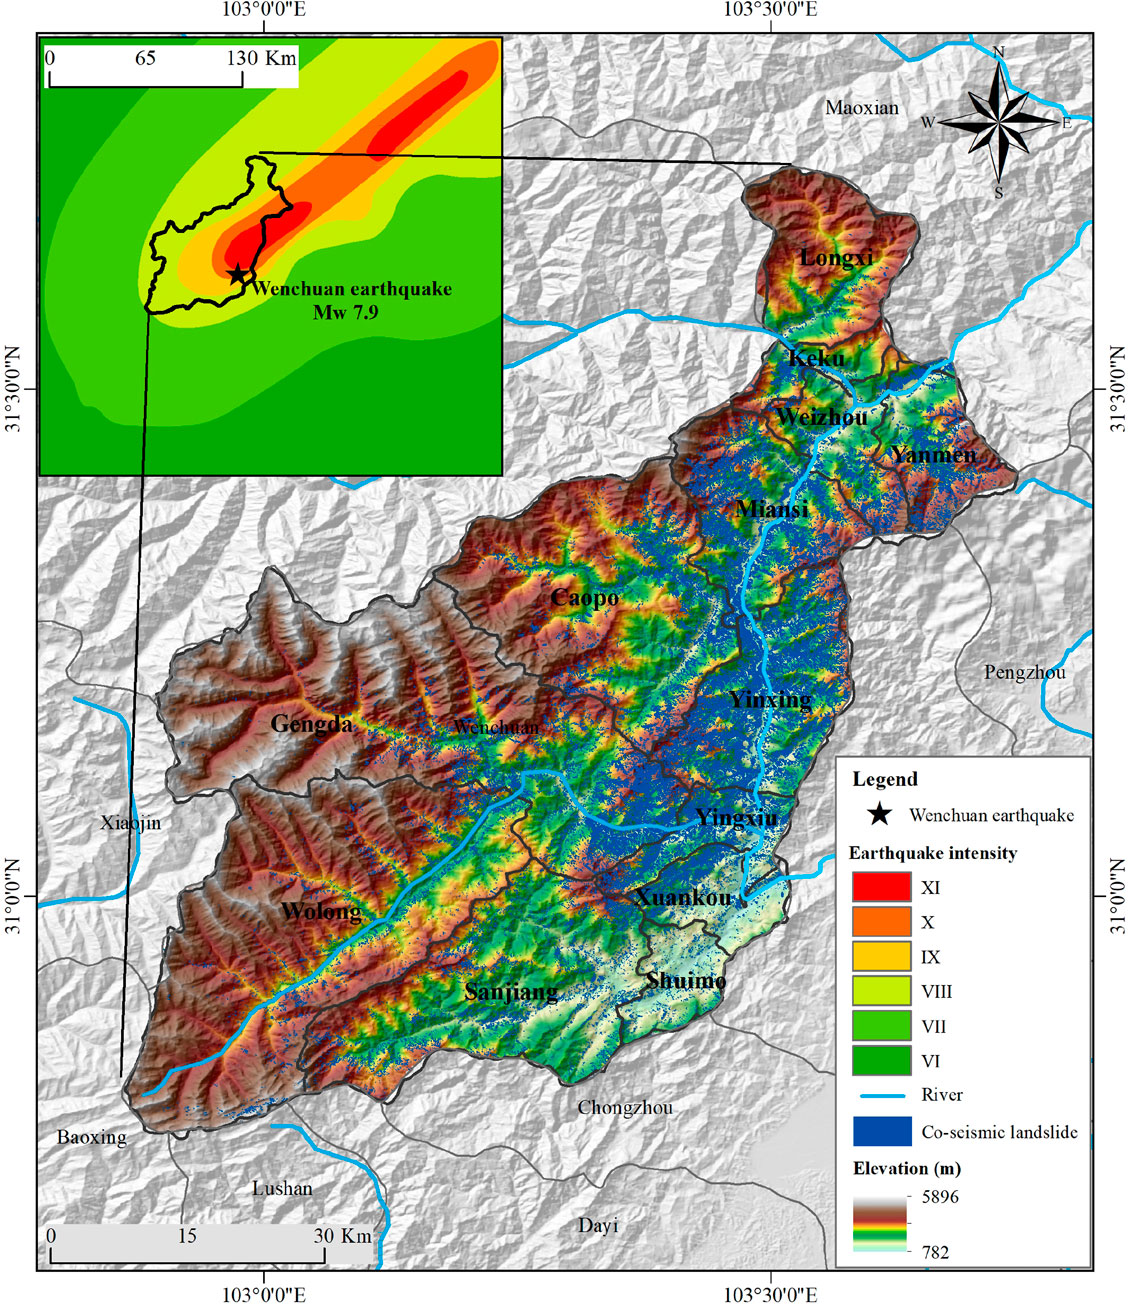
FIGURE 2. Distribution of coseismic landslides induced by the 2008 Wenchuan earthquake.
The data sources used in this study include pre- and post-earthquake Landsat 7 satellite images (acquisition dates: April 22, 2008, and May 25, 2008), a digital elevation model (DEM), river, lithology, land use, soil, peak ground acceleration (PGA), and the complete LIM (see Table 1). The slope and aspect were derived from the DEM. The complete LIM was produced by the integration of field survey and rigorous analysis of very-high-resolution satellite images acquired by multiple platforms/sensors (e.g., aerial photo, IKONOS, and QuickBird) (Xu et al., 2014). The post-earthquake images used for the complete landslide inventory ranged from May 23, 2008, to June 13, 2008. The acquisition date of images used for two landslide inventories have a substantial overlap, which compresses the influence of the area and spatial distribution differences of landslides caused by time.
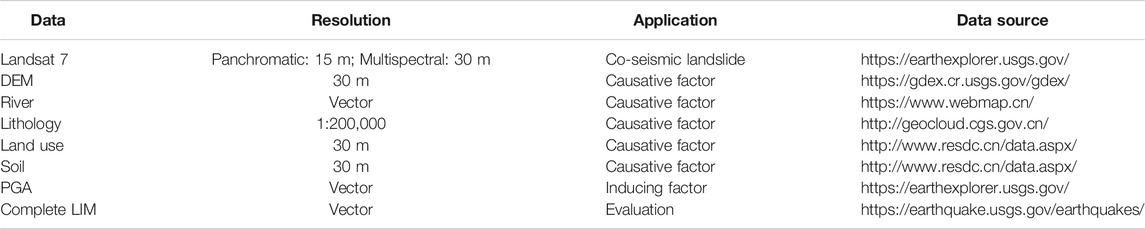
TABLE 1. Data sources used in this study.
3 Methodology
3.1 Data Preparation
3.1.1 Acquisition of the Incomplete LIM Through Change Detection
This study compares satellite images before and after the earthquake to extract the landslides by change detection. To reduce the influence of terrain, atmosphere, and sensors, these images are preprocessed through radiation correction, atmospheric correction, orthographic correction, image registration, and a cloud mask. As the landslides will cause surface damage, especially vegetation damage, the normalized difference vegetation index (NDVI) (Ramos-Bernal et al., 2018), sensitive to vegetation change, is adopted as the main feature for change detection. Finally, the change area is separated from the background by the image difference method (Fung, 1990) in which the threshold is determined by Eq. 3 (Lv et al., 2018).
where m and σ are the mean value and standard deviation corresponding to
Figure 3 shows the coseismic LIM obtained from multi-temporal Landsat images. This inventory contains most medium-large landslides but fails to detect landslides in cloudy areas. Besides, limited by the image resolution, this inventory does not include small landslides with an area less than 5,000
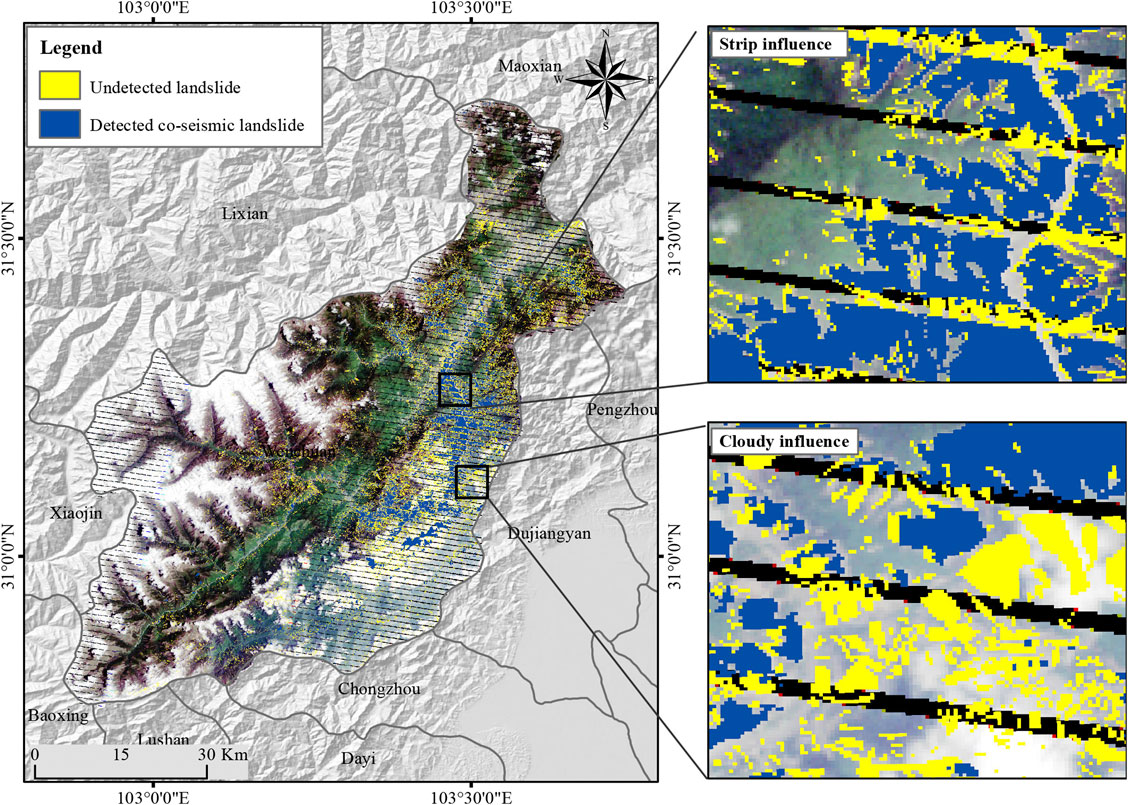
FIGURE 3. The incomplete LIM extracted from multi-temporal Landsat images.
3.1.2 Slope Unit Generation
Mapping units, fundamental to LSM (Van Den Eeckhaut et al., 2009; Erener and Düzgün, 2012), include the pixel unit, slope unit (SU), watershed, unique condition unit, and terrain unit (Reichenbach et al., 2018). The pixel unit and slope unit are more widely used than the other three types. The pixel unit is a regular raster unit and capable of processing the resolution differences of data sources using very simple operations. Despite its popularity, the pixel unit is difficult to work with in complex terrain and struggles to distinguish landslide sources from accumulation areas, impacting the performance of LSM. SU represents a slope or a part of a slope. Landslides are geological hazards that develop on slopes; the number of landslides that occur on a slope reflects the slope stability (Sun et al., 2020). Also, SU suppresses the bias introduced by the incomplete LIM (Reichenbach et al., 2018). Based on its advantages, we chose SU as the mapping unit.
This study applies the hydrological analysis of DEM to extract SUs, including the acquisition of positive and negative DEM, extraction of flow direction and accumulated flow, generation of the river network and watershed, and SU generation (Wang et al., 2017). In this process, the accumulative flow threshold corresponding to the river network is the key to obtaining satisfactory SUs. This study sets the optimal accumulative flow threshold through trial and error. To further improve the accuracy of SUs, we use GIS editing tools to manually adjust the boundaries of SUs and eliminate unqualified SUs. Finally, we get 1,351 SUs, see Figure 4.
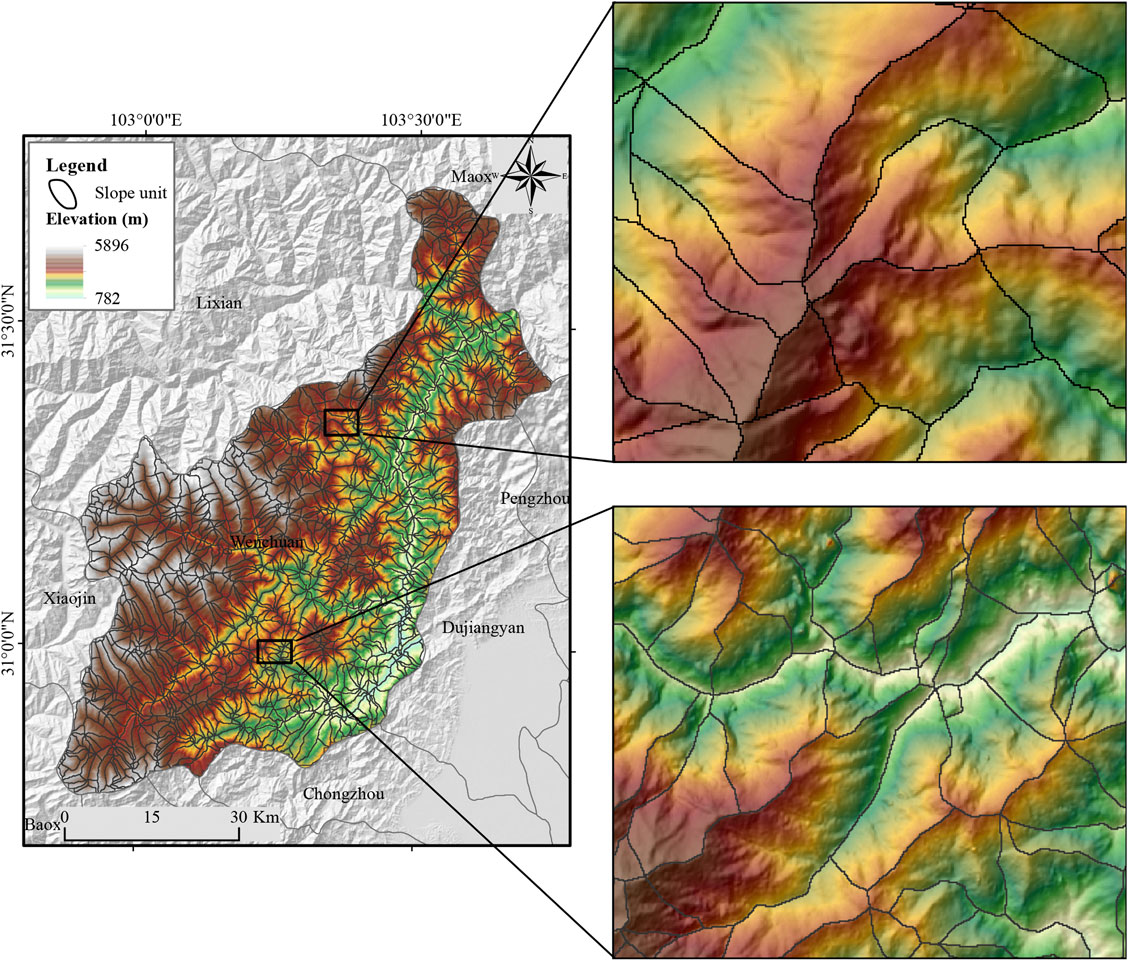
FIGURE 4. Slope units of the study area.
3.1.3 Selection of Causative Factors
A landslide is controlled by a series of causative factors (Pradhan and Lee, 2010), and thus accurately identifying the causative factors is critical for reliable LSM. Through analysis of the publication from 2005 to 2016 (Pourghasemi et al., 2018), this study selected the seven most widely used causative factors for earthquake-induced LSM in Wenchuan: slope angle, slope aspect, distance to river, lithology, soil, land use, and peak ground acceleration (PGA).
3.1.3.1 Slope Angle
Slope angle is a key factor that determines the failure of a landslide. Generally, slope angles between 30° and 40°are considered to be prone to landslides (Xu et al., 2014), as slope angles in this interval can enhance the shear force and surface water penetration, which provide favorable conditions for landslide occurrence. The slope information of the study area is obtained based on the digital elevation model (DEM), and the spatial analysis tool of ArcGIS is used to calculate the ratio of the maximum elevation difference between adjacent grids to the horizontal distance, which is the slope information of this grid. In this paper, the extracted slope information in the study area was divided into nine categories at an interval of 10°: 1) <10°; 2) 10–20°; 3) 20–30°; 4) 30–40°; 5) 40–50°; 6) 50–60°; 7) 60–70°; 8) 70–80°; and 9) >80°, see Figure 5A.
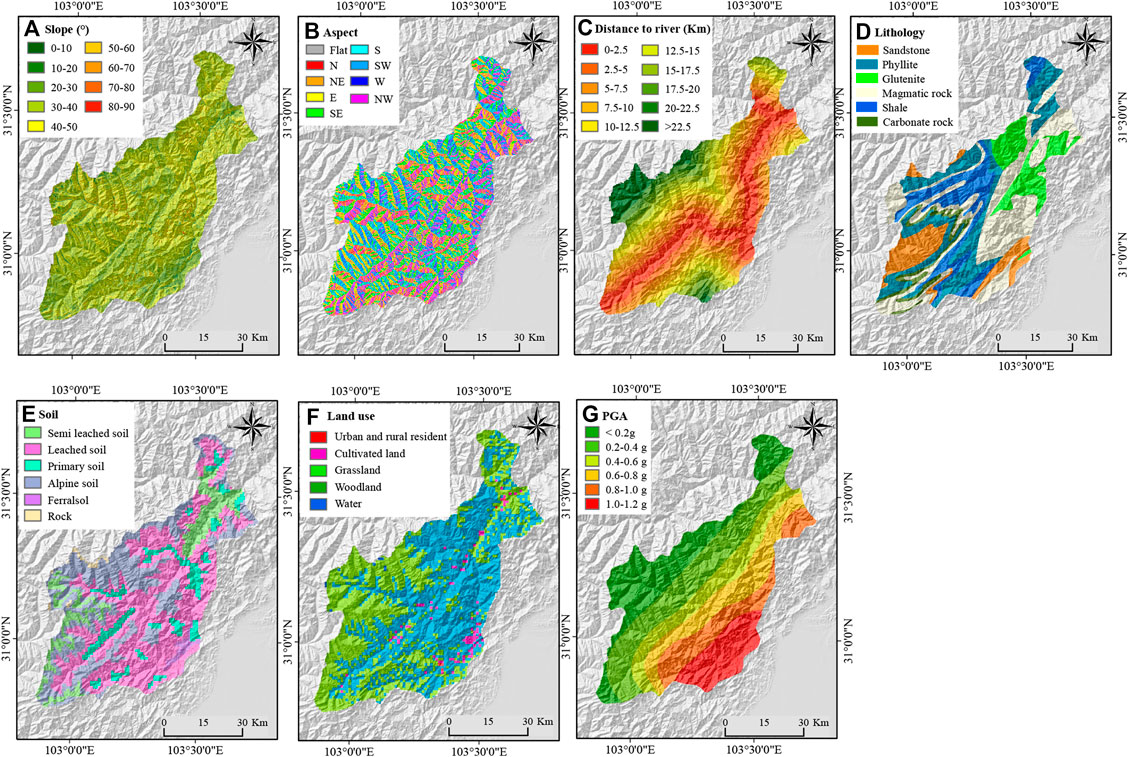
FIGURE 5. The landslide causative factors used in this study. (A) Slope, (B) Aspect, (C) Distance to river, (D) Lithology, (E) Soil, (F) Land use, (G) PGA.
3.1.3.2 Slope Aspect
The slope aspect also affects the distribution of coseismic landslides, as slopes with different aspects carry different seismic effects (Zhou et al., 2016). In addition, there are differences in sunshine and rock weathering in different slope aspects, which leads to obvious differences in coseismic landslides in different slope aspects. For example, the spatial distribution of coseismic landslides in Wenchuan shows that the east, southeast, and south are the dominant slope aspects of seismic landslides [1]. Based on the DEM, this paper uses the spatial analysis tool of GIS to identify the downhill direction with the largest change rate from the current grid to the upper value of its adjacent grid direction, namely, the slope aspect, and divides the slope aspect into nine groups: 1) Flat (-1); 2) N (North, 0–22.5°and 337.5–360°); 3) NE (Northeast, 22.5–67.5°); 4) E (East, 67.5–112.5°); 5) SE (Southeast, 112.5–157.5°); 6) S (South, 157.5–202.5°); 7) SW (Southwest, 202.5–247.5°); 8) W (West, 247.5–292.5°); and 9) NW (Northwest, 292.5–337.5°); see Figure 5B.
3.1.3.3 Distance to Rivers
The river controls the seismic landslide distribution through the action of groundwater and the erosion of water flow (Kamp et al., 2008). This study considers the distance between slopes and rivers and creates buffers around rivers to analyze the correlation between seismic landslides and their distance to rivers. According to the basic geographic information provided by the National Geographic Information System (NGIS), the initial river network in the study area was extracted. To guarantee the river network quality, we overlayed the initial river network on a cloud-free Landsat-5 mosaic in 2007 of the study area. We deleted parts of the initial river network that did not exhibit rivers on our Landsat mosaic images. Rivers exhibited on Landsat mosaic image but not on the initial river network were added to the initial river network. Finally, we divide the distance to rivers into 10 groups with a step of 2.5 km: 1) 0–2.5 km; 2) 2.5–5 km; 3) 5–7.5 km; 4) 7.5–10 km; 5) 10–12.5 km; 6) 12.5–15 km; 7) 15–17.5 km; (8)17.5–20 km; 9) 20–22.5 km, and (10) >22.5 km see Figure 5C.
3.1.3.4 Lithology
The lithology is considered to be another important factor in dealing with landslide susceptibility assessment and hazards (Reichenbach et al., 2018). Lithology influences the topographic character of the landscape and how seismic energy is transmitted, particularly through elastic and brittle/elastic properties of the rock, chemical weathering and its control of erosion and slope, fracture development and fault displacement, and seismic wave interactions with topography and lithological structures (Kargel et al., 2016). Using rock mass rating containing lithologic factors to conduct landslide hazard assessment is reasonable but, due to lack of enough field and laboratory data, cannot be applied to a large area (Tang et al., 2011). To determine the relative influence of bedrock lithology on the occurrence of landslides in a large area, the sensitivity index of the landslide occurrence of each rock type is calculated by comparing the landslide density in the area occupied by each rock type. In this paper, the relative influence of rock mass is determined by referring to the existing studies on Wenchuan earthquake landslides. The lithology data in the study area was generated by digitizing the hard copies of the 1:200,000 geological maps released by the China Geological Bureau. After that, the digitized lithology data were re-projected to WGS-84 coordinates and rasterized at 30 m resolution. Based on lithological similarities, the rock types were grouped into six classes, including 1) shale; 2) phyllite; 3) sandstone; 4) glutenite; 5) magmatic rock; and 6) carbonate rock, as shown in Figure 5D. The existing studies showed that the seismic landslides in hard rock layers, including magmatic rock, carbonate rock, and glutenite, were the most developed and that the development density of shale, phyllite, and sandstone were the second (Huang and Li, 2009; Li et al., 2013).
3.1.3.5 Soil
The composition of the soil determines the permeability of the soil, the better the permeability of the soil, the more conducive it is to flood discharge; generally, sand particles are coarser, as they do not as easily produce runoff or small flow. The permeability of clay is poor; it is easy to erode, and geological disasters are occur with relative ease. For instance, granular, nonplastic, and low plasticity soils are more susceptible than fine soils (Maharaj, 1993). The soil data were generated from 1:1,000,000 soil distribution data in China provided by the data processing center of the Chinese Academy of Sciences. Similar to the vectorization process of the lithology data, the digitized data of soil was re-projected to WGS-84 and re-sampled to 30 m. The study area mainly contains six soil types, including 1) semi-leached soil, 2) leached soil, 3) primary soil, 4) alpine soil, 5) ferralsol, and 6) rock, see Figure 5E.
3.1.3.6 Land Use
Human activities have changed the land surface and caused great damage to the natural environment, making it easier for landslides to form alongside earthquake disturbances. Studies have shown that there is a strong correlation between the distribution of landslides and land use. However, obtaining land use data at a specific time is exceedingly difficult. Based on the land use map of 2005 collected from the data processing center of the Chinese Academy of Sciences, the initial land use map of 2007 before the Wenchuan earthquake was obtained by combining supervised classification and visual interpretation with a cloud-free Landsat-5 mosaic image acquired in 2007. Supervised classification consists of three steps: 1) to select training samples for five land-use types by visual interpretation, 2) to train the support vector machine using the training samples and classify the whole Landsat-5 mosaic image, and 3) to repeat the classification steps five times and select the land-use map with the highest accuracy. We compare the classified land use map and the initial land use map to produce the most reliable land use map. The study area mainly includes five land-use types: 1) residential area; 2) cultivated land; 3) grassland; 4) the forest land; and 5) water, see Figure 5F.
3.1.3.7 PGA
The strong ground motion that causes short-lived disturbances in the balance of forces within hill slopes is the main reason for slope failure (Li et al., 2013). Strong ground motion directly induces coseismic landslides. PGA is simply the maximum peak acceleration on the acceleration time history curve recorded at a site in the earthquake. It is often used as a parameter to describe strong ground motion (Ma and Xu, 2019). Previous studies have shown that there is a positive correlation between PGA and seismic landslide, and the greater the PGA value, the easier it is to trigger a landslide (Xu et al., 2014). After the Wenchuan earthquake, according to the ground motion peak recorded by the seismic sensor, the United States Geological Survey (USGS) established the PGA map of Wenchuan by interpolation method, field amplification correction, and ground motion attenuation model. In this paper, the latest PGA was download from USGS website, and the study area was divided into six groups, including:1) <0.2 g, 2) 0.2–0.4 g, 3) 0.4–0.6 g, 4) 0.6–0.8 g, 5) 0.8–1 g, and 6) >1 g, see Figure 5G.
3.1.4 Multi-Collinearity Analysis of Landslide Causative Factors
Landslide causative factors have intra-correlations, which increases the data dimension and affects the model reliability. To separate the influence of causative factors, we employ the tolerance and variance inflation factor (VIF) (Chen et al., 2019) to conduct a multicollinearity test. Tolerance and VIF are expressed as follows:
where
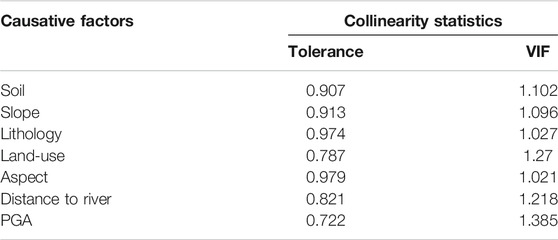
TABLE 2. Multicollinearity analysis for the landslide causative factors.
3.2 Negative Data Generation
Traditionally, negative data are randomly selected from the areas outside the LIM. However, non-landslide areas often contain a large number of unstable slopes, which are not identified in the LIM. Besides, there are also many unrecognized landslides in non-landslide areas. The unstable slopes and unrecognized landslides cannot be used to select negative data. To overcome these shortcomings, this study presents a one-class support vector machine (OCSVM) (Schölkopf et al., 2000) based negative data generation method. The OCSVM maps the samples from low dimension to high dimension space through the kernel function and finds the optimal hyperplane between the origin and the high dimension space. Specifically, the distance between the sample and the hyperplane indicates the correlation between the sample and a specific class. The decision function is defined as the following:
where
where
where
Selecting negative data from non-landslide areas is a commonly used method for LSM, but its feasibility relies on a complete LIM. By contrast, this study uses an incomplete LIM obtained by change detection to generate negative data. Suppose S represent the data sets of the study area.
To analyze the influence of different negative data generation strategies on LSM, we designed four negative data generation strategies:
1. Negative data
2. Negative data
3. Negative data
4. Negative data
3.3 LSM
The aforementioned steps produce training samples to train a statistical learning algorithm. The support vector machine (SVM) is a common machine learning algorithm that is capable to build a stable and reliable statistical model with a small number of samples (Suykens and Vandewalle, 1999). Therefore, this study selects SVM to compute the landslide susceptibility values for SUs. The decision function is expressed as follows:
where ω is the support vector weight and b the intercept. To suppress the noise influence, the relaxation variables ξ is introduced, and the corresponding convex quadratic programming of SVM is expressed as follows:
where C represents the penalty coefficient. The optimal hyperplane can be obtained by converting the appeal planning problem into a dual problem that is expressed as follows:
where
3.4 Model Evaluation
The reliability of LSM is mainly determined by the accuracy of the model. But there is no uniform standard to assess the model accuracy. The common method is to use a set of independent data sets for accuracy assessment. Test sets reserved in the early data preparation phase are widely used for model evaluation (Irigaray et al., 2007; Dou et al., 2019). Considering that the data set used in this study is the incomplete LIM, and the actual complete LIM does not participate in the model construction, the complete LIM is taken as the test set for model evaluation.
Receiver operating characteristics (ROC) is an important tool for model evaluation (Swets, 1988). It calculates the true positive rate and false positive rate of the model according to different discriminant standards and draws a curve with the true positive rate and the false positive rate as the x-axis and the y-axis, respectively. The area under the curve (AUC), generally between 0.5-1, is often used to reflect the model performance. The greater the AUC value, the better the model performance will be.
where TN, TP, FP, and FN represent true negative, true positive, false positive, and false negative, respectively.
As LSM reflects the landslide occurrence possibility in the earthquake-affected region (Guzzetti et al., 2006), this study counts the number of new landslides that occurred in the hazardous areas to further verify the model performance. To this end, this study collected 11 landslide events that occurred in the study area after 2008 from the website of the China Geological Survey (referred to as new landslides hereafter). The higher number of new landslides in hazardous areas of LSM, the better the model performance will be. In this study, the hazardous areas include areas with extremely high susceptibility, high susceptibility, and moderate susceptibility levels.
4 Experimental Results
4.1 Evaluation of the Reliability of the Negative Data Generation Method Based on OCSVM
Figure 6 shows the LSM derived from OCSVM. It can be seen that 88.02
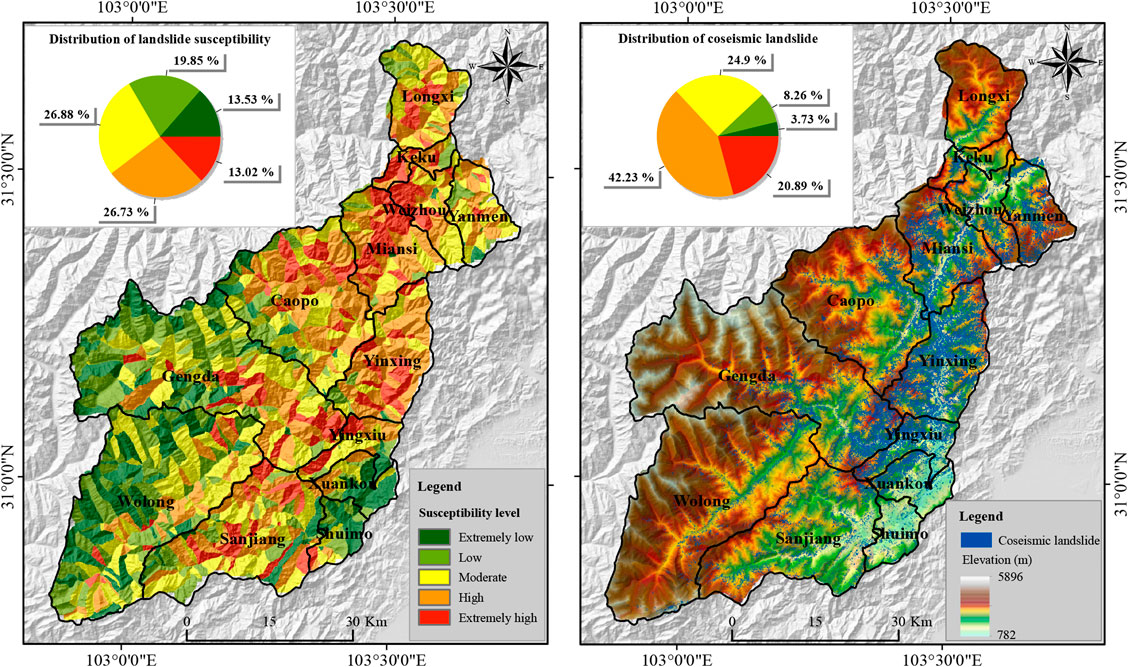
FIGURE 6. Landslide susceptibility map generated by OCSVM.
4.2 Accuracy Assessment of LSMs Derived From Different Strategies
Figure 7 shows the landslide susceptibility maps produced by SVM based on different training sample sets. The hazard area percentages of four methods ranges from 46.70
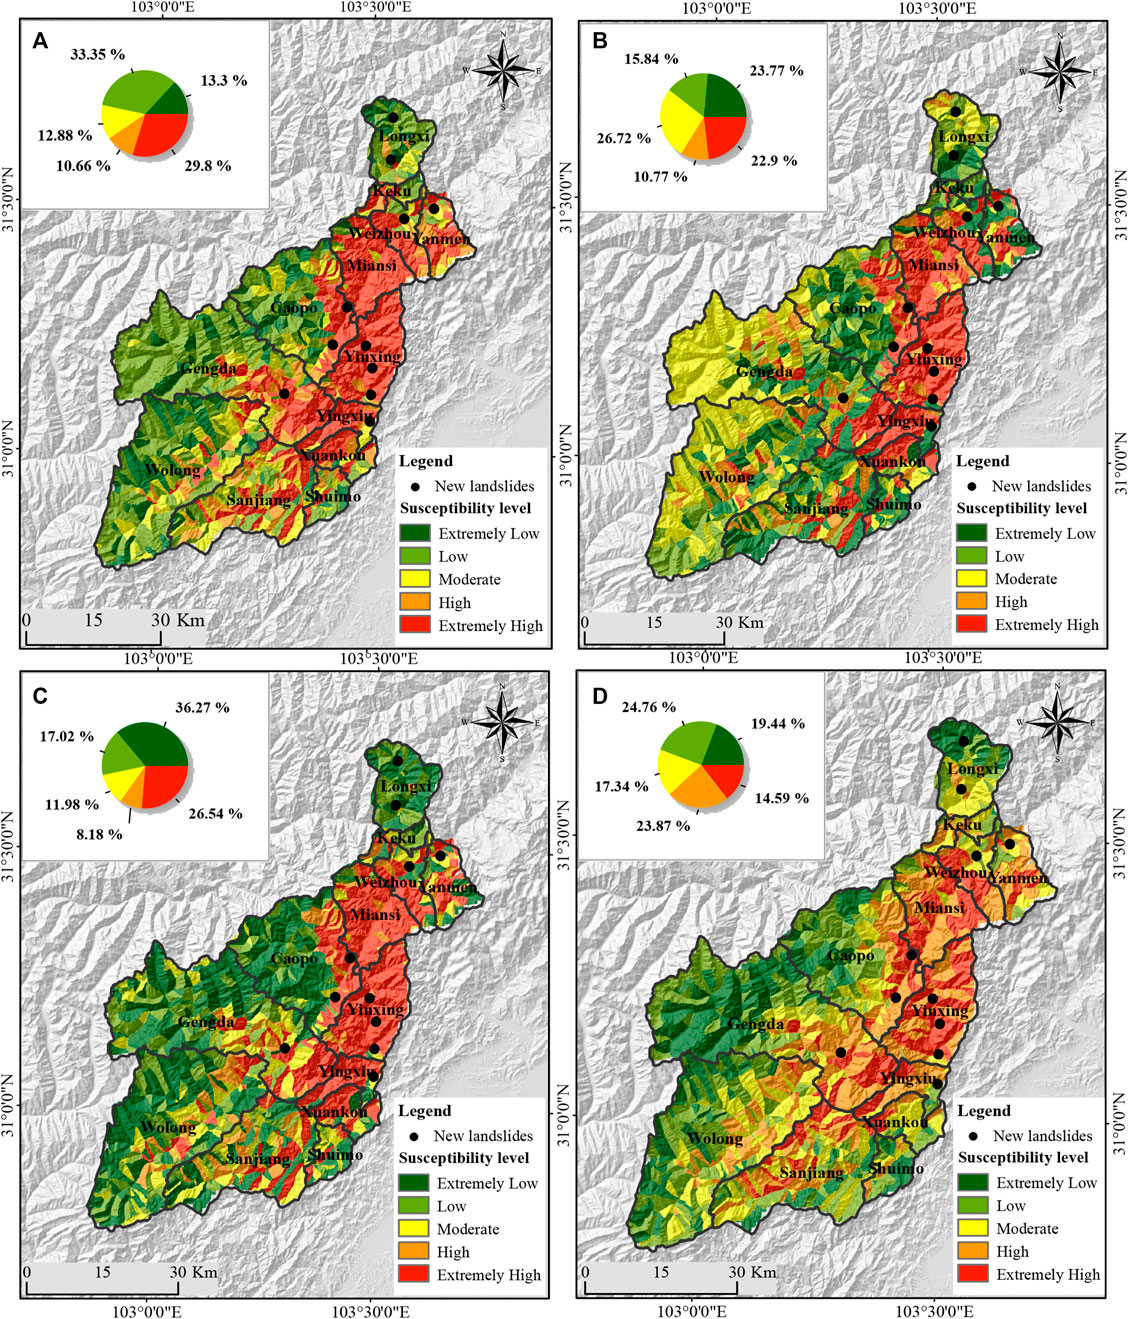
FIGURE 7. Landslide susceptibility map obtained based on the SVM using different negative data: (A)
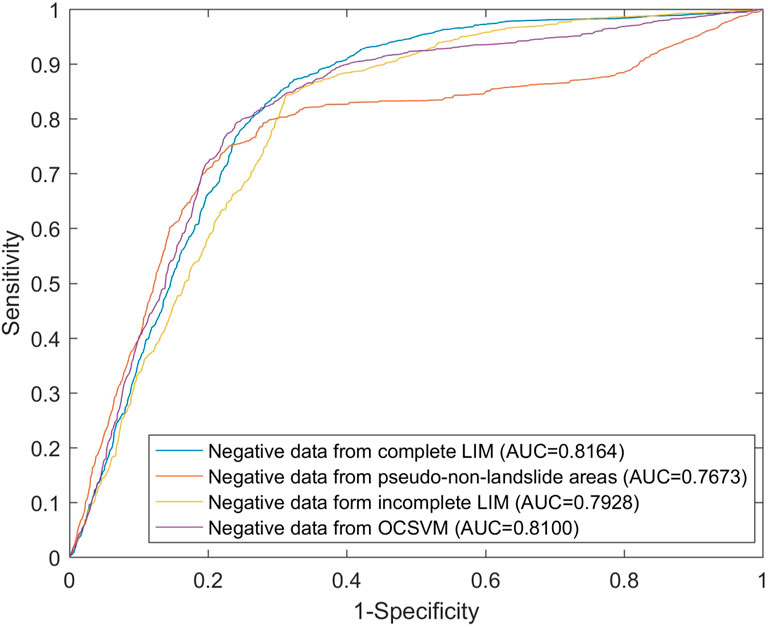
FIGURE 8. ROC curves of four negative data generation strategies.
This study applies the natural break classification to divide the landslide susceptibility into five levels: extremely high, high, moderate, low, and extremely low susceptibility. By overlaying the actual coseismic landslide distribution (i.e., the complete LIM), the areas of different landslide susceptibility levels and corresponding coseismic landslide areas were computed. Table 3 shows that the evaluation results corresponding to different negative data sets are quite different, and thus the negative data generation strategy has an essential influence on the performance of LSM. Specifically, for negative data
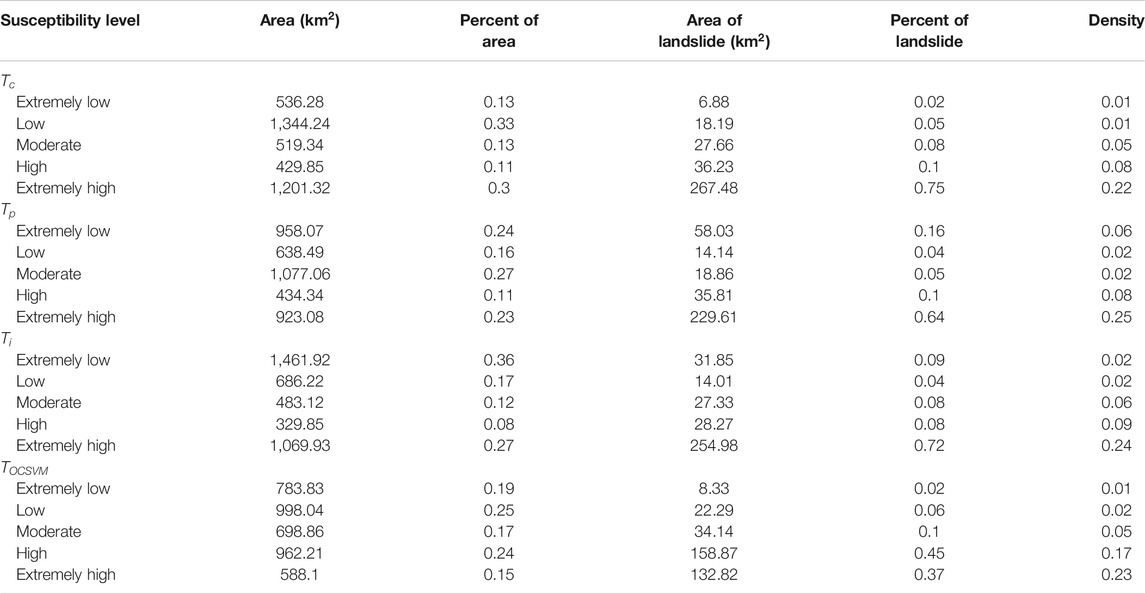
TABLE 3. Landslide susceptibility levels and density of landslides in the study area.
To analyze the site scale accuracy of the LSMs generated from different negative data, we took towns and villages as the subarea unit. We calculated the ratio of coseismic landslide to the hazardous areas in each subarea. Table 4 shows the percentage of the coseismic landslide distributed in the hazardous areas in each subarea. The landslide susceptibility maps show remarkable differences in towns and villages, especially the unrecognized landslide area in the incomplete LIM. Specifically, for the results of
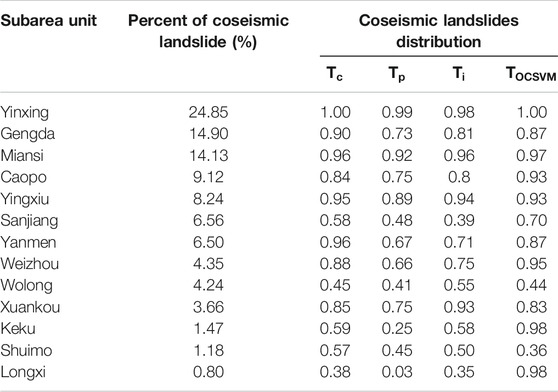
TABLE 4. The percentage of coseismic landslides in the hazardous areas of towns and villages detected by the LSM using different negative data.
We also applied 11 new landslides that occurred after 2008 to further verify the performance of LSM. Figure 7 shows the superposition of new landslides over the landslide susceptibility maps. We counted the number of new landslides that occurred in the hazardous areas to assess the LSM reliability. Table 5 shows that 9, 7, 9, and 10 new landslides occurred in the hazardous areas produced by
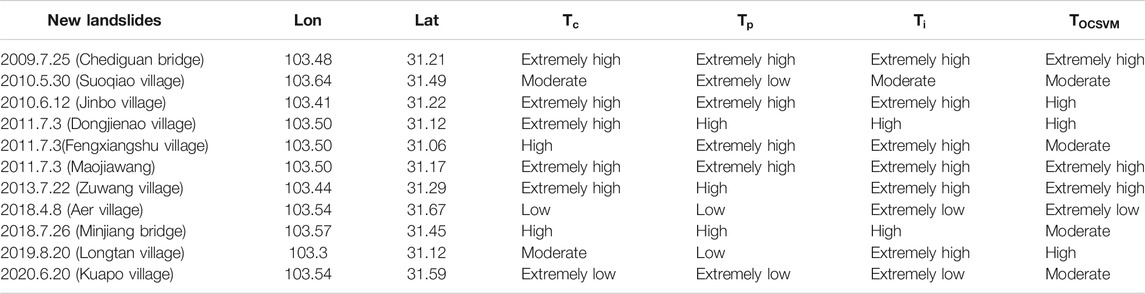
TABLE 5. LSM and new landslide events.
4.3 The Influence of One-Class Classifier Selection
To test the influence of one-class classifier (OCC) selection on the performance of LSM, another two benchmark OCCs, including SOM and TSES, are selected to compare with OCSVM. SOM is a kind of autonomic learning neural network without tutors. Its hierarchy consists of an input layer and competition layer (Huang et al., 2017). The input layer accepts external input variables, and the competition layer realizes clustering by analyzing and comparing the input variables. The data of one class have similar features, so the negative data can be generated by cluster analysis. In this study, five classes were selected as the final clustering results. TSES directly generates pseudo negative data based on positive data in feature space (Xiao et al., 2010). It exteriorizes positive data to become negative by replacing the value of one of its features with a new one outside the value range of this feature of all positive data.
We produced LSMs using the SVM based on different negative data sets generated by OCSVM, SOM, and TSES, respectively. The results are referred to as LSM-OCSVM, LSM-SOM, and LSM-TSES, see Figure 9. LSM-OCSVM is consistent with the distribution of coseismic landslides, suggesting the proposed OCSVM method gets high accuracy landslide susceptibility in the post-earthquake area. Most of the LSM-SOM is consistent with the coseismic landslide distribution. However, the results are quite different from the actual situation at the junction of Miansi Town and Yingxiu Town. The TSES-based method underestimates the degree of earthquake disturbance, so many coseismic landslides are in the low susceptibility area.
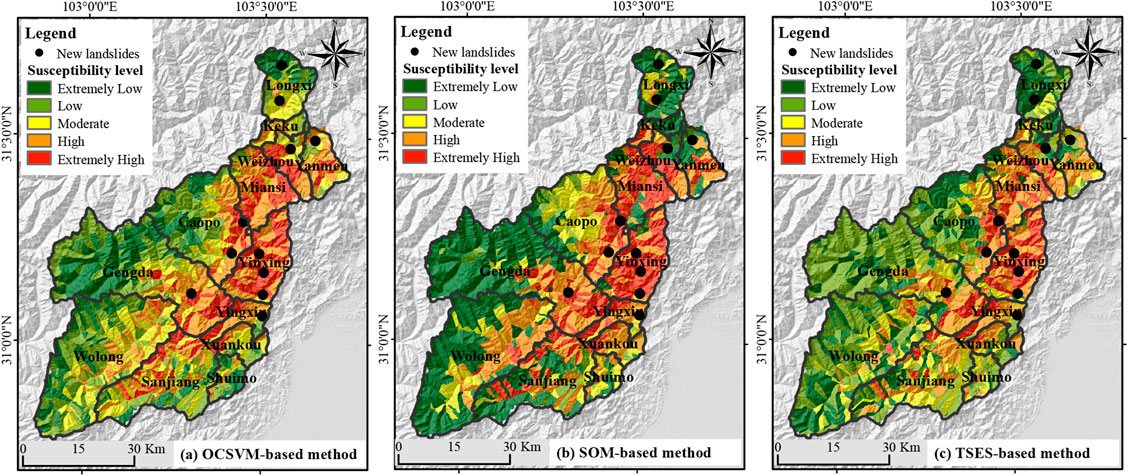
FIGURE 9. Landslide susceptibility maps produced by: (A) OCSVM-based method, (B) SOM-based method, and (C) TSES-based method.
To quantitatively evaluate the accuracy of the LSM obtained from different negative data generation strategies, we used the complete LIM to draw the ROC curves and calculate the corresponding AUC values. Figure 10 shows that AUC values of OCSVM, SOM, and TSES are 0.8100, 0.7909, and 0.7641, respectively. Among three OCCs, OCSVM achieves the highest AUC value and TSES the lowest value. This result suggests that the selection of OCC has an influence on the performance of LSM, and thus the OCC should be carefully selected. Table 6 shows the area percentage of coseismic landslides that occurred in the hazardous areas. The proposed OCSVM method has the highest value with a percentage of 92
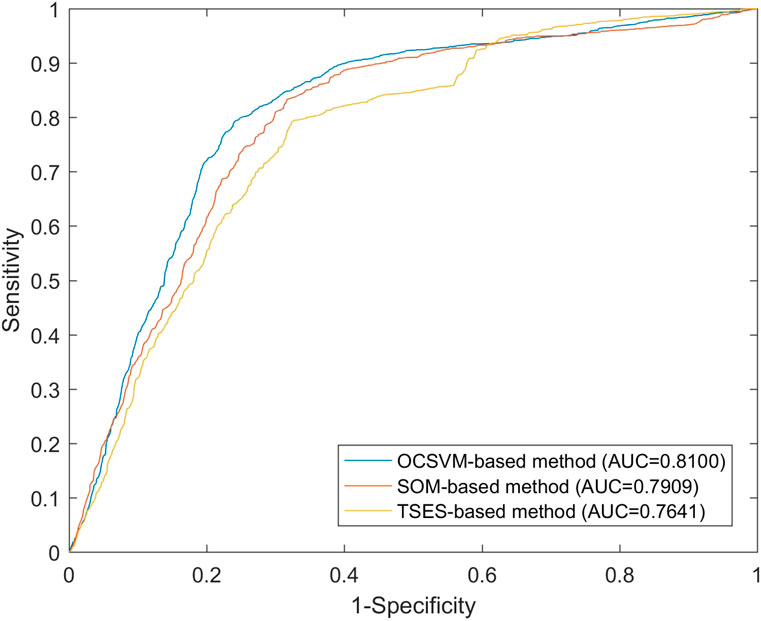
FIGURE 10. ROC curves of the presented method based on three OCCs.
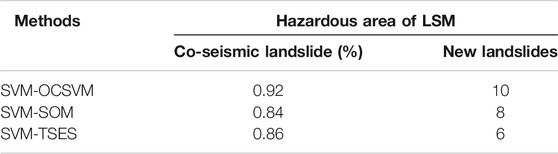
TABLE 6. The co-seismic landslide and new landslide events in the hazardous area of LSM with different negative data generation methods.
5 Discussion
A reliable and complete LIM is an important data source for rapid assessment of earthquake-induced landslides (Van Westen et al., 2008; Harp et al., 2011). As stated in the introduction, most statistical learning methods for predicting the distribution of landslide-prone areas depend on data sets with both positive (landslide presence) and negative (landslide absence) data (Hong et al., 2019). However, the complete LIM is difficult or impossible to obtain, which hampers the rapid LSM and hazard analysis after an earthquake (Reichenbach et al., 2018). By contrast, incomplete LIM is easy to obtain and is a potential data source for rapid LSM after an earthquake (Xu et al., 2013; Monsieurs et al., 2018; Chen et al., 2020; Du et al., 2020). The results of this paper show that satisfactory results of earthquake-induced LSM can also be obtained based on incomplete LIM provided that the negative data provided by the incomplete LIM is properly processed. Compared with earthquake-induced LSM based on the complete LIM, the approach by using incomplete LIM, proposed in this paper, has the advantages of high efficiency and low economic cost.
This study also finds that the one-class classifier can generate reliable negative data based on incomplete LIM. In this study, a comparative experiment is carried out for the uncertainty of negative data come from incomplete LIM. Compared with using complete LIM, the landslide susceptibility model has higher uncertainty when the negative data come from incomplete LIM, which is basically consistent with the existing research (Huang and Zhao, 2018; Dou et al., 2020b). However, the negative data generation method based on the one-class classifier can effectively reduce the uncertainty of the negative data and obtain a more stable and reliable model. Incomplete LIM provides negative data that may stem from unrecognized landslides, and false-negative data will reduce the reliability of the landslide susceptibility model. Even within the negative data obtained from complete LIM, there are inevitably unstable areas (Huang et al., 2017; Hong et al., 2019; Zhu et al., 2019), that is, the potential landslide areas in the deformation process. The data for such areas are between the negative data and the positive data, and simply taking them as negative data also increases the uncertainty of the samples. To overcome these challenges, the one-class classifier can construct a screening negative data model based on single class samples, which can eliminate the influence of unrecognized landslide area and potential landslide area and obtain more reliable negative data. Compared with other one-class classifiers, OCSVM can deal with complex nonlinear problems based on small sample data (Schölkopf et al., 2000), which can precisely represent the complex nonlinear relationship between seismic landslides and causative factors.
The performance of machine learning algorithms (e.g., SVM and OCSVM, which are used in this study) varies in accordance with topographic variables, suggesting that the patterns in causative factors are highly complex and variable for the different facets of causative factor attributes (e.g., spatial scale) (Chang et al., 2019). Thus, finding a general approach suitable for all regions and/or topographic variables is unlikely. And instead, evaluation of multiple machine learning algorithms (Merghadi et al., 2020; Wang et al., 2020) and/or ensemble of different machine learning algorithms (Dou et al., 2020a; Pham et al., 2020) should be standard procedure in developing satisfactory LSMs with highly complex landslide causative factors.
Focusing on overcoming the uncertainty of negative data that comes from an incomplete LIM, the method presented in this paper can quickly carry out seismic LSM under data-scarce environments conditions. Inevitably, some open problems require further study. First, we must find out how we can best define an incomplete LIM and explore the relationship between the completeness level of LIM and LSM performance, as these are not discussed in detail in this paper. In addition, the method presented in this paper is mainly based on incomplete LIM and is still a data-driven method. The quality of the results still depends on source data quality (Broeckx et al., 2018). With the rapid development of Synthetic Aperture Radar, 3D deformation information of earthquake-affected area can be obtained quickly after an earthquake, which can be effectively used to identify the hidden landslide area (Xie et al., 2020). More reliable negative data may be obtained by integrating the stable area in 3D deformation and the non-landslide area in LIM. More accurate LSM may be achieved by extending the proposed method based on OCSVM to incorporate such negative data with higher quality.
6 Conclusion
This study proposed a negative data generation method based on one class classifier, which can effectively make use of incomplete LIM. Based on the binary classifier established by the generated negative data, we performed LSM for the landslides of the 2008 Wenchuan earthquake. The reliability of the result was analyzed and verified using the coseismic landslides and new landslide events in the study area. The results show the following: 1) the two-class support vector machine is susceptible to the negative data, especially in the absence of complete LIM, and the landslide susceptibility model/mapping obtained from different negative data are quite different; 2) an incomplete LIM is easy to obtain, which is important data for rapid evaluation of landslide susceptibility; 3) the method presented in this study can effectively reduce the uncertainty of negative data and can significantly improve the performance of the landslide susceptibility model even without complete LIM. To sum up, the method in this study can be used to evaluate the landslide susceptibility quickly after the earthquake and provide an important reference for emergency rescue and land planning in post-earthquake regions.
Data Availability Statement
The original contributions presented in the study are included in the article/Supplementary Material, further inquiries can be directed to the corresponding author.
Author Contributions
ZM, LW, and SC proposed and participated in designing the study; SC, ZM, AZ and QL designed the study, analyzed the data and wrote the manuscript; AZ and YH participated in designing the study and improved the paper; AZ polished the paper. All authors approved the final version of the manuscript.
Funding
This work was supported in part by the National Key R& D Program of China under Grant 2018YFC15035, in part by National Natural Science Foundation of China under Grant 41701500 and Grant 41930108, in part by the Natural Science Foundation of Hunan Province under Grant 2018JJ3641 and Grant 2019JJ60001, in part by Talents Gathering Program of Hunan Province under Grant 2018RS3013, in part by Innovation-Driven Project of Central South University under Grant 2020CX036, in part by Early-Stage Research Start-up Grants funded by Central South University under Grant 502045001 and Grant 506030101, and in part by Natural Science Foundation of Jiangsu Province (BK20190785).
Conflict of Interest
The authors declare that the research was conducted in the absence of any commercial or financial relationships that could be construed as a potential conflict of interest.
Acknowledgments
The authors would like to thank two reviewers for their constructive comments that greatly improve this article.
References
Broeckx, J., Vanmaercke, M., Duchateau, R., and Poesen, J. (2018). A data-based landslide susceptibility map of africa. Earth-Science Rev. 185, 102–121. doi:10.1016/j.earscirev.2018.05.002
Cao, J., Zhang, Z., Wang, C., Liu, J., and Zhang, L. (2019). Susceptibility assessment of landslides triggered by earthquakes in the western sichuan plateau. Catena 175, 63–76. doi:10.1016/j.catena.2018.12.013
Chang, C.-C., and Lin, C.-J. (2011). Libsvm. ACM Trans. Intell. Syst. Technol. 2, 1–27. doi:10.1145/1961189.1961199
Chang, K.-T., Merghadi, A., Yunus, A. P., Pham, B. T., and Dou, J. (2019). Evaluating scale effects of topographic variables in landslide susceptibility models using gis-based machine learning techniques. Scientific Rep. 9, 1–21. doi:10.1038/s41598-019-48773-2
Chen, S., Miao, Z., Wu, L., and He, Y. (2020). Application of an incomplete landslide inventory and one class classifier to earthquake-induced landslide susceptibility mapping. IEEE J. Sel. Top. Appl. Earth Observations Remote Sensing 13, 1649–1660. doi:10.1109/jstars.2020.2985088
Chen, W., Yan, X., Zhao, Z., Hong, H., Bui, D. T., and Pradhan, B. (2019). Spatial prediction of landslide susceptibility using data mining-based kernel logistic regression, naive bayes and rbfnetwork models for the long county area (China). Bull. Eng. Geol. Environ. 78, 247–266. doi:10.1007/s10064-018-1256-z
Conoscenti, C., Rotigliano, E., Cama, M., Caraballo-Arias, N. A., Lombardo, L., and Agnesi, V. (2016). Exploring the effect of absence selection on landslide susceptibility models: a case study in sicily, Italy. Geomorphology 261, 222–235. doi:10.1016/j.geomorph.2016.03.006
Dou, J., Yunus, A. P., Bui, D. T., Merghadi, A., Sahana, M., Zhu, Z., et al. (2020a). Improved landslide assessment using support vector machine with bagging, boosting, and stacking ensemble machine learning framework in a mountainous watershed, Japan. Landslides 17, 641–658. doi:10.1007/s10346-019-01286-5
Dou, J., Yunus, A. P., Merghadi, A., Shirzadi, A., Nguyen, H., Hussain, Y., et al. (2020b). Different sampling strategies for predicting landslide susceptibilities are deemed less consequential with deep learning. Sci. total Environ. 720, 137320. doi:10.1016/j.scitotenv.2020.137320
Dou, J., Yunus, A. P., Tien Bui, D., Sahana, M., Chen, C.-W., Zhu, Z., et al. (2019). Evaluating gis-based multiple statistical models and data mining for earthquake and rainfall-induced landslide susceptibility using the lidar dem. Remote Sensing 11, 638. doi:10.3390/rs11060638
Dreyfus, D., Rathje, E. M., and Jibson, R. W. (2013). The influence of different simplified sliding-block models and input parameters on regional predictions of seismic landslides triggered by the northridge earthquake. Eng. Geology. 163, 41–54. doi:10.1016/j.enggeo.2013.05.015
Du, J., Glade, T., Woldai, T., Chai, B., and Zeng, B. (2020). Landslide susceptibility assessment based on an incomplete landslide inventory in the jilong valley, tibet, Chinese himalayas. Eng. Geology. 270, 105572. doi:10.1016/j.enggeo.2020.105572
Erener, A., and Düzgün, H. S. B. (2012). Landslide susceptibility assessment: what are the effects of mapping unit and mapping method?. Environ. Earth Sci. 66, 859–877. doi:10.1007/s12665-011-1297-0
Fan, X., Scaringi, G., Xu, Q., Zhan, W., Dai, L., Li, Y., et al. (2018). Coseismic landslides triggered by the 8th August 2017 Ms 7.0 Jiuzhaigou earthquake (Sichuan, China): factors controlling their spatial distribution and implications for the seismogenic blind fault identification. Landslides 15, 967–983. doi:10.1007/s10346-018-0960-x
Fung, T. (1990). An assessment of tm imagery for land-cover change detection. IEEE Trans. Geosci. remote sensing 28, 681–684. doi:10.1109/igarss.1989.577758
Gorum, T., Fan, X., van Westen, C. J., Huang, R. Q., Xu, Q., Tang, C., et al. (2011). Distribution pattern of earthquake-induced landslides triggered by the 12 may 2008 wenchuan earthquake. Geomorphology 133, 152–167. doi:10.1016/j.geomorph.2010.12.030
Guzzetti, F., Reichenbach, P., Ardizzone, F., Cardinali, M., and Galli, M. (2006). Estimating the quality of landslide susceptibility models. Geomorphology 81, 166–184. doi:10.1016/j.geomorph.2006.04.007
Harp, E. L., Keefer, D. K., Sato, H. P., and Yagi, H. (2011). Landslide inventories: the essential part of seismic landslide hazard analyses. Eng. Geology. 122, 9–21. doi:10.1016/j.enggeo.2010.06.013
Hong, H., Miao, Y., Liu, J., and Zhu, A.-X. (2019). Exploring the effects of the design and quantity of absence data on the performance of random forest-based landslide susceptibility mapping. Catena 176, 45–64. doi:10.1016/j.catena.2018.12.035
Hong, H., Pradhan, B., Bui, D. T., Xu, C., Youssef, A. M., and Chen, W. (2017). Comparison of four kernel functions used in support vector machines for landslide susceptibility mapping: a case study at suichuan area (China). Geomatics, Nat. Hazards Risk 8, 544–569. doi:10.1080/19475705.2016.1250112
Huang, F., Yin, K., Huang, J., Gui, L., and Wang, P. (2017). Landslide susceptibility mapping based on self-organizing-map network and extreme learning machine. Eng. Geology. 223, 11–22. doi:10.1016/j.enggeo.2017.04.013
Huang, R., and Li, W. (2014). Post-earthquake landsliding and long-term impacts in the wenchuan earthquake area, China. Eng. Geology. 182, 111–120. doi:10.1016/j.enggeo.2014.07.008
Huang, R. Q., and Li, W. L. (2009). Analysis of the geo-hazards triggered by the 12 may 2008 wenchuan earthquake, China. Bull. Eng. Geol. Environ. 68, 363–371. doi:10.1007/s10064-009-0207-0
Huang, Y., and Zhao, L. (2018). Review on landslide susceptibility mapping using support vector machines. Catena 165, 520–529. doi:10.1016/j.catena.2018.03.003
Irigaray, C., Fernández, T., El Hamdouni, R., and Chacón, J. (2007). Evaluation and validation of landslide-susceptibility maps obtained by a gis matrix method: examples from the betic cordillera (southern Spain). Nat. Hazards 41, 61–79. doi:10.1007/s11069-006-9027-8
Jibson, R. W., Harp, E. L., and Michael, J. A. (2000). A method for producing digital probabilistic seismic landslide hazard maps. Eng. Geology. 58, 271–289. doi:10.1016/s0013-7952(00)00039-9
Jibson, R. W. (1993). Predicting earthquake-induced landslide displacements using newmark’s sliding block analysis. Transportation Res. Rec. 1411, 9–17.
Kamp, U., Growley, B. J., Khattak, G. A., and Owen, L. A. (2008). Gis-based landslide susceptibility mapping for the 2005 kashmir earthquake region. Geomorphology 101, 631–642. doi:10.1016/j.geomorph.2008.03.003
Kargel, J. S., Leonard, G. J., Shugar, D. H., Haritashya, U. K., Bevington, A., Fielding, E. J., et al. (2016). Geomorphic and geologic controls of geohazards induced by nepals 2015 gorkha earthquake. Science 351, 8353. doi:10.1126/science.aac8353
Keefer, D. K. (2002). Investigating landslides caused by earthquakes–a historical review. Surv. Geophys. 23, 473–510. doi:10.1023/a:1021274710840
Li, W.-l., Huang, R.-q., Tang, C., Xu, Q., and van Westen, C. (2013). Co-seismic landslide inventory and susceptibility mapping in the 2008 wenchuan earthquake disaster area, China. J. Mt. Sci. 10, 339–354. doi:10.1007/s11629-013-2471-5
Li, X., Zhou, Z., Yu, H., Wen, R., Lu, D., Huang, M., et al. (2008). Strong motion observations and recordings from the great wenchuan earthquake. Earthquake Eng. Eng. Vibration 7, 235–246. doi:10.1007/s11803-008-0892-x
Lv, Z. Y., Shi, W., Zhang, X., and Benediktsson, J. A. (2018). Landslide inventory mapping from bitemporal high-resolution remote sensing images using change detection and multiscale segmentation. IEEE J. Sel. Top. Appl. Earth Observations Remote Sensing 11, 1520–1532. doi:10.1109/jstars.2018.2803784
Ma, S., and Xu, C. (2019). Assessment of co-seismic landslide hazard using the Newmark model and statistical analyses: a case study of the 2013 Lushan, China, Mw6.6 earthquake. Nat. Hazards 96, 389–412. doi:10.1007/s11069-018-3548-9
Maharaj, R. J. (1993). Landslide processes and landslide susceptibility analysis from an upland watershed: a case study from st. andrew, Jamaica, west indies. Eng. Geology. 34, 53–79. doi:10.1016/0013-7952(93)90043-c
Mandal, B., and Mandal, S. (2018). Analytical hierarchy process (ahp) based landslide susceptibility mapping of lish river basin of eastern darjeeling himalaya, India. Adv. Space Res. 62, 3114–3132. doi:10.1016/j.asr.2018.08.008
Merghadi, A., Yunus, A. P., Dou, J., Whiteley, J., ThaiPham, B., Bui, D. T., et al. (2020). Machine learning methods for landslide susceptibility studies: a comparative overview of algorithm performance. Earth-Science Rev. 207, 103225. doi:10.1016/j.earscirev.2020.103225
Monsieurs, E., Jacobs, L., Michellier, C., Basimike Tchangaboba, J., Ganza, G. B., Kervyn, F., et al. (2018). Landslide inventory for hazard assessment in a data-poor context: a regional-scale approach in a tropical african environment. Landslides 15, 2195–2209. doi:10.1007/s10346-018-1008-y
Pham, B. T., Nguyen-Thoi, T., Qi, C., Phong, T. V., Dou, J., Ho, L. S., et al. (2020). Coupling rbf neural network with ensemble learning techniques for landslide susceptibility mapping. Catena 195, 104805. doi:10.1016/j.catena.2020.104805
Pourghasemi, H. R., Yansari, Z. T., Panagos, P., and Pradhan, B. (2018). Analysis and evaluation of landslide susceptibility: a review on articles published during 2005–2016 (periods of 2005–2012 and 2013–2016). Arabian J. Geosciences 11, 193. doi:10.1007/s12517-018-3531-5
Pradhan, B., and Lee, S. (2010). Landslide susceptibility assessment and factor effect analysis: backpropagation artificial neural networks and their comparison with frequency ratio and bivariate logistic regression modelling. Environ. Model. Softw. 25, 747–759. doi:10.1016/j.envsoft.2009.10.016
Ramos-Bernal, R., Vázquez-Jiménez, R., Romero-Calcerrada, R., Arrogante-Funes, P., and Novillo, C. (2018). Evaluation of unsupervised change detection methods applied to landslide inventory mapping using aster imagery. Remote Sensing 10, 1987. doi:10.3390/rs10121987
Reichenbach, P., Rossi, M., Malamud, B. D., Mihir, M., and Guzzetti, F. (2018). A review of statistically-based landslide susceptibility models. Earth-Science Rev. 180, 60–91. doi:10.1016/j.earscirev.2018.03.001
Ruff, M., and Czurda, K. (2008). Landslide susceptibility analysis with a heuristic approach in the eastern alps (vorarlberg, Austria). Geomorphology 94, 314–324. doi:10.1016/j.geomorph.2006.10.032
Schölkopf, B., Williamson, R. C., Smola, A. J., Shawe-Taylor, J., and Platt, J. C. (2000). “Support vector method for novelty detection,” in Advances in neural information processing systems, 582–588.
Su, Q., Zhang, J., Zhao, S., Wang, L., Liu, J., and Guo, J. (2017). Comparative assessment of three nonlinear approaches for landslide susceptibility mapping in a coal mine area. Ijgi 6, 228. doi:10.3390/ijgi6070228
Sun, X., Chen, J., Han, X., Bao, Y., Zhan, J., and Peng, W. (2020). Application of a gis-based slope unit method for landslide susceptibility mapping along the rapidly uplifting section of the upper jinsha river, south-western China. Bull. Eng. Geol. Environ. 79, 533–549. doi:10.1007/s10064-019-01572-5
Suykens, J. A. K., and Vandewalle, J. (1999). Least squares support vector machine classifiers. Neural Process. Lett. 9, 293–300. doi:10.1023/a:1018628609742
Swets, J. (1988). Measuring the accuracy of diagnostic systems. Science 240, 1285–1293. doi:10.1126/science.3287615
Tang, C., Zhu, J., and Qi, X. (2011). Landslide hazard assessment of the 2008 wenchuan earthquake: a case study in beichuan area. Can. Geotech. J. 48, 128–145. doi:10.1139/T10-059
Tanyaş, H., Van Westen, C. J., Allstadt, K. E., Anna Nowicki Jessee, M., Görüm, T., Jibson, R. W., et al. (2017). Presentation and analysis of a worldwide database of earthquake-induced landslide inventories. J. Geophys. Res. Earth Surf. 122, 1991–2015. doi:10.1002/2017JF004236
Tsai, H.-Y., Tsai, C.-C., and Chang, W.-C. (2019). Slope unit-based approach for assessing regional seismic landslide displacement for deep and shallow failure. Eng. Geology. 248, 124–139. doi:10.1016/j.enggeo.2018.11.015
Van Den Eeckhaut, M., Reichenbach, P., Guzzetti, F., Rossi, M., and Poesen, J. (2009). Combined landslide inventory and susceptibility assessment based on different mapping units: an example from the flemish ardennes, Belgium. Nat. Hazards Earth Syst. Sci. 9, 507–521. doi:10.5194/nhess-9-507-2009
Van Westen, C. J., Castellanos, E., and Kuriakose, S. L. (2008). Spatial data for landslide susceptibility, hazard, and vulnerability assessment: an overview. Eng. Geology. 102, 112–131. doi:10.1016/j.enggeo.2008.03.010
Wang, F., Xu, P., Wang, C., Wang, N., and Jiang, N. (2017). Application of a gis-based slope unit method for landslide susceptibility mapping along the longzi river, southeastern Tibetan plateau, China. Ijgi 6, 172. doi:10.3390/ijgi6060172
Wang, W.-D., He, Z., Han, Z., and Li, Y. (2020). “Landslide susceptibility mapping based on the deep belief network: a case study in sichuan province, China,” in Workshop on world landslide forum (Springer), 201–213.
Wu, R., Zhang, Y., Guo, C., Yang, Z., Tang, J., and Su, F. (2020). Landslide susceptibility assessment in mountainous area: a case study of sichuan–tibet railway, China. Environ. Earth Sci. 79, 1–16. doi:10.1007/s12665-020-8878-8
Xiao, C., Tian, Y., Shi, W., Guo, Q., and Wu, L. (2010). A new method of pseudo absence data generation in landslide susceptibility mapping with a case study of shenzhen. Sci. China Technol. Sci. 53, 75–84. doi:10.1007/s11431-010-3219-x
Xie, M., Zhao, W., Ju, N., He, C., Huang, H., and Cui, Q. (2020). Landslide evolution assessment based on insar and real-time monitoring of a large reactivated landslide, wenchuan, China. Eng. Geology. 277, 105781. doi:10.1016/j.enggeo.2020.105781
Xu, C., Xu, X., Dai, F., Wu, Z., He, H., Shi, F., et al. (2013). Application of an incomplete landslide inventory, logistic regression model and its validation for landslide susceptibility mapping related to the may 12, 2008 wenchuan earthquake of China. Nat. Hazards 68, 883–900. doi:10.1007/s11069-013-0661-7
Xu, C., Xu, X., Yao, X., and Dai, F. (2014). Three (nearly) complete inventories of landslides triggered by the may 12, 2008 wenchuan mw 7.9 earthquake of China and their spatial distribution statistical analysis. Landslides 11, 441–461. doi:10.1007/s10346-013-0404-6
Yunus, A. P., Fan, X., Tang, X., Jie, D., Xu, Q., and Huang, R. (2020). Decadal vegetation succession from modis reveals the spatio-temporal evolution of post-seismic landsliding after the 2008 wenchuan earthquake. Remote Sensing Environ. 236, 111476. doi:10.1016/j.rse.2019.111476
Zhou, S., Chen, G., and Fang, L. (2016). Distribution pattern of landslides triggered by the 2014 ludian earthquake of China: implications for regional threshold topography and the seismogenic fault identification. Ijgi 5, 46. doi:10.3390/ijgi5040046
Keywords: earthquake-induced landslide, landslide susceptibility mapping, one class classifier, incomplete landslide inventory, negative data
Citation: Chen S, Miao Z, Wu L, Zhang A, Li Q and He Y (2021) A One-Class-Classifier-Based Negative Data Generation Method for Rapid Earthquake-Induced Landslide Susceptibility Mapping. Front. Earth Sci. 9:609896. doi: 10.3389/feart.2021.609896
Received: 25 September 2020; Accepted: 10 February 2021;
Published: 12 April 2021.
Edited by:
Tolga Gorum, Istanbul Technical University, TurkeyReviewed by:
Jie Dou, Nagaoka University of Technology, JapanAykut Akgün, Karadeniz Technical University, Turkey
Copyright © 2021 Chen, Miao, Wu, Zhang, Li and He. This is an open-access article distributed under the terms of the Creative Commons Attribution License (CC BY). The use, distribution or reproduction in other forums is permitted, provided the original author(s) and the copyright owner(s) are credited and that the original publication in this journal is cited, in accordance with accepted academic practice. No use, distribution or reproduction is permitted which does not comply with these terms.
*Correspondence: Zelang Miao, emVsYW5nLm1pYW9AY3N1LmVkdS5jbg==