 Jan Rusz
 Jaroslav Chum
 Jiří Baše
- Institute of Atmospheric Physics, Czech Academy of Sciences (CAS), Prague, Czechia
Lightning generates sound waves across a wide range of frequencies, including infrasonic waves below 20 Hz. Source mechanism for these low frequency pulses is still area for debate. Infrasound pulses detected after rapid changes of electrostatic field during the thunderstorm activity were analyzed. The measurements were done by large aperture array of absolute microbarometers located in the Western part of the Czech Republic. Distances between four measuring sites are in the range of 4–10 km. The infrasound source position was calculated from time delays between the rapid change of electrostatic field and infrasound signal arrival to the individual microbarometers assuming propagation of spherical waves from the source. Only cases with a sufficient signal-to-noise ratio on all four microbarometers were analyzed. The variation of sound speed with height due to temperature height profile was taken into account. For most of the analyzed cases, the calculated infrasound source position corresponds to the lightning location determined by European lightning detection network (EUCLID). The calculated height of infrasound source is most often 3–5 km.
Introduction
Thunderstorms and lightning are known from the dawn of mankind. They represent an important natural hazard for human beings, animals and technological systems. Despite of that many physical mechanisms that occur during thunderstorms, such as lightning initiation, generation of X-ray and gamma emissions during thunderstorms etc. have been poorly understood and are a subject of intense research (Dwyer and Uman, 2014). One of the not fully explained phenomena is also the generation of acoustic pulses in the infrasound frequency range that are observed in addition to the audible thunderclap. According to recent works, the source of infrasound is fast adiabatic expansion of the hot lightning channel as it is generally accepted for audible frequency range (Few, 1969; Assink et al., 2008; Lacroix et al., 2019). Another mechanism could be the pressure change caused by ohmic air heating by currents flowing from the charged area into the lightning channel (Few, 1985). The third possible explanation might be an electrostatic pressure in the charged parts of the storm clouds. This possibility was originally suggested by Wilson (1920) and was later elaborated and discussed by Dessler (1973), Pasko (2009), and Chum et al. (2013). The infrasound pulse is generated, according to this hypothesis, after removal of electric charge to the lightning channel, which leads to a sudden change of pressure.
It should also be noted that it is not only lightning that generate infrasound in thunderstorms. Infrasound over wide frequency range is also generated via convective forces, vortex motion of air masses or turbulence inside the thunderclouds (Goerke and Woodward, 1966; Bedard, 2005; Akhalkatsi and Gogoberidze, 2009). These processes, together with local wind around microbarometers, enhance infrasound noise background and complicate detection of individual thunders. Thunderstorm-induced infrasound waves might experience a stratospheric refraction and can be detected by ground infrasound stations over distances of several hundreds of kilometers (Campus and Christie, 2010; Šindelářová et al., 2015), Moreover, continuous very low-frequency infrasound produced by large convective system can propagate to ionospheric heights and be detected remotely by radio sounding at altitudes around 200 km (Georges, 1973; Chum et al., 2018). On the other hand, a reliable detection and association of thunders to individual lightning is only possible at relatively small distances from lightning, on the order of several kilometers or few tens of kilometers (Fleagle, 1949).
Several authors reported that distinct infrasound pressure pulses that significantly exceeded the background noise originated from IC discharges (Holmes et al., 1971; Johnson et al., 2011; Chum et al., 2013; Arechiga et al., 2014). The previous studies that located lightning and thunderstorm activity from infrasound signals recorded by an array of infrasound/acoustic sensors used an assumption of plane acoustic waves. In other words, it was considered that infrasound thunder was generated at much larger distances than is the size of the array (Assink et al., 2008; Farges and Blanc, 2010; Chum et al., 2013; Arechiga et al., 2014; Lacroix et al., 2018 among others) and the direction of arrival was determined from phase (time) shifts between signals recorded by different sensors.
The aim of this study is to present an alternative approach. It is based on data obtained by large-scale (aperture) array formed by four infrasound sensors (microbarometers) located in the western part of the Czech Republic. The array is originally intended for detection of very long period infrasound and atmospheric gravity waves. It is shown in this study that it is also possible to use this array for location of sources of impulsive infrasound produced by lightning. As the size of the array (∼10 km) cannot be neglected with respect to the distances of nearby discharges, an assumption of spherical wave propagation from the source is used. The paper focuses on distinct pulses from nearby lightning and describes the method of calculation of the infrasound source location using spherical wave-fronts. Next, it presents the obtained results and discusses the uncertainties. It also uses data from collocated electrostatic field sensor and European lightning detection network (EUCLID) for detection of lightning and determination of its time, location, type and peak current, and for comparison with thunder source position obtained by the analysis of infrasound signals.
Materials and Methods
Experiment
EUCLID
EUCLID provides information about the discharge location, time, peak current and its polarity. Intracloud (IC) and cloud-to-ground (CG) lightning are distinguished. It consists of about 164 sensors which detect the electromagnetic field generated by lightning at frequencies from 10 to 350 kHz. For the CG strokes, the location accuracy in the Czech Republic is about 100–200 m and detection efficiency is greater than 98% (Schulz et al., 2016). As for the IC discharges, the location accuracy is undefined because of their spatial extent. The accuracy is generally considered between 1 and 10 km, but strongly depends on spatial extent of the IC discharges. Detection efficiency for IC flashes was roughly estimated to be in the range from about 70 to 80% (Chum et al., 2013).
Large Aperture Array of Absolute Micro-Barometers (Western Bohemia Czech Infrasound)
The array is designed for detection of very long period infrasound and atmospheric gravity waves. Microbarometers are located in the Westernmost part of the Czech Republic. Measuring points use available facilities of small seismic stations operated by the Institute of Geophysics and form a tetragon with sides within the range of 4–10 km. The array configuration is shown in Figure 1. The geographical location and altitude for each site is given in Table 1. The sites are equipped with absolute microbarometers (Paroscientific, Inc.) with parts-per-billion resolution. Sampling frequency is 50 Hz and a GPS receiver is used for time stamping. The microbarometers are located in simple wooden huts that shield the sensors against winds. No additional spatial filtering for noise reduction by a system of branching hoses is used. The sensitivity of the sensors is sufficient to clearly record microbaroms, especially in winter when eastward stratospheric winds support propagation of microbarom signals from Atlantic Ocean (Landes et al., 2012).
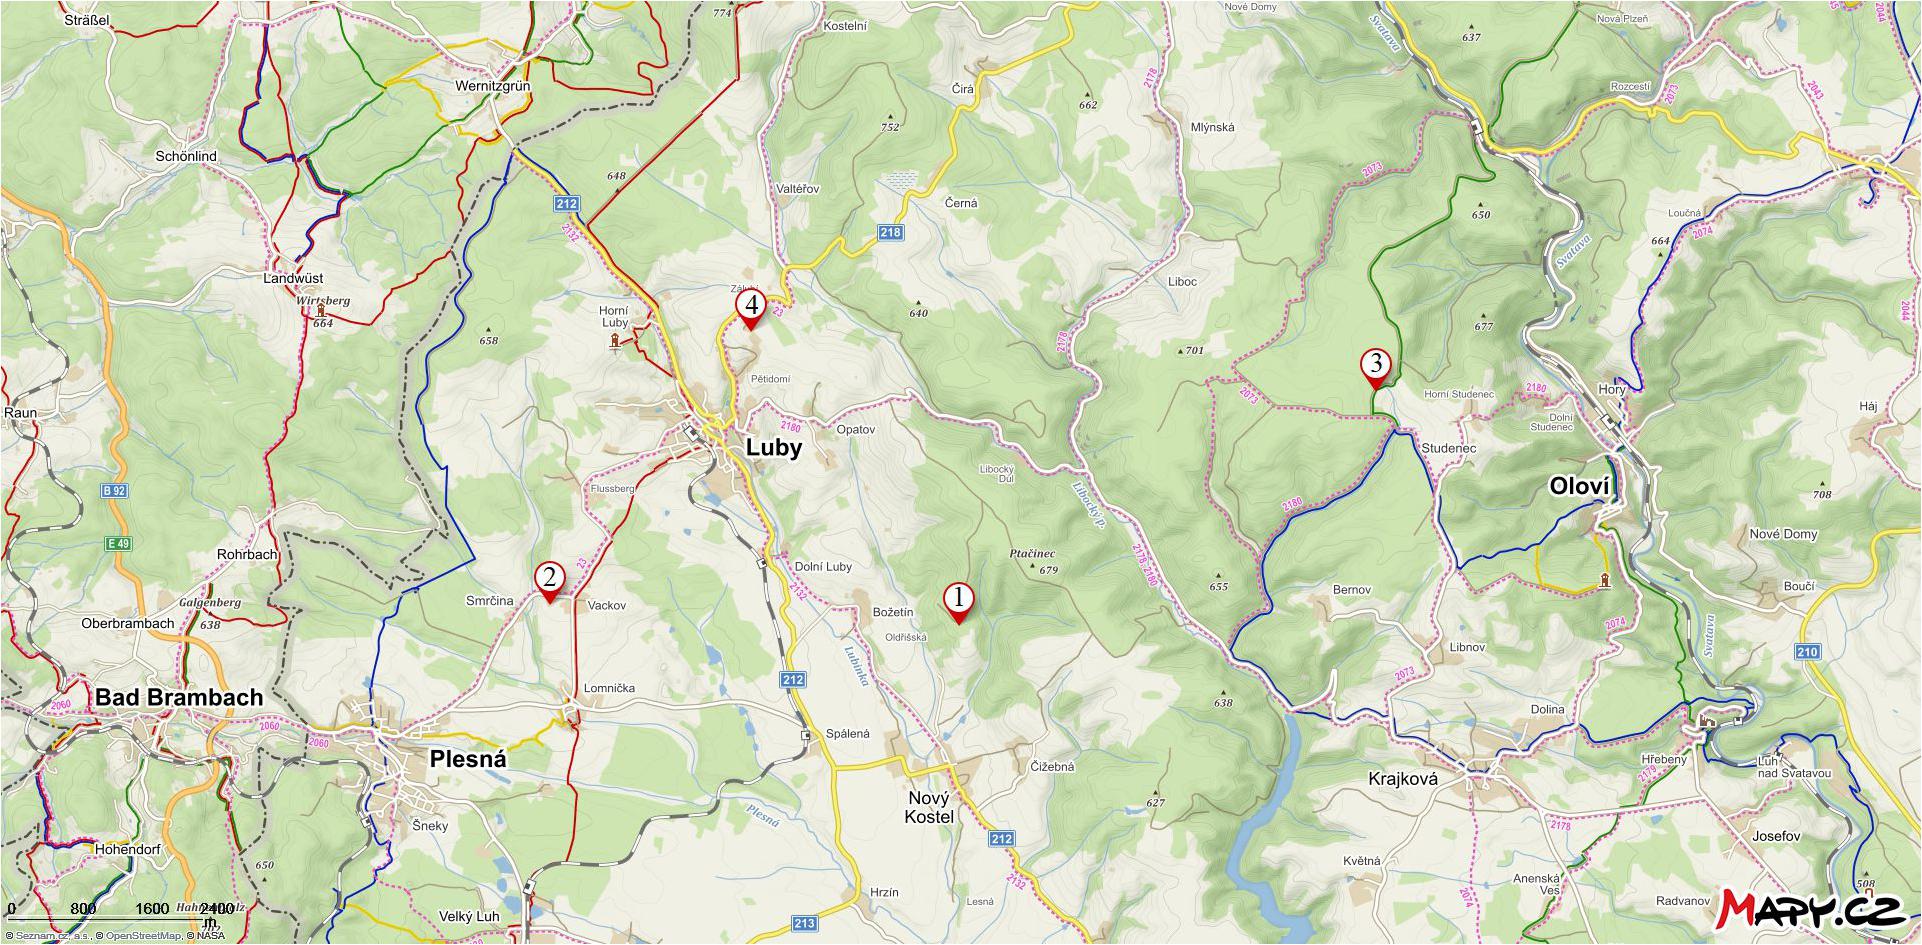
Figure 1. Locations of microbarometers in Western Czechia.
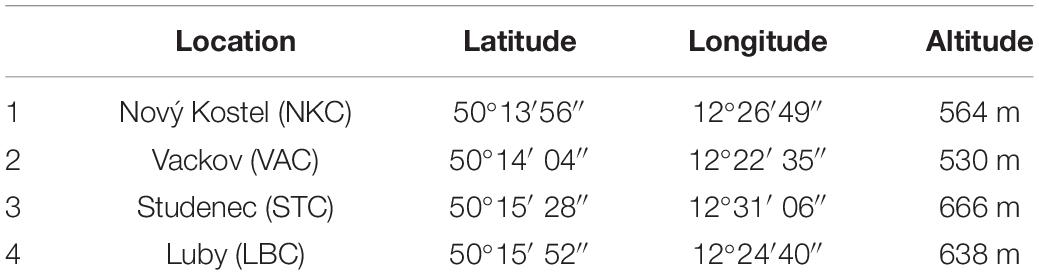
Table 1. Coordinates and altitude of microbarometers.
Electrostatic Field Measurement
An electric field mill (Boltek, Electric Field Monitor EFM-100) is used to record vertical component Ez of atmospheric electrostatic field. More precisely, potential gradient, PG = −Ez is measured and presented further. It means that positive values are measured for downward—pointing electric field. The device is located in Studenec (location 3 in Figure 1) near the microbarometer. It has response time of ∼0.1 s, the sampling rate of data is 25 Hz. The absolute values of electric field (PG) did not exceed several kV/m in Studenec during thunderstorms, which is different from measurements performed on high and sharp mounting peaks, where values reaching ∼100 kV/m were observed (Chum et al., 2020).
Data and Analysis Methods
Data from storms that occurred near the microbarometer array in spring and summer of 2018 were processed. Three thunderstorms that occurred on 23.5.2018, 24.5.2018, and 16.7.2018, with a moderate occurrence frequency of lightning were selected. The moderate frequency of lightning flashes is important for the unambiguous assignment of infrasound pulses to a particular flash.
Using EUCLID data together with electric field measurements, 175 flashes were detected at a distance of less than 30 km from the microbarometer array. For further processing, only 92 cases with a sufficient signal-to-noise ratio on all four micro-barometers were selected.
Identification of exact moments of lightning strokes is based on an analysis of the rapid, step-like changes of the electric field. In addition, the information about lightning locations by EUCLID within 30 km from EFM-100 is used for comparison.
Significant infrasound pulses were searched in the time interval of 70 s after each detected lightning flash. The time interval was set according to the experience with the evaluation of infrasound pulses. Choosing a longer interval would not provide any new results, pulses from a distance of more than 20 km were too weak and the assignment to a specific lightning was uncertain. Moreover, a step-like change of electric field is usually not observed for discharges occurring at larger distances. The event was only studied if the distinct signal was found on all four microbarometer records.
The infrasound source position was calculated from the time delays between the lightning and acoustic (infrasound) signal arrival to the individual microbarometers assuming propagation of spherical waves from the source. In the case of an ideal point source, the following system of equations is satisfied:
where xn, yn, and zn are Cartesian coordinates of the n-th array element (microbarometer), x0, y0, and z0 are coordinates of the source, cavg_n average speed of sound from the source to n-th sensor, and Δtn are the measured time delays of the signal arrival to the n-th sensor. The relations (1) represent a set of four equations for three unknown coordinates x0, y0, and z0 of the source that are solved by the weighted least square method described later.
Determining the Time Delay
The source of infrasound is actually a volume source rather than a point source. Also, the medium through which the signal propagates is inhomogeneous. Consequently, the infrasound thunder is usually observed as intense multiple pressure fluctuation rather than as an isolated pressure pulse. Examples of such pulses can be seen in Figure 2, indicated by colored ellipses. To find the exact time of arrival, a 2 Hz high-pass filter was first used to remove long—period fluctuations and noise background as much as possible. Then the signal variances of filtered signals over the time intervals of 0.2 s were calculated. We consider the maxima of these functions to be the times of signal arrival. The use of one specific time of each signal is limiting, leading to the determination of only single point source for each flash. However, the use of the entire pulse (longer pressure fluctuation) to reconstruct the spatial configuration of the infrasound source was not possible. Due to the large size of the microbarometer array, the infrasound signals propagating to the individual microbarometers are affected by different atmospheric conditions, are not well correlated at the microbarometer sites and cannot therefore be used to determine the source. Figure 3 shows an example of the time evolution of the pressure variances with maxima marked by cross—symbols for each microbarometer. Time zero in Figure 3 corresponds to the time of lightning stroke at 14:53:30 UT.
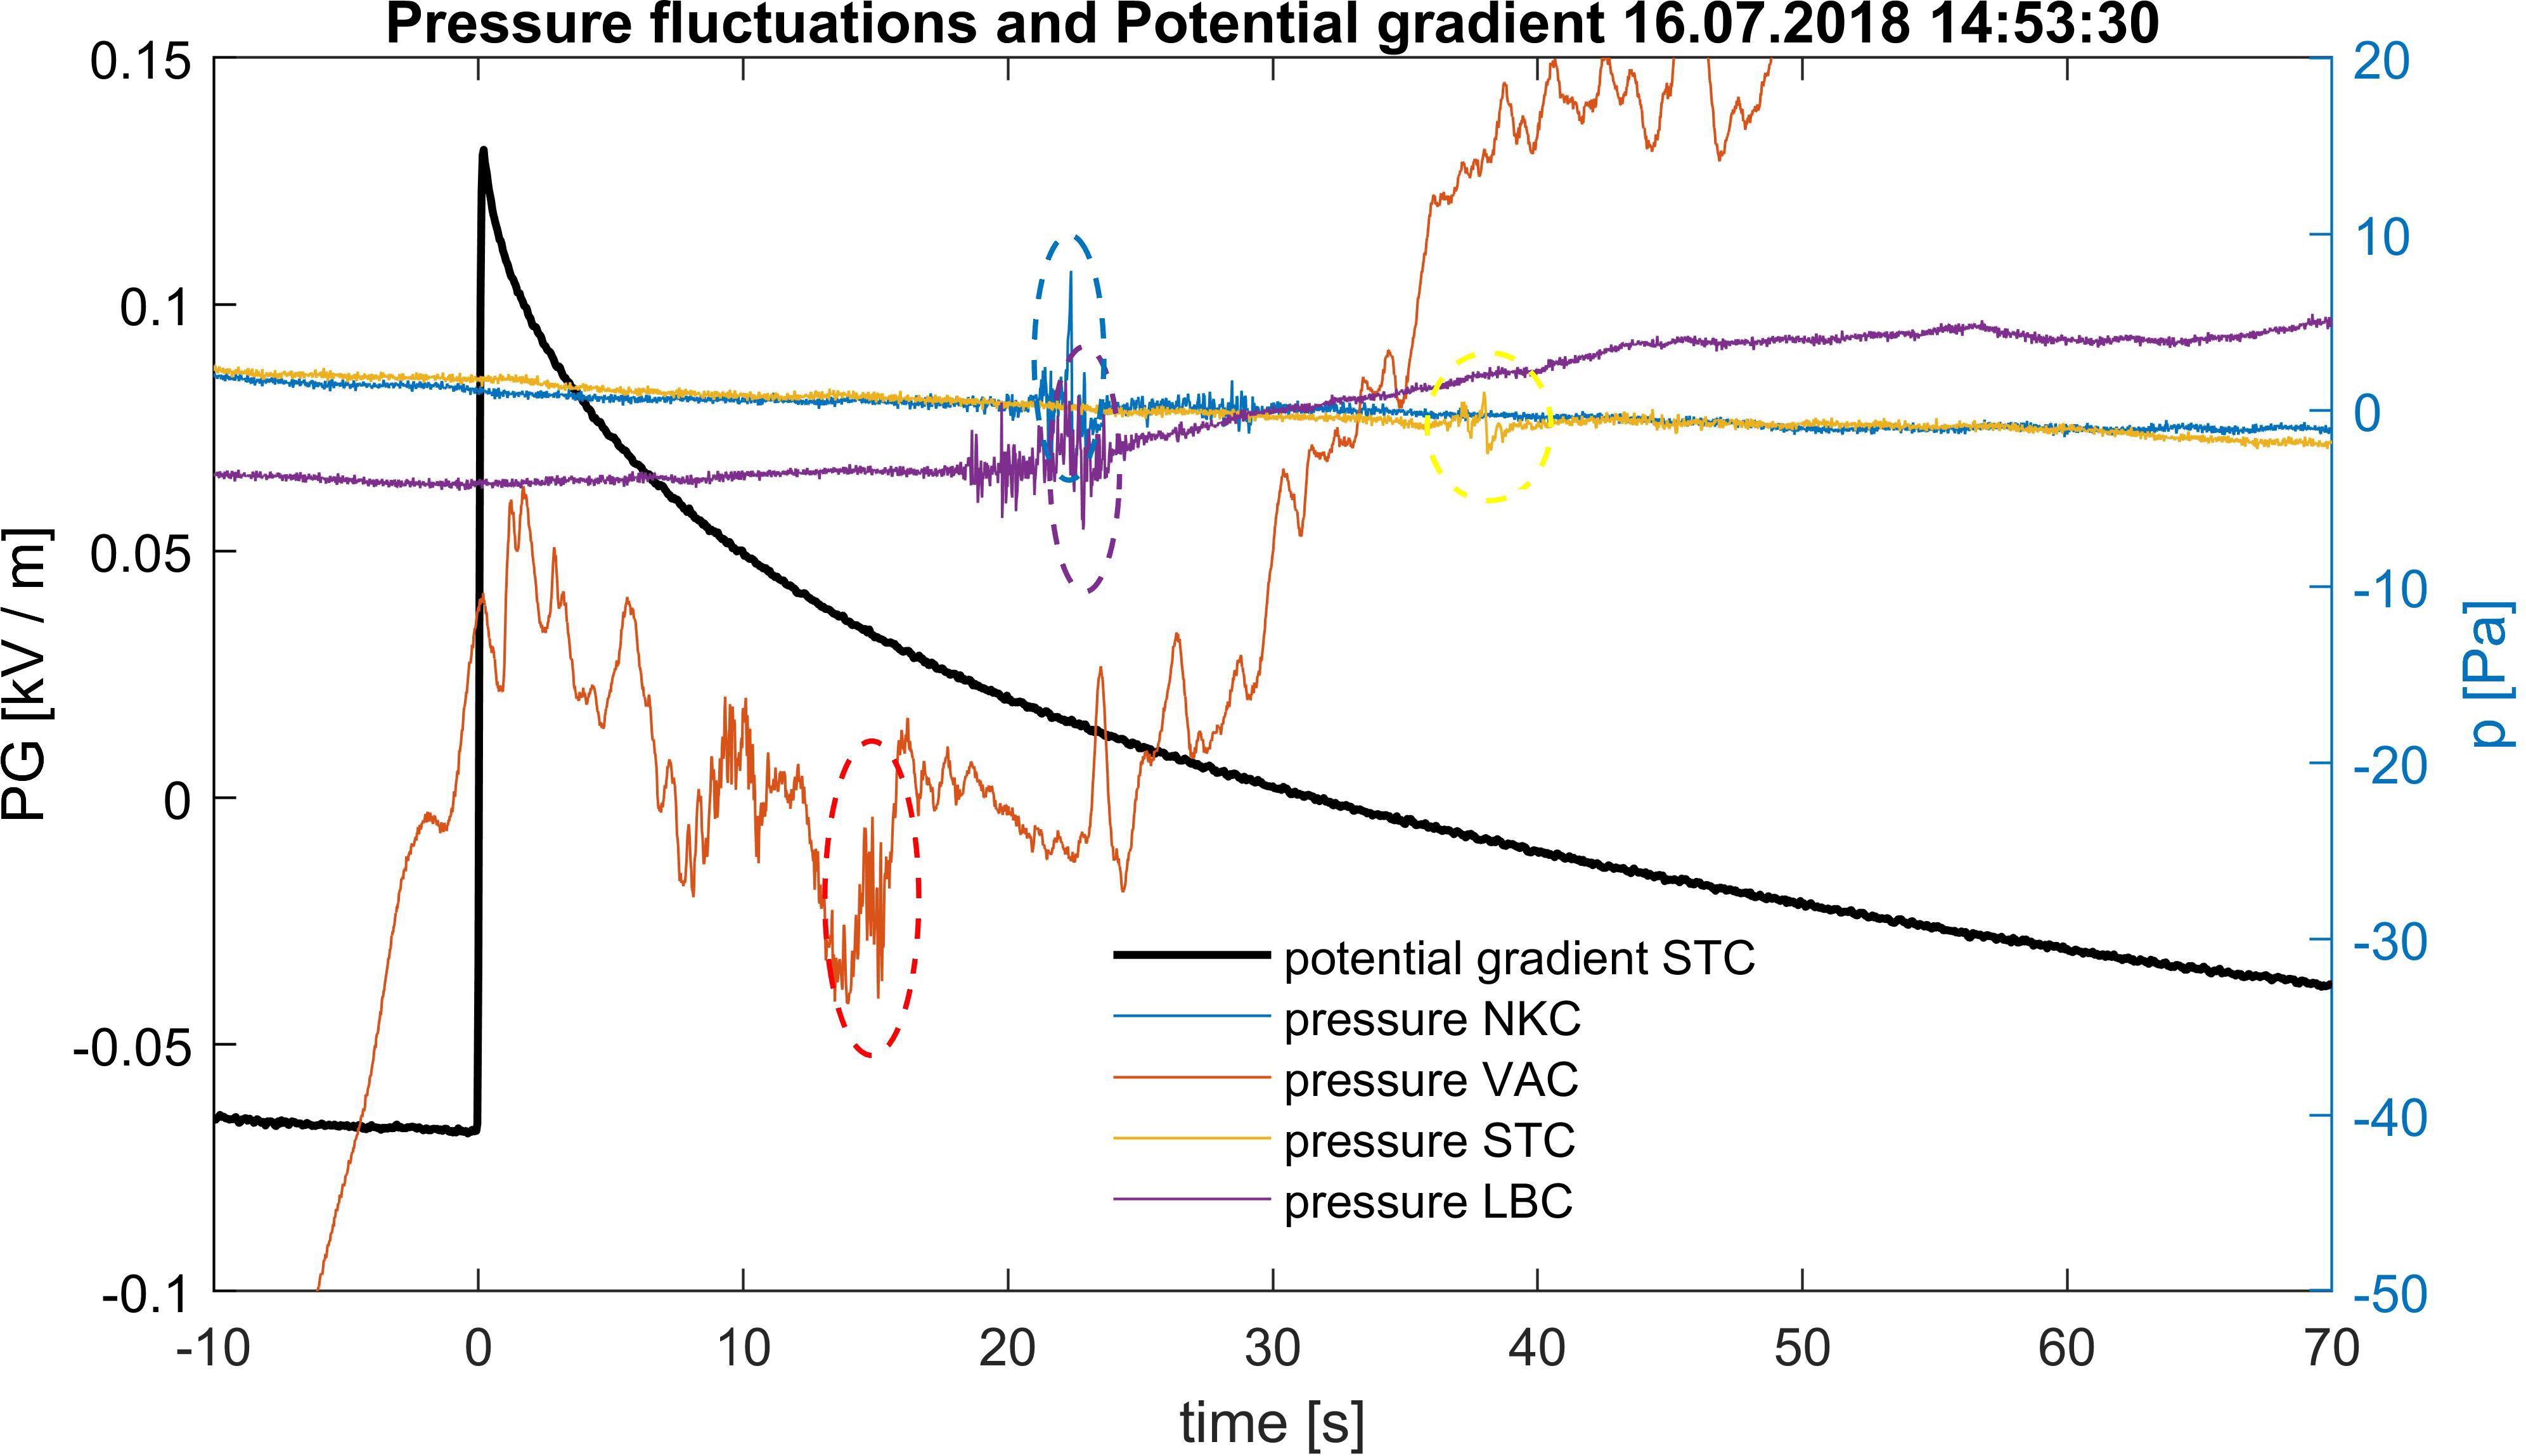
Figure 2. Positive step—like change of potential gradient followed by little less clear oscillations on pressure curves.
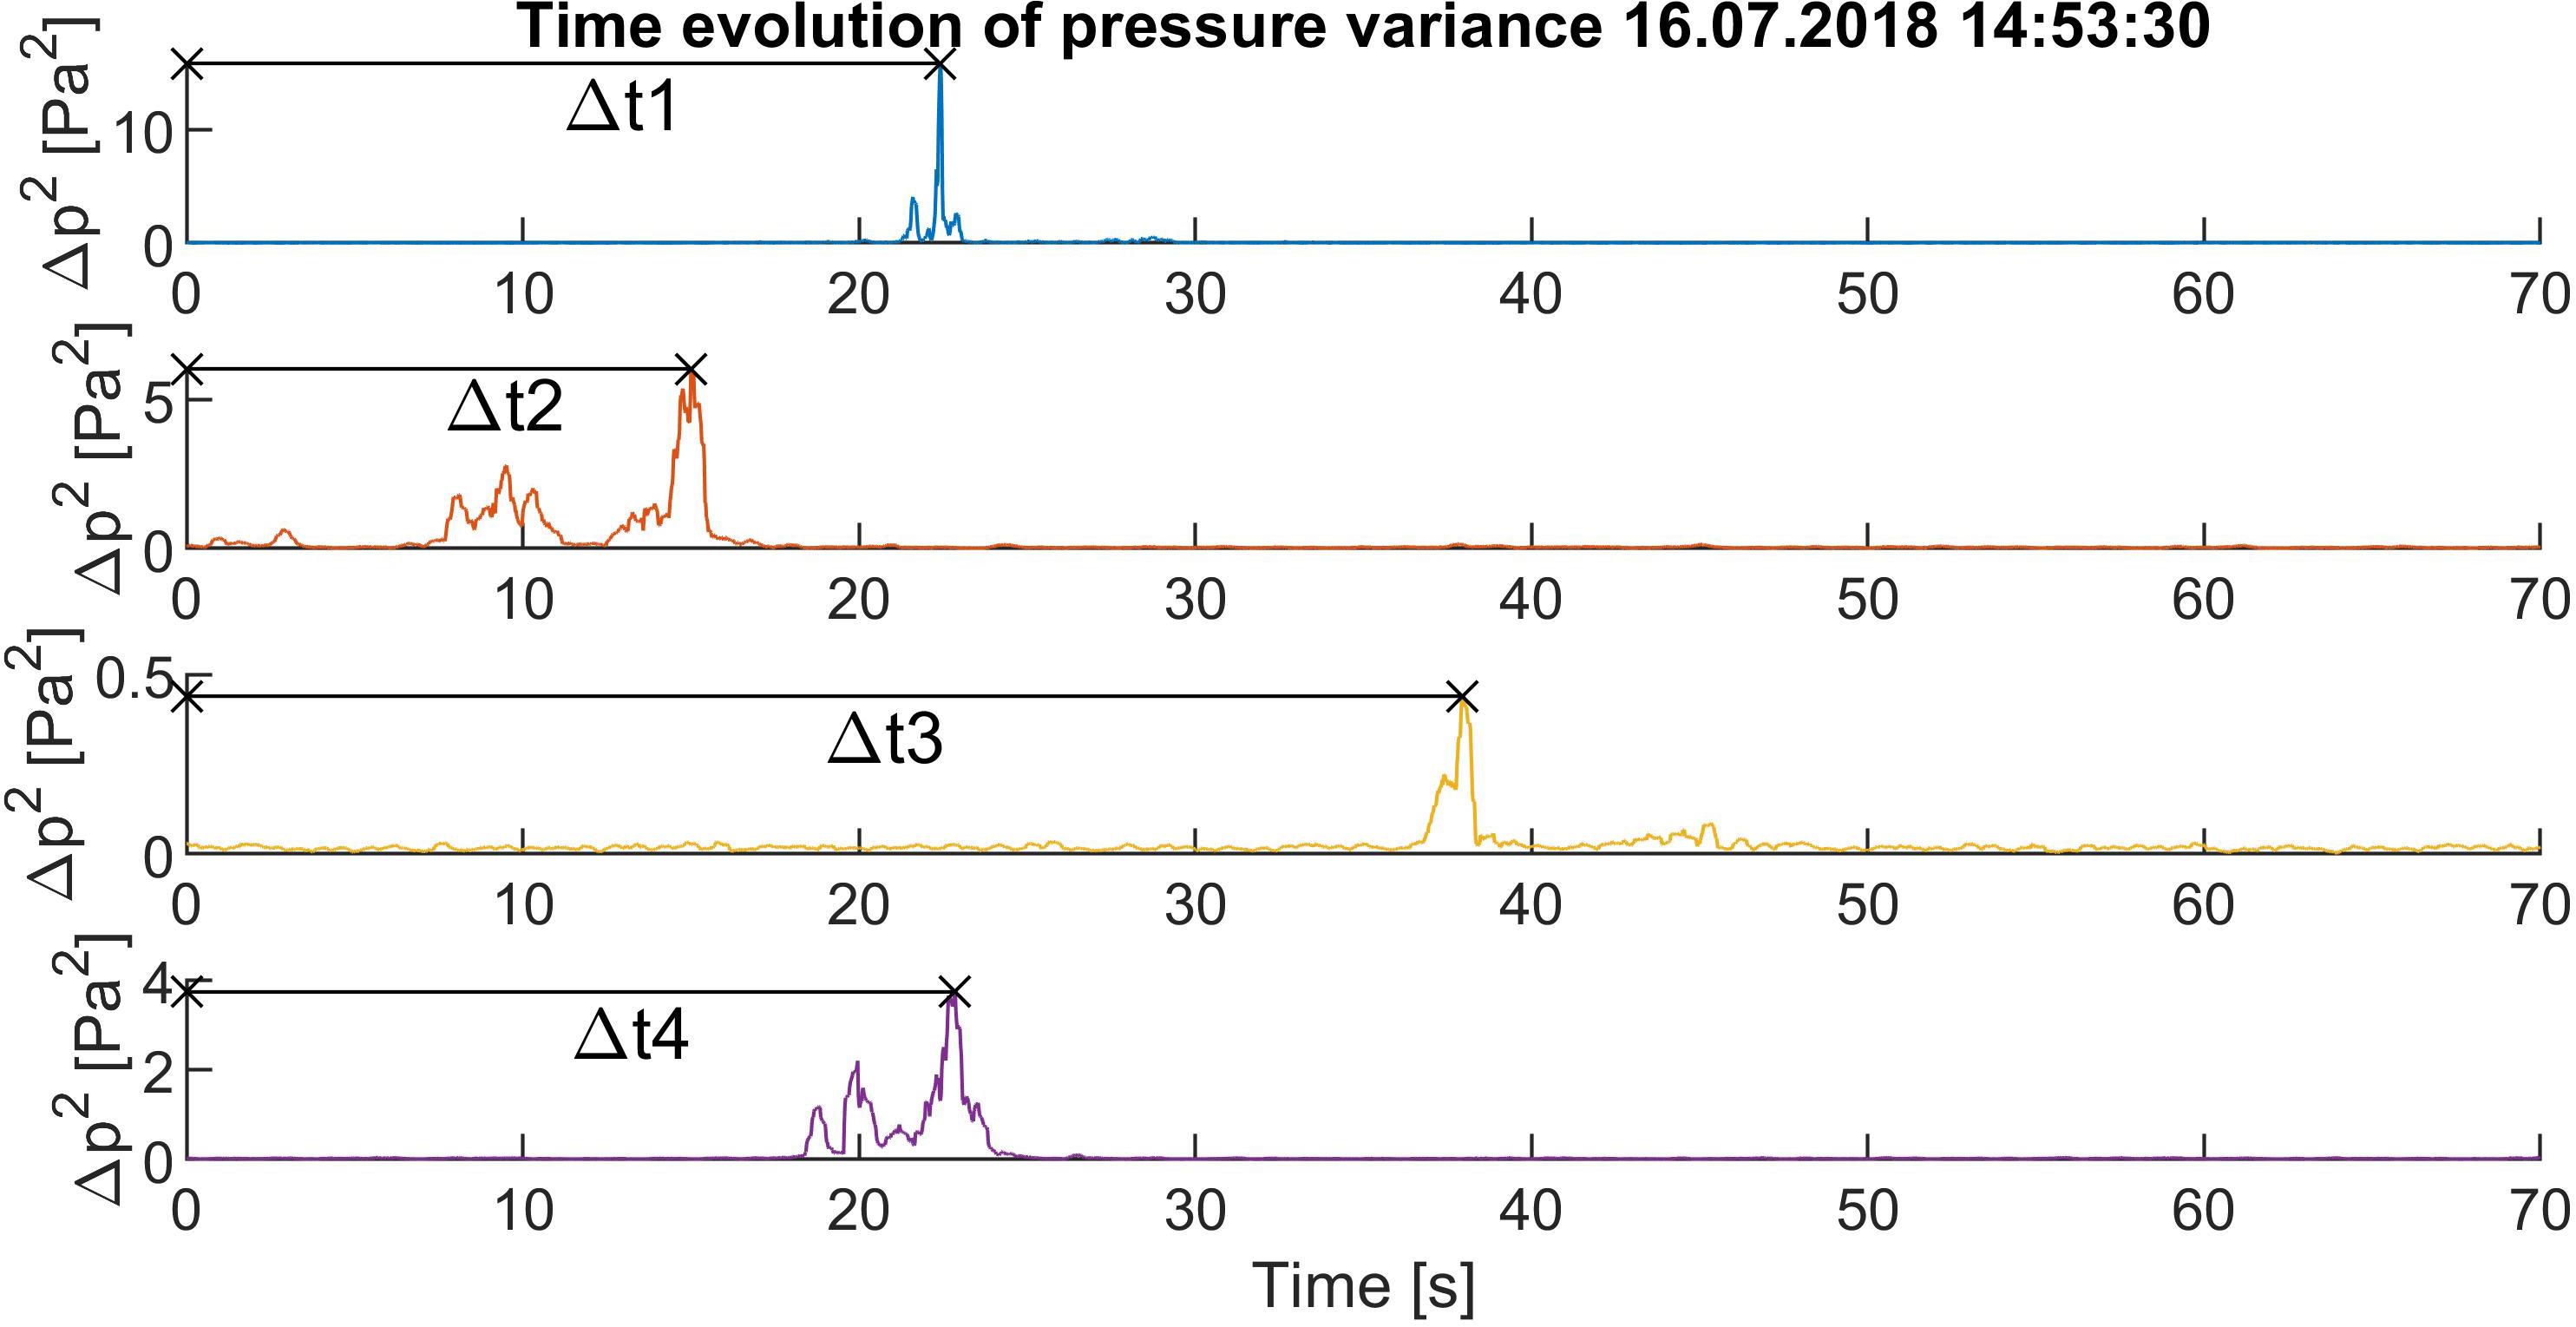
Figure 3. Time evolution of HP-filtered pressure variations after the lightning stroke at 14:53:30.
The Speed of Sound
The calculation of the average sound velocity according to the source altitude was performed similarly as in Arechiga et al. (2014). We use an approximation of sound propagation along the straight line. We calculate speed of sound individually for each flash depending on its height and current temperature in the field area. The speed of sound depends mainly on the ambient temperature. For ideal gas, it is given by Eq. 2:
The speed of sound in real air is also affected by its humidity. Compared to the effect of temperature and wind, the effect of humidity is small and can be neglected in this calculation. The value of the heat capacity ratio γ for gas with for diatomic molecules is 1.4 and the specific gas constant R for dry air is R = 287.058Jkg−1K−1. The variation of temperature with altitude z was modeled by a linear function with temperature lapse rate k = −6.5Kkm−1.
The temperature T3 for each lightning is obtained from the meteorological station collocated with EFM-100 (site 3 in Figure 1). The height z and the altitudes of the other measuring stations are related to the altitude of the site 3. Assuming propagation along a straight line at elevation angle α for simplicity, the average speed of sound propagation from the source height z0 to the height of n-th sensor zn can be expressed as follows:
Using Eqs (2) and (3), the time of the straight-line propagation from the source to the n-th detector is expressed by the integral:
After substituting into the Eq. 4:
Therefore, in this approximation of propagation along the straight line, the average value of the sound speed is not dependent on the elevation angle αn.
Finding the Solution
The weighted least squares method is used to solve the overdetermined set of Eq. 1 for the unknown coordinates x0, y0, and z0. Specifically, the term defined in Eq. 7 is minimized.
Where is dimensionless goodness-of-fit parameter that corresponds to a chi-square distribution with one degree of freedom for correctly estimated weights . Note that the temperature dependence of sound speed on the source height enters in the solution—minimization of via cavg_n, which is specified in Eq. 6.
Uncertainties Estimation
The uncertainties are given by the uncertainties in determining speed of sound and of signal propagation time. We assume that the coordinates of the microbarometers xn, yn, zn are determined precisely. The uncertainty of determining time delay △tn is based on infrasound thunder pulse width on the pressure variation (Figure 3). The width of the pulse is determined by the points where the variance of fast pressure variations drops to one half of its maximum. The correct assignment of the audio signals to the individual lightning bolts was ensured by selecting suitable sections of the storm with a relatively low frequency of lightning so that the assignment was unambiguous.
The accuracy of the sound speed is dependent on the knowledge of temperature and its altitude profile. Exact temperature measurement is only available at one location at the ground level. The highest recorded temperature change in the observed storms was 2°C. Thus, it is assumed that the maximum error in determining the temperature at different points on the ground should not exceed this value. The uncertainties in determining the average sound speeds cavg_n are then obtained by substituting the expected temperatures for the temperatures changed by their maximum uncertainties into Eq. 6. The third parameter significantly affecting the uncertainty of the cavg_n△tn product is the wind speed. It is again measured in one place only. The calculation (7) assumes zero wind speed. To estimate the uncertainty, we take the maximum speed value measured during the thunderstorm.
The total uncertainties used in Eq. 7 can be expressed as:
Where ∂△tn, ∂c, ∂v are uncertainties in determining time delays, speed of sound and wind speed. For the studied storms, values for ∂v were in range 2–5 m/s and ∂c was around 1.2 m/s for temperature uncertainty of 2°C.
Obviously, the closer is the source to the specific sensor, the smaller is the uncertainty as increases with the propagation time △tn. Thus, the measurements obtained by microbarometers that are closer to the source have usually larger weights in Eq. 7.
The total error in determining the position of the infrasound thunder source is determined as follows. We add subsequently to the terms (cavg_n△tn)2 in Eq. 7 the values of their uncertainties with positive or negative sign, or 0. Because we have four measuring sites, altogether 34 = 81 different combinations to solve Eq. 7 are obtained. After solving them, we get 81 different source positions. We will then consider the largest positive and negative deviations of each component (x, y, z) from positions calculated for zero added to all (cavg_n△tn) terms as the errors of the obtained source positions.
Results
Data from three periods of storm activity on 23–24.5.2018 and 16.7.2018 were examined. In total, 92 lightning with complete data and sufficient data quality on all measuring channels were selected from a large number of flashes.
Three illustrative cases are described in detail further. The first example is a simple single-stroke IC flash detected southeast of the microbarometer array. The next two examples describe flashes composed of several return strokes. In the second case the flash was only composed of IC discharges, whereas in the third case both IC and CG return strokes were present in the multiple stroke discharge.
Example 1: Single Stroke Flash
The flash was observed during the storm activity on 16.7.2018 at 15:28:55.6, which can be seen as a rapid decrease of the potential gradient by about 0.25 kV in Figure 4A. EUCLID network detected one negative IC stroke with a peak current of −6.43 kA at 15:28:55.573. The location of the flash from the EUCLID network is marked by the red cross in Figure 4D and red lines in Figures 4B,C. Significant oscillations on the pressure curves with a maximum amplitude on the order of units of Pa are observed 20–40 s after the lightning flash. It is clearly visible that the intensity of the oscillations decreases with increasing time of arrival, i.e., with increasing distance from the lightning. Determination of the time of maximum oscillation is more reliable and accurate after applying the 2 Hz high pass filter (Figure 4A). The infrasound source position determined from the time delays of the infrasound signals is indicated by the yellow crosses in Figures 4B–D. The size of these crosses corresponds to the total positioning error. The determined horizontal position of the infrasound source corresponds well to the lightning location given by EUCLID.
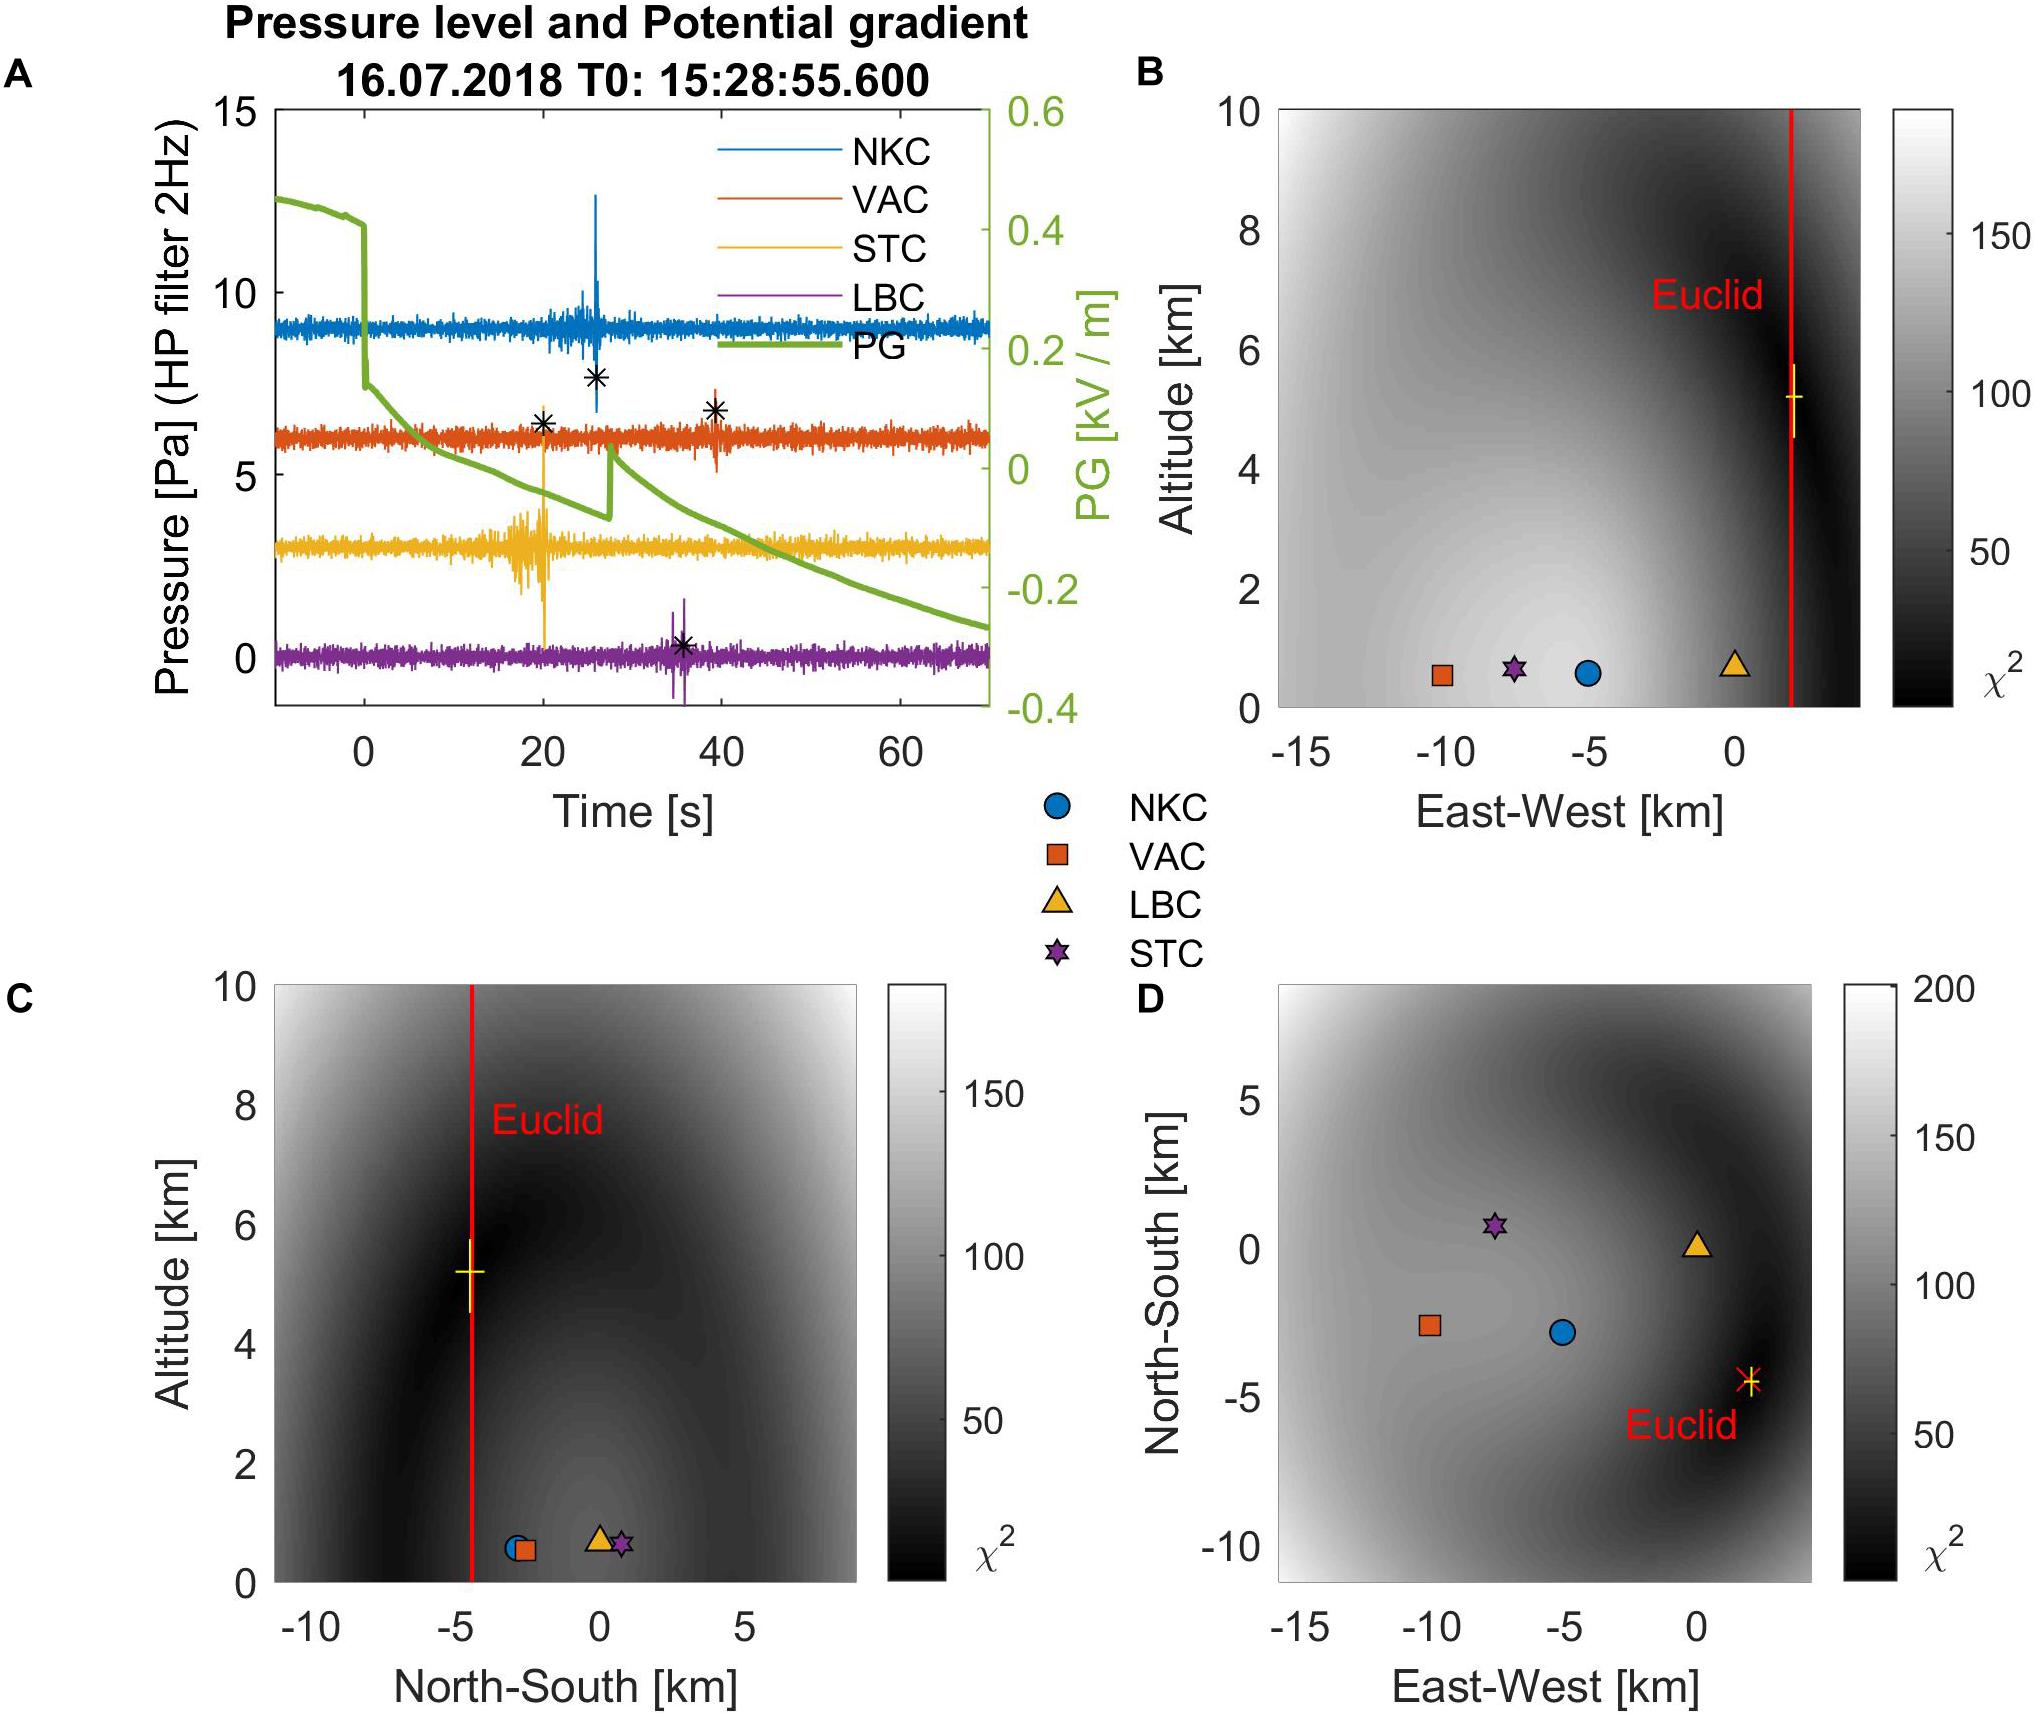
Figure 4. (A) A rapid change in potential gradient followed by pressure fluctuations recorded by individual microbarometers. Pressure curves are high pass filtered and for clarity shifted from each other by 3Pa, (B–D) position of the infrasound source and lightning location in the three orthogonal planes. The position of the infrasound source (with a tolerance of σ) is indicated by a yellow cross. The position of the flash detected from the EUCLID is indicated by red cross on (D). On (B,C) red lines are used, due to a missing altitude information. Background displays the χ2(x,y) in Eq. 7.
Example 2: Multiple Stroke Flash
A multiple stroke discharge composed of five IC discharges was observed during the storm activity on 16.7.2018, recorded in Figure 5A as a sudden increase in potential gradient by about 0.2 kV at 14:53:30.04. EUCLID detected five IC discharges in the time interval 14:53:30.005–14:53:30.075. Their locations are indicated by red crosses and lines in Figures 5B–D. The strongest of the discharges (−11.01 kA) is highlighted by bold. The oscillations on the pressure curves last longer than in the previous case, they consist of several separate groups of oscillations. However, the maximum is still clearly visible. The position of the infrasound source, indicated by yellow crosses in Figures 5B–D, is again close to the locations of the individual discharges detected by EUCLID.
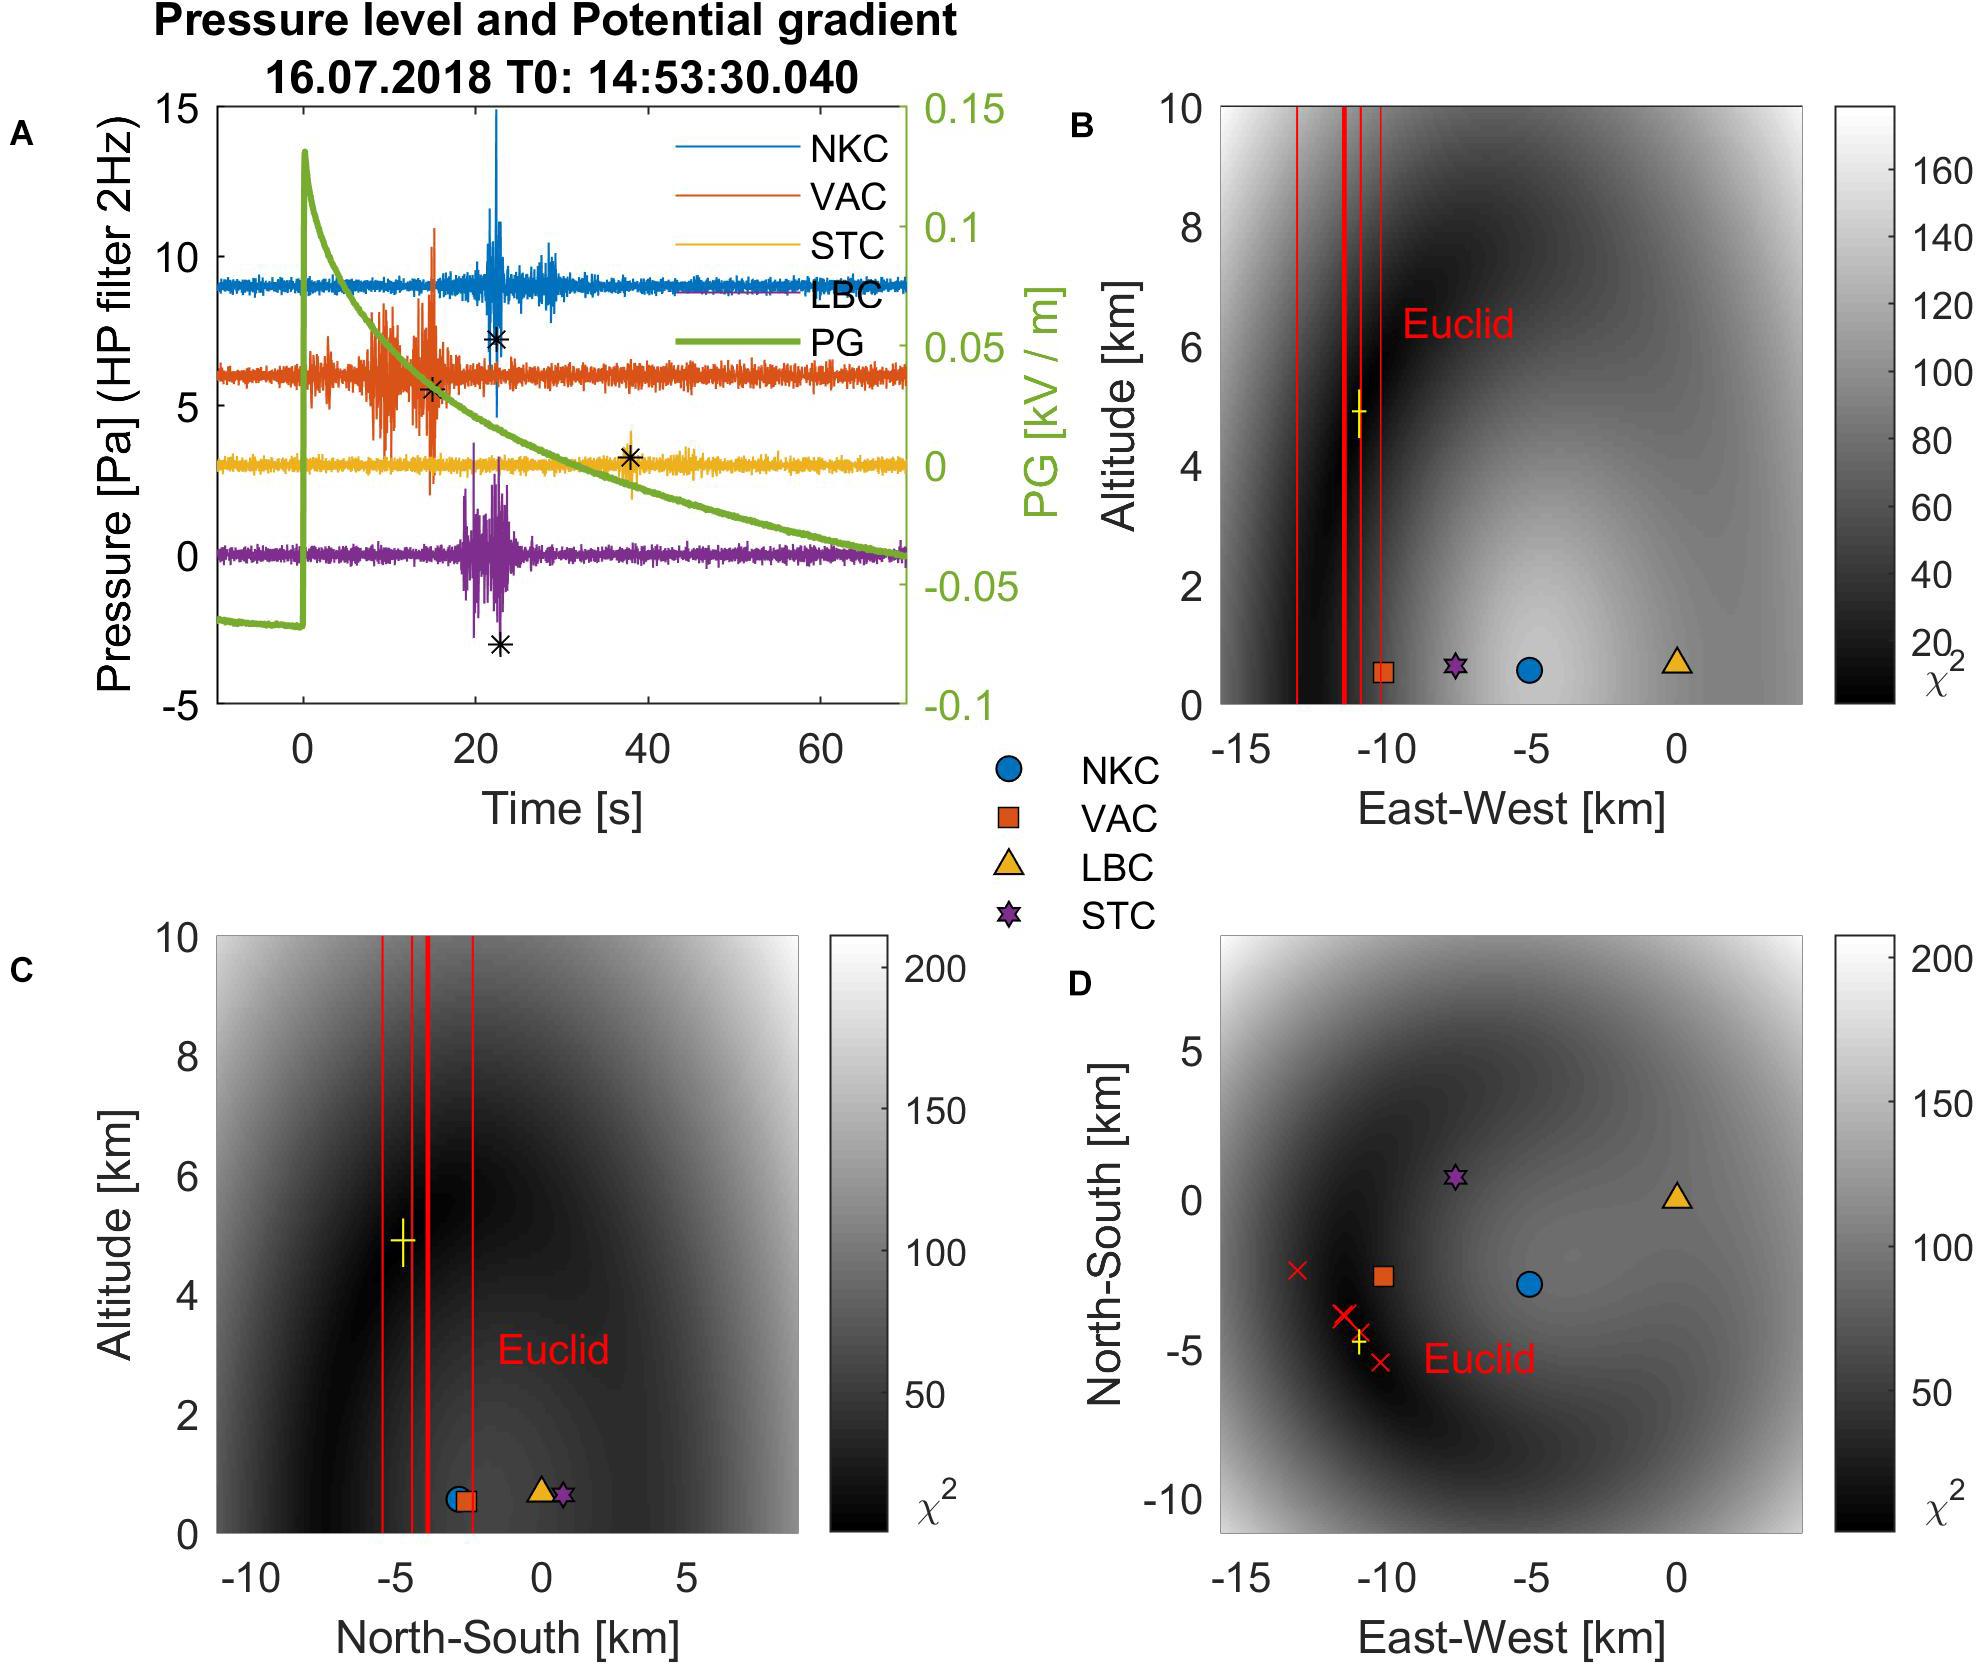
Figure 5. An example of a multiple flash of five IC discharges. (A) A rapid change in potential gradient followed by pressure fluctuations recorded by individual microbarometers. Pressure curves are high pass filtered and for clarity shifted from each other by 3Pa, (B–D) position of the infrasound source and lightning location in the three orthogonal planes. The position of the flashes detected from the EUCLID are indicated by red. The strongest discharge is marked by bold. The position of the infrasound source (with a tolerance of σ) is indicated by a yellow cross. Colorful background displays the χ2(x,y) in Eq. 7.
Example 3: Close Lightning Strike
A multiple flash was detected during the storm activity on 23.5.2018 at 14:29:39.4 is seen in Figure 6A as fast approximately 1.2 kV bidirectional change of potential gradient at this time. According to the EUCLID data, it consisted of three strokes. The strongest of them was CG discharge with the peak current of −34.14 kA. It was detected in close proximity to the measuring point 3 (Figure 1). The other two IC discharges were weaker and their distance from the measuring point was greater. Figure 6A show a sharp and distinct pressure variations at the measuring point 3 (marked yellow and with the STC code) observed about 2–3 s after the lightning flash. The maximum amplitude of this pulse exceeds 20 Pa, which is several times higher than the intensity of the oscillations measured by the other microbarometers. Figures 6B–D shows the position of the infrasound source near the measuring point 3, marked by yellow crosses. Again, the position of infrasound source is relatively close to the location of the strongest lightning discharge.
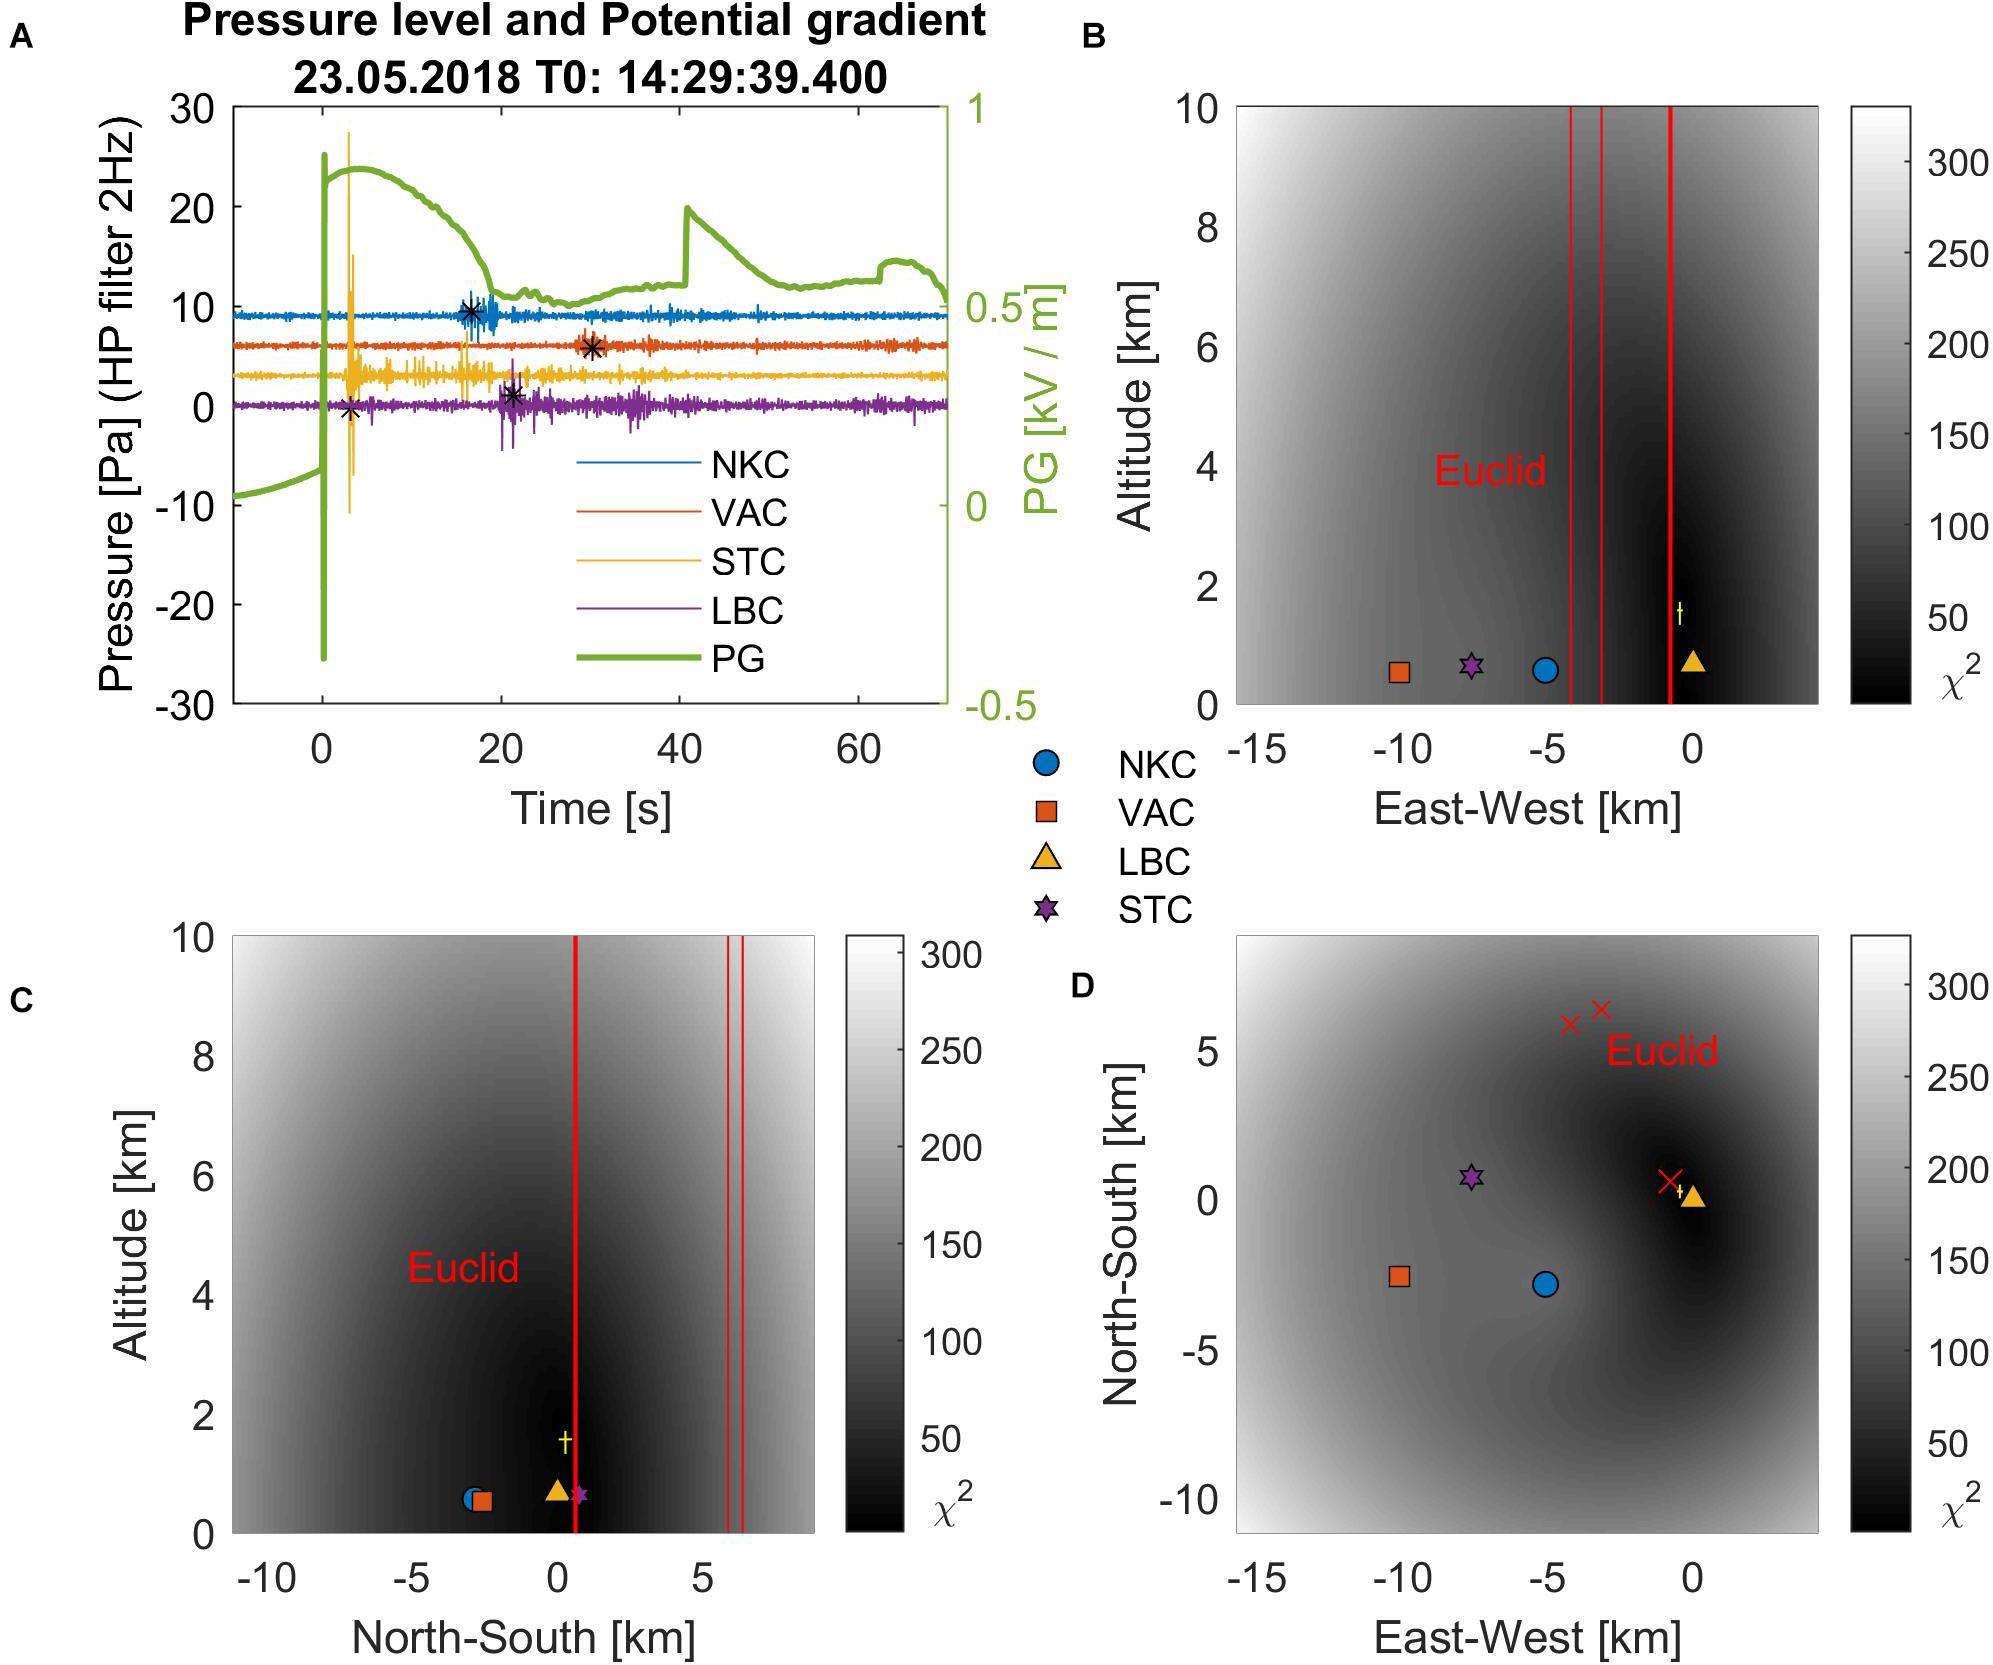
Figure 6. (A) high passed filtered pressure fluctuations recorded by individual microbarometers follow quick bidirectional change in electrical potencial, (B–D) position of the infrasound source and lightning location in the three orthogonal planes. The calculated flash position indicated by a yellow cross is near to the STC measuring point, and comparatively close is also the strongest lightning stroke identified by the Euclid network (marked by bold red crosses and lines).
Statistical Results
Statistical investigation of altitudes of infrasound sources is presented. Since there were no pure CG flashes among the 92 processed flashes, we divide the events into two categories: pure IC flashes and mixed flashes, composed of both CG and IC discharges. Figure 7A shows the calculated altitudes of the infrasound sources and Figure 7B their uncertainties as a function of the distance from the center of the measuring array. It is clearly visible that the uncertainties increase with increasing distance from the array center. At a distance larger than 10 km from the center of the microbarometers, the detected altitudes are no longer reliable. The maximum distance of analyzed events did not exceed 17 km. The mean altitude and other basic statistical parameters are given in Table 2. Histogram presenting distribution of altitudes is shown in Figure 8. Red bars mark pure IC discharges whereas blue bars depict mixed flashes. As expected, the altitude range (variance) of pure IC discharges is less than that of the mixed ones.
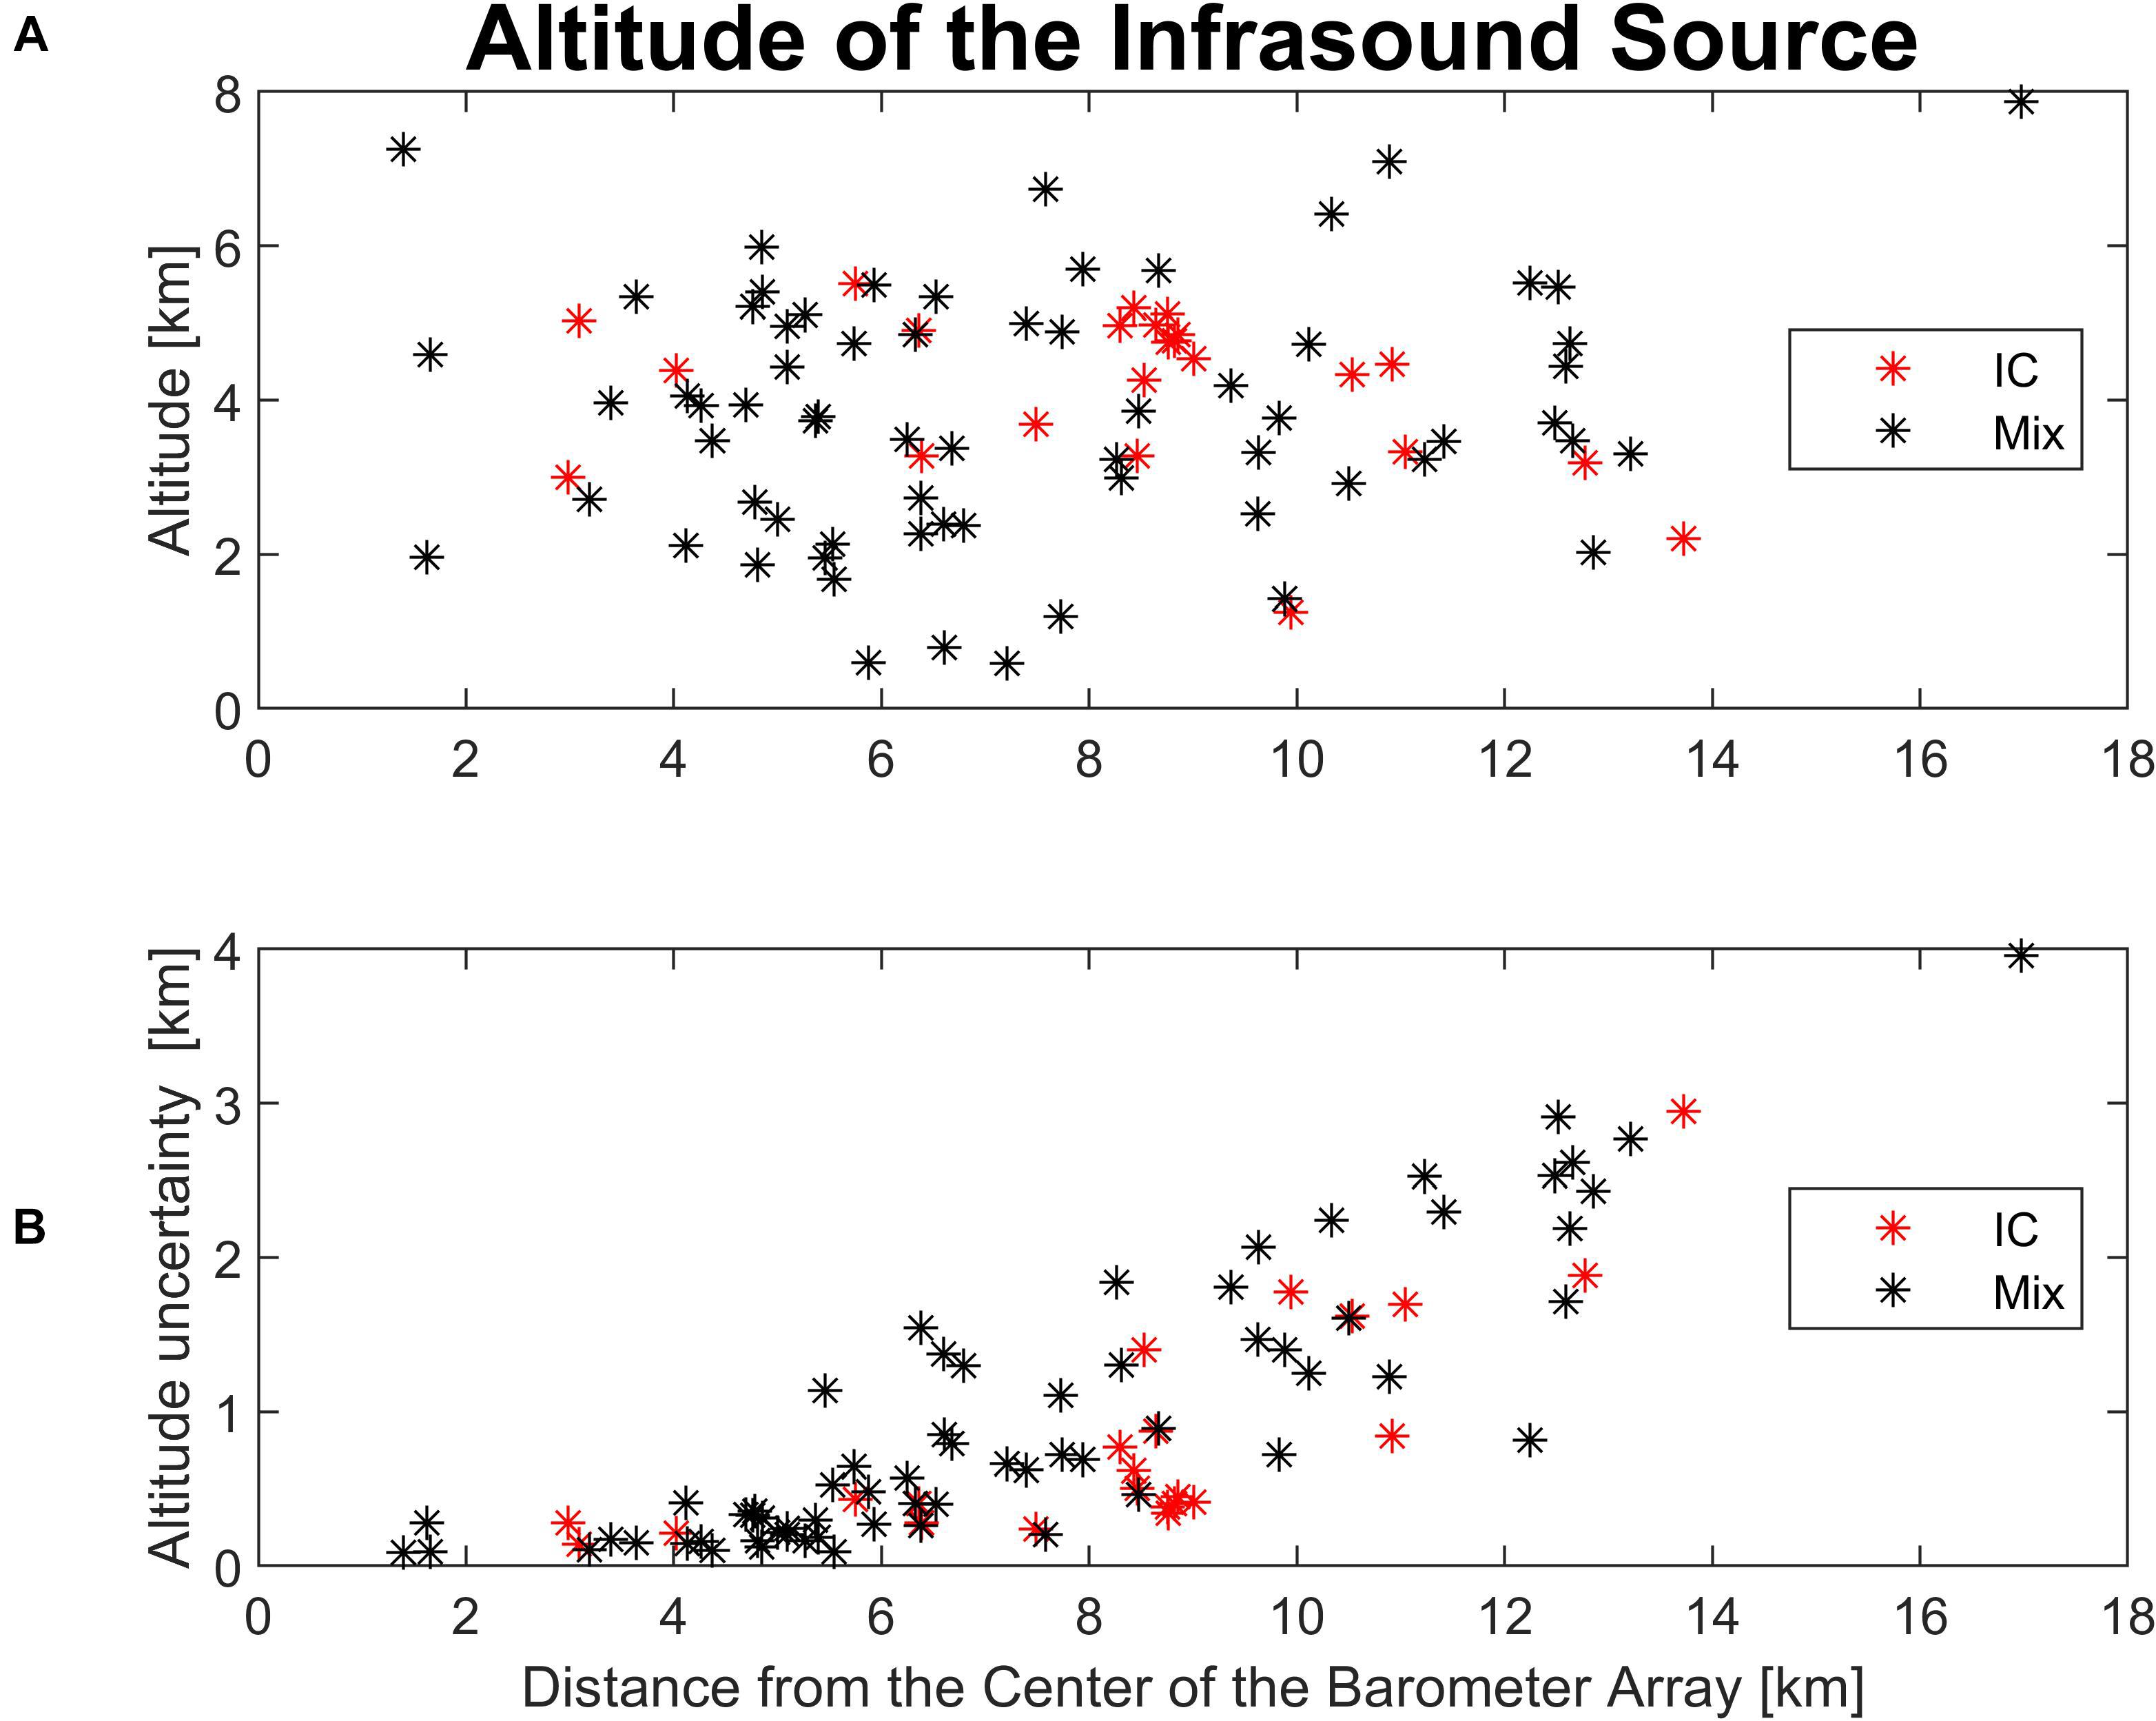
Figure 7. (A) Calculated altitude of the of the infrasound source as a function of distance from the center of the microbarometer array. Purely IC discharges are colored in red. (B) Calculated altitude uncertainties as a function of distance from the center of the microbarometer array. Purely IC discharges are colored in red.

Table 2. Altitudes of the infrasound source.
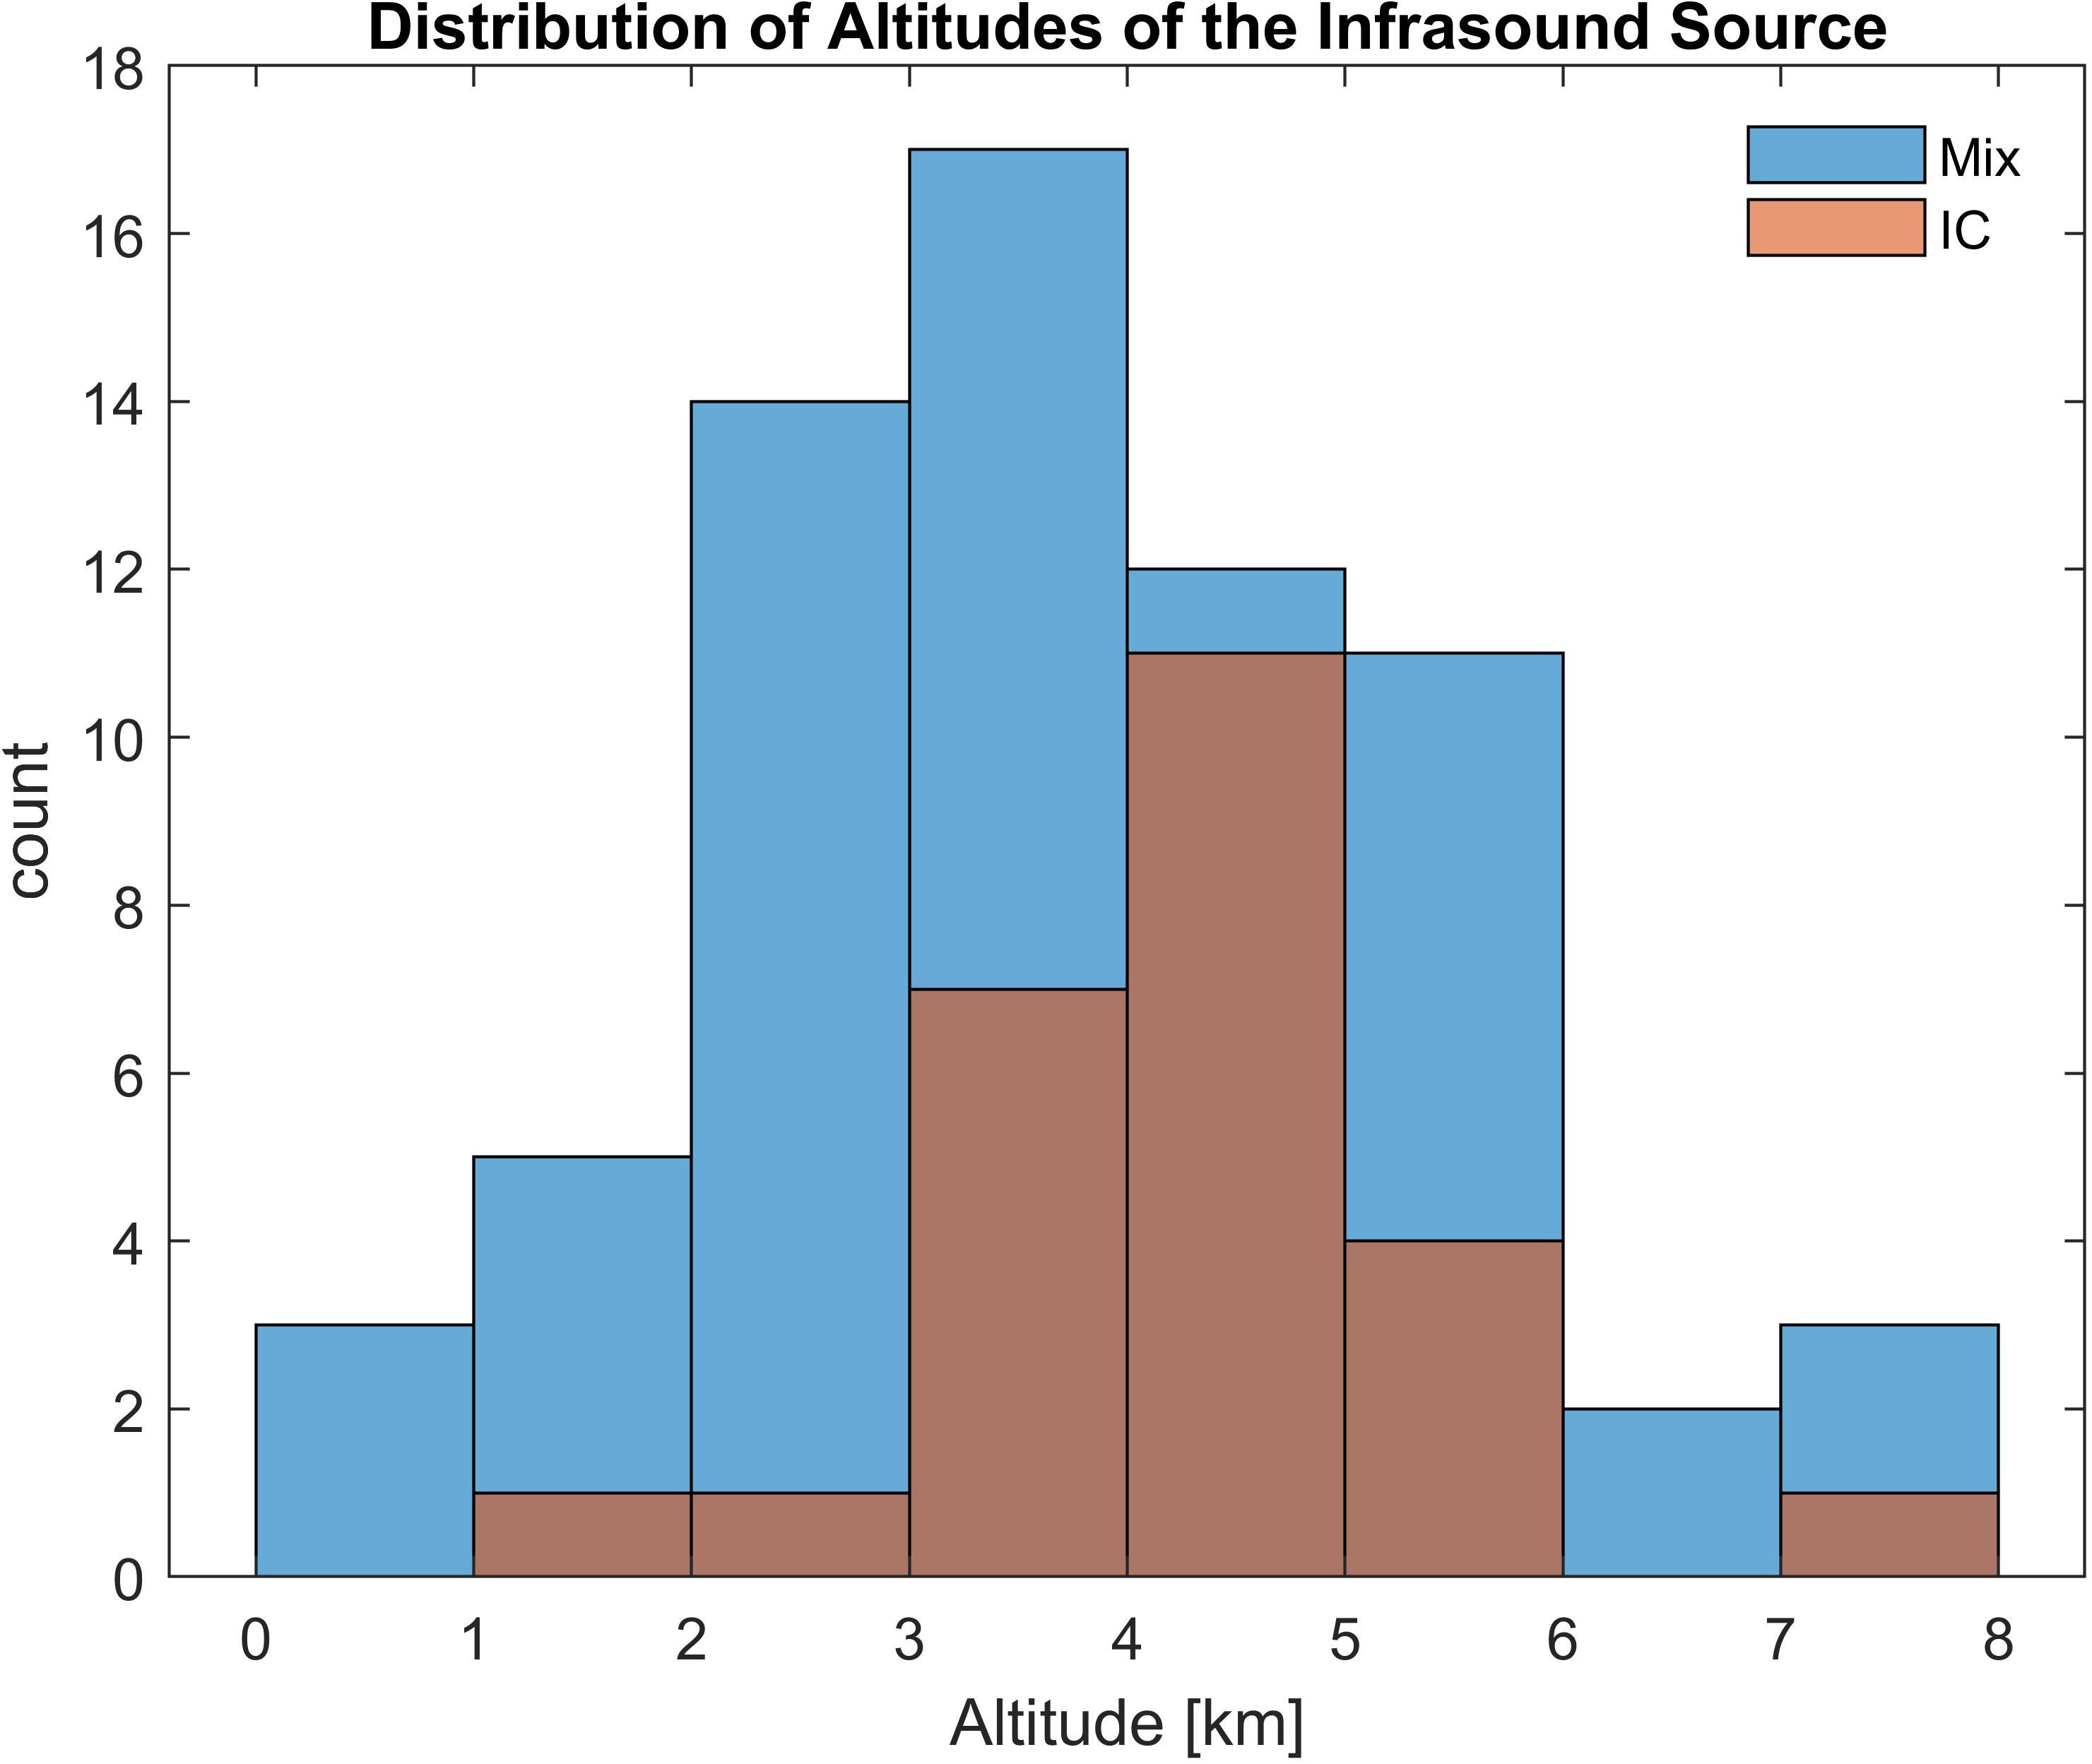
Figure 8. Distribution of calculated altitudes of infrasound source. Purely IC discharges are colored in red.
Discussion and Conclusion
The infrasound source position was successfully calculated from the measured time delays between the lightning and acoustic signal arrival to the individual infrasound sensors of the large aperture microbarometer array assuming propagation of spherical waves from the source. The reliable detection of individual infrasound signals is only possible for thunderstorms with a low to moderate frequency of lightning. In the case of a time interval containing a number of multiple flashes, the infrasound signals are mixed or overlapped. Consequently, they cannot be properly detected and assigned to the causative lightning flash.
The weather conditions, especially temperature, wind speed and direction, and their altitude profiles could strongly affect the infrasound propagation. The infrasound signals propagating to the individual microbarometers might be affected by different atmospheric conditions. In some cases, the determination of the source position was not possible. More precisely, minimizing Eq. 7 did not lead to reasonably low values. The error caused by the weather conditions was greater than the estimated uncertainty according to Eq. 8 in these cases. Such events were not included in the results.
The requirement of sufficient signal to noise ratio of the lightning - induced infrasound signal on all four microbarometers and partly also the requirement that the lightning has to be detected both by EUCLID and electric field mill limited a maximum distance of lightning that could be analyzed. Thus, mostly lightning detected within a distance of 14 km from the center of the microbarometer array were analyzed. The farthest usable flash was detected at the distance of 17 km.
The uncertainties in determining the infrasound source positions in the horizontal plane are usually less than 1 km and the calculated positions of the infrasound sources correspond to the horizontal locations of the lightning flashes indicated by EUCLID for most of the selected cases.
The calculated uncertainties of the altitudes are more sensitive to the lightning distances from microbarometers. Up to the distances of about 5 km from the center of the array, the vertical uncertainties of the infrasound sources are comparable with the uncertainties in the horizontal plane. The vertical uncertainties, however, increase for larger distances. For distances larger than about 10 km, the calculated altitude is no longer reliable and/or informative. It should also be noted that the simplified assumption of the point infrasound source, on which the calculation is based, might not always be representative, especially for the multiple—stroke discharges. This simplification also contributes to the observed uncertainties.
The calculated altitudes of infrasound thunder sources are typically 2–6 km. The calculated altitudes of pure IC flashes are usually higher than those mixed IC + CG flashes. The usual altitude range of pure IC flashes (3–5 km) is also narrower than the range obtained for mixed flashes. There are no pure CG flashes among the analyzed cases. Based on the evaluated data, it can be hypothesized that the source of infrasound pulses are IC discharges in most cases or the upper parts of CG discharges. It should be, however, noted in this respect that the analysis was limited on the localization of the region (point) from which the highest infrasound power was generated to different directions because only time instants of the most distinct pressure fluctuations were used for the calculations of source positions. As mentioned previously, the pressure fluctuations at different microbarometer sites were not sufficiently correlated to imagine the whole lightning channel as was done by Lacroix et al. (2019) who used the small-scale array. Nevertheless, the localizations of the highest infrasound source power mostly to altitudes 3–5 km in this study are consistent with some previous studies that used small scale arrays and focused on the analysis of distinct short infrasound pulses (Chum et al., 2013; Arechiga et al., 2014). Note that the studies used different methods of analysis (plane wave versus spherical wave assumptions). We assume that several small-scale arrays distributed over the area of large-scale array would make it possible to investigate sources of infrasound thunders in more detail and complexity.
Data Availability Statement
Electric field measurement data are available at http://datacenter.ufa.cas.cz/mlynky/?s=STC. Raw data from microbarographs and lightning data from the EUCLID network are available from the authors of the article at any time on request.
Author Contributions
JC designed the study. JR performed analysis and data processing. JB was responsible for microbarometers and electric field measurement and data archiving. JC and JR wrote the manuscript. All authors read and approved the submitted version.
Funding
Support under the grant 18-01969S by the Czech Science Foundation was acknowledged.
Conflict of Interest
The authors declare that the research was conducted in the absence of any commercial or financial relationships that could be construed as a potential conflict of interest.
Acknowledgments
We are grateful to Gerhard Diendorfer at Austrian Electrotechnical Association (OVE−ALDIS), for providing data from the EUCLID network.
References
Akhalkatsi, M., and Gogoberidze, G. (2009). Infrasound generation by tornadic supercell storms. Q. J. R. Meteorol. Soc. 135, 935–940. doi: 10.1002/qj.421
Arechiga, R., Stock, M., Thomas, R., Erives, H., Rison, W., Edens, H., et al. (2014). Location and analysis of acoustic infrasound pulses in lightning. Geophys. Res. Lett. 41, 4735–4744. doi: 10.1002/2014GL060375
Assink, J. D., Evers, L. G., Holleman, I., and Paulssen, H. (2008). Characterization of infrasound from lightning. Geophys. Res. Lett. 35, L15802. doi: 10.1029/2008GL034193
Bedard, A. J. (2005). Low-frequency atmospheric acoustic energy associated with vortices produced by thunderstorms. Mon. Weather Rev. 133, 241–263. doi: 10.1175/MWR-2851.1
Campus, P., and Christie, D. R. (2010). “Worldwide observations of infrasonic waves,” in Infrasound Monitoring for Atmospheric Studies, eds A. Le Pichon, E. Blanc, and A. Hauchecorne (Dordrecht: Springer), 185–234. doi: 10.1007/978-1-4020-9508-5_6
Chum, J., Diendorfer, G., Šindelářová, T., Baše, J., and Hruška, F. (2013). Infrasound pulses from lightning and electrostatic field changes: observation and discussion. J. Geophys. Res. Atmos. 118, 653–610. doi: 10.1002/jgrd.50805
Chum, J., Langer, R., Baše, J., Kollárik, M., Strhárský, I., Diendorfer, G., et al. (2020). Significant enhancements of secondary cosmic rays and electric field at the high mountain peak of Lomnický Štít in High Tatras during thunderstorms. Earth, Planets Space 72:28. doi: 10.1186/s40623-020-01155-9
Chum, J., Liu, J.-Y., Podolská, K., and Šindelářová, T. (2018). Infrasound in the ionosphere from earthquakes and typhoons. J. Atmos. Sol. Terr. Phys. 171, 72–82. doi: 10.1016/j.jastp.2017.07.022
Dessler, A. J. (1973). Infrasonic thunder. J. Geophys. Res. 78, 1889–1896. doi: 10.1029/JC078i012p01889
Farges, T., and Blanc, E. (2010). Characteristics of infrasound from lightning and sprites near thunderstorm areas. J. Geophys. Res. 115:A00E31. doi: 10.1029/2009JA014700
Few, A. A. (1969). Power spectrum of thunder. J. Geophys. Res. 74, 6926–6934. doi: 10.1029/JC074i028p06926
Few, A. A. (1985). The production of lightning-associated infrasonic acoustic sources in thunderclouds. J. Geophys. Res. 90, 6175–6180. doi: 10.1029/JD090iD04p06175
Fleagle, R. G. (1949). The audibility of thunder. J. Acoust. Soc. Am. 21:411. doi: 10.1121/1.1906528
Georges, T. M. (1973). Infrasound from convective storms: examining the evidence. Rev. Geophys. Space Phys. 11, 571–594.
Goerke, V. H., and Woodward, M. W. (1966). Infrasonic observation of a severe weather system. Mon. Weather Rev. 94, 395–398.
Holmes, C. R., Brook, M., Krehbiel, P., and McCrory, R. (1971). On the power spectrum and mechanism of thunder. J. Geophys. Res. 76, 2106–2115. doi: 10.1029/JC076i009p02106
Johnson, J. B., Arechiga, R. O., Thomas, R. J., Edens, H. E., Anderson, J., and Johnson, R. (2011). Imaging thunder. Geophys. Res. Lett. 38, L19807. doi: 10.1029/2011GL049162
Lacroix, A., Coulouvrat, F., Marchiano, R., Farges, T., and Ripoll, J. F. (2019). Acoustical energy of return strokes: a comparison between a statistical model and measurements. Geophys. Res. Lett. 46, 11479–11489. doi: 10.1029/2019GL085369
Lacroix, A., Farges, T., Marchiano, R., and Coulouvrat, F. (2018). Acoustical measurement of natural lightning flashes: reconstructions and statistical analysis of energy spectra. J. Geophys. Res. Atmos. 123, 12,040–12,065. doi: 10.1029/2018JD028814
Landes, M., Ceranna, L., Le Pichon, A., and Matoza, R. S. (2012). Localization of microbarom sources using the IMS infrasound network. J. Geophys. Res. 117:D06102. doi: 10.1029/2011JD016684
Pasko, V. P. (2009). Mechanism of lightning-associated infrasonic pulses from thunderclouds. J. Geophys. Res. 114:D08205. doi: 10.1029/2008JD011145
Schulz, W., Diendorfer, G., Pedeboy, S., and Poelman, D. R. (2016). The European lightning location system EUCLID – Part 1: perfor-mance analysis and validation. Nat. Hazards Earth Syst. Sci. 16, 595–605.
Šindelářová, T., Chum, J., Skripniková, K., and Baše, J. (2015). Atmospheric infrasound observed during intense convective storms on 9-10 July 2011. J. Atmos. Sol. Terr. Phys. 122, 66–74. doi: 10.1016/j.jastp.2014.10.014
Keywords: infrasound, lightning, thunder, acoustic, spherical, waves
Citation: Rusz J, Chum J and Baše J (2021) Locating Thunder Source Using a Large-Aperture Micro-Barometer Array. Front. Earth Sci. 9:614820. doi: 10.3389/feart.2021.614820
Received: 07 October 2020; Accepted: 25 February 2021;
Published: 17 March 2021.
Edited by:
Martin Fullekrug, University of Bath, United KingdomReviewed by:
Graeme Marlton, Met Office, United KingdomThomas Farges, Commissariat à l’Energie Atomique et aux Energies Alternatives (CEA), France
Copyright © 2021 Rusz, Chum and Baše. This is an open-access article distributed under the terms of the Creative Commons Attribution License (CC BY). The use, distribution or reproduction in other forums is permitted, provided the original author(s) and the copyright owner(s) are credited and that the original publication in this journal is cited, in accordance with accepted academic practice. No use, distribution or reproduction is permitted which does not comply with these terms.
*Correspondence: Jan Rusz, cnVzekB1ZmEuY2FzLmN6