 Jean Paul Ngarukiyimana1
 Yunfei Fu1*
 Celestin Sindikubwabo2Idrissa Fabien Nkurunziza1,3
 Faustin Katchele Ogou2
 Floribert Vuguziga4Bob Alex Ogwang5
 Yuanjian Yang4,6*
- 1School of Earth and Space Sciences, University of Science and Technology of China, Hefei, China
- 2University of Chinese Academy of Science, Beijing, China
- 3University of Rwanda, Kigali, Rwanda
- 4School of Atmospheric Physics, Nanjing University of Information Science and Technology, Nanjing, China
- 5Uganda National Meteorological Authority, Kampala, Uganda
- 6State Key Laboratory of Loess and Quaternary Geology, Institute of Earth Environment, Chinese Academy of Sciences, XianChina
Rwanda has experienced high temperature rising phenomena over the last decades and hence, highly vulnerable to climate change. This paper examined the spatial and temporal variations of daily maximum and minimum surface air temperature (Tmin and Tmax) and diurnal temperature range (DTR). It studied variables at monthly, seasonal and annual time-scales from 1961 to 2014. The study applied various statistical methods such as ordinary least-square fitting, Mann-Kendall, Sen’ slope and Sequential Mann-Kendall statistical test to the new reconstructed ENACTS dataset that cover the period from 1983 to 2014 while pre-1983s recorded data from 24 meteorological stations have been added to complete the lengthiness of ENACTS data. The January to February season did not show a significant trend at seasonal time-scales. The authors decided only to consider March-to-May, June-to-August and October-to-December seasons for further analyses. Topography impacts on temperature classified stations into three regions: region one (R1) (1,000–1,500 m), region two (R2) (1,500–2,000 m) and region three (R3) (≥2,000 m). With high confidence, the results indicate a significant positive trend in both Tmin and Tmax in all three regions during the whole study period. However, the magnitude rate of temperatures change is different in three regions and it varies in seasonal and annual scale. The spatial distributions of Tmax and Tmin represent a siginificant warming trend over the whole country notably since the early 1980s. Surprisingly, Tmin increased at a faster rate than Tmax in R3 (0.27 vs. 0.07°C/decade in March-to-May) and (0.29 vs. 0.04°C/decade in October-to-December), resulting in a significant decrease in the DTR. This is another confirmation of warming in Rwanda. The mutation test application exhibited most of the abrupt changes in the seasonal and annual Tmax and Tmin trends between 1984 and 1990. The present work mainly focus on the spatial and temporal variability of Tmin, Tmax and DTR in Rwanda and their relationship with elevation change, leaving a gap in other potential cause factors explored in the future.
Introduction
The harmful impacts of climate change on human life, infrastructure and ecosystem have led to increased studies on the subject globally (IPCC, 2001a; Alexander et al., 2006; Myoung et al., 2013). Temperature is one of the most critical climate factors that affect human, agriculture, and to a significant extent, thermal comfort (Walther et al., 2002; Diaz et al., 2005). Global warming and climate variability have remained a hot topic of debate worldwide (Morak et al., 2013; Otto and Friederike, 2016; Easterling et al., 2000; Penuelas and Flella, 2001; IPCC, 2001b). Globally, the temperature has been characterized by warming in minimum and maximum temperature (Vose et al., 2005; Brown et al., 2008; Donat et al., 2013).
The fifth assessment report (AR5) of the Intergovernmental Panel on Climate Change (IPCC) approximated an average increase of global temperature in 1951–2012 to be 0.72°C. Furthermore, The IPCC (2013) revealed that the hottest 30-year period in the last 1,400 years might have been between 1983 and 2012. The report suggested that the trend in Tmean may be due to changes in either Tmax or Tmin, or relative changes in both (IPCC, 2013). Considering that the changes in mean temperature (Tmean) were broadly an essential indicator of climate change, but changes in maximum and minimum temperatures (hereafter Tmax and Tmin) provide more valuable information than the Tmean alone (Safeeq et al., 2013; Iqbal et al., 2016; Yang et al., 2013; 2020a). Several authors noted that the minimum temperatures are warming more rapidly than maximum temperatures (IPCC, 2007; Christy et al., 2009; Stern et al., 2011; Nicholson et al., 2013). Consequently, the assessment of fluctuations of observed and simulated Tmax and Tmin has captured many researchers’ attention (Revadekar et al., 2013; Sayemuzzaman et al., 2015; Easterling et al., 1997; Lobell et al., 2007; Tingley and Huybers, 2013). It is likely agreed that Tmax and Tmin trends and variability play an essential role in detecting climate change impacts on human health such as vector-borne disease (Ren et al., 2016; Sun et al., 2017). The impacts of extreme temperature on mortality have been confirmed in a number of other studies (Barreca et al., 2016; Heal and Park, 2016; Ndenga et al., 2006) revealed that unusual high maximum temperatures positively correlate with many malaria cases. For instance, according to the findings from Rwanyiziri and Rugema (2013), the rise in temperature and changes in the amount of rainfall and its distribution have altered water resources availability, consequently affecting rice productivity across Bugesera District. Moreover, studies have indicated that spatiotemporal changes of Tmax and Tmin significantly affect the intensity, duration and extent of temperature extremes worldwide (Salman et al., 2017; Sun et al., 2017). Furthermore, food production, biodiversity, and ecosystems are highly affected by Tmax and Tmin changes (Qasim et al., 2016; Walther et al., 2002; Smith et al., 1999). Similarly, Parmesan et al. (2003) found that climate change is already affecting living systems. Other studies indicate that the changes in Tmax and Tmin has a significant impact on agriculture, health, food security (Iqbal et al., 2016). Thus, the assessment of Tmax and Tmin’s long-term changes is to better understand impacts of climate change to a country with economy depending on agriculture like Rwanda (Minitere, 2006). Moreover, such information is useful for proper climate adaptation plan in future at the local level (Berardy and Chester, 2017).
Rwanda has experienced a significant increase in temperatures in recent years and hence, highly vulnerable to climate change. Previous studies have reported dynamic changes in Tmax and Tmin over different parts of Rwanda (Henninger, 2009; Minitere, 2006; Eriksen and Rosentrater, 2008; Safari, 2012). An increase in temperature of approximately 0.7–0.9°C over Rwanda in the last century were reported (Eriksen and Rosentrater, 2008). Similarly, Henninger (2009) reported an average of 1.5°K increase in temperature with air pollution increase in Kigali city. The detected temperatures fluctuation in Kigali city was attributed to the growing population urbanization and industrialization experienced in that area. By analyzing precipitation and air temperature records from 6 sites in Rwanda for the period 1964–2010, a warming pattern over past 40 years at the average of 0.35°C per decade has been noted by Mohammed et al., 2016.
Moreover, a significant warming trend for the period after 1977–1979 has been detected where the capital Kigali recorded a slope of 0.0455°C/year (Safari, 2012). The studies mentioned above have reported significant results in terms of dynamic variability of Tmax and Tmin over some regions of Rwanda. However, most of those previous studies were limited to a specific area, which may fail to cover country’s general representation. Furthermore, none of those previous studies did consider the impact of topography and seasonal variation factors, which are very important in detecting and attributing climate change in Rwanda’s regional difference. Previous studies have almost agreed that topography regulates temperatures distribution in many regions where Tmin changes has been recorded to be significantly related to the elevation (Revadekar et al., 2013; Sun et al., 2017). Therefore, it is of great importance to have appropriate knowledge of previous Tmax and Tmin variability to reduce the impact caused by their changes in the future.
The present study’s objective is to examine the long-term variations and trends of the surface air temperature based on a perspective of Tmax and Tmin, and diurnal temperature range (DTR) series over Rwanda on monthly, seasonal and annual time-scales. Thus, this study improves terms of changes in Tmax and Tmin with the extended time scale, stations and additional statistical analysis. Furthermore, no comprehensive research made to assess the spatial and temporal changes in Tmax and Tmin over the whole country. Rwanda recorded significant economic development over last years. The government aims to achieve more in its vision 2050 (Punam and Manka, 2011; U.N Economic Commission for Africa, 2016). However, climate change and its related risks could become potential threats to achieving these goals. Therefore, it is vital to assess the spatial and temporal changes in Tmax, and Tmin in the study area.
This study focus on observed changes in Tmax and Tmin over Rwanda for the period 1961–2014. It is also the first of its kind to detect abrupt changes in seasonal and annual time series of Tmax and Tmin in the target area and to combine the new reconstructed ENACTS (the Enhancing National Climate Services) data with the previous observed stations data for analysis.
Study Area, Data and Methodology
Rwanda with equatorial climate lies within latitude 1°4′–2°51′S and longitude 28°53′–30°53′E (Figure 1A). It is positioned near the equator in between central and East Africa. Rwanda is bounded with Uganda in the north, Tanzanian East, the Democratic Republic of the Congo in West and Burundi in South. The high elevation influence leads the country to enjoy temperate climate varying with topography (Figure 1A). Its topography dominated by mountains in the volcanic highland areas of north and north-western region with abundant rainfall (>1,200 mm) and savannah region to the east and southeast with less rainfall (<900 mm) through the year (Figure 1B). Rwanda has two rainy seasons separated by two dry seasons with March-May being the ‘long rains’ season. The monthly averaged maximum temperature occurs in August. The monthly averaged sub-maximum monthly averaged temperature occurs in February. There are two minima for monthly averaged temperature in May and November (Figure 1C). The average, maximum and minimum temperature for Rwanda varies with the topography. For example, the warmest annual average temperatures are in the eastern plateau (20–21°C), and the southwestern in the valley of Rusizi (23–24°C), and cooler temperatures are in higher elevations of the central plateau (17.5–19°C) and high-lands (<17°C) (Figures 2A–C).
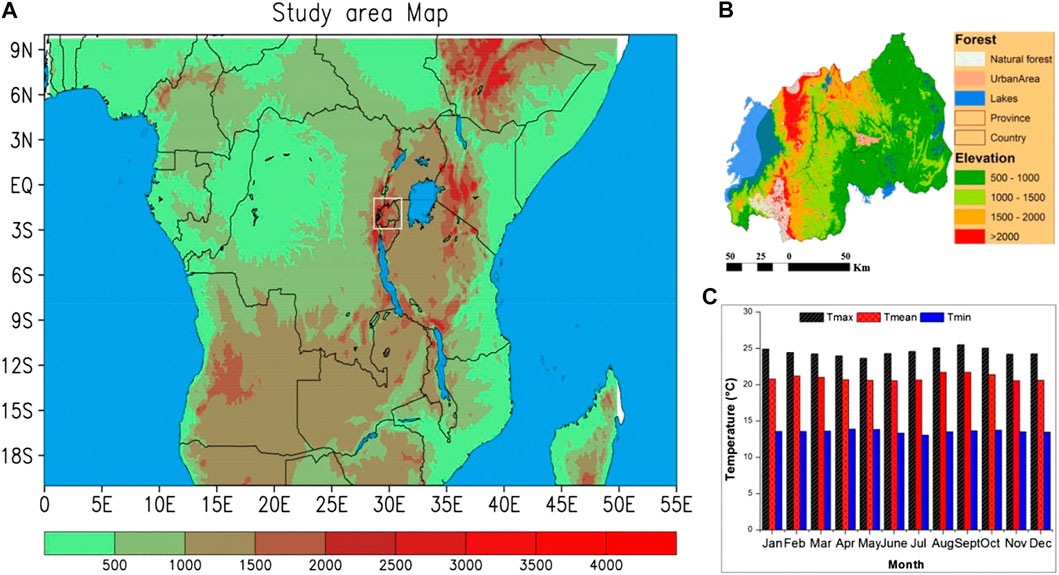
FIGURE 1. Study area: (A) Location of Rwanda in Middle Africa, (B) Topography of Rwanda, (C) Climatological monthly means of Tmax, Tmean and Tmin over Rwanda during 1961–2014.
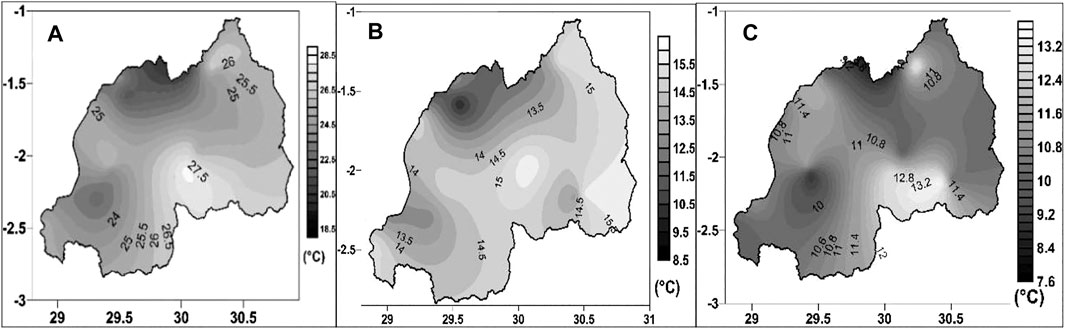
FIGURE 2. Distribution of (A) Minimum, (B) Maximum and (C) diurnal temperature over Rwanda for the period of 1961–2014. Unit (°C) (Note: X-axis refers to longitude while Y-axis stand for latitude).
The data used in this study were obtained from Rwanda Meteorology Agency (RMA). Due to the existing gap in observed stations data of mid-1990s during the Genocide to 2010, the ENACTS project supported by the International research Institute for Climate and Society (IRI) and its partners was initiated and aimed to fill that gap. The reconstructs temperature data were obtained by combining station data with reanalysis data and the merged final product is spatiotemporally complete from the early 1983s to present. The ENACTS data used in this study cover the period from 1983 to 2014. The quality control of station data was performed during the generation of new data set. The same ENACTS data were used by Siebert et al. (2019) to analysis the temperature climatology for the period between 1981 and 2016. Detailed information on ENACTS data can be freely accessed online via http://maproom.meteorwanda.gov.rw. In order to cover the whole study period of 54 years, a monthly temperature was calculated from observed daily data from 24 weather stations covering the period from 1961 to 1983. The selected stations from observed data are the same stations used in ENACTS data. Data quality was checked and only stations with length records completeness are used. The selected stations from observed data are the same stations used in ENACTS data. It is very important to mention that before 1990s, there is no significant gap in reported data from meteorological stations. Safari, 2012 used the same observed data to examine the trend of mean annual temperature from five observatories during 1958–2010. While those previous studies have used stations observed data and ENACTS data separately, the current study combine both datasets to give more information on Rwanda’s climate. Due to the strong influence of topography those stations were classified into three different regions; region one (R1), region two (R2) and region three (R3) with the elevation ranging 1,000–1,500 m, 1,500–2,000 m, and ≥2,000 m respectively (Table 1), to provide a proper spatial coverage over the entire country.
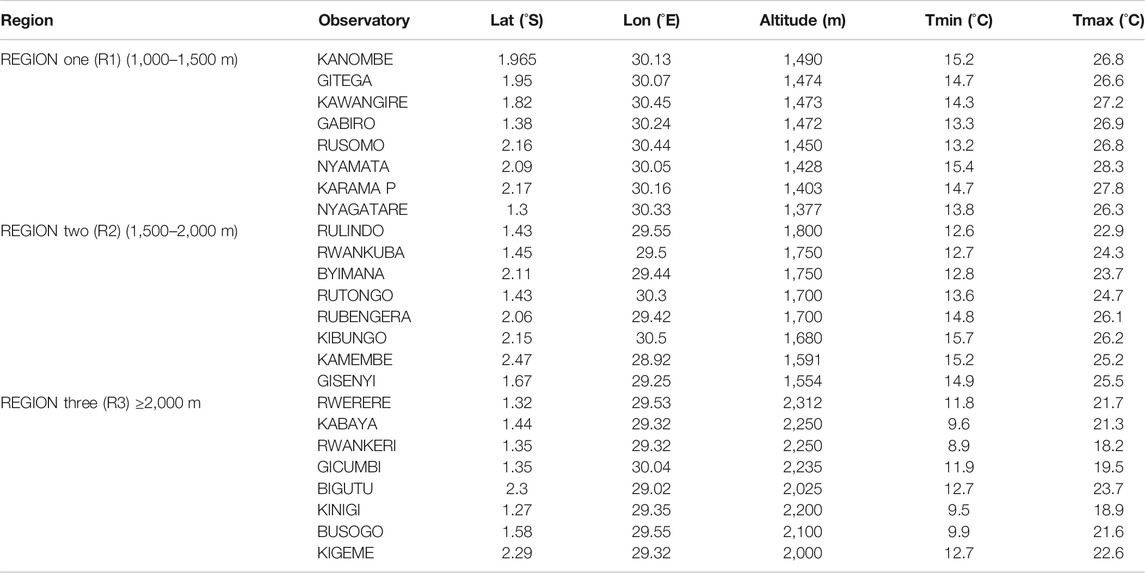
TABLE 1. Selected Stations and their respective location based on their elevation in three various regions (region one, region two and region three).
Table 1 shows the details of the weather stations used in this study to complete the ENACTS dataset. For each region, stations with elevation in the same range are combined together and monthly values were averaged for the temperature to get seasonal and annual averages. Although the calculation of data from each station can provide an insight into climatic trends for those particular regions, it is not appropriate to use a single station to represent the entire region. Homogeneity of the regional series was checked before in-depth analysis and confirmed by applying the Kruskal-Wallis test (Theodorsson-Norheim, 1986). The three seasons considered were long rains season “March to May” (MAM), the dry season “June to August” (JJA), and short rains season “October to December” (OND). Those chosen three seasons have a very significant impact on crop production and hence people’s life. During preliminary results, the JF season temperatures did not show a significant change, therefore JF was removed from further analysis.
The magnitude of the trends was derived from the regression line’s slop using the least-squares method. Simultaneously, the statistical significance was determined by Mann-Kendall and Student t-test (Sneyers, 1990). The Sneyers’ research, in temperature and precipitation studies, the moving average is a conventional procedure used to reduce the intra-annual variability of series. A 5-years running average was employed in this study. For each element Xi (i = 1, … ,n), the number of lower elements Xj (Xj < Xi) preceding it (j < i) is calculated and the statistical parameter t is given by:
The distribution of the test statistic t under the null hypothesis has an expected value
The hypothesis is rejected for
Mann-Kendall (MK) Test
The Mann-Kendall (Mann 1945; Kendall 1975) test is applied in trend analysis to detect the type of trend in temperatures and its significance. The MK test is a nonparametric test widely known for its flexibility and simplicity f in estimating trends. This test is commonly used in meteorological studies (Asfaw et al., 2018; Weldegerima et al., 2018; Praveen et al., 2020). It is based on null and alternative hypotheses (H0 and H1). In the assessment, the null hypothesis (H0) assuming no trend in the data is rejected if standard normal test statistics Z > 1.96. Alternative hypothesis H1 suggests a monotonic trend. The computation of the MK test is shown below:
where,
The components xj and xk are seasonal mean temperature values in years j and k with k > j.
S represents the Kendall test statistics and is assumed to be normal distributed. A positive (negative) value of S indicates an increasing (decreasing) trend. Thus, for the selected sample with
n is the number of observation and variables m and ti stand for the number of ties and sample points in the sample
The statistical test Z is obtained from Eqs (2) and (3) as follow:
The positive or negative Z value depict trends directions (upward or downward). In case Z = 0, the data series is assumed to be normally distributed. The standard test statistic Zα is used to measure the trend significance. In case |Zα| is greater than Zα/2, the trend is significant. Here α represents the chosen significance level (e.g., 5% with Z 0.025 = 1.96).
Theil Sen’s Slope Estimator
The magnitude of seasonal temperature trends is based on Theil sen’s slope method (Sen, 1968). Senvs slope estimator is another nonparametric method widely used to detect the magnitude of time series data. It frequently used to estimate an intercept of a linear regression equation.
For a given time series x, the computation of slope Q between two random values use equation below:
xk and xj are the data values at times k and j (j > k).
The Median of N Values of Qi is Computed as
The positive or negative Qmed indicates an increasing or decreasing trend.
Sequential Mann-Kendall (SMK) test is employed to show a change in trend with time. Forward sequential statistic [u(t)] and backward sequential statistic [u′(t)] from progressive analysis of the MK test help in the analysis of change in trend with time (Sneyers, 1990). Hence, trend analyses on monthly, seasonal and annual time-scales were performed in order to capture changes in temperature series for Rwanda. The progressive MK values u(t) and u′(t) were calculated using the appropriate MK test for each dataset, from the beginning to the end of the study period. In the analysis of SMK, the confidence limits of the standard normal z values at α = 5%. The lower and upper confidence limits, thus, correspond to −1.96 and +1.96, respectively. The method has been used in related studies in East Africa (Nsubuga et al., 2014; Ongoma and Chen 2017) as well as over Rwanda by Safari (2012).
Results
Using available temperatures data for the period 1961–2014, the distribution of Tmin, Tmax and DTR is displayed in Figure 2 (Temperature unit (Degree Celsius). Over Rwanda, the distribution of temperature increase eastwards, from region of high altitude in north and south west to the low land in east part of the country (Figures 2A–C). Topography regulates the temperatures distribution over the country. The maximum and minimum data were analyzed for the period 1961–2014. In general, maximum and minimum temperature increase through most of the period whereas the STR is basically trendless.
Long-Term Trends in Daily Minimum and Maximum Temperature
Tmin, Tmax and DTR trends in R1, R2 and R3, are presented in Table 2 with significant trends at a 95% confidence level. The seasons’ MAM, JJA and OND are considered along with the annual trend for further analysis. Figure 3A shows seasonal and annual temperatures trends from the observatories over the period 1961–2014 using a linear regression model. The slope of the regression line describes the rate of change. The Tmin, Tmax and DTR were analyzed separately. Table 2 shows that the region one (R1) made up by all stations with altitude ranging between 1,000 and 1,500 m has experienced a considerable increase of 0.3°C/decade of Tmin during MAM season while 0.32°C/decade Tmin is noted during the JJA season and 0.37°C/decade of Tmin during OND season. The rate of increase of Tmin is higher in OND season compared to the two remaining seasons. On the annual scale, a positive trend at the rate of 0.33°C/decade of Tmin is noted. On the other hand, Tmax has significantly increased at the rate of 0.61°C/decade in MAM season and 0.63 °C/decade in JJA in R1 while 0.58°C/decade for OND season is registered. In contrast to Tmin, the highest rate of increase for Tmax is observed in JJA season as well as in annual scale with a rising rate of 0.63°C/decade. Thus, the region one (R1) has experienced increase in both minimum and maximum temperature. The Tmax has increased more rapidly than Tmin in R1 during MAM, JJA and at annual scale which leads to the observed positive trend of diurnal temperature in that region (Figure 3A,B, left column and Table 2).
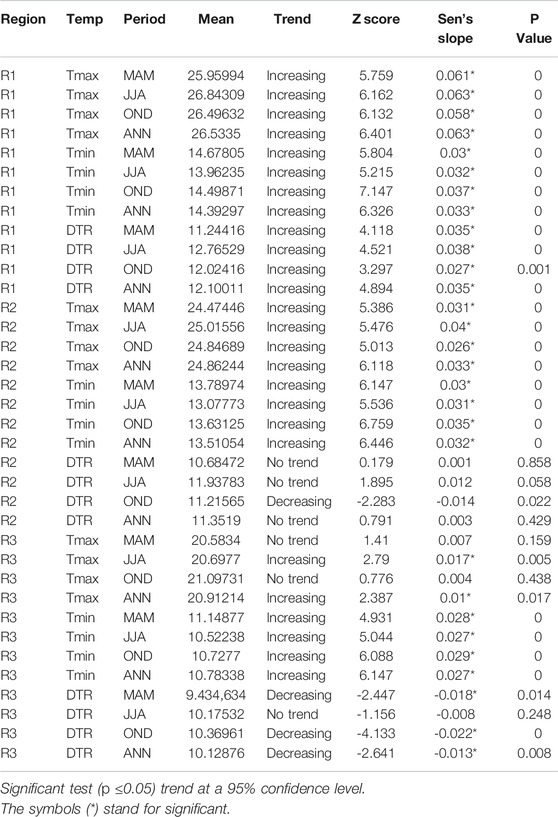
TABLE 2. Annual and Seasonal Trends (°C/decade) from 1961 to 2014 for minimum, maximum and DTR for R1, R2 and R3 at 95% confidence level.
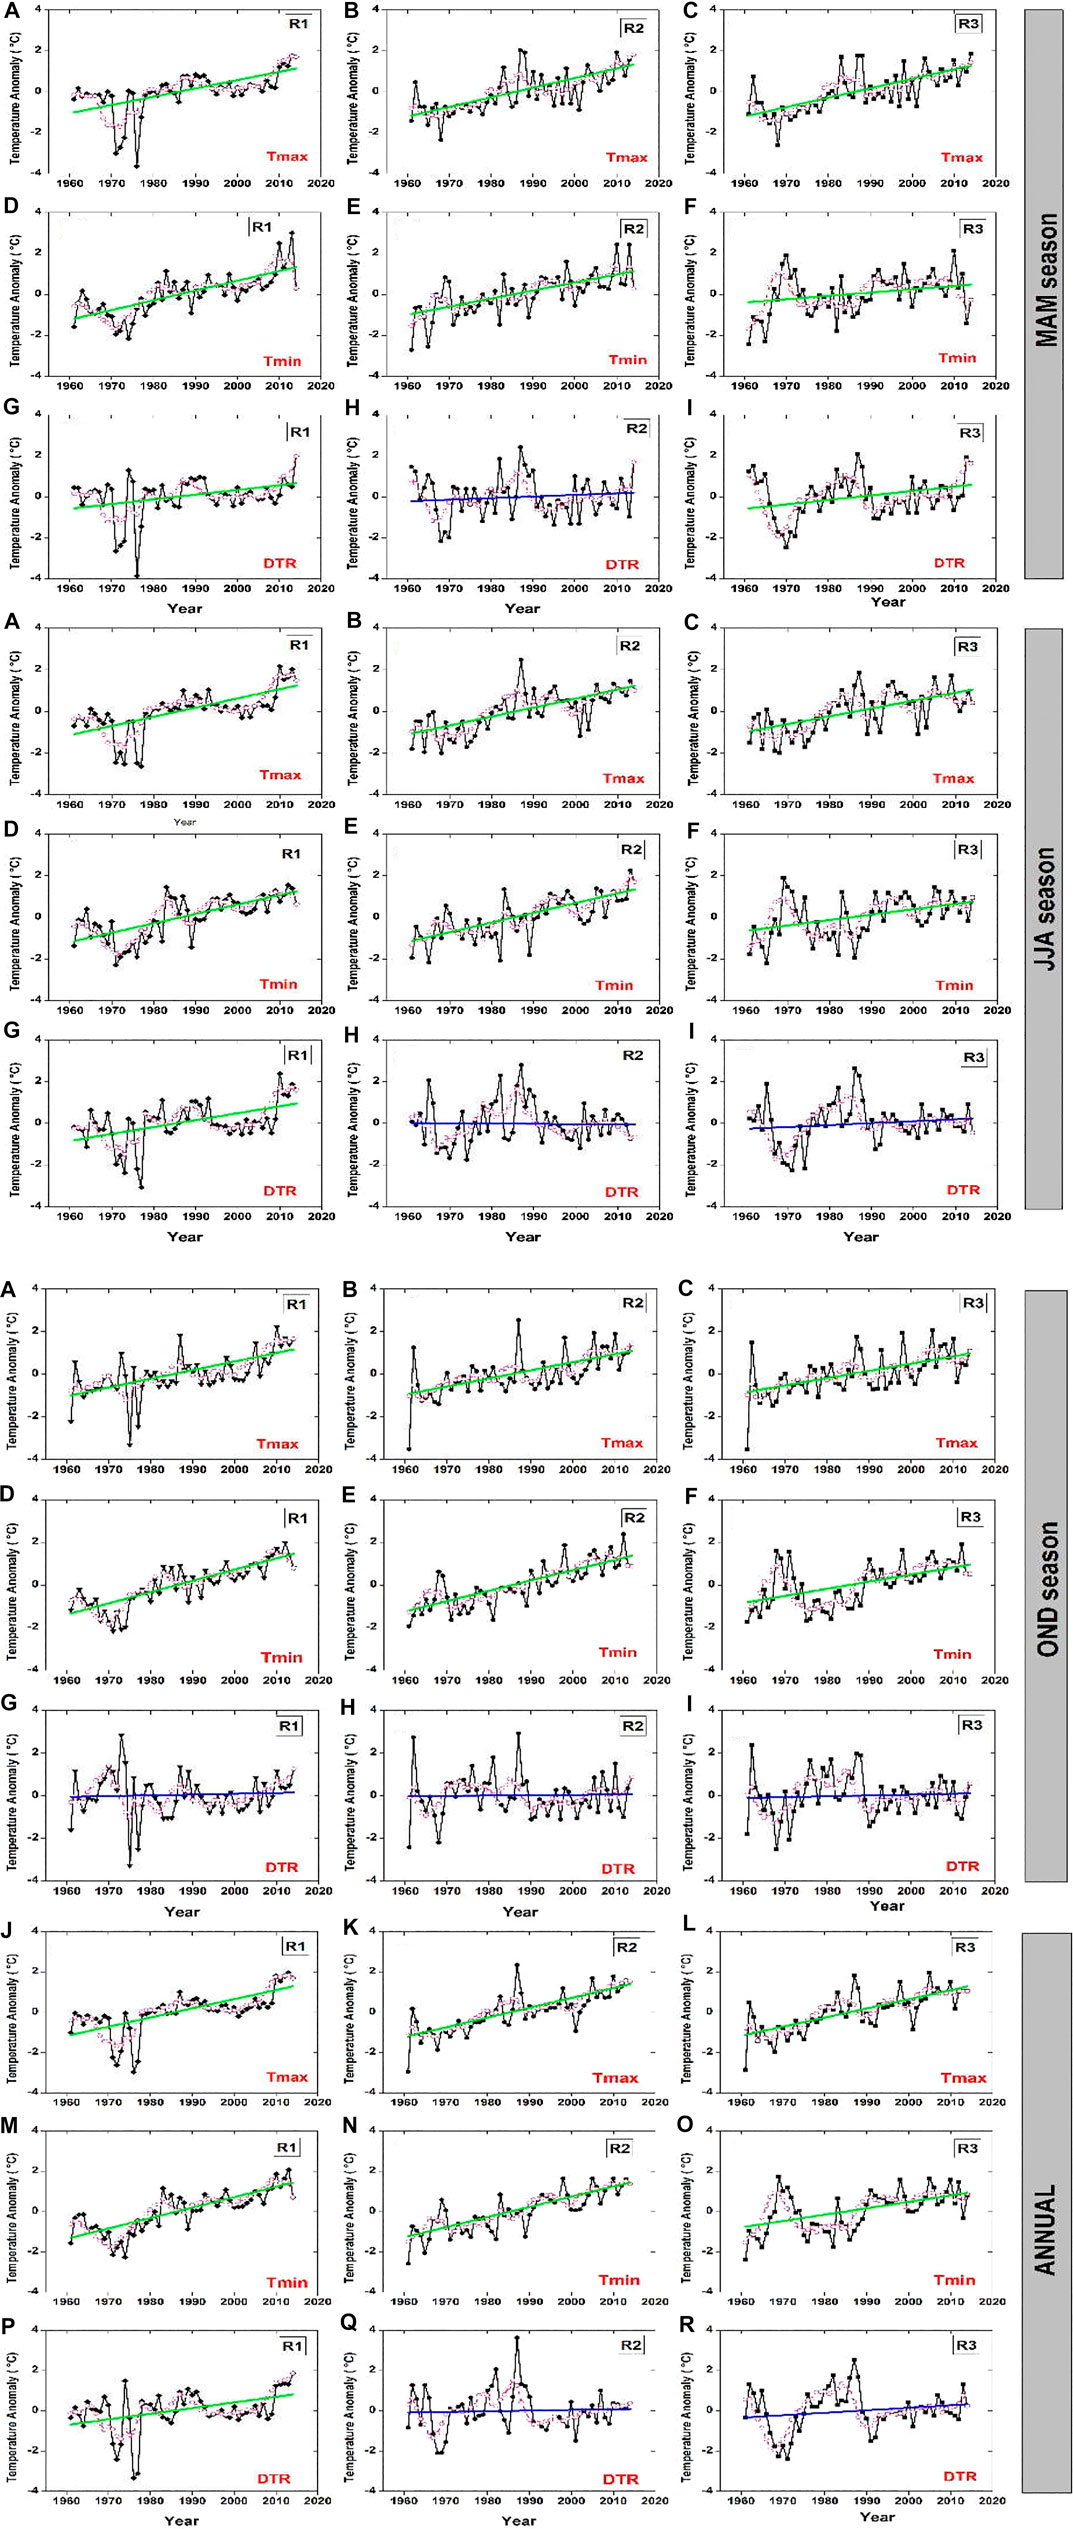
FIGURE 3a. Five-year moving average of monthly, seasonal (MAM and JJA) Maximum, Minimum and Diurnal Temperature and their linear Trends for three regions (R1: 500 ≤ stations ≤1,500 m; R2:1,500 m ≤ stations ≤2,000 m; R3: stations ≥2,000 m) over the period of 1961–2014. Green line indicates significant raising while the blue line indicates a neutral or decreasing trend.
FIGURE 3b. The same analysis for OND and Annual.
Same as the analysis above, the situation in region two (R2) which is composed by all stations between 1,500 and 2,000 m of altitude was examined. Results show that both Tmin and Tmax have increased with Tmin raising more rapidly in OND season. An increased rate of 0.3°C/decade Tmin in MAM and 0.31°C/decade in JJA while the rate of increase of 0.35 and 0.32°C/decade are observed in OND season and Annual, respectively. There is no observed trend of diurnal temperature in R2 and this is because the rate of Tmin increase is greater particularly in OND season. Authors also note a Tmax moderate positive trend rate of 0.31°C/decade in MAM and 0.4°C/decade in JJA while 0.26 and 0.33°C/decade are noted in OND season and annual scales in R2 (Figure 3A,B, middle column and Table 2).
Further investigation on the temperatures trend was conducted in the region three (R3) formed by all observatories with an altitude greater than 2,000 m. This high mountains region is commonly known to have low temperatures compared to the previous two regions. Surprisingly, the results show a positive increase of both Tmin and Tmax with a very rapid increase of Tmin in all seasons and at annual scale. The rate of increase is recorded to be 0.07°C/decade for Tmax in comparison to 0.28°C/decade of Tmin during MAM and 0.17°C/decade of Tmax along with 0.27°C/decade of Tmin during JJA (Table 2). Similarly, the rate of rising of Tmin in OND season was higher than that of Tmax at the rate of 0.28 and 0.04°C/decade, respectively in R3 (Figure 3A,B, right column and Table 2).
Generally, an increase of maximum temperature and minimum temperature is revealed for the whole study period at different rate on seasonal and annual scale. Surprisinly, Tmin increase rate is also noted to be higher than that of Tmax in R3. Figure 3A,B depicts the MAM, JJA and OND seasonal along with annual time series for each variable. Results show that both Tmax and Tmin increase from later 1970s to present, with decreasing in DTR in region three. The DTR is not decreasing in R1 as both Tmin and Tmax increase with rapid increase in Tmax. However, a slightly decreases in R2 is noted during the study period, with a notable decrease in R3. From 1961 to 2014, the Tmax trend during OND season in R1, R2 and R3 is 0.58, 0.26, 0.04°C/decade respectively. The Tmin trend in the same seasons is 0.37, 0.35, and 0.28°C/decade for R1, R2 and R3 and DTR trend is 0.27, −0.07 and −0.22°C/decade in R1, R2 and R3, respectively (the trends were computed using least-squares regression). DTR trend decreases, which likely reflects the accelerated rate of warming in the Tmin. Considering the rate of annual trend from 1961 to 2014, the Tmax trend rate in R1, R2 and R3 is recorded to be 0.63, 0.33 and 0.1°C/decade. On the other side, the rates of 0.33, 0.32, 0.27°C/decade, in R1, R2 and R3 for Tmin are registered with DTR trend rate of 0.35, 0.03, and −0.134°C/decade. Thus, temperatures in R3 (normally cold region) exhibit notable increases in all seasons while OND season experiences many variations in all regions.
Generally, the analysis of temporal variations of seasonal and annual Tmax and Tmin over Rwanda (Figure 3A,B) indicates that both Tmax and Tmin have increased in all seasons and annual scales. a sharp increase is observed in October to December season and annual scales. The results agreed with the previous study by Safari, 2012 who also reported a significant warming trend for the period after 1977–1979 where Kigali, The capital city presented the highest value of 0.0455°C/year (i.e., 0.45°C per decadal). Furthermore, the results show that Tmax increasing rate was four times (around 0.61°C/decade) the rate of global average increase of 0.15°C/decade in R1, two times in R2.
The Spatial Variations of Annual and Seasonal and Decadal Tmax
The country has 30 districts and each district is represented at least by one station. In order to have a complete coverage of the whole nation the linear interpolation from the station data was employed. Figure 4A depicts the spatial distribution of seasonal and annual of Tmax over Rwanda during 1961–2014. Low temperatures are observed in northern part in all seasons with average Tmax of 20°C while high temperatures are observed in the eastern and south eastern region with average of 28°C. In comparison to seasonal Tmax distribution over the study period, more warming is observed in JJA as compared to MAM and OND season. The distribution of temperatures at decadal series shows that the country has generally experienced an extended warming in all regions since 1961 which is clearly noted in latter 1980s. The decadal Tmax for MAM, JJA, OND season and annual are displayed in Figure 4A. In agreement with the observed standardized anomaly (Figure 3A), the highest warming was observed in last decade of 2010s covering almost the whole study area. The early 1960s period is dominated by lower temperatures in all regions. The highest warming is recorded in the eastern and southern parts of the country.
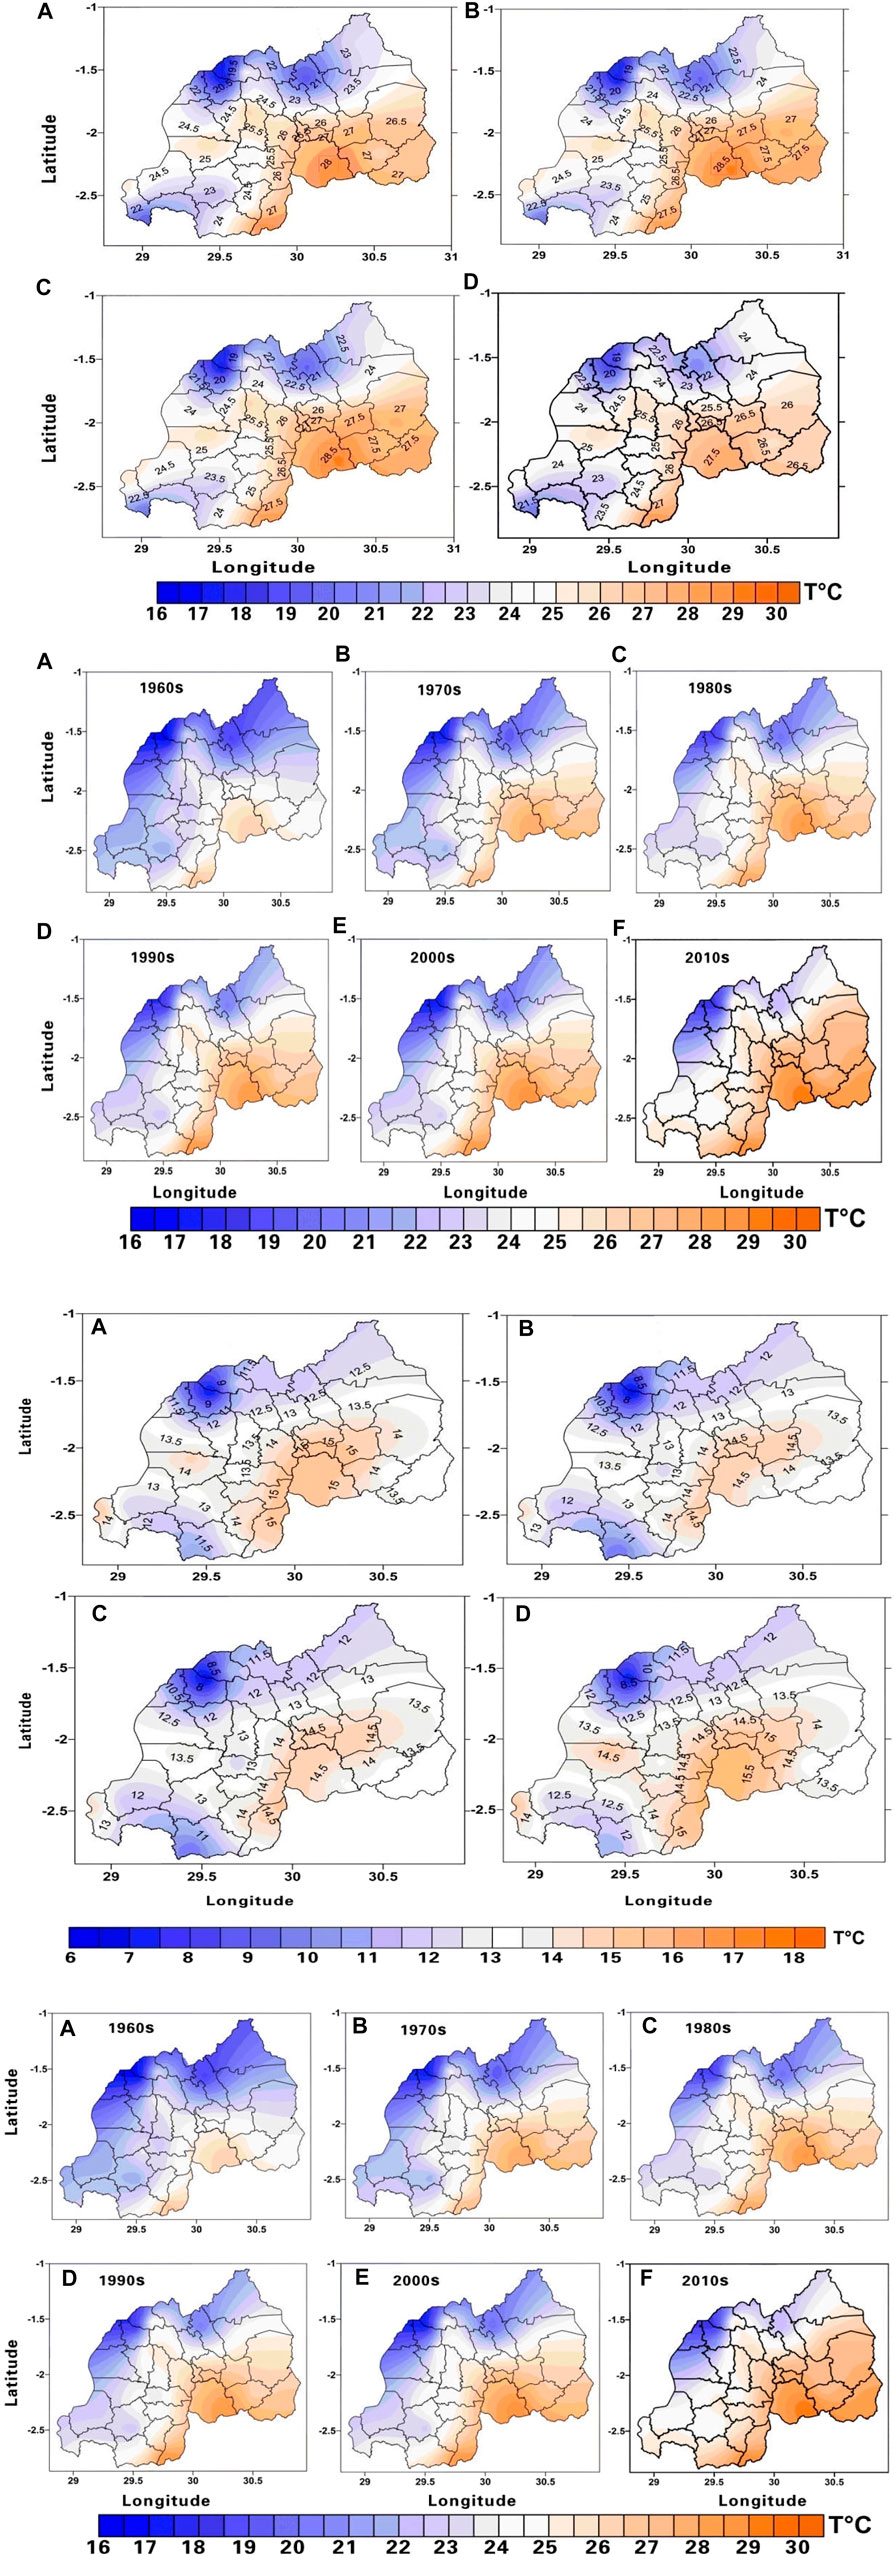
FIGURE 4a. Spatial distribution of seasonal and annual Tmax over Rwanda during 1961–2014; (A) Annual, (B) MAM, (C) JJA, (D) OND and Spatial distribution of Decadal Tmax over Rwanda during 1961–2014; (A) 1961, (B) 1970, (C) 1980, (D) 1990, (E) 2000, (F) 2010. T stands for temperature.
The Spatial Variations of Annual and Seasonal and Decadal Tmin
Same as for Tmax analysis, the Tmin spatial variations at annual, seasonal and decadal scale over Rwanda are showing in Figure 4B. The analysis indicates that the whole country has experienced warming during the study period. Similar toTmax, decadal Tmin and for MAM, JJA, OND and annual are also displayed in Figure 4B. In agreement with the observed standardized anomaly (Figure 3B), the highest warming was observed in last decade covering almost the whole study area. The early 1960s period is dominated by lower temperatures in all three regions. The higest Tmin is recorded in the easten and southern parts of the country with average of 15° celcius while the lowest Tmin is observed in the northern part with average of 8.5° celcius. In comparison to seasonal Tmin distribution over the study period, more above normal minimum temperatures are observed in OND as compared to MAM and JJA seasons.
FIGURE 4b. The same analysis for Tmin.
Abnormal Maximum and Minimum Temperatures
The above normal temperatures affect the comfort of the human body and agriculture production and many other socio economic activities. In this study, we used the 54 years temperature average plus 0.3°C as the threshold temperature (Tv + 0.3°C). A year with abnormal Tmax was consireded as above normal temperature (Xh) while a year with abnormal Tmin was connected with below normal temperature (Xn). The 54 years temperature average is noted as Tv. On the other hand, any yearly mean temperature that was found to be in the range between the temperature greater or equal to Tv minus 0.3°C and Tv plus 0.3°C, was considered as a year with normal temperature (see Table 3). Although, the temperature trend analysis is very important to understand the rate of the variable increase or decrease over a period of time, yet, a deeper analysis of abnormal temperatures (above, normal and below) can give a more information on the impact of that variability (Figure 5). The results from Table 3 indicate that the region one (R1) has been dominated by above normal temperature years (hot condition) representing 47.86% (highest) of the total 54 years study period while 21.55 and 30.58% were recorded for normal temperature years (normal condition) and below temperature years (cold condition), respectively. Region two (R2) has less temperature fluctuations condition with 31.5% of above normal temperature years (hot condition), 35.2% of normal temperature years (normal condition) and 33.3% of below temperature years (cold condition). On the other hand, above normal temperature years (hot condition) at the rate of 31.5% is recorded in the region three (R3) which is another affirmation of warming in that high elevated area. Based on the present study findings, we encourage future studies to investigate the causes of the observed high rate of hot condition in the whole regions especially in region three (R3).
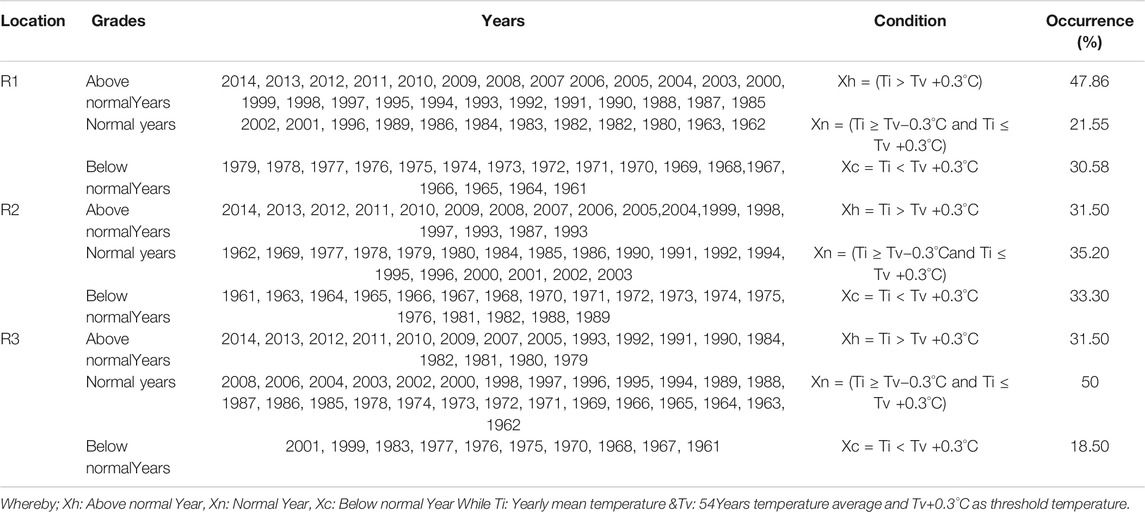
TABLE 3. Occurrence of abnormal temperatures (above, normal and below) in R1, R2 and R3 based on observed data during 1961–2014.
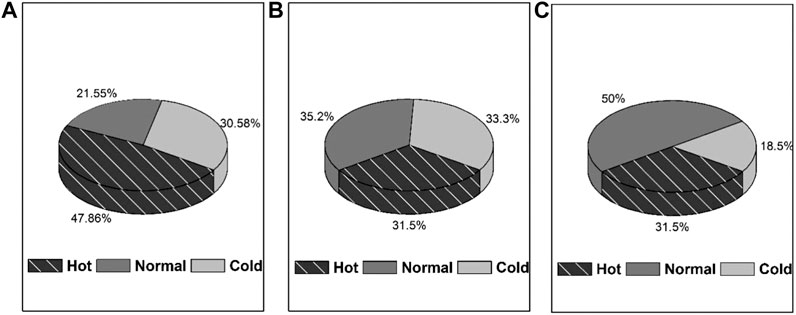
FIGURE 5. Temperature variation (Hot condition) (Normal condition) and (Cold condition) in (A) R1, (B) R2 and (C) R3 based on the period of 1961–2014.
Impact of Topography on Temperature Variability
Without the consideration of the topography, it can be very hard to understand Rwanda’s climate. In order to examine further, whether the topography features has a significant influence on the distribution of temperatures; two variables, topography and temperatures were analyzed to understand their relationship. The results reveal a very significant positive correlation between temperature distribution and elevation with a coefficient of determination value of 0.79 (Figure 6B).
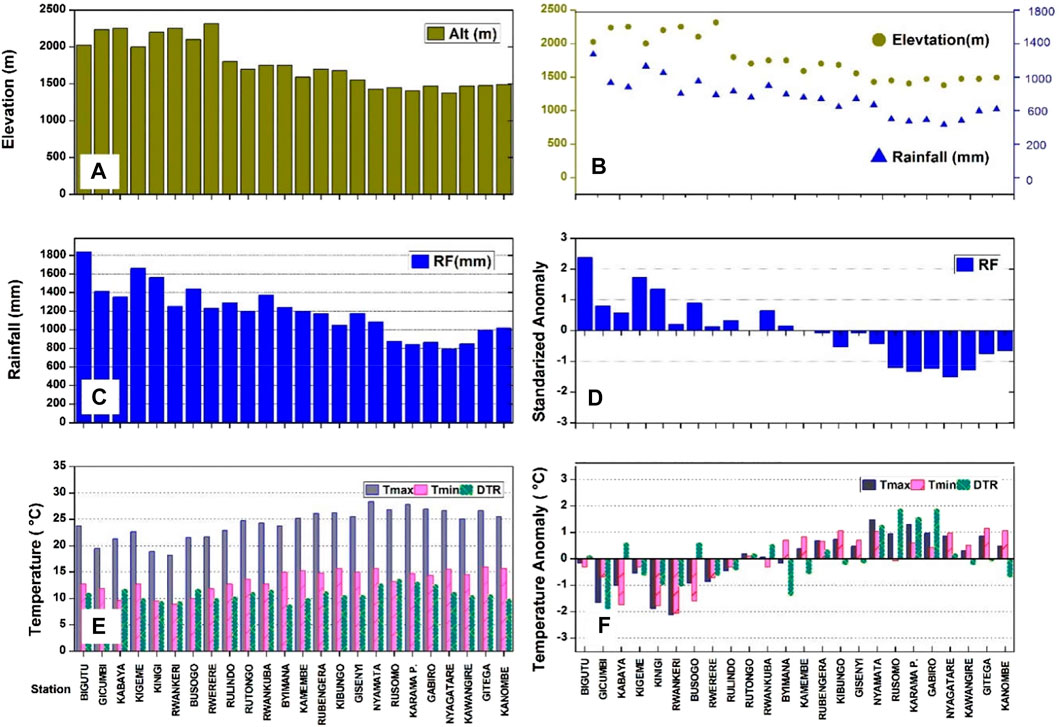
FIGURE 6. (A) Topography distribution, (B) relationship between temperature and topography, (C) Maximum, Minimum and DTR trend, (D) maximum, minimum and DTR anomalies at every station selected for the period of 1961–2014.
Every single selected station in three regions is displayed and each of the represnted histogram columns in Figure 6 refers to an individual station. The stations are arranged in the same order and each station has three variables (elevation, rainfall and temperature). The lowest minimum and maximum temperature were noted in R3 at Rwankeri station located in the northern part of the country with 8.9 and 23.7°C while the highest minimum and maximum temperature were localized in R1 at Nyamata station situated in eastern region with 13.2 and 28.3°C, respectively. This indicates that topography in Rwanda decreases eastwards with an increase in temperature (Figures 6A,E), which also influences the distribution of rainfall which decreases eastwards (Figures 6A–D). This information is helpful for agricultural activities plans. Figures 6C,D indicate the exisiting relationship between temperature and elevation where it is widely known that the higher elevation the lower the temperature. However, the temperatures’ temporal distribution show an unusual abnormal temperature in the early 1990s (Figure 6F). This led us to test an existence of abrupt change in the Rwanda temperatures. According to the mutation (SQMK) test, most of the abrupt changes in seasonal and annual Tmin and Tmax time series have occurred during 1984 and 1990. Furthmore, the results show that the country has experienced a significant abrupt changes in Tmax in the period between 1980–1985 for MAM and JJA season while the change in OND season was recorded in early 1990s. This period is remarkably followed by frequent above normal in temperatures revealed by the temporal temperatures variability in Figure 7A. On the other hand, the significant abrupt change in annual and seasonal Tmin was noted in the early 1990s followed by an increase in minimum temperature Figure 7B.
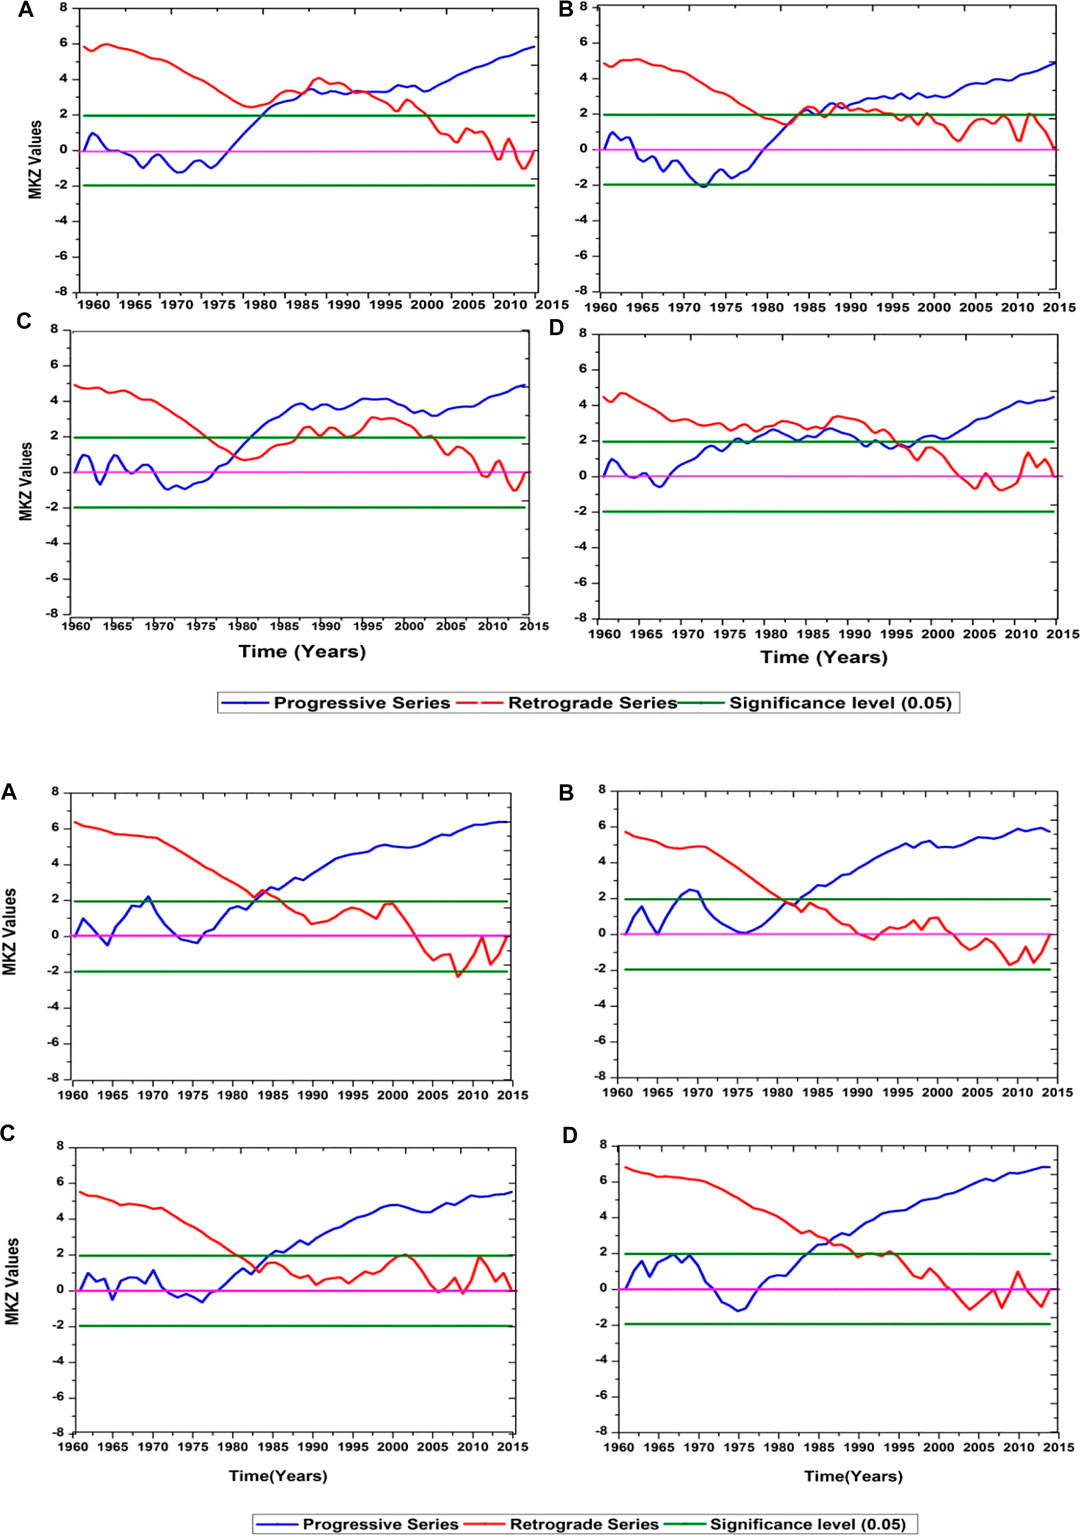
FIGURE 7a. Abrupt change of annual and seasonal Tmax over Rwanda during the period of 1961–2014; (A) Annual, (B) March–May season, (C) June–August, (D) October–December.
FIGURE 7b. Same analysis for Tmin.
To further understand the changes and trends, a temporal series was displayed. The time series shows the minimum and maximum temperature records from 1961 to 2014 (Figure 8). The mean maximum temperature (Tmax mean) was noted to be 24.41°C for the whole period. The warmest year of the entire series was 2010 with a maximum temperature of 1.16°C above 1961–2014 mean. This year was followed by 2005 (0.95°C above 1961–2014 mean), 2013 (0.91°C above 1961–2014 mean) and 1998 (0.77°C above 1961–2014 mean). The coldest year of the whole period was 1961 (1.5°C below 1961–2014 mean). From the year 1980–2014 the temperature was above the mean of 1961–2014 except 1989, 1991, 1992 and 2001. Our future investigation will focus on revaling the causes of the observed above normal temperature after the 1980s and the causes of rapid minimum temperature in R3. This result is in agreement with Morice et al., 2012 who concluded that the decade 2001–2010 was warmer than that of 1991–2000. On the other hand, the data analysis indicate that the temperature of 1961–1979, was below the average of 1961–2014 except for the year 1962, 1978 and 1979 (Figures 8A–D).
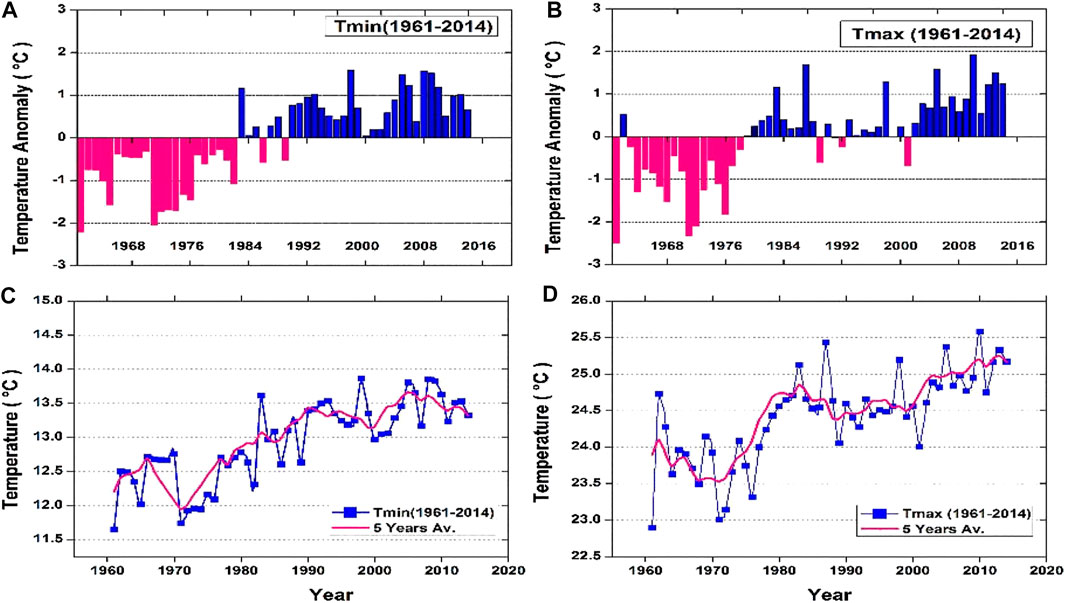
FIGURE 8. Standardized anomalies of (A) minimum temperature, (B) maximum temperature and (C) minimum temperature trend, (D) maximum temperature trend over Rwanda for the period of 1961–2014. The pink line represents the 5-years running.
Discussions
Generally, Tmax and Tmin have increase over Rwanda at different rates in three considered regions. The variations are also different on seasonal and annual scale. The area averaged trend analysis for Tmax and Tmin is presented in Table 2. The Z scores in Tmin, Tmax and DTR are dominantly positive, an indication of an upward trend. Only the DTR in R2 during OND season and DTR of R3 recorded downward trend. For Tmin and Tmax, the scores exceed the significant value at α = 5%, the evidence against the null hypothesis (Ho). Contrarily, hypothesis (Ha) was accepted proving the existence of trend in series. Sen’s slope estimator is displayed to explain the magnitude of change in Tmax, Tmin and DTR. The Sen’s values for Tmax and Tmin are positive in all seasons and at annual series. On the other hand, absence of slope and insignificant trend are noted in DTR in R3 (Table 2). This shows that Tmax and Tmin in R3 are almost similar in magnitude. Decadal Tmin and Tmax for MAM, JJA, OND and annual are also displayed in Figures 4A,B, respectively. In agreement with the observed standardized anomaly (Figures 3A,B), the highest warming was observed in last decade covering almost the whole study area. The early 1960s period is dominated by lower temperatures in all three regions. The highest warming is recorded in the eastern and southern parts of the country. In comparison to seasonal anomalies over the study period, more warming is observed in JJA as compared to OND in all regions. The noted significant positive trend of both Tmax and Tmin is in agreement with a study by Safari (2012) who reported the trend analysis of Rwanda’s mean annual temperature during the period 1958–2010 using five observatories. Safari 2012 recorded a significant warming trend for the period after 1977–1979 with a slope of 0.0455°C/year in Kigali city. The results from Figure 6 shows how important it is to consider the topography effect for a better analysis of temperature distribution. The observed absence of slope and insignificant trend in DTR in R3 indicate that Tmax and Tmin in R3 are almost similar in magnitude. This affirms that initially cool (high elevation) zones in R3 are getting warm faster than the warm (low elevation) areas. A summary of temperature tendency is presented in Table 2. The spatial distributions of Tmax and Tmin represent a siginificant warming trend over the whole country notably since the early 1980s. Generally, this study classified all stations in three regions based on elevation distribution. This subdivision method is very helpful in having a deeper analysis of those weather variables in a certain specific region.
Based on observed temperature, the Inter-governmental Panel on Climate Change reported that equatorial and southern parts of eastern Africa (where Rwanda lies) had experienced a significant increase in temperature since the early 1980s (IPCC, 2014). Over Rwanda, the average temperature increase for the period 1961–2014 is 0.45°C per decade for the whole country. In their study on projections of precipitation, air temperature and potential evapotranspiration in Rwanda under changing climate conditions, Mohamed et al. (2016) also suggested an average of 0.35°C per decade from 1964 to 2014 over Rwanda. Although, Rwanda’s government has made remarkable effort to increase agriculture production through many programs such as crop intensification program introduced in 2007, scaling up the consolidated land among many others. The observed increase of temperature will definitely harm agricultural production and food security over Rwanda with small-scale farmers being the most affected. This call for more measures and new adaption strategies to ensure future capacity to cope with the challenges caused by the temperature increases. In the same logic, many scholars have concluded that temperature plays a big role on spatial and temporal distribution of disease vectors (Sun et al., 2017). The policymakers have to be well aware to take the necessary measures in their national planning program for sustainable development.
In general, the present study aims mainly to have a better understanding of maximum, minimum and diurnal temperature variability and their trends over Rwanda for the period 1961 to 2014 based on new ENACTS data. The new reconstructed data could not cover the whole study period hence stations data are added for the period 1961–1983. Previous studies have focused on temperature trend variability but the importance of topography as a regulator of Rwanda climate has not been well recognized. In addition, those previous studies focus mainly on annual and intra-annual series and used few observatories, which may fail to capture the true image of trend behavior from each season. The present work mainly focus on the spatial and temporal variability of Tmax and Tmin in Rwanda and their relationship with elevation change, leaving a gap in other potential casue factors, e.g., urbanization, air pollution, sunshine duration and so on (Vose et al., 2005; Henninger, 2009; Yang et al., 2013; Yang et al., 2020a; 2020b), which should be explored in the futue.
Conclusion
In the present study, the long-term temporal analysis indicates that both Tmax and Tmin ere significantly increased on seasonal and annual scale. However, the minimum temperature increased at a faster rate than maximum temperature in the highest altitude region (R3) (0.27 vs. 0.07°C/decade in March-to-May) and (0.29 vs. 0.04°C/decade in October-to-December). Similarly, the spatial distribution of Tmin and Tmax shows that the warming trend in seeason and annual temperatures was noticeable over the three regions. Region one (R1) which lies mostly in east part show high rate in above normal temperature condition at the level of 47.85% while region two (R2) and three (R3) almost recorded the same rate of 31.5% above normal temperature during the study period.
The reported minimum temperature increased at a faster rate was observed during the early 1980s, resulting in a significant decrease in the DTR during OND and MAM seasons. According to the mutation (SQMK) test, most of the abrupt changes in seasonal and annual Tmin and Tmax time series have occurred during 1984 and 1990. However, the June-August season of Tmax and Tmin showed an abrupt positive changes in the early 1980s. In Tmin trends, most of rapid changes are detected during the early 1990s while in Tmax, sharpt positive changes are noticable during 1980–1985. Our findings recommend that future studies should focus on elaborating the factors that caused the observed Tmax and Tmin changes in the targeted regions. The knowledge of seasonal patterns of temperature is very important in understanding changes in land uses, crop yields, water resources and ecosystems. From the current study, it is crucial to consider local factors such as topography to better understand possible climate change for any specific area.
Data Availability Statement
The original contributions presented in the study are included in the article/Supplementary Material, further inquiries can be directed to the corresponding authors.
Author Contributions
Conceptualization, YF and YY; Methodology, JN; Software, JN; Data curation, JN; Validation, JN and YY; Formal analysis, JN and YY; Writing—original draft preparation, JN; Draft editing, JN, YF, BO, VF, CS, IN, FO, YY.
Conflict of Interest
The authors declare that the research was conducted in the absence of any commercial or financial relationships that could be construed as a potential conflict of interest.
Acknowledgments
The authors would like to express their appreciation to the University of Science and Technology of China (USTC) for creating a research enabling environment. Special appreciation goes to Rwanda Meteorology Agency (RMA). This study was supported by NSFC Project (Grant Nos. 91837310, 41675041, and 41620104009), the National Key R&D Program of China (Grant Nos. 2018YFC1507200 and 2017YFC1501402), The Second Tibetan Plateau Scientific Expedition and Research (STEP) program (Grant Nos. 2019QZKK0104), the Key research and development projects in Anhui province (Grant Nos. 201904a07020099), CLIMATE-TPE (ID 32070) in the framework of the ESA-MOST Dragon 4 program, and open funding of the State Key Laboratory of Loess and Quaternary Geology (SKLLQG2010).
References
Alexander, L. V., Zhang, X., Peterson, T. C., Caesar, J., Gleason, B., Klein Tank, A. M. G., et al. (2006). Global observed changes in daily climate extremes of temperature and precipitation. J. Geophys. Res. 111 (5), 1–22. doi:10.1029/2005JD006290 |
Asfaw, A., Simane, B., Hassen, A., and Bantider, A. (2018). Variability and time series trend analysis of rainfall and temperature in northcentral Ethiopia: a case study in Woleka sub-basin. Weather Clim. Extremes 19, 29–41. doi:10.1016/j.wace.2017.12.002
Barreca, A., Clay, K., Deschenes, O., Greenstone, M., and Shapiro, J. S. (2016). Adapting to climate change: the remarkable decline in the US temperature-mortality relationship over the Twentieth Century. J. Polit. Econ. 124 (1), 105–159. doi:10.1086/684582
Berardy, A., and Chester, M. V. (2017). Climate change vulnerability in the food, energy, and water nexus: concerns for agricultural production in Arizona and its urban export supply. Environ. Res. Lett. 12, 113.
Brown, S. J., Caesar, J., and Ferro, C. A. T. (2008). Global changes in extreme daily temperature since 1950. J. Geophys. Res. Atmos. 113, D05115. doi:10.1029/2006JD008091
Christy, J. R., Norris, W. B., and McNider, R. T. (2009). Surface temperature variations in East Africa and possible causes. J. Clim. 22 (12), 3342–3356. doi:10.1175/2008jcli2726.1
Diaz, J., Garcia, R., and Lopez, C. (2005). Mortality impact of extreme winter temperatures. Int. J. Biometeor. 49, 179183.
Donat, M. G., Alexander, L. V., Yang, H., Durre, I., Vose, R., Dunn, R. J. H., et al. (2013). Updated analyses of temperature and precipitation extreme indices since the beginning of the twentieth century: the HadEX2 dataset. J. Geophys. Res. 118 (5), 2098–2118. |
Easterling, D. R., Meehl, G. A., Parmesan, C., Changnon, S. A., Karl, T. R., and Mearns, L. O. (2000). Climate extremes: observations, modeling, and impacts. Science 289 (5487), 2068–2074. doi:10.1126/science.289.5487.2068 |
Easterling, D. R., Horton, B., Jones, P. D., Peterson, T. C., Karl, T. R., Parker, D.,E., et al. (1997). Maximum and minimum temperature trends for the globe. Science 277, 364–367. doi:10.1126/science.277.5324.364
Eriksen, S., and Rosentrater, L. (2008). Climate change in eastern and southern Africa impacts, vulnerability and adaptation climate change in eastern and southern Africa impacts , vulnerability and adaptation. New York: Global Environmental Change and Human Security.
Heal, G., and Park, J. (2016). Reflections-temperature stress and the direct impact of climate change: a review of an emerging literature. Rev. Environ. Econ. Pol. 10 (2), 347–362. doi:10.1093/reep/rew007
Henninger, S. (2009). “Urban climate and air pollution in Kigali , Rwanda,” in The seventh international conference on urban climate, July, 3–6.
IPCC. (2014). Chapter 22: Africa. ClimateChange 2014: impacts, adaptation and Vulnerability,Contribution of working group II to the FifthAssessment report of the intergovernmental panelon climate change. Cambridge and New York: Cambridge University Press.
IPCC. (2001a). Climate change 2001: impacts, adaptation and vulnerability, contribution of working group II to the third assessment report of the intergovernmental Panel on climate change. Cambridge, United Kingdom and New York, NY, USA: Cambridge University Press.
IPCC. (2001b). Climate change 2001: the scientific basis. Contribution of working group I to the third assessment report of the intergovernmental Panel on climate change. Cambridge, United Kingdom and New York, NY, USA: Cambridge University Press.
IPCC. (2007). Climate change 2007: the physical basis. Contributions of working group 1 to the fourth assessment report of the intergovernmental Panel on climate change. Cambridge, United Kingdom and New York, NY, USA: Cambridge University Press.
IPCC. (2013). Climate change 2013: the physical science basis. Contribution of working group I to the fifth assessment report of the intergovernmental Panel on climate change. Cambridge, United Kingdom and New York, NY, USA: Cambridge University Press.
Iqbal, M. A., Penas, A., Cano-Ortiz, A., Kersebaum, K. C., Herrero, L., and del Río, S. (2016). Analysis of recent changes in maximum and minimum temperatures in Pakistan. Atmos. Res. 168, 234249.
Lobell, D. B., Bonfils, C., Duffy, P. B., and Philip, B. (2007). Climate change uncertainty for daily minimum and maximum temperatures: a model inter-comparison. Geophys. Res. Lett. 34 (5), 1407. doi:10.1029/2006GL028726
Mann, H. B. (1945). Nonparametric tests against trend. Econometrica 13, 245–259. doi:10.2307/1907187
Minitere. (2006). National adaptation programmes of action (NAPA) to climate change. Kigali, Rwanda: Ministry of lands, environment, forestry, water and mines (MINITERE).
IPPC (2007). “Assessment of observed changes and responses in natural and managed systems,” in Climate change 2007: impacts, adaptation and vulnerability. Contribution of working group II to the fourth assessment report of the intergovernmental Panel on climate change, Editors Parry, M. L., Canziani, O. F., Palutikof, J. P., van der Linden, P. J., and Hanson, C. E. (Cambridge, UK: Cambridge University Press), 79–131.
Mohammed, H., Jean, C. K., and Ahmad, W. A. (2016). Projections of precipitation, air temperature and potential evapotranspiration in Rwanda under changing climate conditions. Afr. J. Environ. Sci. Technol. 10 (1), 18–33. doi:10.5897/ajest2015.1997
Morak, S., Hegerl, G. C., Christidis, N., and Nikolaos, (2013). Detectable changes in the frequency of temperature extremes. J. Cl. 26 (5), 1561–1574. doi:10.1175/jcli-d-11-00678.1
Myoung, B., Choi, Y.-S., Hong, S., and Park, S. K. (2013). Inter- and intra-annual variability of vegetation in the northern hemisphere and its association with precursory meteorological factors. Glob. Biogeochem. Cycles 27, 31–42. doi:10.1002/gbc.20017
Ndenga, B., Githeko, A., Omukunda, E., Munyekenye, G., Atieli, H., Wamai, P., et al. (2006). Population dynamics of malaria vectors in western Kenya highlands. J. Med. Entomol. 43 (2), 200. doi:10.1603/0022-2585(2006)043[0200:PDOMVI]2.0.CO2 |
Nicholson, S. E., Nash, D. J., Chase, B. M., Grab, S. W., Shanahan, T. M., Verschuren, D., et al. (2013). Temperature variability over Africa during the last 2000 years. The Holocene 23 (8), 1085–1094. doi:10.1177/0959683613483618
Nsubuga, F. W., Olwoch, J. M., and Rautenbach, H. (2014). Variability properties of daily and monthly observed near-surface temperatures in Uganda: 1960-2008. Int. J. Climatol. 34, 303–314. doi:10.1002/joc.3686
Ongoma, V., and Chen, H. (2017). Temporal and spatial variability of temperature and precipitation over East Africa from 1951 to 2010. Meteorol. Atmos. Phys. 129, 131–144. doi:10.1007/s00703-016-0462-0
Otto, F. E. L., and Friederike, E. L. (2016). The art of attribution. Nat. Clim Change 6 (4), 342–343. doi:10.1038/nclimate2971
Parmesan, C., Yohe, G., and Gary, (2003). A globally coherent fingerprint of climate change impacts across natural systems. Nature 421 (6918), 37–42. doi:10.1038/nature01286 |
Penuelas, J., and Flella, I. (2001). A globally coherent fingerprint of climate change impacts across natural systems. Science 294, 793795. |
Praveen, B., Talukdar, S., Shahfahad, M. S., Mahato, S., Mondal, J., Sharma, P., et al. (2020). Analyzing trend and forecasting of rainfall changes in India using non-parametrical and machine learning approaches. Sci. Rep. 10 (1), 10342. doi:10.1038/s41598-020-67228-7 |
Punam, C-P., and Manka, A. (2011). Yes Africa can : success stories from a dynamic continent. The World Bank number 2335. (Singapore: World Bank Publications).
Qasim, M., Khlaid, S., and Shams, D. F. (2016). Spatiotemporal variations and trends in minimum and maximum temperatures of Pakistan. J. Appl. Environ. Biol. Sci. 4, 8593. |
Ren, Z., Wang, D., Ma, A., Hwang, J., Bennett, A., Sturrock, H. J., et al. (2016). Predicting malaria vector distribution under climate change scenarios in China: challenges for malaria elimination. Sci. Rep. 6, 20604. doi:10.1038/srep20604 |
Revadekar, J. V, Hameed, S., Collins, D., Manton, M., Sheikh, M., Borgaonkar, H. P., et al. (2013). Impact of altitude and latitude on changes in temperature extremes over South Asia during 1971–2000. Int. J. Climatol. 33, 199209. |
Rwanyiziri, G., and Rugema, J. (2013). Climate change effects on food security in Rwanda: case study of wetland rice production in Bugesera district. Rwanda J. 1 (1), 35–51. doi:10.4314/rj.v1i1.3E
Safari, B. (2012). Trend analysis of the mean annual temperature in Rwanda during the last fifty two years. Jep 03 (6), 538–551. doi:10.4236/jep.2012.36065
Safeeq, M., Mair, A., and Fares, A. (2013). Temporal and spatial trends in air temperature on the Island of Oahu, Hawaii. Int. J. Climatol. 33, 28162835.
Salman, S. A., Shahid, S., Ismail, T., Chung, E. S., and Al-Abadi, A. M. (2017). Long-term trends in daily temperature extremes in Iraq. Atmos. Res. 198, 97107.
Sayemuzzaman, M., Mekonnen, A., and Jha, M. K. (2015). Diurnal temperature range trend over North Carolina and the associated mechanisms. Atmos. Res. 160, 99108.
Sen, P. K. (1968). Estimates of the regression coefficient based on kendall’s tau. J. Am. Stat. Assoc. 63 (324), 1379–1389. doi:10.1080/01621459.1968.10480934
Siebert, A., Dinku, T., Vuguziga, F., Twahirwa, A., Kagabo, D. M., Delcorral, J., et al. (2019). Evaluation of ENACTS‐Rwanda: a new multi‐decade, high‐resolution rainfall and temperature data set-Climatology. Int. J. Climatol 39 (6), 3104–3120. doi:10.1002/joc.6010
Smith, R. C., Ainley, D., Baker, K., Domack, E., Emslie, S., Fraser, B., et al. (1999). Marine ecosystem sensitivity to climate change. Biol. Sci. 49, 393–404. doi:10.2307/1313632
Sneyers, R. (1990). On the statistical analysis of series of observations. In WMO technical note, 192. Geneva: World Meteorology Organization.
Stern, D. I., Gething, P. W., Kabaria, C. W., Temperley, W. H., Noor, A. M., Okiro, E. A., et al. (2011). Temperature and malaria trends in highland East Africa. PLoS ONE 6 (9), e24524. doi:10.1371/journal.pone.0024524 |
Sun, X.-B., Ren, G.-Y., Shrestha, A. B., Ren, Y.-Y., You, Q.-L., Zhan, Y.-J., et al. (2017). Changes in extreme temperature events over the hindu kush himalaya during 1961-2015. Adv. Clim. Change Res. 8 (3), 157–165. doi:10.1016/j.accre.2017.07.001
Theodorsson-Norheim, E. (1986). Kruskal-Wallis test: BASIC computer program to perform nonparametric one-way analysis of variance and multiple comparisons on ranks of several independent samples. Comput. Methods Programs Biomed. 23, 57. |
Tingley, M. P., and Huybers, P. (2013). Recent temperature extremes at high northern latitudes unprecedented in the past 600 years. Nature 496 (7444), 201–205. doi:10.1038/nature11969 |
UN Economic Commission for Africa & United Nations Development Programme Regional Bureau for Africa & African Union & African Development Bank (2016). “MDGs to Agenda 2063/SDGs Transition Report 2016: 2016 towards an integrated and coherent approach to sustainable development in Africa,”. UNDP Africa Reports 267640, United Nations Development Programme (UNDP). Addis Ababa: Publications Section Economic Commission for Africa.
Vose, R. S., Easterling, D. R., Gleason, B., and Byron, (2005). Maximum and minimum temperature trends for the globe: an update through 2004. Geophys. Res. Lett. 32 (23), 2430. doi:10.1029/2005GL024379
Walther, G. R., Post, E., Convey, P., Menzel, A., Parmesan, C., Beebee, T. J., et al. (2002). Ecological responses to recent climate change. Nature 416 (6879), 389–395. doi:10.1038/416389a |
Weldegerima, T. M., Zeleke, T. T., Birhanu, B. S., Zaitchik, B. F., and Fetene, Z. A. (2018). Analysis of rainfall trends and its relationship with SST signals in the lake tana basin, Ethiopia. Adv. Meteorol. 14, 111. doi:10.1155/2018/5869010
Yang, Y., Wu, B., and Shi, C. (2013). Impacts of urbanization and station-relocation on surface air temperature series in Anhui province, China. Pure Appl. Geophys. 170 (11), 1969–1984. doi:10.1007/s00024-012-0619-9
Yang, Y., Zhang, Manyu., Li, Qingxiang., Chen, Bing., Gao, Zhiqiu., Ning, Guicai., et al. (2020a). Modulations of surface thermal environment and agricultural activity on intraseasonal variations of summer diurnal temperature range in the Yangtze River Delta of China. Sci. Total Environ. 13, 39. doi:10.1016/j.scitotenv.2020.139445
Keywords: minimum temperature (Tmin), maximum temperature (Tmax), warming, Rwanda, climate change
Citation: Ngarukiyimana JP, Fu Y, Sindikubwabo C, Nkurunziza IF, Ogou FK, Vuguziga F, Ogwang BA and Yang Y (2021) Climate Change in Rwanda: The Observed Changes in Daily Maximum and Minimum Surface Air Temperatures during 1961–2014. Front. Earth Sci. 9:619512. doi: 10.3389/feart.2021.619512
Received: 20 October 2020; Accepted: 08 February 2021;
Published: 23 March 2021.
Edited by:
Ming Luo, Sun Yat-Sen University, ChinaReviewed by:
Asher Siebert, International Research Institute for Climate and Society (IRI), Palisades, NY, United StatesJianyu Liu, China University of Geosciences Wuhan, China
Copyright © 2021 Ngarukiyimana, Fu, Sindikubwabo, Nkurunziza, Ogou, Vuguziga, Ogwang and Yang. This is an open-access article distributed under the terms of the Creative Commons Attribution License (CC BY). The use, distribution or reproduction in other forums is permitted, provided the original author(s) and the copyright owner(s) are credited and that the original publication in this journal is cited, in accordance with accepted academic practice. No use, distribution or reproduction is permitted which does not comply with these terms.
*Correspondence: Yunfei Fu, ZnlmQHVzdGMuZWR1LmNu; Yuanjian Yang, eXlqMTk4NUBudWlzdC5lZHUuY24=