 David P. Sahara1
 Puput P. Rahsetyo2
 Andri Dian Nugraha1,3*
 Devy Kamil Syahbana4
 Sri Widiyantoro1,5
 Zulfakriza Zulfakriza1,3
 Ardianto Ardianto2
 Aria W. Baskara2
 Shindy Rosalia1
 Martanto Martanto2,4
 Haunan Afif4
- 1Global Geophysics Research Group, Faculty of Mining and Petroleum Engineering, Institut Teknologi Bandung, Bandung, Indonesia
- 2Department of Geophysical Engineering, Faculty of Mining and Petroleum Engineering, Institut Teknologi Bandung, Bandung, Indonesia
- 3Center for Earthquake Science and Technology, Research Center for Disaster Mitigation, Institut Teknologi Bandung, Bandung, Indonesia
- 4Center for Volcanology and Geological Hazards Mitigation, Geological Agency, Ministry of Energy and Mineral Resources, Bandung, Indonesia
- 5Faculty of Engineering, Maranatha Christian University, Bandung, Indonesia
This study provides an attempt to analyze the pre-eruptive seismicity events for volcano eruption forecasting. After more than 50 years of slumber, Agung volcano on Bali Island erupted explosively, starting on November 21, 2017. The eruption was preceded by almost 2 months of significant increase of recorded seismicity, herein defined as “seismic crisis.” Our study provides the first analysis of VT events using data from eight local seismic stations deployed by the Center for Volcanology and Geological Hazard Mitigation of Indonesia (CVGHM) to monitor the Agung Volcano activity. In total, 2,726 Volcano-Tectonic (VT) events, with 13,023 P waves and 11,823 S wave phases, were successfully identified between October 18 and November 30, 2017. We increased the accuracy of the hypocenter locations of these VT events using a double-difference (DD) relative relocation and a new velocity model appropriate to the subsurface geological conditions of Agung volcano. We found two types of seismicity during the recording period that represent the VT events relating to fracture network reactivation due to stress changes (during the seismic crisis) and magma intrusion (after the seismic crisis). The characteristics of each event type are discussed in terms of Vp/Vs values, phase delay times, seismic cluster shapes, and waveform similarity. We interpret that the upward migrating magma reached a barrier (probably a stiff layer) which prohibited further ascent. Consequently, magma pressurized the zone above the magma chamber and beneath the barrier, reactivated the fracture zone between Agung and Batur volcanoes, and caused the seismic crisis since September 2017. In early November 2017, the barrier was finally intruded, and magma and seismicity propagated toward the Agung summit. This reconstruction provides a better depth constraint as to the previous conceptual models and explains the long delay (∼10 weeks) between the onset of the seismic crisis and the eruption. The distinction between the fracture reactivation and magma intrusion VT events observed in this study is significant for eruption forecasting and understanding the subsurface structure of the magmatic system. Based on the results obtained in this study, we emphasize the importance of prompt analysis (location and basic seismic characteristics) of the seismic crisis preceding the Agung eruption.
Introduction
Volcanic earthquakes occur as magma rises to the surface from depth, a condition that involves significant stress changes in the crust as the material migrates upward (White and McCausland, 2016). Therefore, during unrest volcanologists detect seismic signature variations in the type, location, and intensity of seismic activity. The interpretation of seismic signature during unrest may be supportive in assessing the eruption probability, as exemplified at various volcanoes, e.g., Pinatubo (1991), Unzen (1989–1995), Cotopaxi (2001), Popocatepetl (2001–2003), Mauna Loa (1984), Taal (2010), and others (Zobin, 2012; Zlotnicki et al., 2018). In general, however, it remains difficult for volcanologists to forecast an eruption precisely. This study intends to analyze the Volcano-Tectonic (VT) seismicity events as a possible indicator for forecasting eruptions.
Agung is one of the most active volcanoes in Indonesia and is located on the island of Bali. After more than 50 years of slumber, Agung Volcano erupted explosively on November 21, 2017 (PVMBG, 2017; Albino et al., 2019; Syahbana et al., 2019; Gunawan et al., 2020). The last major eruption happened in 1963; with a VEI 5, it was described as one of the largest eruptions in the twentieth century (Zen and Hadikusumo, 1964). It is suggested that the 1963 eruption affected global climate (Cadle et al., 1976; Hansen et al., 1978; Self et al., 1981; Rampino and Self, 1982; Self and Rampino, 2012). The eruption caused the tragic death of more than 1,000 people, mostly as a result of the high-speed pyroclastic flows on the volcano’s southern and northern slopes, which swept over nearby settlements (Kusumadinata, 1964).
The 2017 eruption followed a “seismic crisis” that culminated in September 2017 when local earthquakes numbered more than 800 events per day (Albino et al., 2019; Syahbana et al., 2019; Gunawan et al., 2020). Due to the increasing seismicity, the Center for Volcanology and Geological Hazard Mitigation of Indonesia (CVGHM) raised the volcanic alert level (VAL) to Level 2 on September 14, 2017, this then went to Level 3 on September 18, 2017, as seismicity continued to accelerate rapidly; the Real-time Seismic Amplitude Measurements (RSAM) values peaked on September 22, 2017, prompting the CVGHM to elevate the VAL to Level 4 (the highest level). This crisis triggered the evacuation of over 140,000 people within an area of 9–12 km from the volcano’s summit (Syahbana et al., 2019). Due to a decrease in daily seismic event rates, the CVGHM lowered the VAL to Level 3 on October 29, 2017.
It is worth noting that, although seismic unrest peaked in September, the volcano did not erupt until November 2017 (Syahbana et al., 2019). The eruption eventually started on November 21, 2017; a series of phreatomagmatic explosions and high SO2 emissions continued. The most intense explosive eruptions with accompanying rapid lava effusion occurred during the period of 25–29 November 2017.
The relatively long delay between the seismic swarm and the eruptions caused considerable challenges to CVGHM and the populace living near the volcano. During the crisis, the rate of VT events surrounding Agung volcano and RSAM were calculated using TMKS and PSAG seismic stations (Figure 1). At the beginning of the crisis, only two seismic stations were available; therefore, an estimation of the location and source mechanisms of the seismic events could not be performed. The CVHM responded rapidly by installing more seismic stations. By October 18, 2017, another six stations had been successfully installed, forming a better seismic monitoring network around the volcano. Given the peculiar characteristics of the seismic patterns before the 2017 Agung eruption, localization of VT events prior to the 2017 eruption could help researchers better understand the magma migration process.
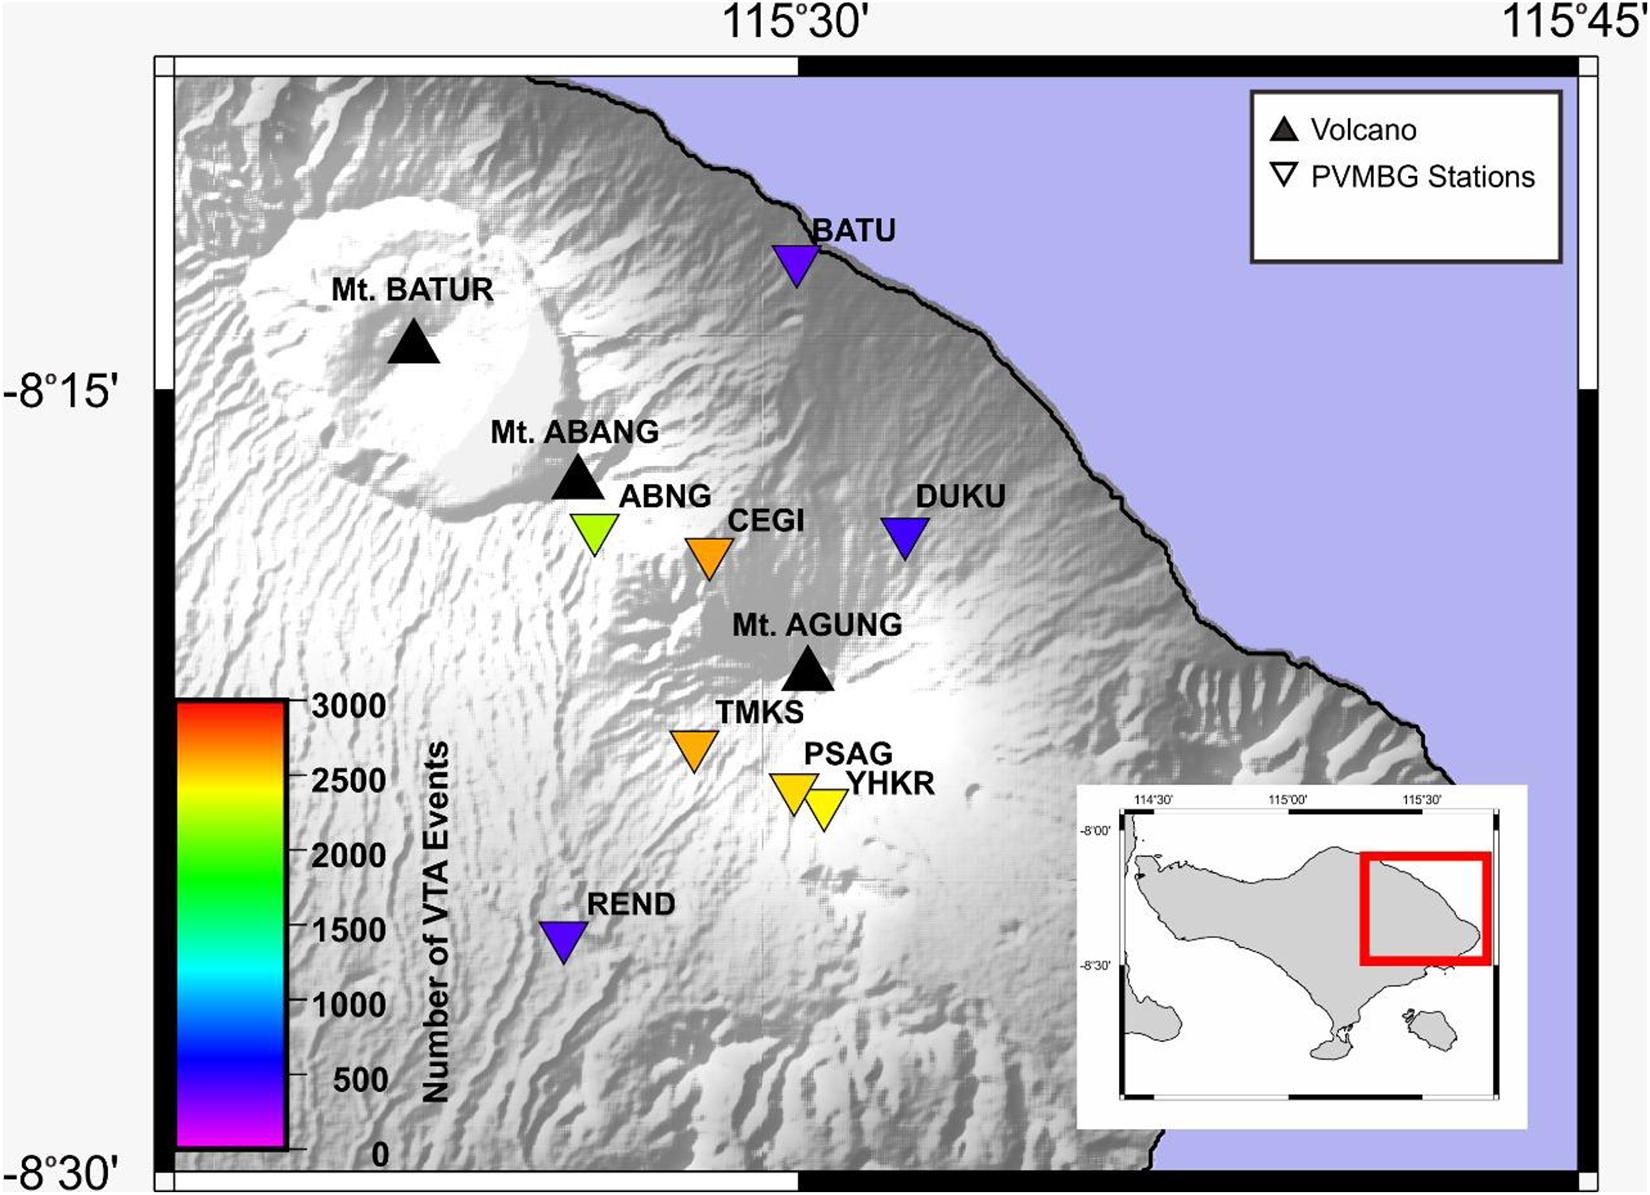
Figure 1. Map of the eight local permanent stations deployed by CVGHM to monitor activity at Mt. Agung (inverted triangles). The number of detected VT events at each station during the study period is represented in a color scale. Black triangles show Agung, Abang, and Batur volcanoes. Inserted map shows Bali Island.
So far, there is no published catalog of VT events preceding the Agung 2017 eruption obtained using the local seismic network. Previous publications employed the regional Indonesian Meteorological, Climatological, and Geophysical Agency (BMKG) catalog in analyzing the magma migration beneath Agung Volcano, e.g., Syahbana et al. (2019) used catalog from BMKG as one of the inputs for their conceptual model, and later Gunawan et al. (2020) relocated the BMKG catalog using the double-difference method. In this study, for the first time, we processed the recorded waveform data of the local CVGHM seismic station network and estimated the hypocenter locations of VT events preceding the 2017 eruption. The identified VT event arrival times were manually picked. Hypocenter accuracy was improved using the updated velocity model, which is suitable for the subsurface condition of Agung, and by applying the double-difference relocation technique. A waveform cross-correlation was also conducted to give a better constraint of the event locations. Our study produced a catalog of VT events preceding the 2017 Agung eruption that can be further used to improve the Agung conceptual model and reveal the magma migration processes that led to the eruption.
Agung Volcano
History of Agung Eruption
The recorded history of the Agung volcano eruption could date back to 1808, based on geological samples of eruptions in the form of ashfall and pumice (PVMBG, 2014). Eruptions occurred again in 1821 and 1843. After that, Agung was in a dormancy stage until the 1963 eruption, which was one of its most powerful eruptions.
The significant eruptions in 1963 occurred twice: on March 17 and May 16, 1963, with an explosivity level of VEI 4+ (Fontijn et al., 2015). The column of the eruption reached more than 20 km above the summit of Agung. This eruption had a considerable impact on global climate as it ejected about 6.2 Mt (million metric tons, or 1012 grams) of SO2 into the stratosphere (Rampino and Self, 1982; Self and Rampino, 2012; Fontijn et al., 2015), causing reduced sunlight and a temperature drop (Self et al., 1981). However, in terms of global climate impact, the 1963 eruption was not comparable to the 1815 Tambora or the 1883 Krakatau eruptions (Cadle et al., 1976; Hansen et al., 1978; Self et al., 1981; Rampino and Self, 1982; Self and Rampino, 2012). After 1963, Agung Volcano began to show an increase in activity once again in September 2017 and erupted in November 2017.
Conceptual Model of Agung Volcano
Previous studies have proposed several models for estimating the subsurface processes beneath Agung volcano using various data; e.g., Geiger et al. (2018) base their proposal on thermobarometry data from an analysis of the 1963 eruption deposits, Albino et al. (2019) use InSAR data, and Syahbana et al. (2019) use a multi-disciplinary approach including seismicity, geology, geochemistry, GPS deformation, and InSAR data. These proposed models describe the magma intrusion pathway to the surface.
The models agree that there are two magma reservoirs beneath Agung volcano. The deep reservoir is located at around 12–15 km, while the shallow one is around 4 km. Syahbana et al. (2019) analyzed the seismic crisis of the 2017 Agung eruption in their model. They propose two possible models; (i) the first model speculated that upward magma migration suppressed the aquifer, which then reactivated the fault between Agung and Batur volcanoes resulting in a swarm of VT earthquakes; while (ii) the second model suggests that there is a deep intrusion of a inclined dike striking N300° underneath the area between Agung and Batur volcanoes which caused an uplift at the summit of Agung as well as a VT earthquake swarm.
The VT swarm hypocenter catalog was used in part to construct the Syahbana et al. (2019) conceptual model, which was taken from the Indonesian Meteorological, Climatological, and Geophysical Agency (BMKG) catalog. This catalog is based on BMKG regional data, which has relatively low resolution. Therefore, a well-constrained VT event catalog using the local CVGHM seismic network deployed in the vicinity of Agung volcano is needed to improve the physical understanding of magma migration toward the summit.
Determining the Hypocenter of the VT Earthquakes
The earthquake waveform data used to construct the 2017 Agung VT events catalog in this study were taken from eight seismometers deployed by the CVGHM (Figure 1). TMKS and PSAG were the first two stations deployed in early 2015 and 2017, respectively. As the seismic crisis culminated at Agung volcano, those stations were used to monitor the rate of the daily VT earthquake occurrences. On October 18, 2017, the PVMBG deployed the ABNG, CEGI, REND, YHKR, BATU, and DUKU stations. Together, these form an eight-station network surrounding Agung volcano. In this study, we use the recorded waveform data from these eight seismic stations from October 18 to November 30, 2017. The locations of the eight seismometers surrounding Agung volcano are shown in Figure 1. In the following result subsections, we briefly describe the methods at the beginning of each subsection.
Identification of VT Events
Seismic events that occur in a volcanic area can be classified into several types, which are characterized by their waveforms and frequency contents with specific source mechanisms (Wassermann, 2011). We follow the classification of volcanic seismic types done by Minakami (1974). Minakami divided the seismic events in a volcanic area into four types according to the location of the hypocenters, their relationship to the eruptions, and the nature of the earthquake motion. They are volcano-tectonic (VT), low frequency (LF), explosion, and volcanic tremors.
Volcano Tectonic (VT) earthquakes are the most common seismic events observed at volcanoes which have a characteristic of the clear onset of P and S phase arrival and high frequency (>5 Hz). Low-frequency (LF) (1–5 Hz) events occur due to the resonance of fluid movement inside the conduit. The explosion events originate from an eruption or sonic boom in the conduit of the volcano. Volcanic tremors occur due to continuous fluid flows at shallow depths. In this study, we are primarily interested in VT as these could be used as a proxy of the migration of magma to the surface, leading to a volcanic eruption.
We manually identified the occurrences of the VT events preceding the 2017 Agung volcanic eruption. The P- and S-wave arrival times of each identified event were also manually picked. Only events recorded by at least four stations and having an apparent onset of P and S wave arrivals were used. In total, 2,726 VT events were obtained; 13,023 and 11,823 P- and S-wave arrival times, respectively. An example of P and S wave arrival times of a VT event is presented in Figure 2A.
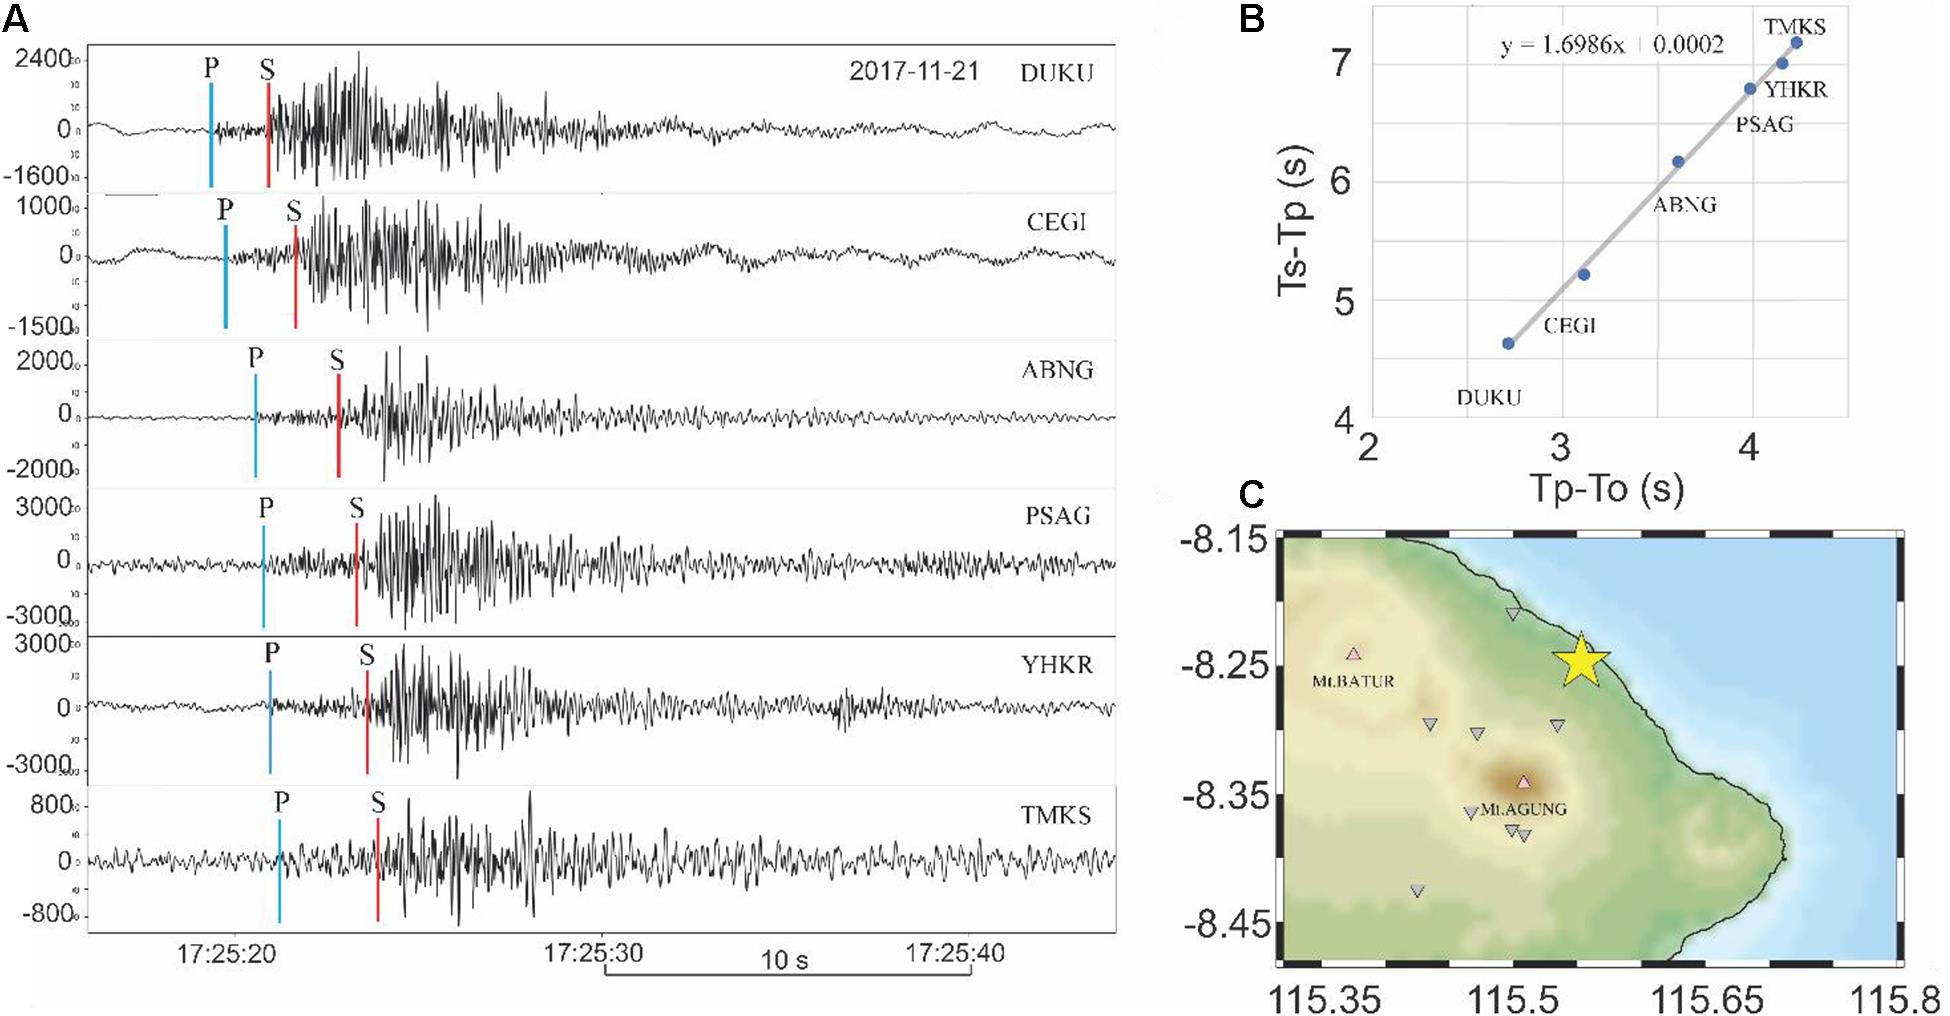
Figure 2. (A) Example of picked waveforms of an event occurring on November 21, 2017 17:25:16 UTC. The event was recorded by six stations (out of eight). Only the vertical component of each recorded seismogram is shown. The P and S wave arrival times are indicated by the blue and red vertical bars, respectively. The names of the stations are written at the end of each waveform. (B) The Wadati diagram; i.e., the difference between S and P wave travel times vs. P wave travel times of the picked event. (C) Plotting of event location (indicated as yellow star) and station network (inverted triangles).
The Wadati diagram and epicenter location the detected event were also plotted in Figures 2B,C, respectively. The purpose for this was to evaluate the picking (remove the poorly picked data) as well as infer the average Vp/Vs of the rock through which the seismic wave passed. The Wadati diagram of all detected events is plotted in Figure 3. The average Vp/Vs beneath Agung Volcano obtained from all detected events prior to the 2017 eruption is 1.62. Interestingly, the Vp/Vs value of VT events changed over time. VT events in October (blue dots) tend to have a lower gradient (Vp/Vs of 1.50) compared to events that occurred in November (orange dots) (Vp/Vs of 1.72).
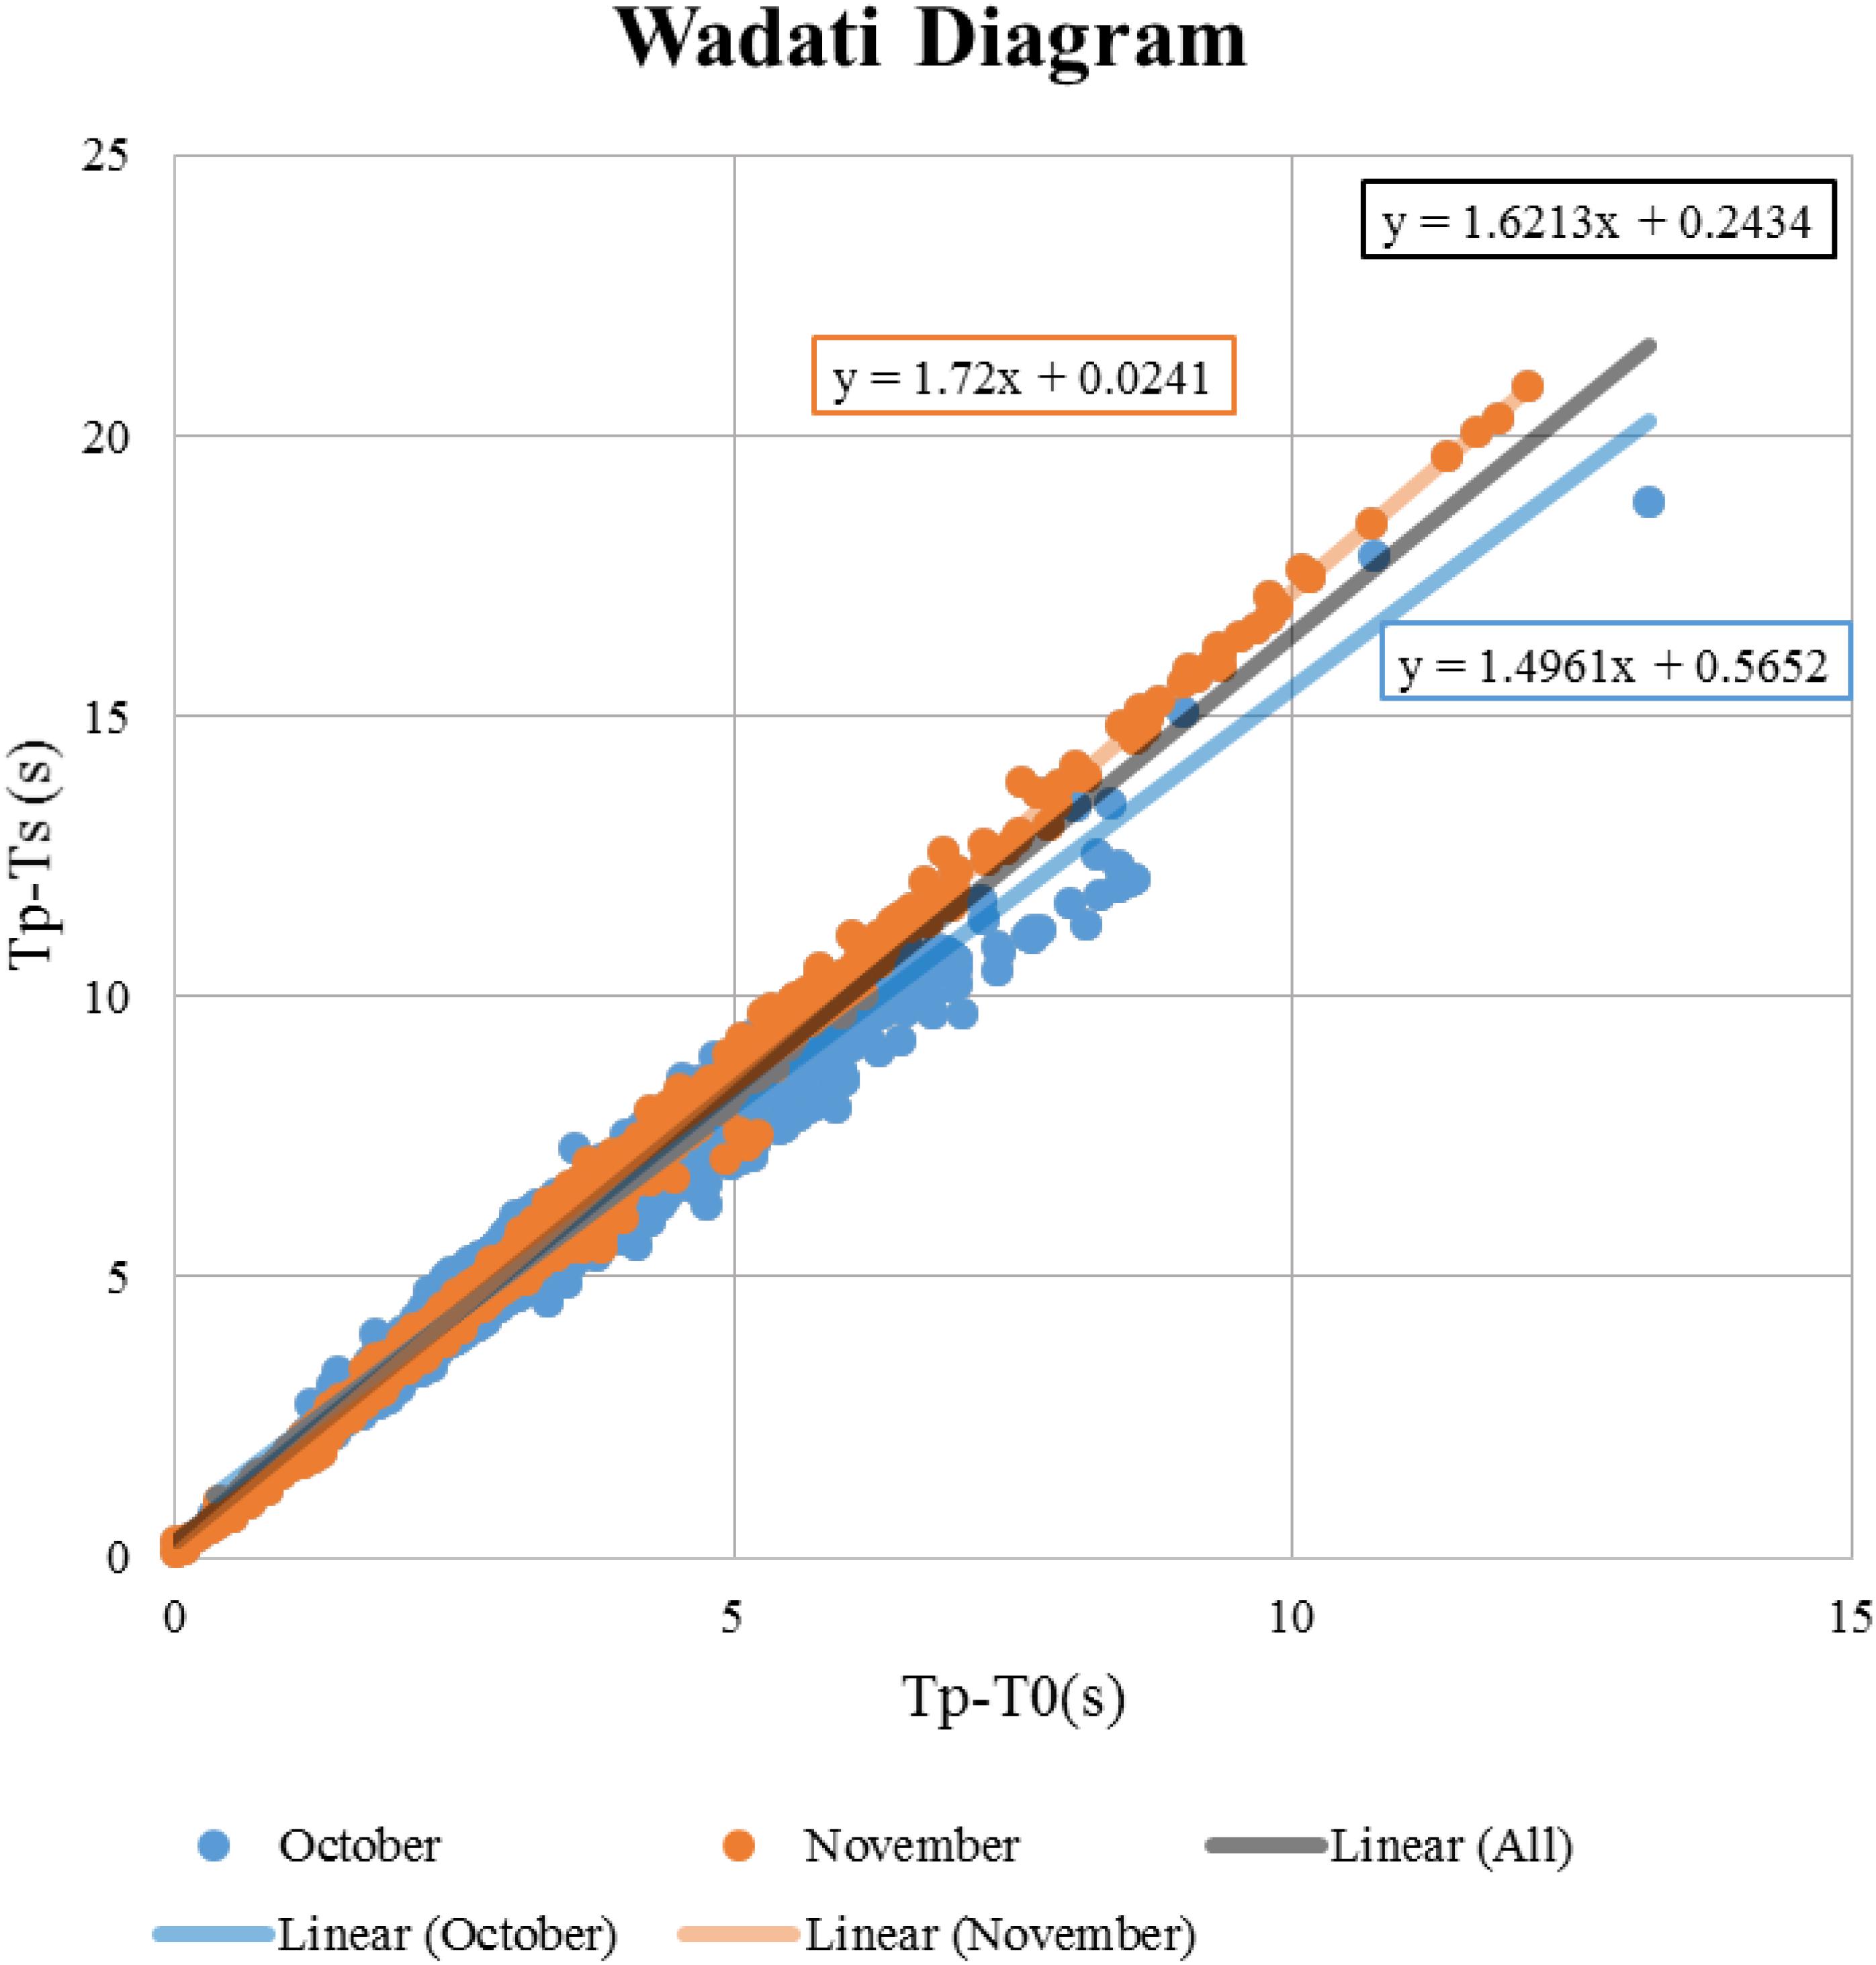
Figure 3. The Wadati diagram of 2,726 VT events recorded during the study period. Based on this diagram, an average Vp/Vs of about 1.62 was found. Two patterns in this Wadati diagram are observed: VT events occurring in October 2017 (blue dots) have smaller gradients compared to the ones in November (orange dots). Consequently, lower- and higher-than-average Vp/Vs were given, respectively. VT events in October and November indicate a Vp/Vs of 1.50 and 1.72, respectively.
The event rate was also time-varying. Based on previous published studies, e.g., Albino et al. (2019), Syahbana et al. (2019), and Gunawan et al. (2020), seismic activity on Agung began to increase significantly in early September, with the number of detected VT events reaching more than 700 events per day for 4 weeks. The seismic crisis stopped at the end of October (insert Figure 4). In this study, we could observe the end of the 2017 Agung seismic crisis, in which more than 400 events/day were detected and located on October 18 and 19, 2017 (Figure 4). The event rate decreased rapidly in the following days. Until the eruption on November 21, 2017, around 87.5% of days had less than 80 events per day.
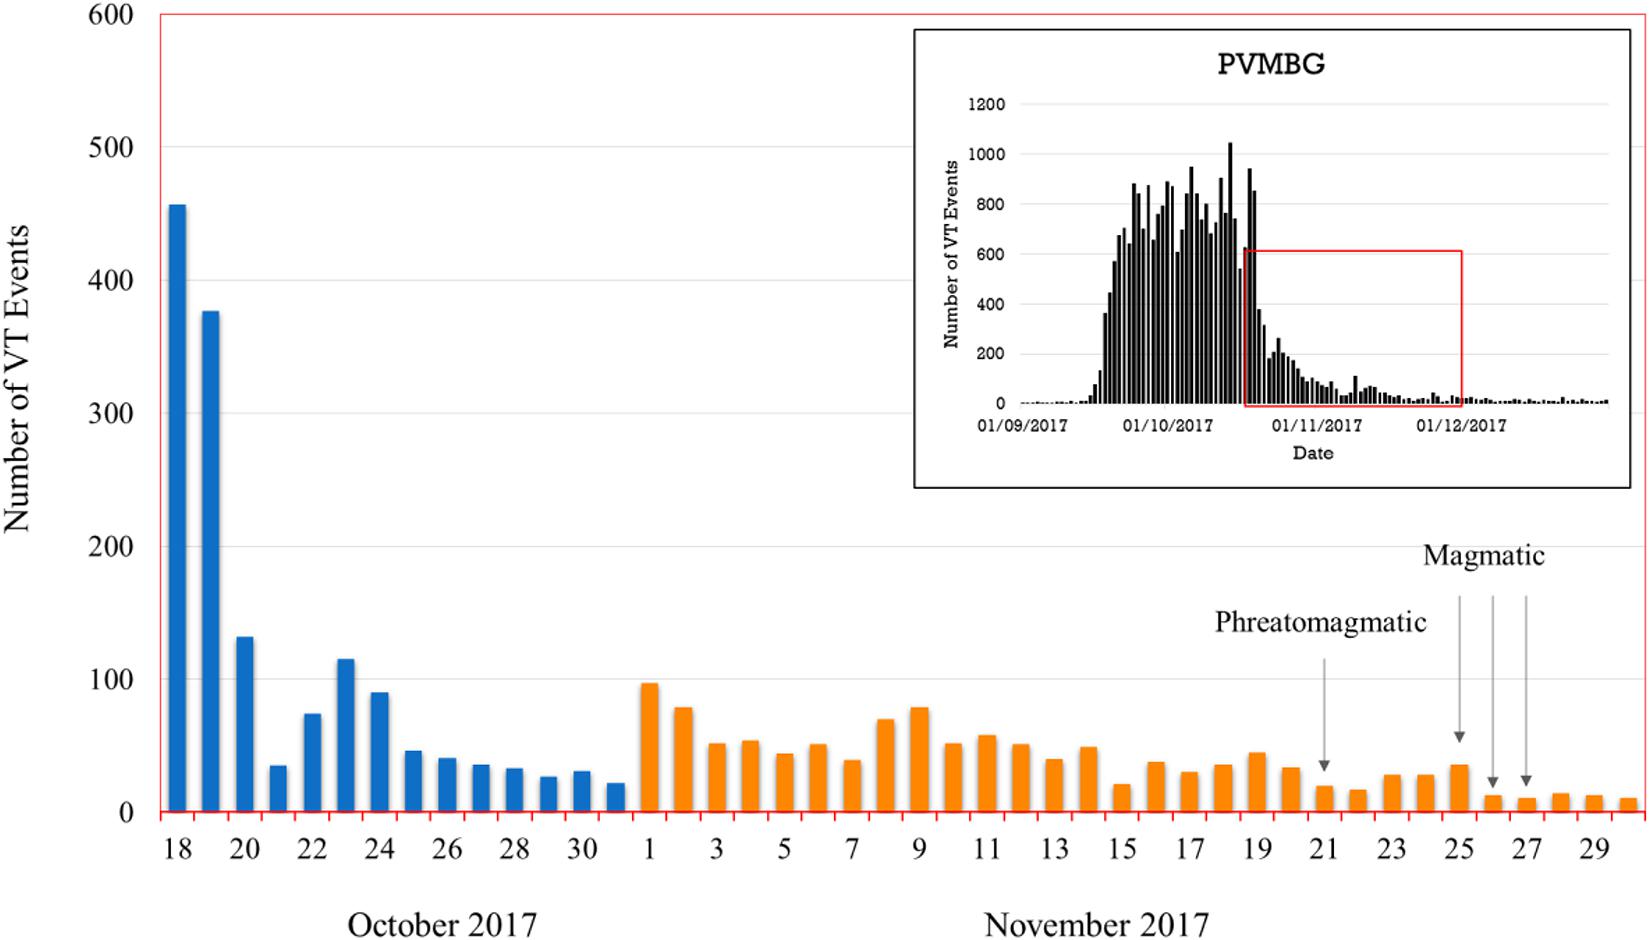
Figure 4. Histogram of the number of detected and located VT events per day from October 18 to November 30, 2017. Colors indicate the date (blue and orange bars are October and November, respectively). Black arrows indicate eruption dates and eruption types. A phreatomagmatic eruption occurred on November 21, 2017; and a magmatic eruption occurred on November 25–27, 2017 (Syahbana et al., 2019).
We also determined the time delay between S and P waves arrival of each VT event at each station. The time delay represents the distance between the event to the station, i.e., the longer time delay indicates the farther event and vice versa. The pattern of the arrival time delay between the S and P waves (Ts-Tp) was presented in Figure 5. Remarkably, the events during the seismic crisis tend to have a constant Ts-Tp compared to the events after the crisis. Four stations located between Agung and Batur (ABNG, CEGI, PSAG, and TMKS) indicated a constant low value of Ts-Tp before October 22, 2017, and higher but fluctuating values afterward. The constant but low phase arrival time delays observed in ABNG, CEGI, PSAG, and TMKS during the seismic crisis indicated that the events are primarily concentrated in the area between Agung and Batur Volcanoes. As ABNG (located NW from Agung Volcano) has the lowest phase arrival time delays of around 1.2 s, it could remark that this was the closest station to the VT events clusters during the seismic crisis. This is in contrast with the pattern observed in YHKR (located south of Agung Volcano), i.e., the phase arrival time delays fluctuated but were lower after the seismic crisis. Meanwhile, three other stations (DUKU, BATU, and REND) recorded only a few events. Therefore, no pattern was observed in those three stations.
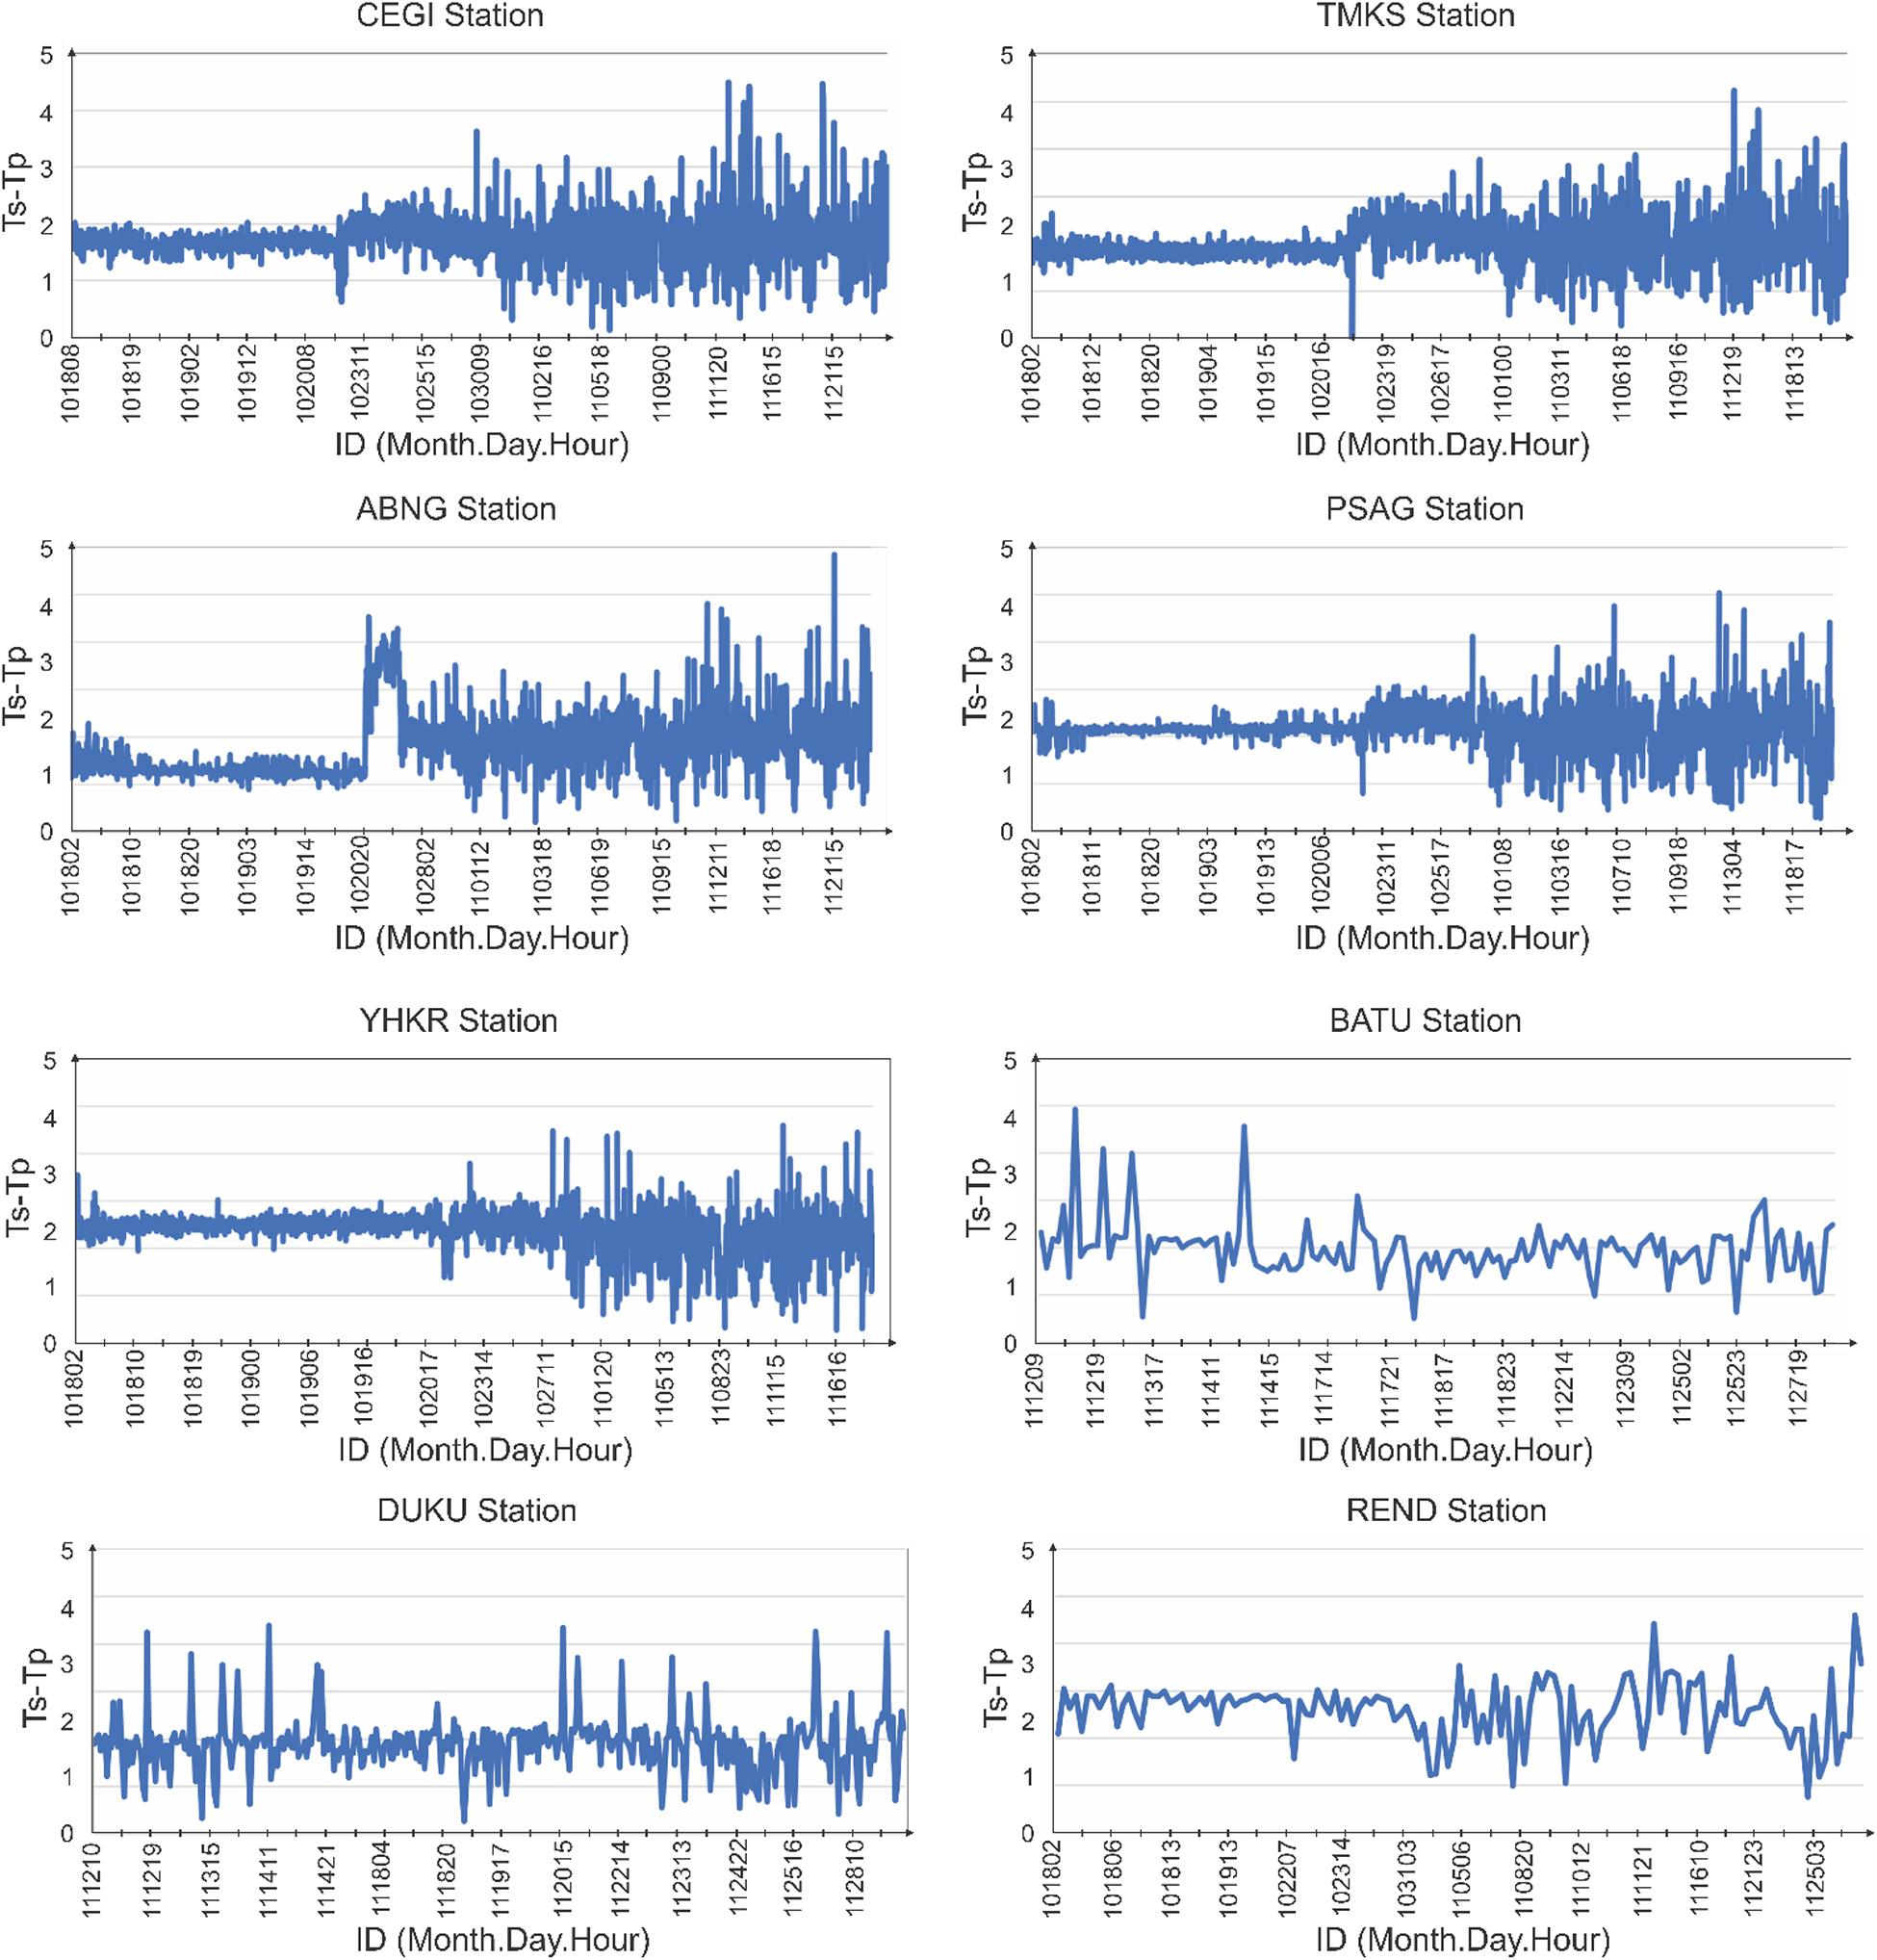
Figure 5. Arrival time delay between primary (Tp) and secondary waves (Ts) at each seismographic station surrounding Agung volcano. The x axis is the ID of detected events at each station. The ID consists of six digits character representing month, day, and hour of each event’s origin time.
Determining Initial Hypocenter Locations
To obtain a well-constrained hypocenter catalog, we determined the hypocenter locations of the seismic events preceding the 2017 Agung volcanic eruption in several sequential steps. First, the NonLinLoc program (Lomax et al., 2000, 2012; Lomax and Curtis, 2001; Lomax and Michelini, 2009) was used to determine the locations of the initial aftershocks. The 1D velocity model and station corrections were then updated to suit the local geological condition. Afterward, the relative relocation using the double-difference method was implemented to increase the accuracy of the obtained hypocenter.
In the first step, we used the initial 1-D seismic velocity model (Vp, Vs) from the tomography results of Central Java (Koulakov et al., 2009); hereafter known as the Kou09 model. The Kou09 model was selected because no velocity model of Agung region was available. Recently, Zulfakriza et al. (2020) performed an S-wave velocity inversion using ambient noise tomography called the Zul20 model. However, in their S-wave data inversion, the Vp/Vs ratio for each layer remained fixed, whereas the density was estimated from the P-wave velocity. This gave us a good variation of S-wave velocities in the region but might have failed to provide its absolute value. Compared to the Kou09 model, the Zul20 model showed around 50% lower S-wave velocity which would cause the located hypocenter almost twice deeper. Thus, we used the Zul20 model to constrain the distribution of correction stations determined in this study.
The map view of the located VT events is presented in Figure 6. The location uncertainty was estimated for each event determined in this study. The locations of all 2726 located VT events are presented in Figure 6A. 2298 VT events had uncertainty lower than 5 km. The majority of the events with higher uncertainty were located outside the seismic network. Therefore, in this study, we only used the best-constrained events with location uncertainty less than 5 km. The residual travel times of the selected events range from −0.2 to 0.2 s (Figure 7A). Given the mean velocity is around 5 km/s (see Figure 8), the average uncertainty of the VT events is around 1 km. This value is considerably low for volcano monitoring.
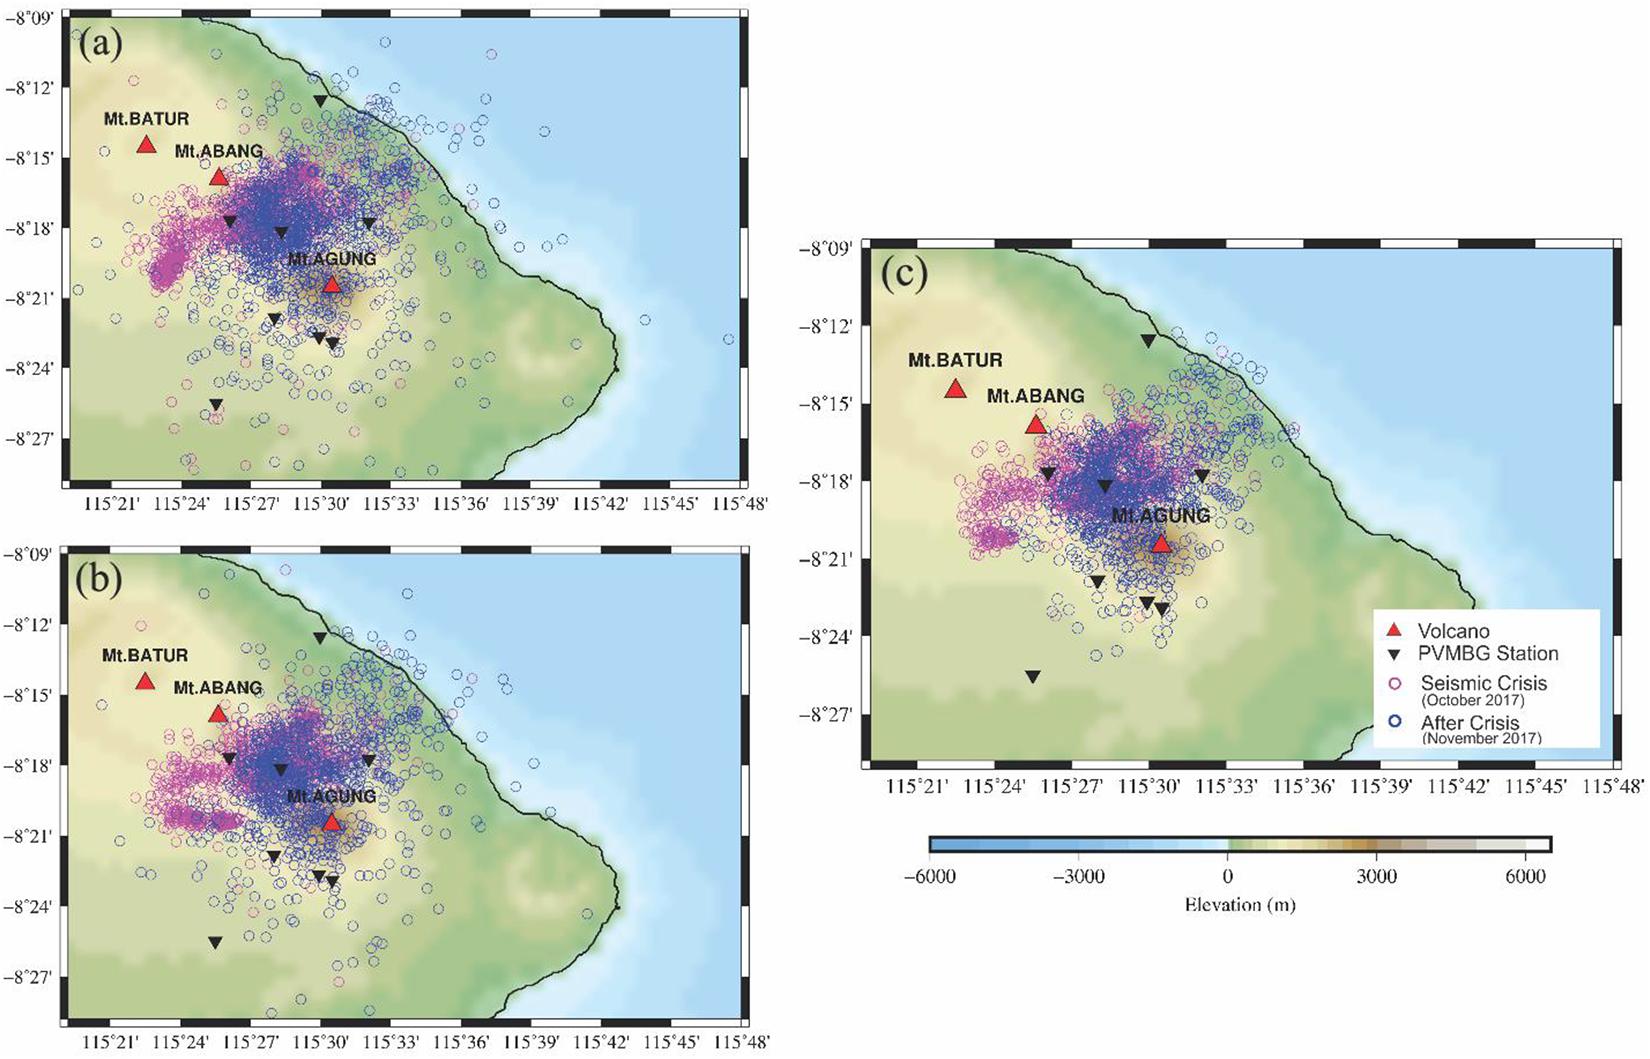
Figure 6. Map of epicenters of VT earthquakes preceding the 2017 Agung volcanic eruption. (A) Initial locations derived using a non-linear approach. (B) Updated epicenter distribution after updated 1D velocity model, and (C) after DD relocation. In (B) and (C) only events with uncertainty less than 5 km are shown. Purple and blue circles represent events during (October 2017) and after seismic crisis (November 2017), respectively.
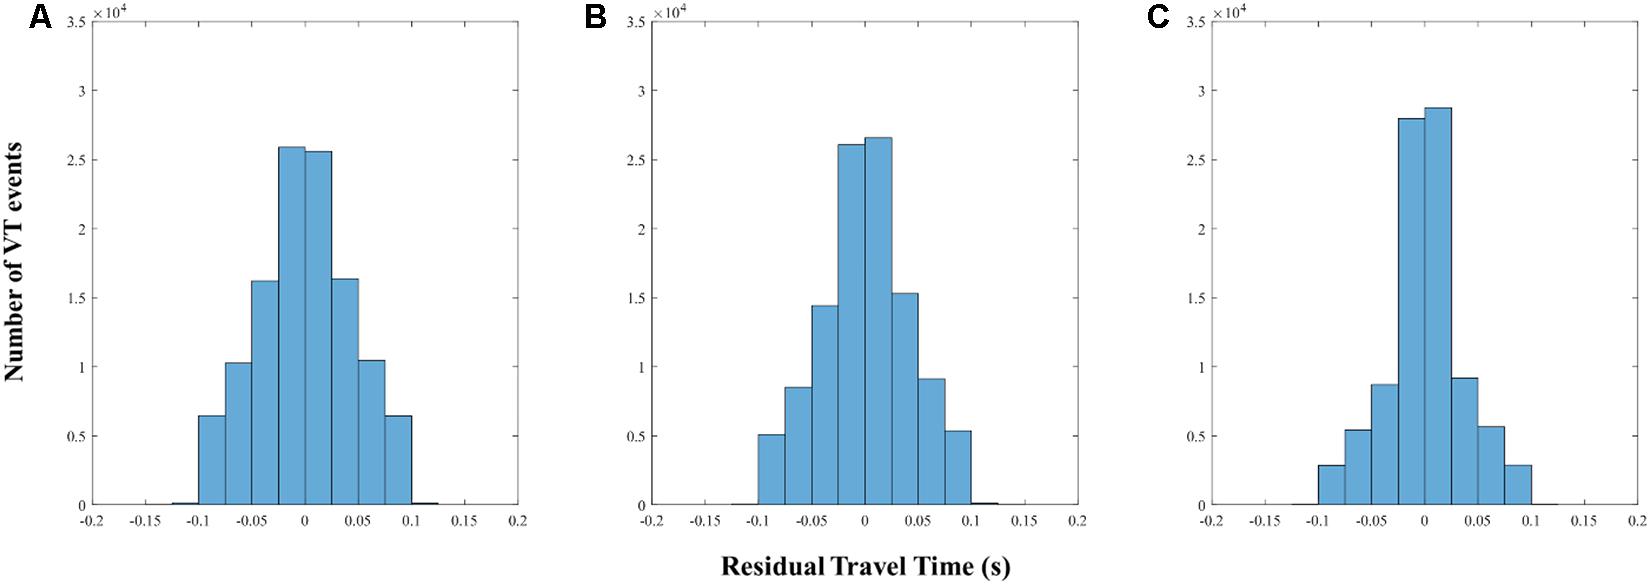
Figure 7. Travel time residual of hypocenters for each step determined in this study; i.e., (A) initial locations for all events, (B) after updated 1D velocity model, and (C) after DD relocation.
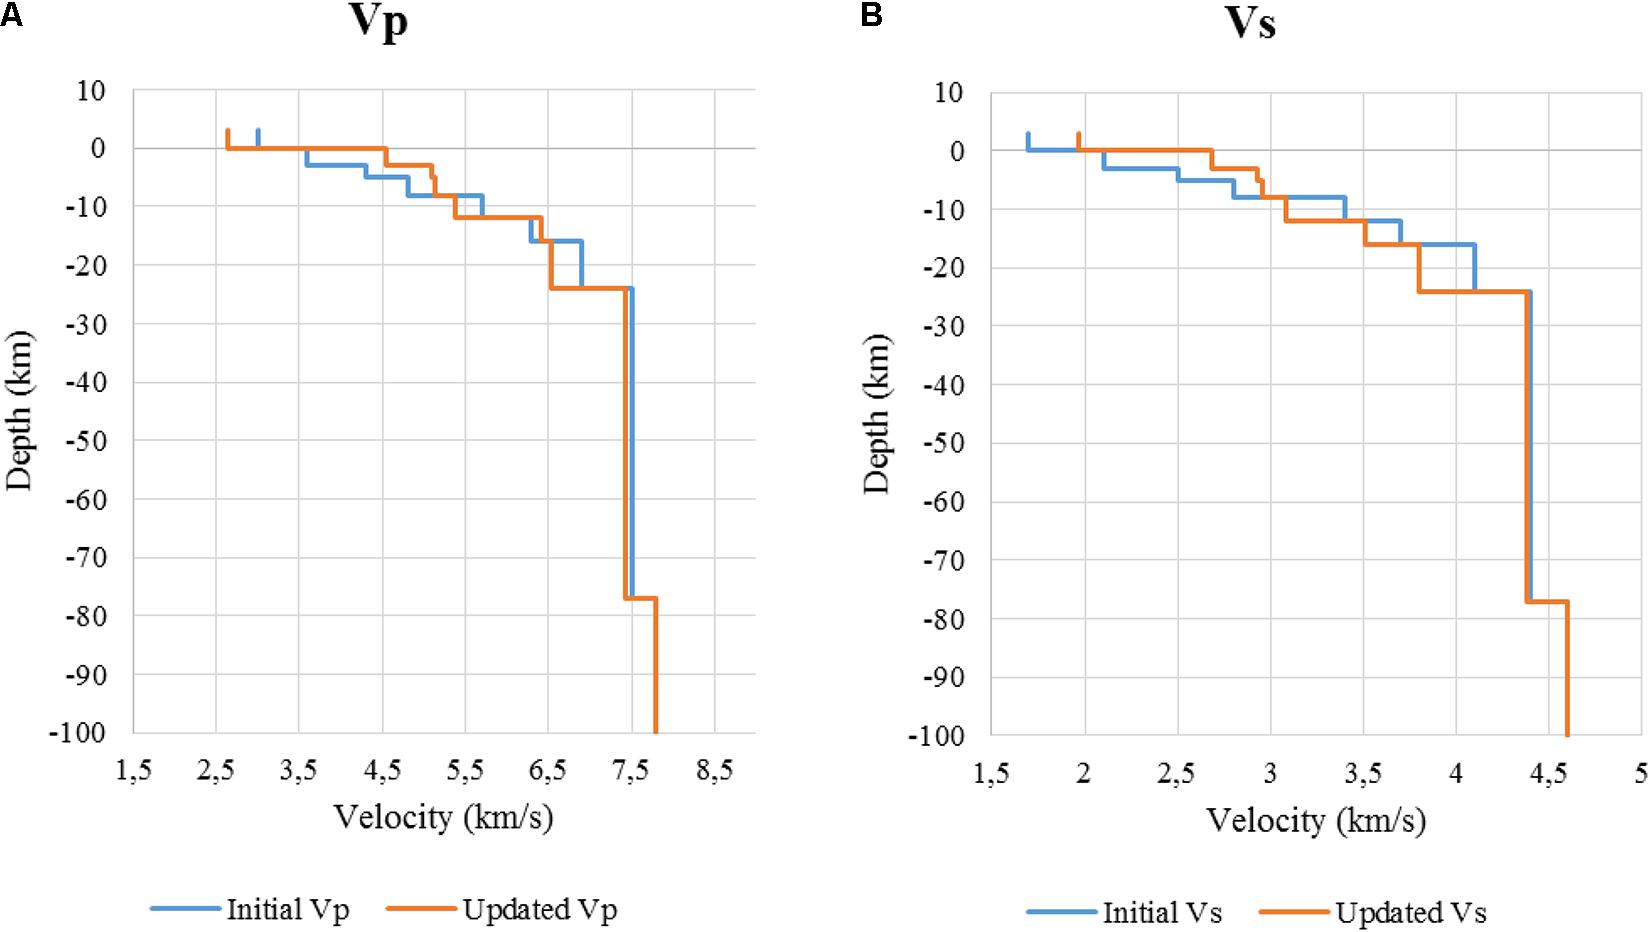
Figure 8. Plot of the initial (A) P-wave and (B) S-wave 1D velocity of Kou09 model taken from Koulakov et al. (2009) (blue line) and the updated velocity model (Agu20) used in this study (orange line).
1D Velocity Model Update and Station Corrections
We updated the 1D velocity model to meet the geological conditions of Agung Volcano by minimizing the residual travel time of VT events observed in this study. The velocity model update was done using the Joint Hypocenter Determination (JHD) technique implemented in the Velest program (Kissling et al., 1994). The JHD technique is used to account for lateral velocity variations, which is not considered in the 1D velocity models used to locate the seismic events. The concept includes the simultaneous location of a cluster of events, the determination of a set of suited station corrections, and the update of the 1D velocity model. Under appropriate conditions, the station corrections minimize the impact of unmodeled velocity variations, thus improving the locations of the events (Kissling et al., 1995). The rough topography of the study area (the difference in elevation between stations is as much as 1,474 m) might indicate a significant lateral velocity variation.
The inversion was performed iteratively. Throughout the inversion, the event hypocenter locations, velocity model, and correction stations were jointly determined. Several sets of parameters were exercised to find the best combination, given a minimum arrival time misfit. We discovered that a neighboring radius of 200 m, with damping for the velocity model set twice as high as the station corrections, gave the best results. The Vp/Vs ratio was fixed according to our observed Vp/Vs ratio (Figure 3). To ensure a robust solution, we made a slight maximum adjustment of hypocenter location, velocity model, and correction station in each iteration. In this case, a longer iteration and, therefore, a longer running time were required. However, this approach could minimize the possibility of getting a minimal local solution, especially in noisy data. The solution was found to be convergent after 26 iterations, and the RMS residual dropped by 45% to 0.3 s.
The updated 1D seismic velocity model obtained in this study, shown in Figure 8, is the Agu20 model. The Agu20 model is slightly different from the Kou09 model. On average, at depths above 8 km, the Agu20 model shows about 10% higher Vp and Vs compared to the Kou09 model. While from a depth of 8 to 24 km, the Agu20 model shows slightly lower Vp and Vs compared to the Kou09 model. The velocity model remained unchanged below depths of 24 km.
The station corrections obtained in this study ranged from −0.05 to 0.22 and −0.12 to 0.39 for P and S waves, respectively (plotted in Figure 9 and listed in Table 1). These values could be positive or negative, depending on the relative local velocity contrast in the region of the station, i.e., a positive value indicates the station was in a low-velocity anomaly and vice versa. Stations ABNG and CEGI have high positive station corrections (0.22 and 0.07 for P waves and 0.39 and 0.16 for S waves, respectively). In contrast, stations TMKS, PSAG, YHKR, and DUKU show correction around zero for both P and S. The two far-field stations, REND and BATU, indicate an intermediate value (−0.14, −0.08, respectively) for S waves and a very small value for P waves.
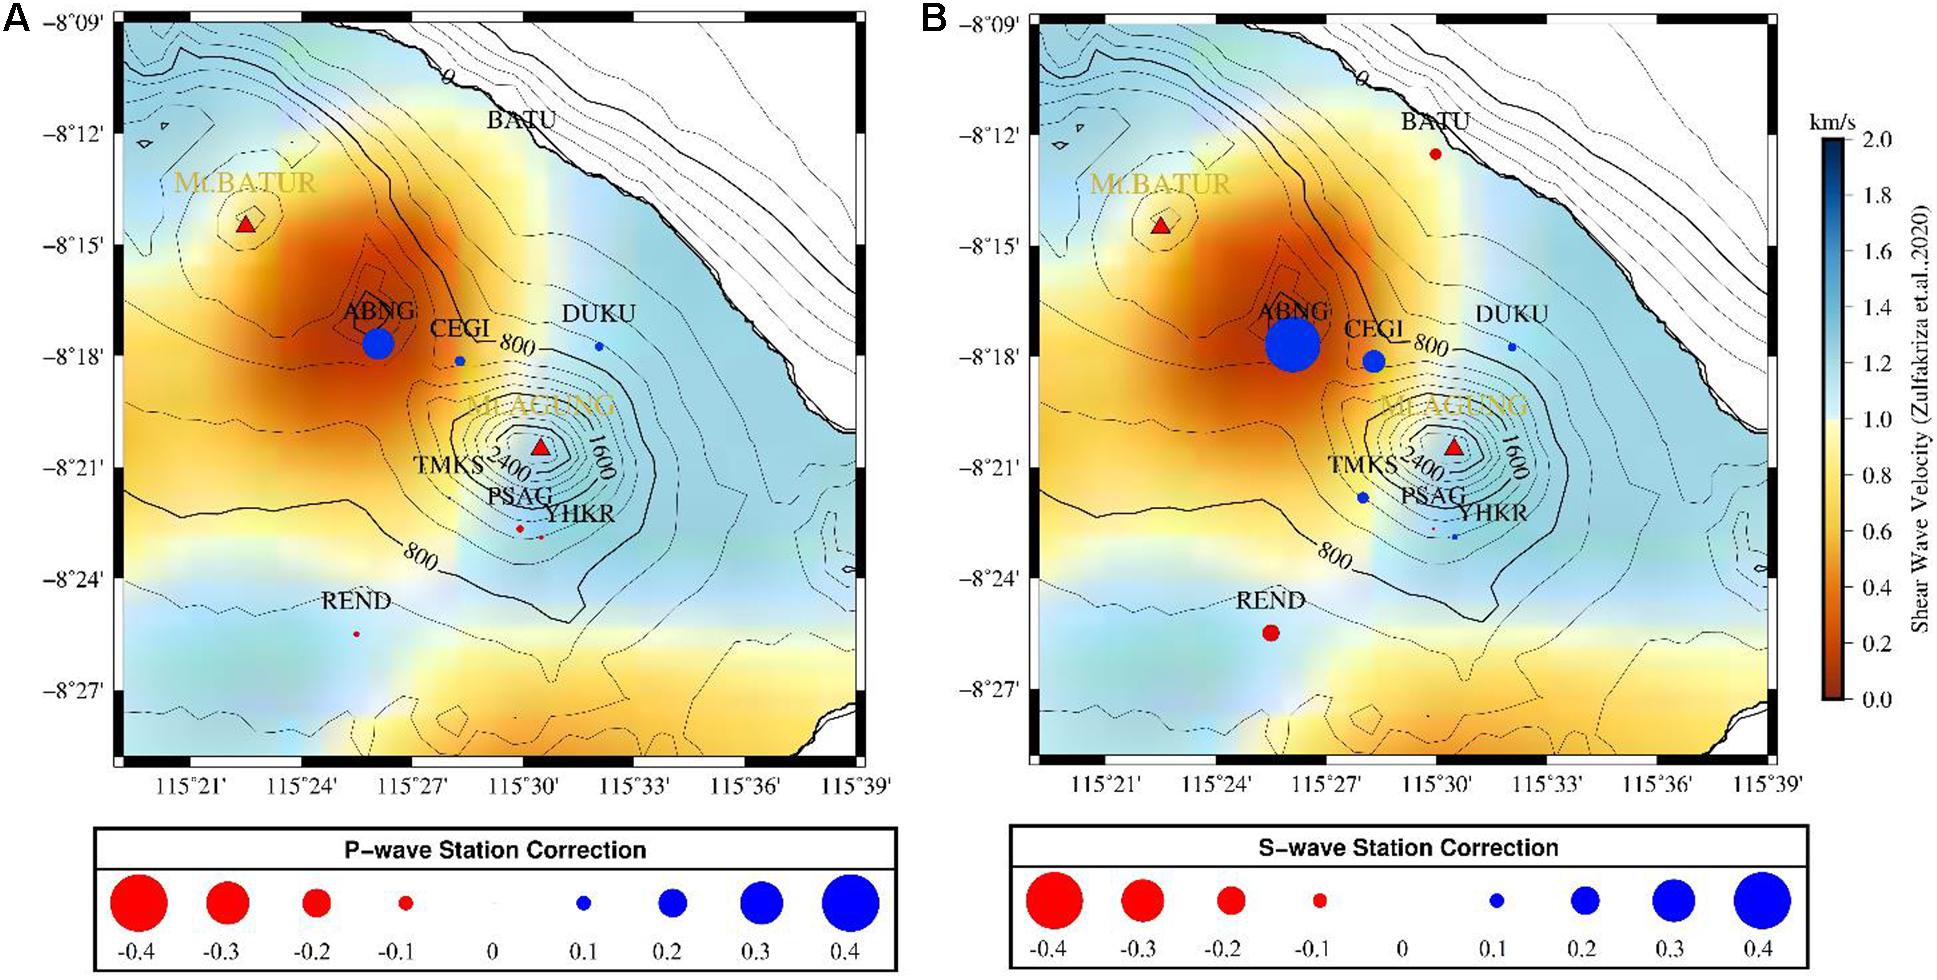
Figure 9. Distributions of (A) P-wave and (B) S-wave corrections at each station calculated using joint velocity-hypocenter determination technique. The station correction at each seismographic station is plotted with filled circles. The absolute magnitude of station corrections is represented by its size; whereas, the sign is denoted by its color; i.e., red and blue indicate negative and positive values, respectively.
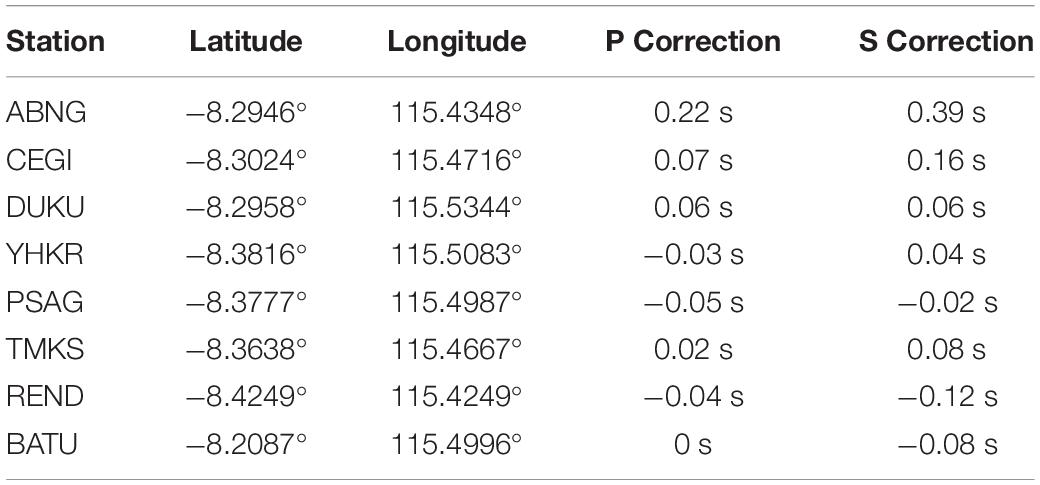
Table 1. Station corrections of each local station surrounding Agung volcano obtained through joint hypocenter location, velocity model, and station correction inversion which were performed in this study.
We overlaid the Zul20 S-wave velocity distribution, obtained from surface waves, at depths between 0.5 and 1 km with the station correction obtained in this study (Figure 9). The red and blue areas indicate low and high S-wave velocities, respectively. The same color scheme was used to plot the correction stations, with the radius of each plot indicating the magnitude of the correction. Interestingly, this is consistent with the S-wave velocity Zul20 model at a shallower depth. A good agreement could also be observed between the topographical and station corrections. The relatively high station corrections obtained indicate that the lateral velocity variation beneath Agung volcano, especially at lower depths, is quite significant.
Following the update of the velocity model and station corrections, the event hypocenter locations were relocated accordingly. The relocation process in this stage slightly reduced the residual travel time (Figure 7B). On average, the updated hypocenter locations were relocated by around 4 km from their initial locations. The most notable relocations were observed 10 km west of Agung volcano; after these relocations, two seismic trends were observed during the seismic crisis (Figure 6B).
Double-Difference Relative Relocation
The DD technique takes advantage of the fact that if the inter-event distance between a pair of earthquakes is small compared to the distance between event-station and the scale length of velocity heterogeneity, then the ray paths between the events pair and the station are similar (Waldhauser and Ellsworth, 2000). In this case, the difference of travel times of events pair observed at the same station can be addressed to the spatial offset between the events with high accuracy. In this study, the travel times difference of each events pair was obtained from the manual phase arrival picking.
To comply with the DD concept, some parameters have to be well defined. In this study, the maximum hypocentral separation for categorizing a cluster is 1.5 km, i.e., significantly less than the event-station distance and heterogeneity scale. We define that these events within one cluster have to be recorded by at least four common stations to be defined as neighboring events. Furthermore, to ensure that events within the cluster could be well paired, the maximum number of neighbors per event in one cluster is set to be moderate (30). A least-square damping value of 150 was chosen since it could give a stable solution, i.e., the condition number of the inversion matrix falls within a certain range (Tarantola and Valette, 1982). The updated Agu20 model was then used as the velocity model.
The combination of parameters mentioned above could relocate 2,095 paired events (out of 2298 well-defined events) and reduce the residual travel times obtained in the previous stage. The rest, 203 (∼10%) events, remains un-relocated. These events might be located far away from the other events or recorded by a few stations only. Figure 7C shows that more than 90% of the events fall below 0.12 s of residual travel times. The epicenter of the DD relocated events are plotted in Figure 6C.
Two vertical sections of the final hypocenter catalog (after DD relocation) are presented in Figure 10. In both cross sections, it can be seen that VT events during the seismic crisis are dominated by events located deeper than 6 km (Figures 10B,C). In a NE-SW vertical section, crossing the area between Batur and Agung Volcanoes, it can be seen that two branching magma paths rise to the summit of Agung Volcano and the valley between Agung and Batur Volcanoes (Figure 10C). Interestingly, the pattern of events migrating toward the valley between Agung and Batur was observed during the seismic crisis.
Figure 10. (A) Distribution of epicenters. (B,C) Map of the vertical distribution of the VT events preceding the 2017 Agung volcanic eruption in two vertical cross-sections. The two cross-sections are shown in the epicenter map in (A). Purple and blue circles represent events during and after seismic crisis respectively, respectively. The dashed black horizontal line at 6 km depth represent the interpreted depth boundary described in the text.
To assess the reliability of the event locations after the DD relocation, a statistical resampling approach, i.e., the “bootstrap” method, was implemented (Efron, 1982; Billings, 1994; Shearer, 1997; Supendi et al., 2019). The arrival times of both P and S waves of the 2,095 relocated events were substituted by samples drawn in the time residual distributions. Gaussian noise with a standard deviation of 0.1 s was added to this sample data. The shift in location due to these bootstrap samples was determined and repeated 1,000 times. The error ellipsoids were obtained at a 95% confidence level for these 1,000 sample data. The analysis of event uncertainties from the final relocated events (Figure 11) indicates that the mean of major uncertainty ellipsoid is around 181 m.
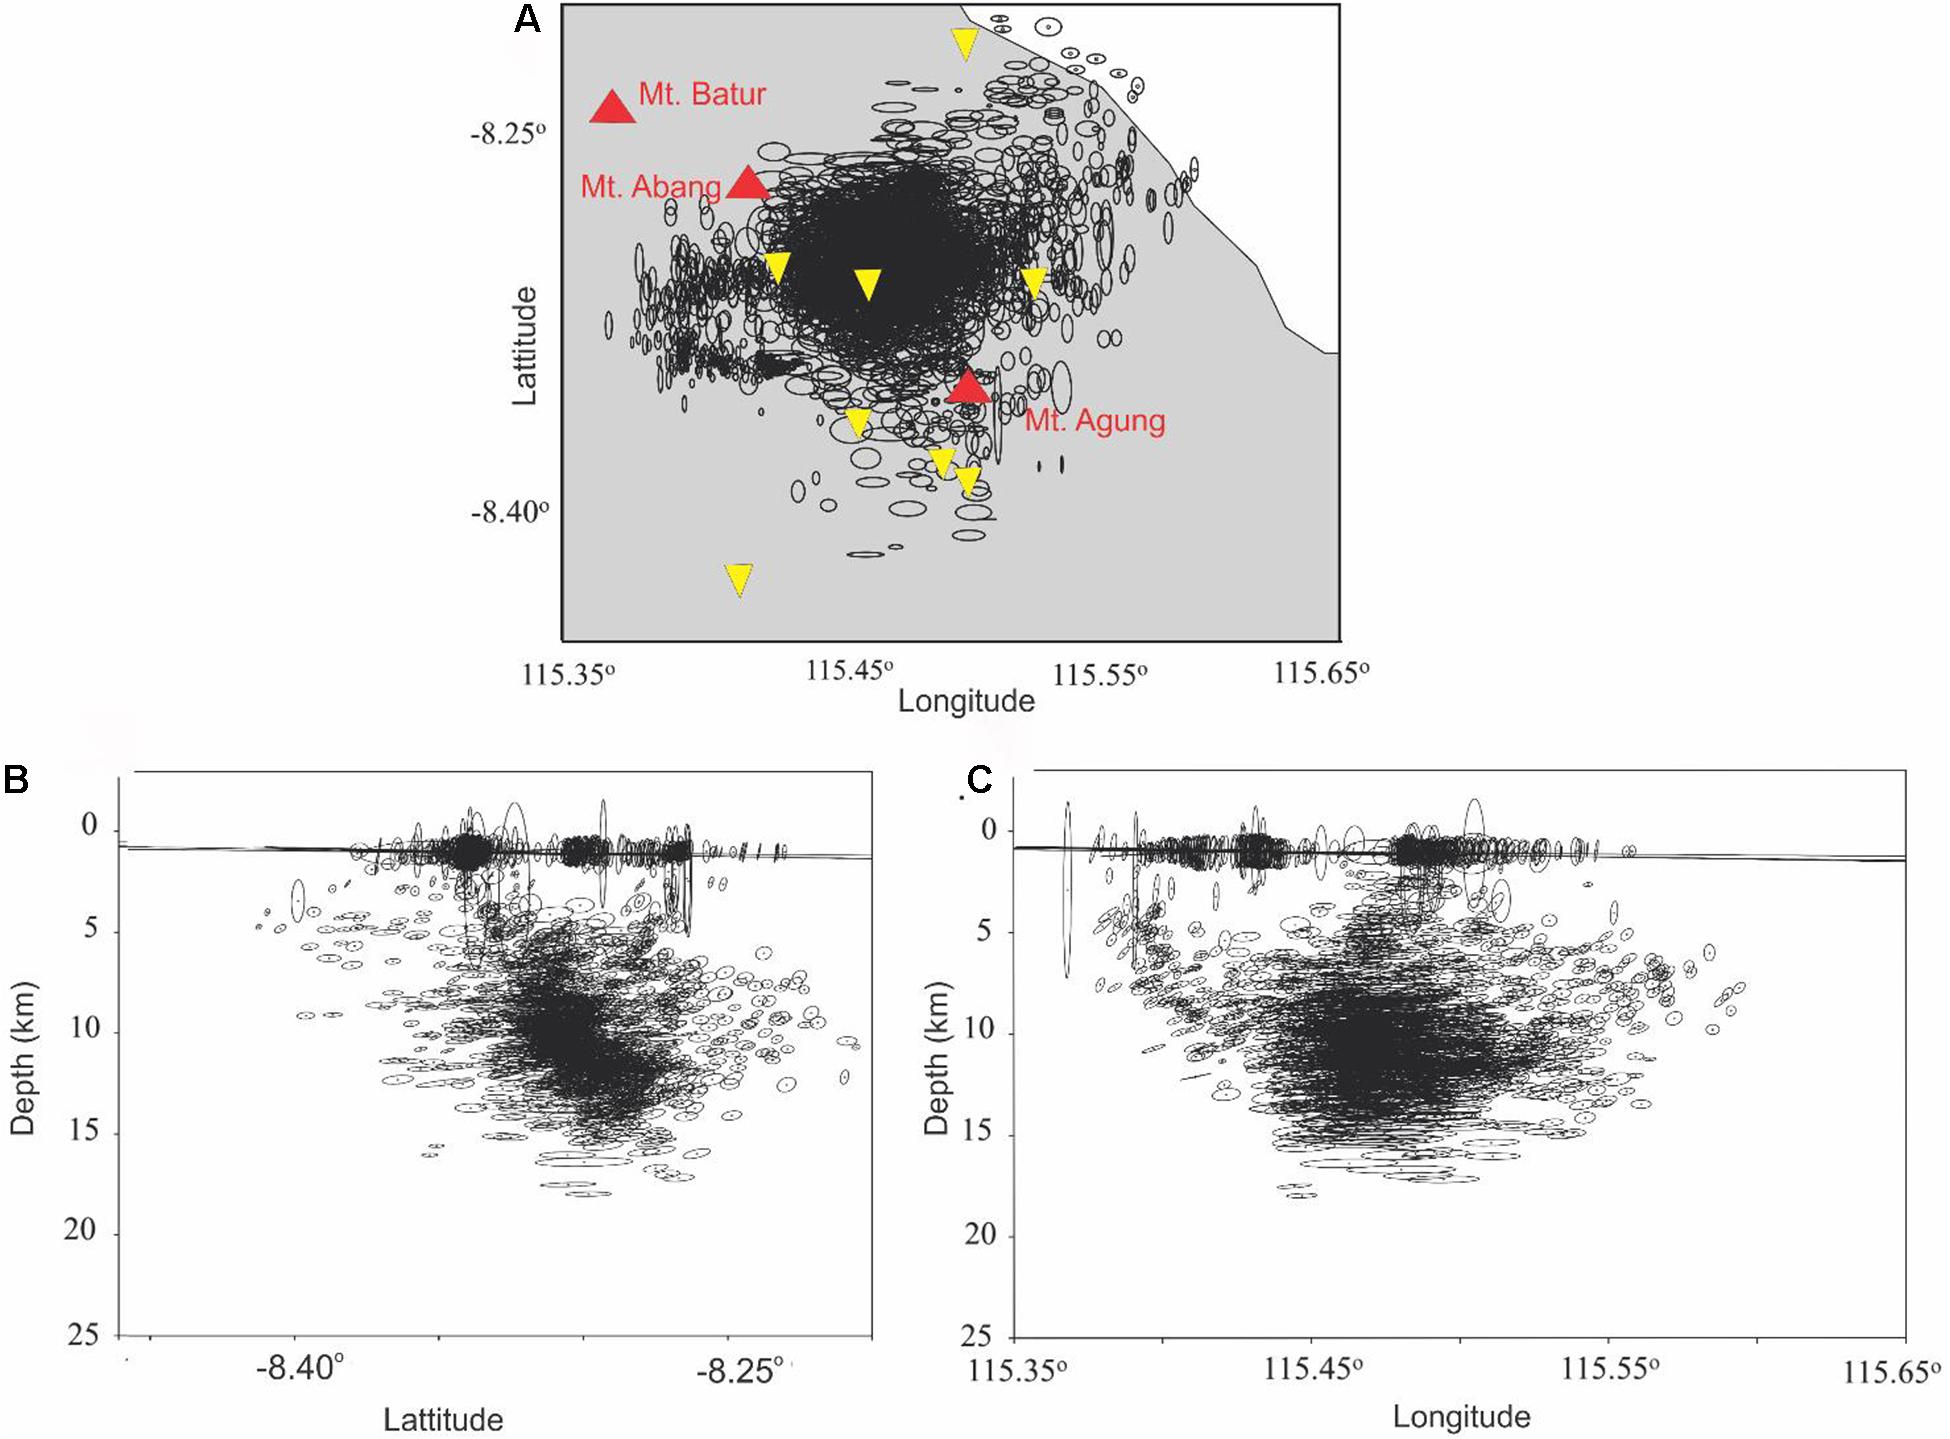
Figure 11. The relative location errors for the relocated VT events of 2017 Agung volcanic eruption in (A) map view, (B) vertical cross-sections along latitude, and (C) vertical cross-section along longitude. Each ellipsoid represents 95% confidence obtained from a bootstrap analysis of the final double-difference vector. Red triangles show Agung, Abang, and Batur volcanoes. Yellow inverted triangles indicate the seismic network.
Waveform Cross-Correlation
The similarity of VT events is analyzed using the waveform cross-correlation of recorded VT events. The idea is that if the events occurred on the same pre-existing fracture zones, some fractures with similar characteristics, e.g., geometry and orientation, had been reactivated. In this case, we might expect that the recorded waveform of some events would be identical as they come from the same source region and source mechanism. Therefore, the application of cross-correlation analysis allows the definition of groups of dependent events (multiplets) characterized by similar location, fault mechanism, and propagation pattern (Waldhauser and Ellsworth, 2000; Baisch et al., 2008).
The waveform cross-correlation was then applied to analyze the similarity of VT event’s source. It was done using recorded waveforms at station CEGI and TMKS. Those stations were chosen as they recorded the most VT events during the study period, and the noise level was small. The sample of similar waveforms from different events is presented in Figure 12. Interestingly, we found that 165 events with waveforms similarity greater than 0.8 were recorded during the seismic crisis, while none was found after the seismic crisis.
Figure 12. (A) Example of waveforms of events belonging to the same cluster recorded at the same seismographic station. The three components of the seismographic stations are plotted. Clusters were determined based on waveform similarity. Events with waveform similarity of higher than 0.9 are clustered together. (B) Distribution of VT events which have high waveform similarity are plotted in map view and vertical section. All events with high waveform similarity occurred in October 2017.
Applying the procedure of clustering in DD relocation used in this study, those events with high similarity formed 3,925 difference arrival times of event pairs; less than 3% than the difference arrival times of event pairs obtained from the manual picking catalog. Adding the waveform cross-correlation data into the DD relocation would shift the VT events obtained by DD using a picking catalog only by less than 1 km for events that occurred during the seismic crisis, while events after a seismic crisis relatively remain relatively unchanged. The residual travel times were also very similar to the one using only a manual picking catalog. As the shifting is relatively small, the relocation also could not sharpen the seismicity trend. Therefore, we decided that the catalog of VT events obtained by the DD relocation using the manual picking catalog data is the final one.
Discussion
The analysis of event uncertainties from the final relocated events (Figure 11) indicates that the mean of the major uncertainty ellipsoid is much smaller when compared to the seismic cluster formed in October and November 2017. In this case, we are confident in interpreting the details of the seismic clusters obtained in this study. The distinct seismic pattern difference between October and November 2017 highlights the different phases of magma intrusion that occurred underneath Agung volcano.
The VT seismic events during the seismic crisis presented in Figures 6C, 10A indicate that most of the seismic events were located midway between Agung and Batur, along a ∼N65°E seismic trend. Interestingly this trend is also in agreement with the S-wave velocity boundary obtained by Zulfakriza et al. (2020). This trend also acted as a boundary between the positive and negative station corrections obtained in this study. This gave us the first suggestion that this was a weak zone oriented in a NE-SW trend which was reactivated due to the magma migration toward the surface.
The hypothesis of fault reactivation during the seismic crisis was supported by the Vp/Vs anomaly and waveform cross-correlation analysis. We found that the seismic pattern in October 2017 shows an anomalously low Vp/Vs of 1.50 compared to 1.62 observed for the whole recording period. The low Vp/Vs ratio from the events aligned in a sharp NE-SW trend with a dip of ∼60° toward Agung during the seismic crisis indicated that this area might be highly fractured and filled with hydrothermal fluid in which the drop of the compressional wave is more significant than its shear wave drops (Ponko and Sanders, 1994). This case is analogous to the fractured rocks in geothermal areas, reactivated through pressure increase due to injection (Bachmann et al., 2012). In our case, the magma rising beneath Agung Volcano pressurized the confining aquifers, which in turn activated the fault NW of the summit and caused the seismic crisis.
The reactivation of a fracture zone during the seismic crisis is further supported by the waveform cross-correlation of VT events, in which events with high waveforms similarity were only found during the seismic crisis. This suggests that those VT events during the seismic crisis were originated from the reactivation of this fracture zone.
Furthermore, the seismicity cloud of highly similar events was originated from 10 km depth (Figure 12B). This level is interpreted as the source of the stress increase due to magma migration which led to fault reactivation. This agrees with the second model of Syahbana et al. (2019) [See Figure 7 of Syahbana et al. (2019)], in which a magma intrusion below the area between Agung and Batur caused an increase in pore pressure and reactivated the pre-existing fractures in this region. Furthermore, in this study, we could give a better constraint of the depth of the magma intrusion, which caused fault reactivation as well as the geometry (orientation and dip) of the reactivated fault as to the previous conceptual models (Albino et al., 2019; Syahbana et al., 2019).
The seismic cluster then moved toward Agung Volcano in November 2017 (Figure 6). The pattern of migration of the seismic clusters from a NE-SW alignment located between the two volcanoes toward Agung is in accordance with the pattern of the arrival time delay between the primary and secondary waves (Ts-Tp) (Figure 4).
The vertical section shown in Figure 10 depicts the distinct pattern of seismicity beneath Agung summit in October and November 2017. In October 2017, the VT events were contained at a depth of around six km beneath Agung Volcano, i.e., few VT events occurred above this depth in the direction toward Agung volcano. We suggest that there was a barrier (probably a stiffer layer) which prevented the upward migration of magma. Later, in November 2017 or after the seismic crisis, the magma and the related seismicity could penetrate the barrier and migrate upward toward the summit of Agung Volcano. As the waveform similarity analysis of VT events beneath Agung indicated complex faulting processes and its upward migration has a correlation with Agung eruption, we interpreted those events as resulting from the upward intrusion of magma.
Therefore, despite the seismicity rate decreased in November, magma migration was getting shallower, as suggested by the VT events. Furthermore, Syahbana et al. (2019) showed, starting early November 2017, an increasing value of RSAM was observed at TMKS, and LF events, as well as tremors, were observed. The VT events moved closer to the summit, increased RSAM, and the occurrence of LF events indicated that the volcano was approaching eruption. The eruption series then occurred starting on 25 November 2017. This detailed monitoring of upward migration of VT events was thus made possible thanks to the local seismic data processed in this study.
Conclusion
Analyzing the seismic crisis preceding a volcanic eruption is a challenging task; in particular, when the seismic network needed to monitor volcanic activity is lacking. Fortunately, the local seismic network deployed by CVGHM at the end of October 2017 allowed us to conduct an analysis of the seismic pattern preceding Agung volcano eruption. Despite the relatively late deployment of this network, we show that we were able to capture the major trend of the seismic crisis. For this purpose, 2,726 events were manually analyzed and located during the monitoring period, and 1,831 high-resolution VT events were obtained using advanced DD techniques and an updated 1D velocity model.
Based on the seismicity, we observed two patterns which represent the VT events related to the reactivation of fracture network due to stress increase (during the seismic crisis) and magma intrusion (after the seismic crisis). The characteristics of each event type are also discussed in terms of Vp/Vs values, phase delay times, waveform similarities, and seismic cluster shapes. The detailed reconstruction of upward magma migration was thus made possible thanks to the local seismic data processed in this study. We interpret that the upward magma migration reached a barrier (probably a stiff layer) at depth of around 6 km which prohibited further magma ascent. The magma pressurized the area beneath the barrier and reactivated the fault located between Agung and Batur volcanoes. Therefore, a significant increase in recorded seismicity (the “seismic crisis”) was observed for about 2 months since September 2017. Later in early November 2017, the barrier layer was finally intruded, and magma propagated toward the Agung summit. The depth of the dike, which caused fault reactivation, as well as the geometry (strike and dip) of the reactivated fault, could also be evaluated. More in general, these results provide a better depth constraint as to the previous conceptual models (Albino et al., 2019; Syahbana et al., 2019).
This study emphasizes the importance of prompt analysis (location and basic seismic characteristics) of the seismic crisis preceding Agung eruption. The distinction between VT event types observed in this study is significant for eruption forecasting and for understanding the structure of magmatic systems as these depict upward magma migration. The source mechanism of the major events needs to be further assessed for a better understanding of the role of the interpreted barrier, which acts as a boundary.
Data Availability Statement
The original contributions presented in the study are included in the article/supplementary material, further inquiries can be directed to the corresponding author.
Author Contributions
DPS, ZZ, AN, SW, AA, and MM conceived the survey and seismic study on Agung Batur Volcano Complex. DPS, PR, AN, DKS, ZZ, AB, and SR contributed to the writing of the manuscript. All authors contributed to the preparation of the manuscript and read and approved the final manuscript.
Funding
This study was mainly supported by USAID PEER (Partnerships for Enhanced Engagement in Research) with agreement number AID-OAA-A-11-00012. In addition, it was also partially supported by ITB Research 2019–2020 Program, and the Master’s Thesis Research Program BP-PTNBH Kemristek/BRIN 2020 which were awarded to AN, and the Center for Earthquake Science and Technology, Research Center for Disaster Mitigation, Institut Teknologi Bandung (CEST, PPMB, ITB).
Conflict of Interest
The authors declare that the research was conducted in the absence of any commercial or financial relationships that could be construed as a potential conflict of interest.
Acknowledgments
This study was a collaboration between Institut Teknologi Bandung (ITB), the Center for Volcanology and Geological Hazard Mitigation (CVGHM), the Geological Agency of Indonesia, and the Volcano Disaster Assistance Program (VDAP) of the United States Geological Survey (USGS). Wessel et al. (2019) use of Global Mapping Tools (GMT) was used to produce the figures in this article, Anthony Lomax et al. (2000) for the Seisgram2k80 and NonLinLoc programs, Kissling et al. (1995) for the Velest program, and Waldhauser and Ellsworth (2000) for the HypoDD program.
References
Albino, F., Biggs, J., and Syahbana, D. K. (2019). Dyke intrusion between neighbouring arc volcanoes responsible for 2017 pre-eruptive seismic swarm at Agung. Nat. Commun. 10:748. doi: 10.1038/s41467-019-08564-9
Bachmann, C. E., Wiemer, S., Goertz-Allmann, B. P., and Woessner, J. (2012). Influence of pore-pressure on the event-size distribution of induced earthquakes. Geophys. Res. Lett. 39:L09302. doi: 10.1029/2012GL051480
Baisch, S., Ceranna, L., and Harjes, H. P. (2008). Earthquake cluster: what can we learn from waveform similarity? Bull. Seismol. Soc. Am. 98, 2806–2814. doi: 10.1785/0120080018
Billings, S. D. (1994). Simulated annealing for earthquake location. Geophys. J. Int. 118, 680–692. doi: 10.1111/j.1365-246X.1994.tb03993.x
Cadle, R. D., Kiang, C. S., and Louis, J.-F. (1976). The global scale dispersion of the eruption clouds from major volcanic eruptions. J. Geophys. Res. 81, 3125–3132. doi: 10.1029/jc081i018p03125
Efron, B. (1982). The Jackknife, The Bootstrap and Other Resampling Plans. Philadelphia: Society for Industrial and Applied Mathematics.
Fontijn, K., Costa, F., Sutawidjaja, I., Newhall, C. G., and Herrin, J. S. (2015). A 5000-year record of multiple highly explosive mafic eruptions from Gunung Agung (Bali, Indonesia): implications for eruption frequency and volcanic hazards. Bull. Volcanol. 77:59. doi: 10.1007/s00445-015-0943-x
Geiger, H., Troll, V. R., Jolis, E. M., Deegan, F. M., Harris, C., Hilton, D. R., et al. (2018). Multi-level magma plumbing at Agung and Batur volcanoes increases risk of hazardous eruptions. Sci. Rep. 8:10547. doi: 10.1038/s41598-018-28125-2
Gunawan, M. T., Kusnandar, R., Supendi, P., Nugraha, A. D., Puspito, N. T., and Sahara, D. P. (2020). Analysis of swarm earthquakes around Mt. Agung Bali, Indonesia prior to November 2017 eruption using regional BMKG network. Geosci. Lett. 7:14. doi: 10.1186/s40562-020-00163-7
Hansen, J. E., Wang, W.-C., and Lacis, A. A. (1978). Mount agung eruption provides test of a global climatic pertubation. Science 199, 1065–1068. doi: 10.1126/science.199.4333.1065
Kissling, E., Ellsworth, W. L., Phillips, D. E., and Kradolfer, U. (1994). Initial reference models in local earthquake tomography. J. Geophys. Res. 99, 19635–19646. doi: 10.1029/93JB03138
Koulakov, I., Jakovlev, A., and Luehr, B. G. (2009). Anisotropic structure beneath central Java from local earthquake tomography. Geochem. Geophys. Geosyst. 10:Q02011. doi: 10.1029/2008GC002109
Kusumadinata (1964). The eruption of the Agung volcano in Bali in 1963. Bull.Geol.Surv. Indones. 1, 12–15.
Lomax, A., and Curtis, A. (2001). Fast, probabilistic earthquake location in 3D models using Oct-tree importance sampling. Geophys. Res. Abstr. 3:955.
Lomax, A., and Michelini, A. (2009). Mwpd: a duration-amplitude procedure for rapid determination of earthquake magnitude and tsunamigenic potential from P waveforms. Geophys. J. Int. 176, 200–214. doi: 10.1111/j.1365-246X.2008.03974
Lomax, A., Satriano, C., and Vassallo, M. (2012). Automatic picker developments and optimization: filterpicker – a robust, broadband picker for real-time seismic monitoring and earthquake early warning. Seismol. Res. Lett. 83, 531–540. doi: 10.1785/gssrl.83.3.531
Lomax, A., Virieux, J., Volant, P., and Berge-Thierry, C. (2000). “Probabilistic earthquake location in 3D and layered models,” in Advances in Seismic Event Location. Modern Approaches in Geophysics, eds C. H. Thurber and N. Rabinowitz (Dordrecht: Springer Netherlands), 101–134.
Minakami, T. (1974). “Seismology of volcanoes in japan,” in Physical Volcanology, eds L. Civetta, P. Gasparini, G. Luongo, and A. Rapolla (Amsterdam: Elsevier Scientific Publishing Company).
Ponko, S. C., and Sanders, C. O. (1994). Inversion for P and S wave differential attenuation structure, long valley caldera, California. J. Geophys. Res. Solid Earth 99, 2619–2635. doi: 10.1029/93JB03405
PVMBG (2017). Letusan Gunung Agung 21 November 2017 pukul 17:05 WITA, Kementrian Energi dan Sumber Daya Mineal, Badan Geologi. Available online at: https://magma.esdm.go.id/v1/press-release/111?signature=0213885802d252e70e6b3a7c194ddadb0ce9500b18a0eeccd09884174a3871e5 (Accessed: February 22, 2020).
Rampino, M. R., and Self, S. (1982). Historic eruptions of Tambora (1815), Krakatau (1883), and Agung (1963), their stratospheric aerosols, and climatic impact. Quat. Res. 127–143. doi: 10.1016/0033-5894(82)90065-5
Self, S., and Rampino, M. R. (2012). The 1963-1964 eruption of Agung volcano (Bali, Indonesia). Bull. Volcanol. 74, 1521–1536. doi: 10.1007/s00445-012-0615-z
Self, S., Rampino, M. R., and Barbera, J. J. (1981). The possible effects of large 19th and 20th century volcanic eruptions on zonal and hemispheric surface temperatures. J. Volcanol. Geothermal Res. 11, 41–60. doi: 10.1016/0377-0273(81)90074-3
Shearer, P. M. (1997). Application to the Whittier aftershock sequence Narrows California. J. Geophys. Res. 102, 8269–8283. doi: 10.1029/96JB03228
Supendi, P., Nugraha, A. D., Widiyantoro, S., Abdullah, C. I., Puspito, N. T., Palgunadi, K. H., et al. (2019). Hypocenter relocation of the aftershocks of the Mw 7.5 Palu earthquake (September 28, 2018) and swarm earthquakes of Mamasa, Sulawesi, Indonesia, using the BMKG network data. Geosci. Lett. 6:18. doi: 10.1186/s40562-019-0148-9
Syahbana, D. K., Kasbani, K., Suantika, G., Prambada, O., Andreas, A. S., Saing, S. L., et al. (2019). The 2017–19 activity at Mount Agung in Bali (Indonesia): intense unrest, monitoring, crisis response, evacuation, and eruption. Sci. Rep. 9:8848. doi: 10.1038/s41598-019-45295-9
Tarantola, A., and Valette, B. (1982). Inverse problems = quest for information. J. Geophys. 50, 159–170. doi: 10.1002/bit.260430206
Waldhauser, F., and Ellsworth, W. L. (2000). A Double-difference earthquake location algorithm: method and application to the northern hayward fault, California. Bull. Seismol. Soc. Am. 90, 1353–1368. doi: 10.1785/0120000006
Wassermann, J. (2011). “Chapter 13: volcano seismology,” in New Manual of Seismological Observatory Practice, ed. P. Bormann (Potsdam: deutsches geoforschungszentrum), 1–67.
Wessel, P., Luis, J. F., Uieda, L., Scharroo, R., Wobbe, F., Smith, W. H. F., et al. (2019). The generic mapping tools version 6. Geochem. Geophys. Geosys. 20, 5556–5564. doi: 10.1029/2019GC008515
White, R., and McCausland, W. (2016). Volcano-tectonic earthquakes: a new tool for estimating intrusive volumes and forecasting eruptions. J. Volcanol. Geothermal Res. 309, 139–155. doi: 10.1016/j.jvolgeores.2015.10.020
Zen, M. T., and Hadikusumo, D. (1964). Preliminary report on the 1963 eruption of Mt. Agung in Bali (Indonesia). Bull. Volcanol. 27, 269–300. doi: 10.1007/BF02597526
Zlotnicki, J., Sasai, Y., Johnston, M. J. S., Fauquet, F., Villacorte, E., and Jr, J. M. C. (2018). The 2010 seismovolcanic crisis at Taal Volcano (Philippines). Earth Planets Space 70:159. doi: 10.1186/s40623-018-0925-2
Keywords: volcano-tectonic events, volcano monitoring, magma migration, 2017 Agung eruption, volcano seismology, Mt. Agung, seismic crisis
Citation: Sahara DP, Rahsetyo PP, Nugraha AD, Syahbana DK, Widiyantoro S, Zulfakriza Z, Ardianto A, Baskara AW, Rosalia S, Martanto M and Afif H (2021) Use of Local Seismic Network in Analysis of Volcano-Tectonic (VT) Events Preceding the 2017 Agung Volcano Eruption (Bali, Indonesia). Front. Earth Sci. 9:619801. doi: 10.3389/feart.2021.619801
Received: 21 October 2020; Accepted: 20 April 2021;
Published: 20 May 2021.
Edited by:
Jessica Helen Johnson, University of East Anglia, United KingdomReviewed by:
Yosuke Aoki, The University of Tokyo, JapanAude Lavayssière, UMR 7154 Institut de Physique du Globe de Paris (IPGP), France
Copyright © 2021 Sahara, Rahsetyo, Nugraha, Syahbana, Widiyantoro, Zulfakriza, Ardianto, Baskara, Rosalia, Martanto and Afif. This is an open-access article distributed under the terms of the Creative Commons Attribution License (CC BY). The use, distribution or reproduction in other forums is permitted, provided the original author(s) and the copyright owner(s) are credited and that the original publication in this journal is cited, in accordance with accepted academic practice. No use, distribution or reproduction is permitted which does not comply with these terms.
*Correspondence: Andri Dian Nugraha, bnVncmFoYUBnZi5pdGIuYWMuaWQ=; YW5kcmlkbjEwNEBnbWFpbC5jb20=