 Zeeshan Shirazi
 Lei Wang
 Valery G. Bondur
- 1Key Laboratory of Digital Earth Science, Aerospace Information Research Institute, Chinese Academy of Sciences, Beijing, China
- 2State Key Laboratory of Remote Sensing Science, Aerospace Information Research Institute, Chinese Academy of Sciences, Beijing, China
- 3Institute for Scientific Research of Aerospace Monitoring “AEROCOSMOS”, Moscow, Russia
Wildfire is one of the most common natural hazards in the world. Fire risk estimation for the purposes of risk reduction is an important aspect in disaster studies around the world. The aim of this research was to develop a machine learning workflow process for South East China to monitor fire risks over a large region by learning from a grid file database containing a time series of several of the important environmental parameters largely extracted from remote sensing data products, and highlight areas as fire risk or non-fire risk over a couple of weeks in the future. The study employed fire threshold and the transductive PU learning method to identify reliable non-fire/negative training samples from the grid file database using fire/positive training samples, labeled using the MODIS MCD14ML fire location product. Different models were trained for the three natural vegetation land covers, namely evergreen broadleaf forest, mixed forest, and woody savannas in the study area. On the test dataset, the three models exhibited high sensitivity (>80%) by identifying the majority of fires in the test dataset for all land covers. The use of the reliable negatives identified though the fire threshold and PU learning process resulted in low precision and accuracy. During the model verification process, the model for the mixed forest land cover performed the best with 70% of verification fires falling within the classified fire zone. It was found that the better representation of mixed forest in the training samples made this model perform more reliably as compared to others. Improving the individual models constructed for different land covers and combining them can provide fire classification for a larger region. There is room to improve the spatial precision of fire cell classification. Introducing finer scale features that have higher correlation with fire activity and exhibit high spatial variability seems a viable way forward.
Introduction
Most of the forested ecosystem of the world face fire risk as a critical natural disturbance (Chowdhury and Hassan, 2015; Lin et al., 2018, 2019; Hansen et al., 2020). Wildfires are a formidable force that may cover thousands of acres and burn for many days (Coen and Schroeder, 2013). They can cause damages such as destruction and loss of property, damages to agriculture, and loss of biodiversity apart from deforestation and land degradation (Yakubu and Duker, 2015). In the current context of global warming, forests play an important role as carbon sinks, dust absorption media, temperature and rainfall regulators, air purifiers, and in preventing soil degradation (Liu et al., 2016), all of which are disrupted as a consequence of fire activity reducing the effectiveness of forest land cover. Wildfires are intense sources of emissions of harmful gases into the atmosphere including trace gases (CO2, CO, NOx, etc.) and fine aerosols (PM2,5) (Bondur, 2016; Bondur and Ginzburg, 2016).
The United Nation’s Sendai Framework for achieving Sustainable Development Goals, adopted in 2015, emphasizes risk reduction as compared to disaster mitigation. Fire management and risk reduction requires risk assessments that enable necessary preparation, planning, and allocation of resources. Even though fires, individually, are globally frequent events with random and sudden onset, nevertheless they have certain seasonal and conditional regularities (Jiang et al., 2012), with ecological and socio-economic factors effecting the environmental conditions leading up to, or during, active fire events (Guettouche et al., 2011). Modeling conditions appropriate for wildfires will, therefore, provide an essential first step in fire risk assessment.
There is extensive research literature on wildfires and forest fires, with a large bulk focusing on the relationship between fire activity and different climate parameters, such as but not limited to precipitation, evapotranspiration, and potential evapotranspiration and many others (Bondur, 2011; Bondur et al., 2020). This is necessary because understanding the influence of climate variables on fire risk helps to understand the spatial and temporal distribution of fire occurrence and also provides an important component to understand the human-environment interactions leading to fire activity (Eskandari et al., 2020a). There are broadly two main categories of fire risk assessment tools. The first category deals with those that consider current conditions to predict fire, assuming that the recent historical conditions have remained relatively the same (Pye et al., 2010). The second broad category deals with models that are constructed to predict vegetation or climatic changes and the consequent fire risk (Pye et al., 2010; Eskandari et al., 2020b).
In the past couple of decades, Earth observation capabilities have significantly increased in several key aspects, including data quantity, quality, processing capability, and increasing accessibility to these data and processing resources (Wang et al., 2012, Wang et al., 2020; Chen et al., 2017, 2018; Yu et al., 2018). Satellite methods and technologies play a special role in the early detection of wildfires primarily over vast areas (Bondur, 2011; Bondur et al., 2017, 2020; Bondur and Gordo, 2018). These methods and technologies are also extremely effective for assessing the aftermath of wildfires associated with negative effects on the atmosphere caused by emissions of harmful gases and aerosols (Bondur, 2011, 2016; Bondur and Ginzburg, 2016). This has led to the concept of big Earth data, which highlights the pooling of multidisciplinary concepts and resources to maximize the benefits of this growing technological potential for Earth systems science (Guo, 2017a,b). Big Earth data are simply big data for Earth systems science and make use of traditional fields such as mathematics, statistics, computer science, remote sensing, geographic information systems (GIS), and the emerging fields of machine learning, data mining, and artificial intelligence, however, scale variance and complexities of spatial temporal data add to the challenges of data processing unlike big data (Bondur, 2014; Guo et al., 2020).
Machine learning techniques have also been applied in multiple wildfire-related studies, however, this is mostly a recent phenomenon, heavily focused on in the last 15 years. Machine learning has been applied in various aspects of wildfire studies, such as burn area mapping (Brewer et al., 2005; Dragozi et al., 2014), the importance of environmental variables in fire severity and burn area (Fang et al., 2015; Yu and Chen, 2017), wild fire distribution (Parisien and Moritz, 2009), ignition distribution (Massada et al., 2013; Rodrigues and De la Riva, 2014), predicting wildfires (Cortez and Morais, 2007; Jain and Bhatia, 2013), modeling and mapping fire danger (Eskandari et al., 2020c), and others (Chen and Yu, 2019; Yu et al., 2020; Chen et al., 2021). All of these studies found that machine learning models provided better accuracy as compared to other parametric approaches.
Machine learning is generally divided into supervised and unsupervised machine learning based on the availability of labels for classification of input data (Bondur, 2014). However, there are a large variety of cases where labels are only available for the positive class or class of interest (du Plessis et al., 2014). Such problems require a special case of semi supervised learning called “learning from positive and unlabeled data” or “PU learning” for short. PU learning only requires positive examples and it normally has two steps, (1) to identify reliable negative examples from the unlabeled dataset, and (2) employ a classifier for classification purposes (Liu et al., 2003; Chen, 2009; Han et al., 2016, 2018). Various PU learning techniques have been developed such as spy EM (S-EM) (Liu et al., 2002), positive example-based learning (PEBL) (Yu et al., 2002), one class support vector machine (Manevitz and Yousef, 2002), Roc-SVM (Li and Liu, 2003), weighted logistic regression (Lee and Liu, 2003), biased SVM (Liu et al., 2003), and bagging SVM (Mordelet and Vert, 2014) to name a few.
The aim of this study was to develop a machine learning workflow process to monitor fire risks over large regions that can identify conditions appropriate for wildfires by learning from a grid file database developed using data sources of several of the important environmental parameters that can be estimated using Earth observation platforms. Such a workflow not only provides fire hazard managers a preliminary synoptic monitoring capability and but also provides an opportunity for developing informed data-driven policies and decisions to manage fire risks.
Materials and Methods
Study Area
In China, large fires occur in large forests in the northeastern and southwestern regions of the country (Tian et al., 2013), but northern regions have received greater attention in literature due to higher frequency of fire events. On the other hand, the literature also suggests that southern China has high fire frequency of smaller fires compared to the north. Even in the south, the south east (SE) region has high overall annual fire activity, with peak fire activity in the winter months of December, January, and February (Shirazi et al., 2017), and hence we focused on this area in this study. Spatially, a MODIS tile defined by horizontal 28 and vertical 06 was selected as the area of interest for this study. Administratively, the provinces of Anhui, Zhejiang, Jiangxi, Fujian, Hunan, Guangdong, and Guangxi fall, completely or in some portion, in our study area (Figure 1).
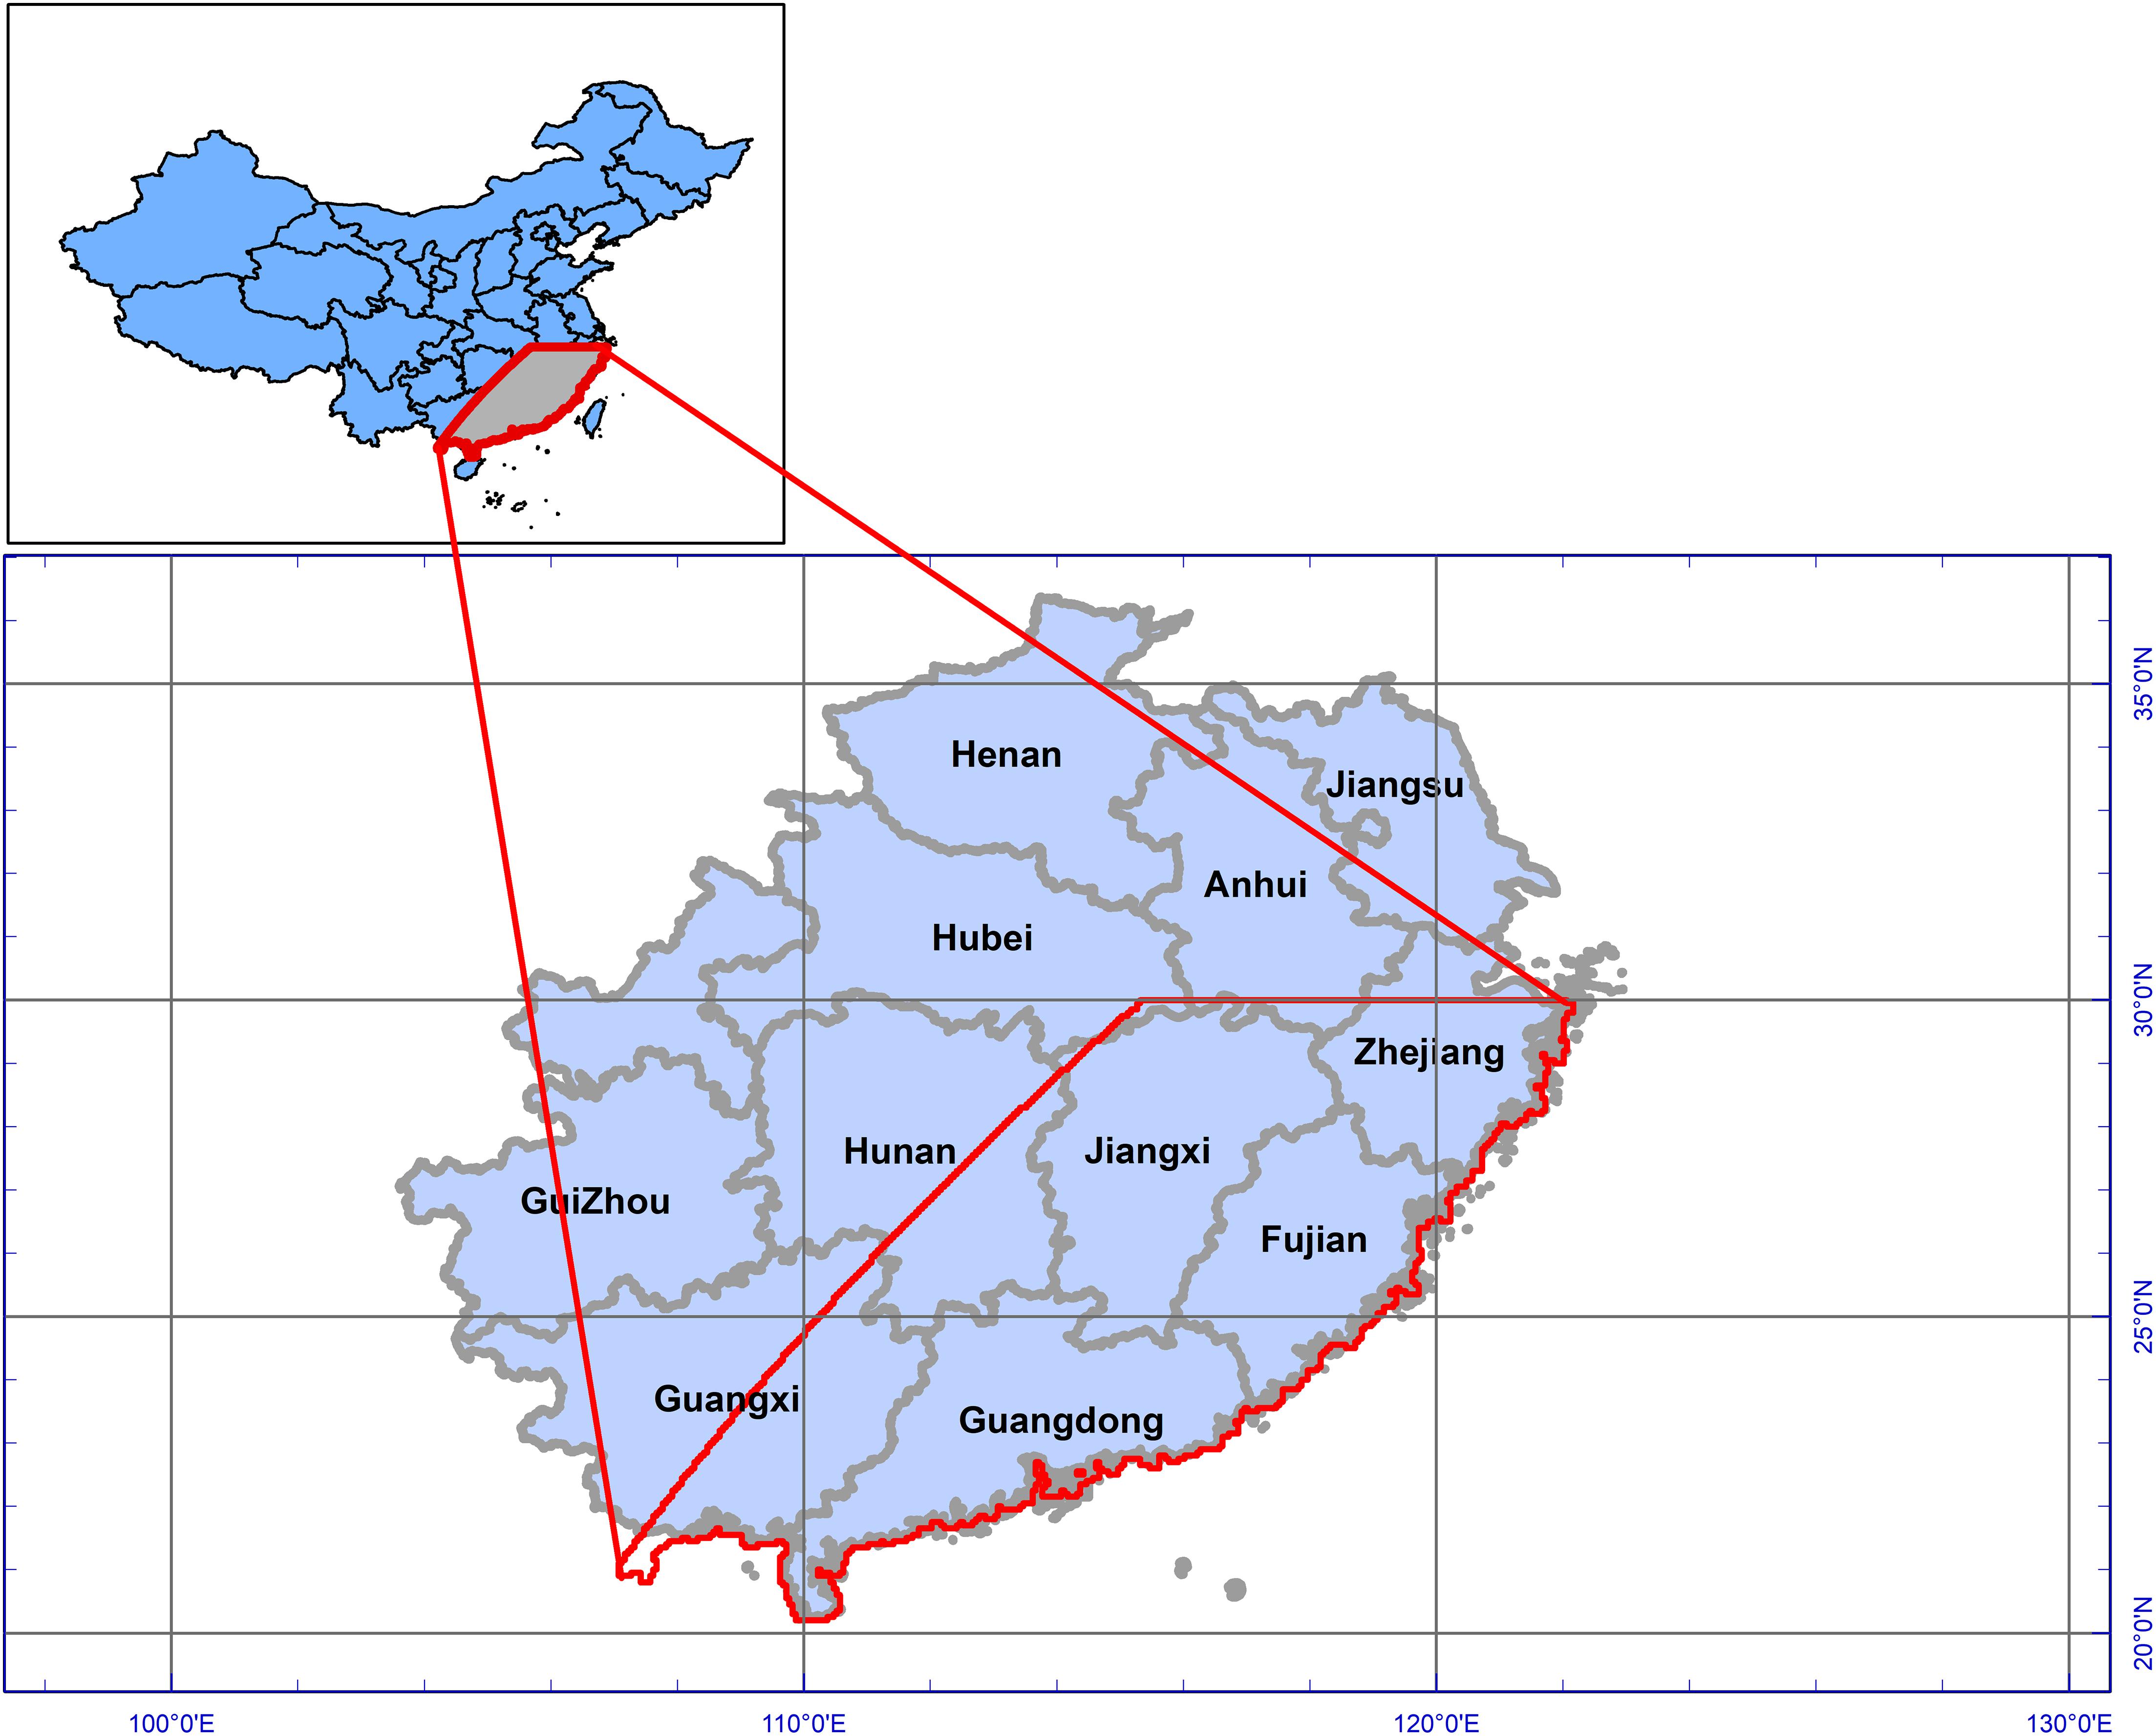
Figure 1. Study area, location, and administrative coverage of study area.
According to the International Geosphere-Biosphere Programme (IGBP) classification, the study area has dominantly three types of forests, north of the study area is dominated by mixed forests, which are generally a mix of the four forest community classes identified by the IGBP system, with none of the forest types exceeding 60% of the landscape.1 The southern parts of the study area are dominated by evergreen broadleaf forests. Woody savannas cover patches in the middle of the study area mostly surrounded by the other two forest types (Figure 2).
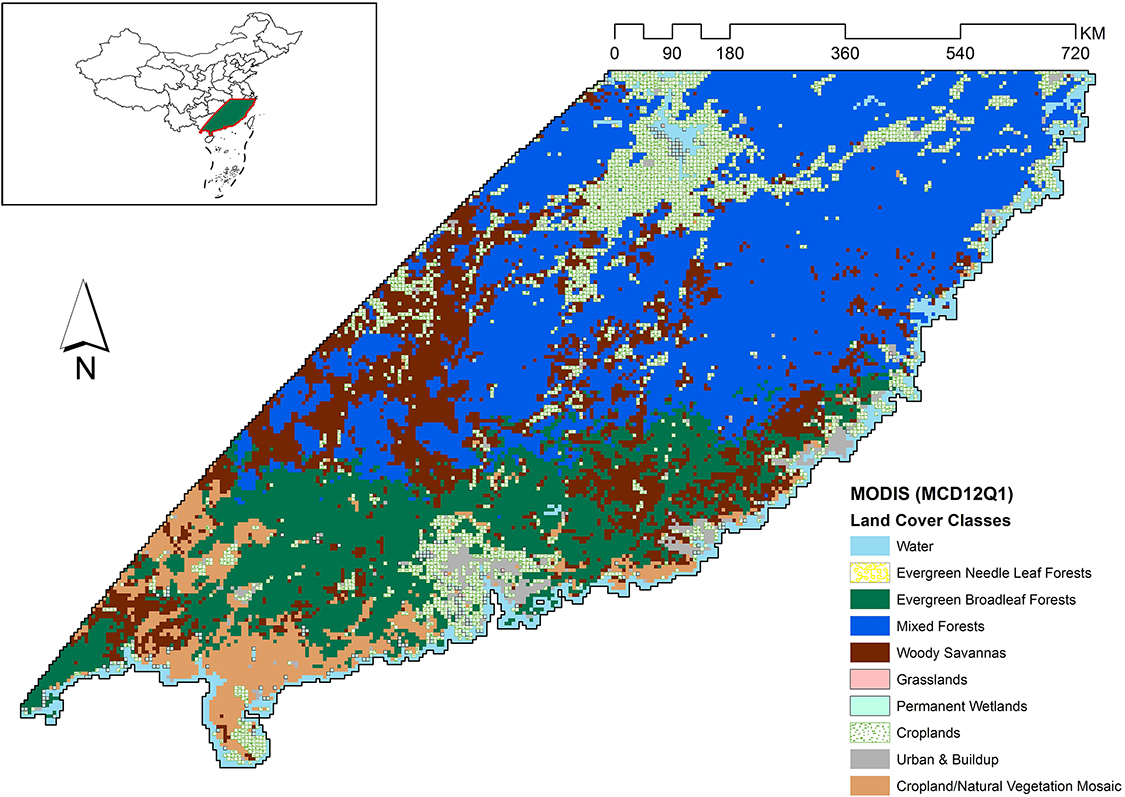
Figure 2. Vegetation zones in study area as defined by the MODIS MCD12Q1 product. The region is predominantly covered with mixed forests, followed by evergreen broadleaf forests, and woody savannas when considering natural vegetation.
The study area falls in the humid subtropical zone, with long warm summers with heavy rain and short mild winters with light rain. Based on the observations made from MODIS data in a previous study (Shirazi et al., 2017), annual precipitation is variable, while evapotranspiration and potential evapotranspiration are generally stable between the years. The winter season was observed to receive less and more variable precipitation in the region. Evapotranspiration and potential evapotranspiration exhibited cyclic behavior within a single year, with values highest during the summer season and reaching the lowest point in winter and rising again during spring. Dry conditions were observed to be prevalent during autumn and winter in south east of China. It was also observed that in the ET/pET ratio, evapotranspiration did not always respond to an increase in potential evapotranspiration, which suggested that during the non-fire seasons, the atmospheric demand of water is more effectively met compared to during the fire season and was observed to be one of the main causes of fire-prone conditions in the region.
Data Sources
A previous study (Shirazi et al., 2017) found a good correlation of fire frequency with moisture balance, precipitation, surface moisture balance, potential evapotranspiration, and the ratio between evapotranspiration and potential evapotranspiration in the SE region of China, during winter months, suggesting sensitivity of fire activity to the relationship between precipitation, evapotranspiration, and potential evapotranspiration. For this reason, these parameters with the addition of the normalized difference vegetation index (NDVI) (Yool, 2001; Bondur and Vorobev, 2015) were selected for this study. The estimation of these parameters using satellite platforms has successively improved over the years and provides the opportunity of a synoptic coverage allowing the monitoring of fire conditions.
All of the data used in this study were obtain from remote sensing sources. This study used moderate resolution imaging spectroradiometer (MODIS) and tropical rainfall measuring mission (TRMM) data products. The Terra and Aqua satellites carry MODIS instruments which observe the complete Earth surface approximately every 2 days2. MODIS has been a key instrument for studying different aspects of global terrestrial and oceanic processes due to its impressive 36-band spectral resolution. This study used MODIS’s evapotranspiration, potential evapotranspiration, NDVI (for vegetation conditions), and land cover products (for forest cover isolation). For precipitation, TRMM products were utilized. The TRMM satellite ended its data collection mission on April 15, 2015. However, it has produced a 17-year long precipitation dataset using a three-sensor rainfall suite (PR, TMI, and VIRS). The time period considered in this study was 2001–2014. The list of data products and the features used for the classification model and processing applied, if any, have been presented in Table 1.
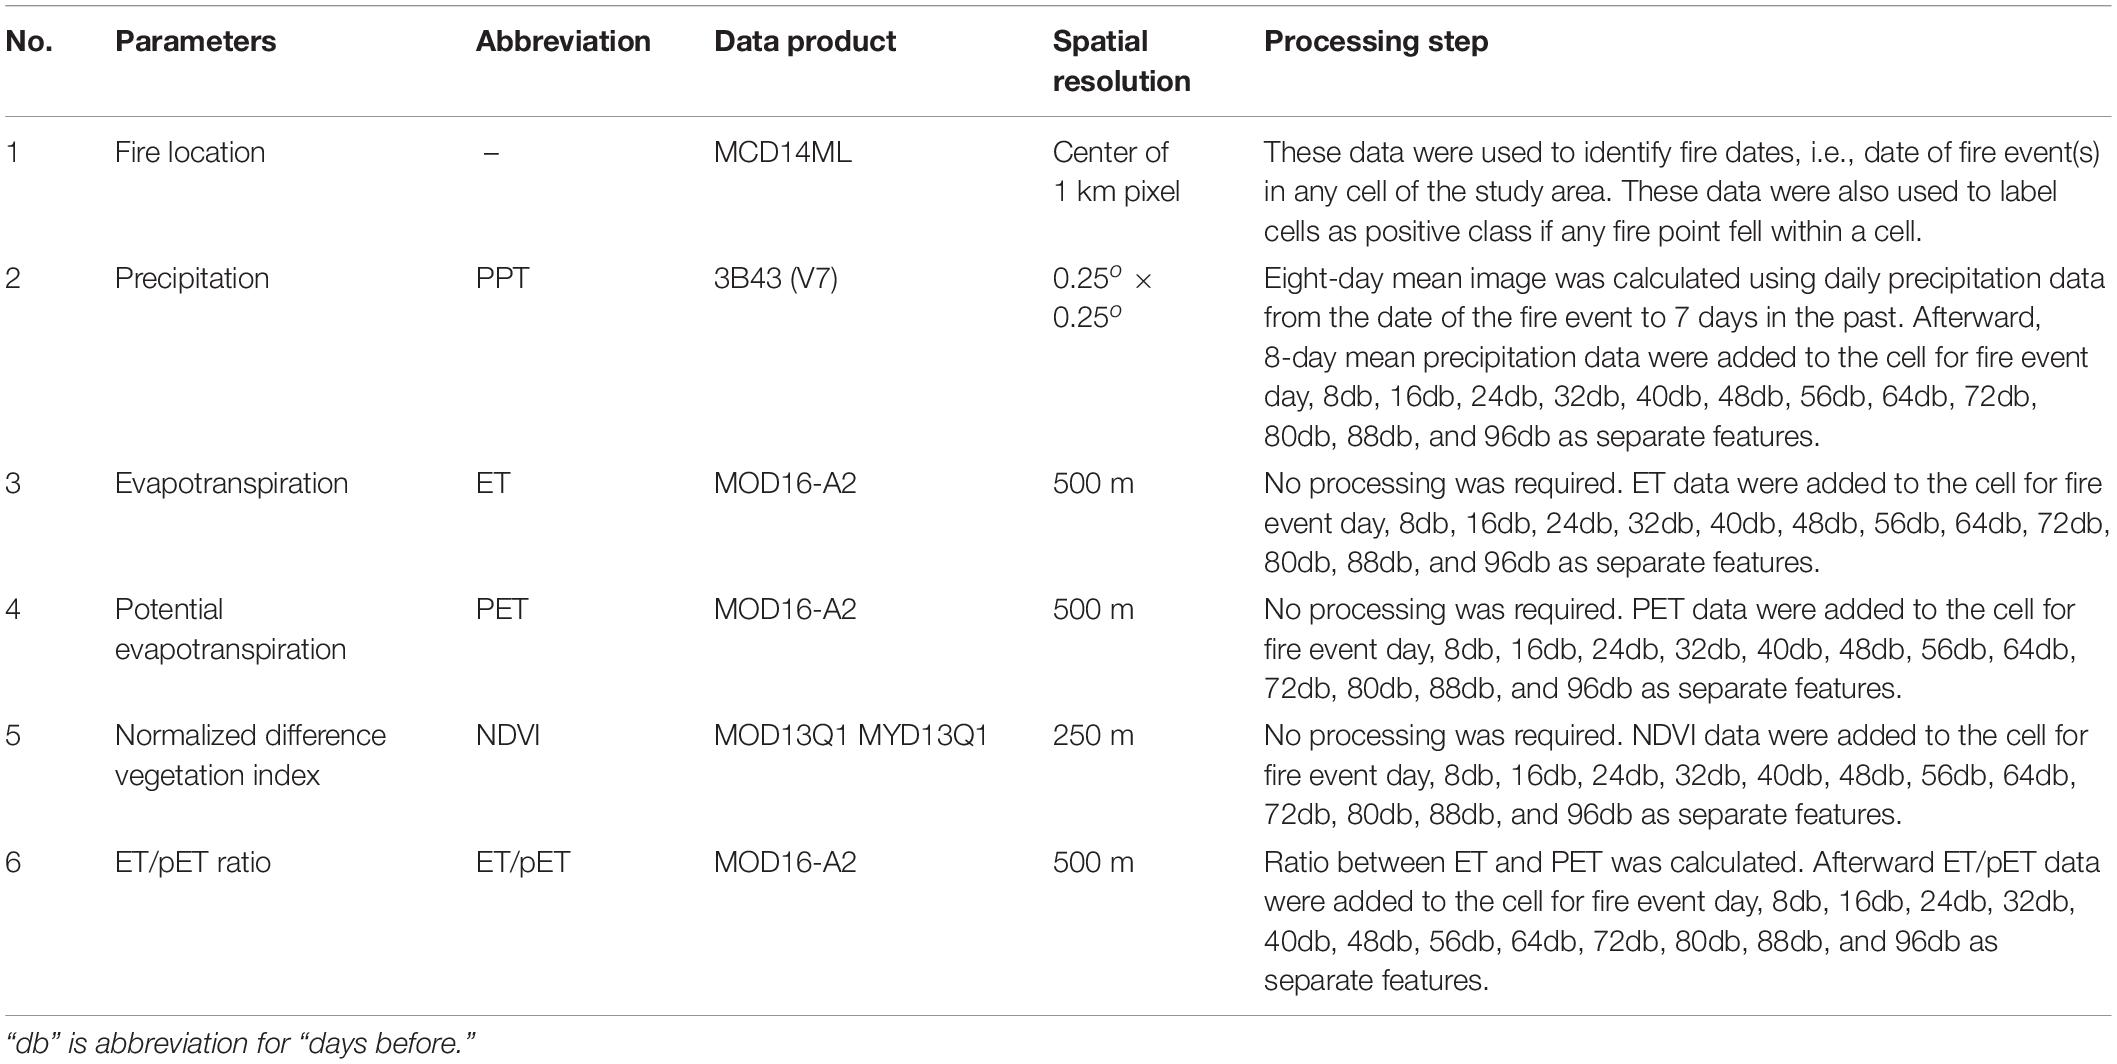
Table 1. Features used for fire risk classification model and processing involved.
Methodology
The aim of this exercise was to train support vector machine (SVM) models with fire and non-fire gird cells based on a time series of parameters and evaluate their performance on the test dataset for model evaluation. The time series of environmental parameters would allow for the mapping of changes within them before an individual fire event and possibly provide usable information for a machine learning algorithm to learn from these changes and classify unlabeled new grid cells as fire or non-fire grid cells. The methodology builds a database that can be updated/improved over time and provides the capability to classify conditions at grid cells, highlighting areas as fire risk or non-fire risk over the coming weeks using time series (presently sampled at an interval of eight days) of several climatic parameters.
Building a Grid File Database
As a first step, an empty grid file was created using the extent of the study area (Figure 2) for each date of the study period that had even a single fire event detected (MCD14ML fire location product) anywhere within the study area. Each grid file therefore represented the date of a single or a collection of fire events anywhere in the study area within the study period. The basic unit of this study was defined as a cell (a grid cell), with a spatial resolution of 250 m, which was the smallest uniform division of the study area (as can be visualized in Figure 2). Afterward, all grid files were populated with data for different environmental parameters (features) using the relevant remote sensing products (Table 1) by overlapping the grid file over the selected image and extracting data from the pixel corresponding to the center of the each cell in the grid file. For all environmental parameters, data were extracted from the images on the date of the fire event(s), for which the grid file was created (Eventd) and from images prior to the fire event, i.e., 8 days before (8db), 16 days before (16db), 24 days before (24db), 32 days before (32db), 40 days before (40db), 48 days before (48db), 56 days before (56db), 64 days before (64db), 72 days before (72db), 80 days before (80db), 88 days before (88db), and 96 days before (96db) the event day. In other words environmental parameters were sampled on every 8th day for 3 months on and prior to the fire event. The 8-day sampling was due to the minimum temporal resolution of the total dataset, i.e., the temporal resolution of MODIS data used. Each cell, within a grid file, therefore was a time series of different environmental parameters for the space it represented within the study area, extending from three months prior to the date of the fire event(s)/grid file. Similarly, each column in a grid file represented data extracted from a single image in the time series. Within each grid file, only the grid cells defined by evergreen broadleaf forest, mixed forests, and woody savannas land covers were used in the study and the remaining grid cells were left empty as only these three represented natural vegetative land cover within the study area. Hence, a database of 312 grid files, each containing approximately 27,256 grid cells, was created covering a period of 12 years (2003–2014).
Sampling Database
In each grid file of the database, there were two classes of grid cells, (1) grid cells with no fire information hence undefined, as either non-fire or fire, and remained unlabeled, (2) grid cells with at least one fire, as detected by MODIS’s MCD14ML data product. These were labeled as 1 which is generally termed as positive class. The unlabeled grid cells were not treated as non-fire grid cells (negative class) because the absence of a fire event does not imply that the conditions in a particular cell were not fire-prone. It is comprehensible that the difference between a fire and an unlabeled cell might simply be the absence of an ignition source. Therefore, the first priority was to identify reliable non-fire grid cells from the set of unlabeled grid cells of all grid files.
Since all grid files in the database represented the same geographical space, a unified input was desirable for model training so that the grid cells, both positive and negative class examples, at different temporal intervals of the study period could be used to train the machine learning algorithm. Furthermore a single condensed dataset allowed for a simpler implementation of the model. However, it would have been computationally infeasible to process a large dataset formed by combining all the grid files together. Therefore a sampling technique was needed with two objectives, (1) to filter interesting grid cells for data analysis to minimize the loss of valuable data records and, (2) create a single dataset for efficient and simplified implementations of the machine learning algorithm.
Furthermore, it was also necessary to balance the two classes before training the machine learning model, as a model might simply demonstrate higher predictive accuracy by misclassifying all instances in the input dataset as belonging to the majority class. At a data level, there are generally two methods more commonly used in re-sampling datasets, random under-sampling and random oversampling (Chen, 2009). Under-sampling reduces the majority class, which in our study are the unlabeled grid cells, whereas the oversampling technique increases the minority class which in our case are the fire grid cells. The random oversampling technique for the current dataset is infeasible because of the huge imbalance between the majority and minority samples, furthermore the size of the data is already an issue; the simple oversampling technique would make data management more complicated. The random under-sampling technique on the other hand risks the loss of valuable data records that may affect the performance of the models. Another technique is the hybrid approach in which both under-sampling and oversampling techniques are employed, which has be observed to have better performance in the ROC (receiver operator characteristics) space (Chawla et al., 2002).
Initially, before sampling each grid file, outliers were removed using the isolation forest model. To achieve the sampling objectives, a hybrid approach was adopted, by initially applying majority under-sampling using criteria-based selection of records, as opposed to random sampling. The criteria-based sampling technique applied in this study allowed identification of the likely non-fire grid cells by sampling of unlabeled data with a bias toward finding non-fire samples. Previous literature has identified that class overlap adds to the difficulty of classifying imbalanced datasets and have proposed several methods that use the proximity to positive instances as a means to remove overlapping negative instances (Vuttipittayamongkol and Elyan, 2020). However, since at this stage the entire dataset was divided into different grid files, therefore the volume and structure of the dataset prevented the adoption of a similar methodology.
In a multi-dimension feature data space, defined by features that have a direct proportional relation with fire, and with the understanding that lower values of these features make conditions feasible for a fire event in the case of an ignition event, it is understandable that all the fire points should lie closer to the lower values or the origin of the data space. Therefore, it is logical to assume that the data points that are at farther away from the origin as compared to the known fire points are likely non-fire data points. Learning from the cluster-based majority under-sampling prediction (CBMP) technique (Zhang et al., 2010), each cell in each grid file was plotted in a Euclidean space defined by PPT, NDVI, MB, and ET/pET ratio on “the day of the fire event” (Eventd) because these are the features that have a proportional correlation with fire. An increase or a decrease in these parameters would likely result in an increase or decrease in fire risk, respectively. A fire threshold was then defined, which was the mean Euclidean distance of fire points from the minimum cell value within each individual grid file. Unlabeled grid cells beyond this fire threshold were more likely to be non-fire grid cells with increasing probability as distance increased. Unlabeled grid cells, 10 times the number of fire cells in each individual grid file, were sampled beyond this threshold, with a bias toward selecting grid cells at a greater distance from the fire threshold, for each land cover and allowed for removing overlapping negative examples from within each grid file. All of the grid cells that were labeled as fire grid cells were selected without any sampling as they were the minority positive class in each file.
The collective sampled unlabeled grid cells beyond the fire threshold and fire-labeled grid cells from all grid files were then combined into a single data file. The features that were used in this process were removed from the times series to avoid any bias in the future model. Two files were created from this process, all grid cells sampled (fire and unlabeled) from 2003 to 2011 were combined into a single preliminary training file and all the grid cells sampled (fire and unlabeled) from 2012 to 2014 were combined into a single test file. Both of these files still had class imbalance but a reduced number of unlabeled grid cells which were likely non-fire. The training file had a total of 84,033 records, with 82,351 unlabeled and 1,682 positive-labeled records for all land covers combined. The test data had a total of 9,078 records with 8,900 unlabeled and 178 positive-labeled examples for all land covers combined.
Identifying Reliable Non-fire Grids
Afterward, a PU learning technique was implemented to identify reliable non-fire grid cells from the set of the likely non-fire grid cells in the training file. Afterward, a PU learning technique was implemented (Figure 3) to identify reliable non-fire grid cells from the set of the likely non-fire grid cells in the training file. Mordelet and Vert (2014). For PU learning, a number (K) of models were trained for each land cover on K subsets of training data. These subsets were constructed with all the fire grid cells and an equal number of randomly sampled unlabeled grid cells (with replacement). The model was then tested on the remaining dataset and combined using the majority voting technique (Figure 4). For this study K was set to 1,000. Afterward, the percentage of each cell was calculated for the number of times it was classified as non-fire out of a total of K times. If the percentage was equal to or greater than 95, then the grid cells were sampled from each land cover along with all the grid cells labeled as fire and were combined into an updated new final training dataset, with unlabeled records now considered as reliable negatives and labeled as ‘0’ or as non-fire class examples. This training file had 21,369 records labeled as non-fire and 1,682 records labeled as fire for all land covers combined. The same process was repeated for the test file as well. This test file had 1,766 records labeled as non-fire and 178 records labeled as fire for all land covers combined.
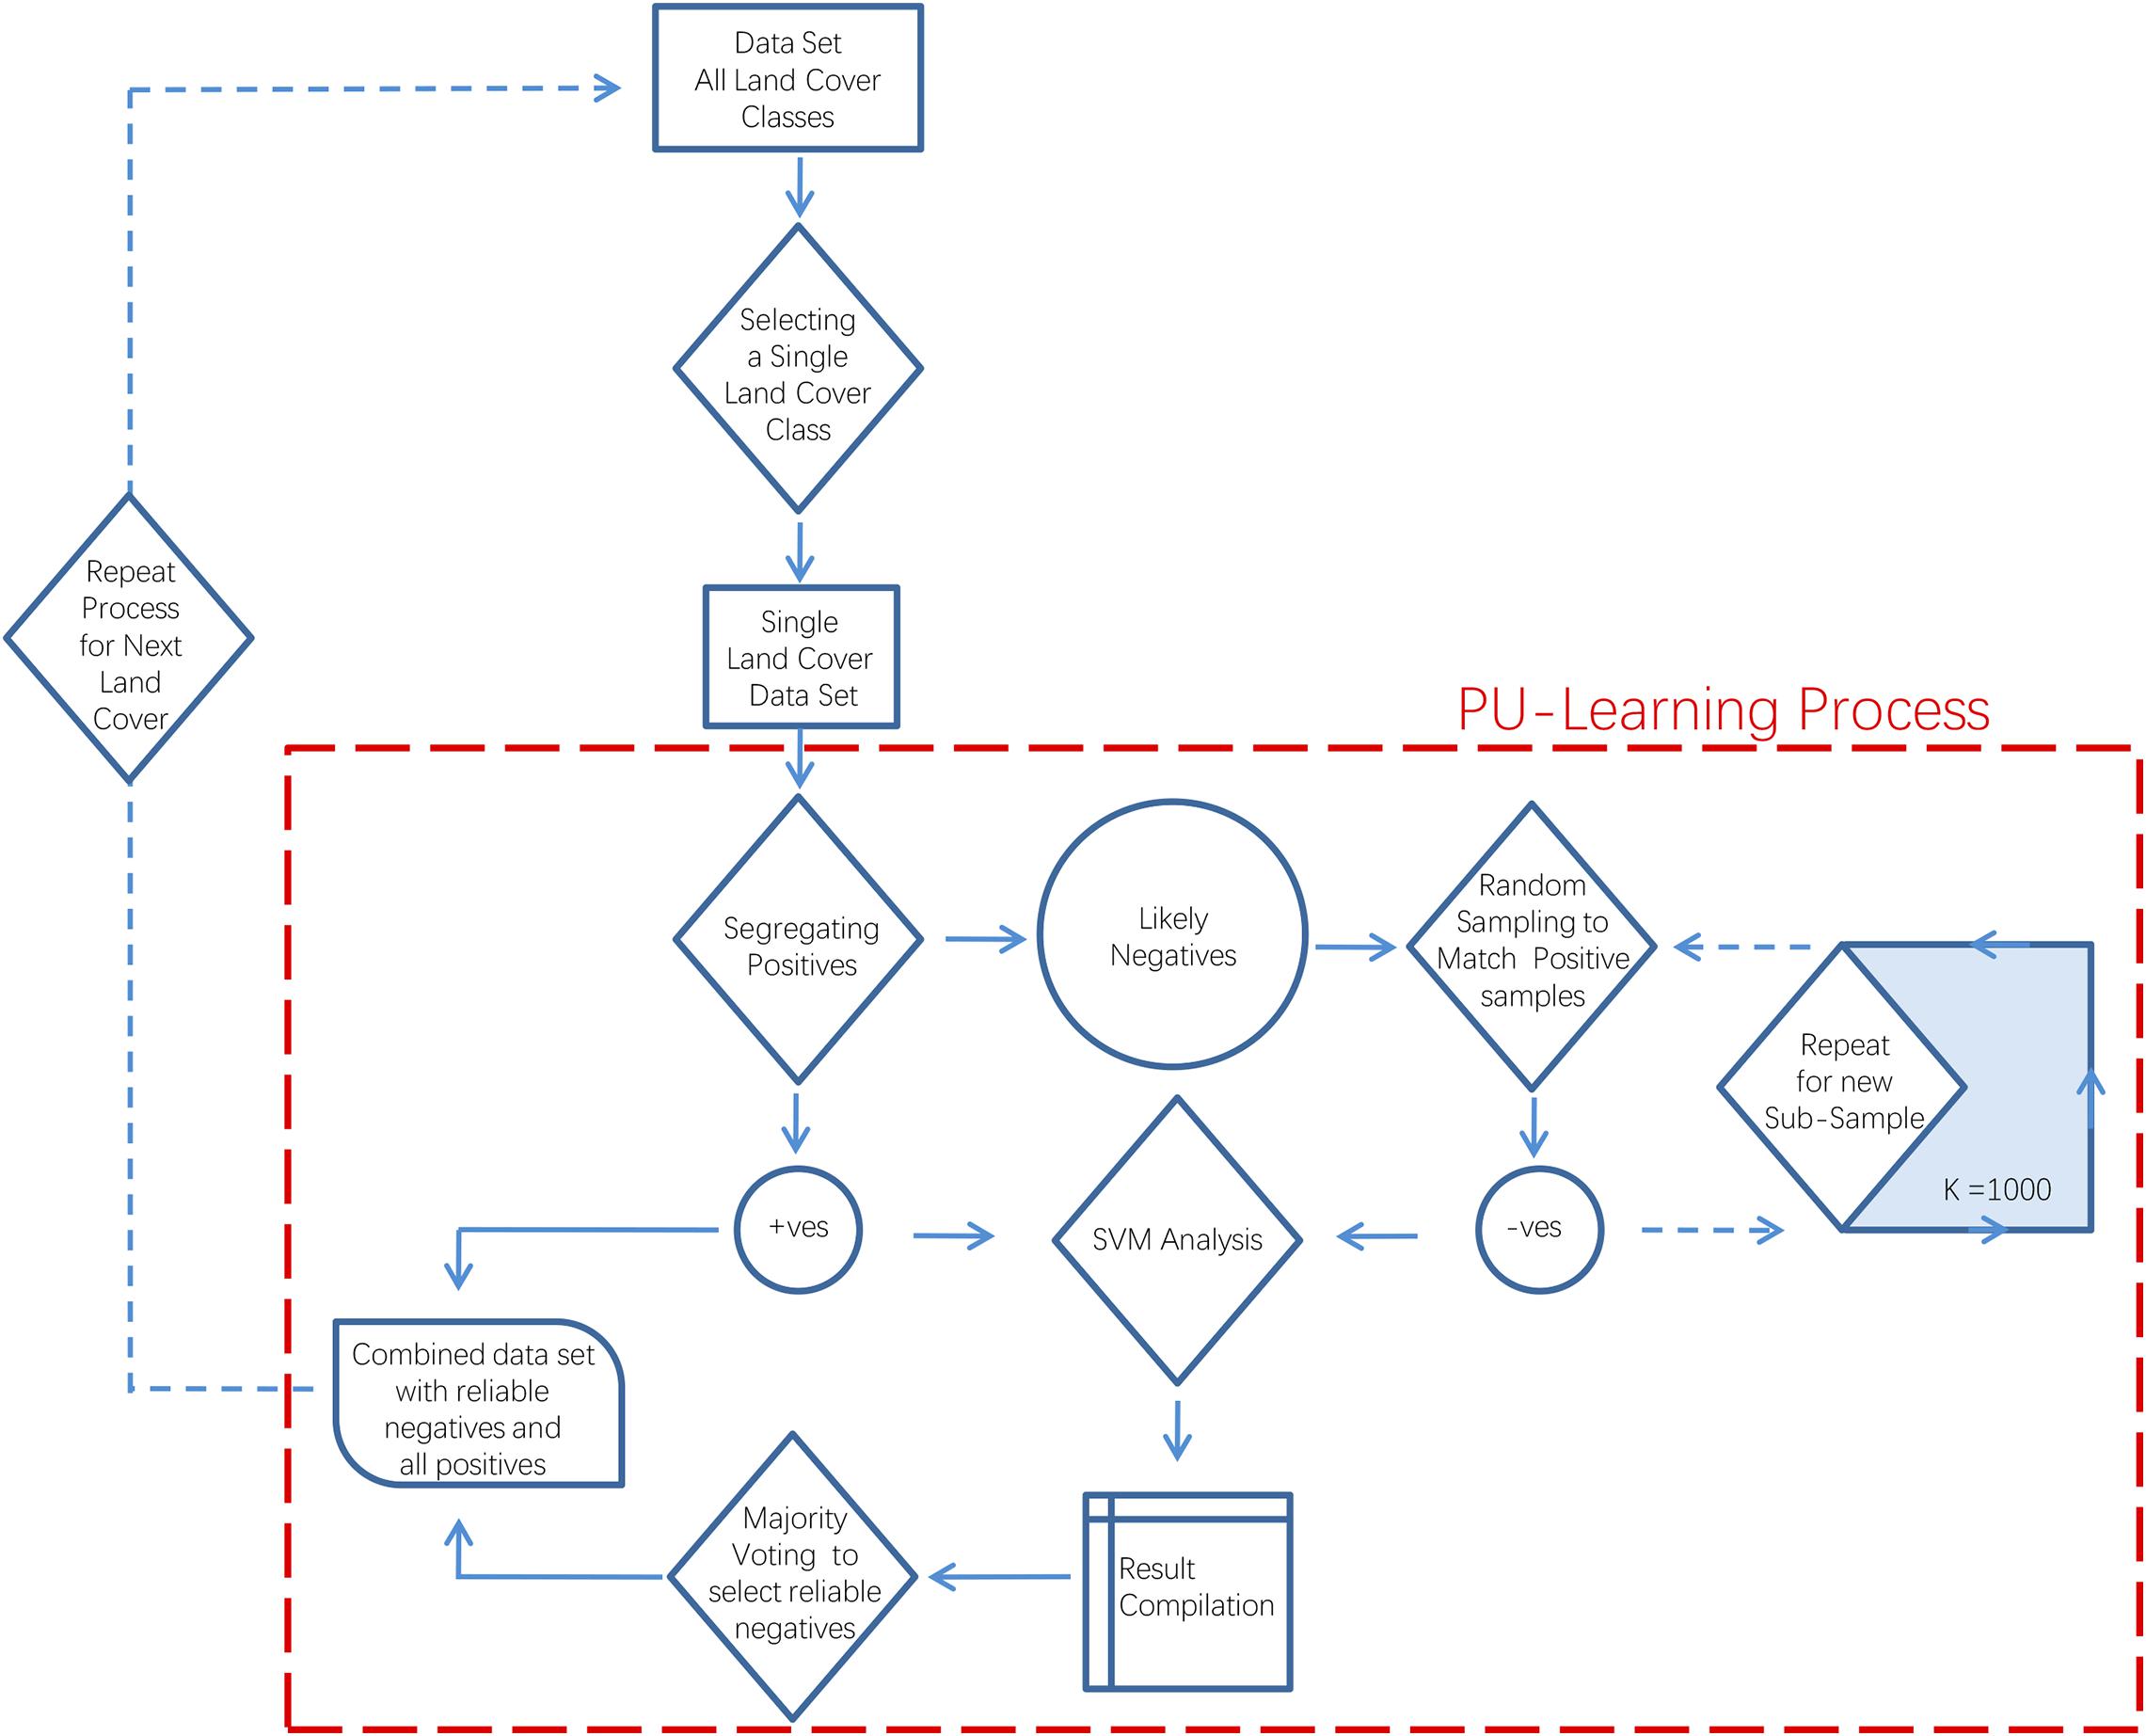
Figure 3. The PU learning process.
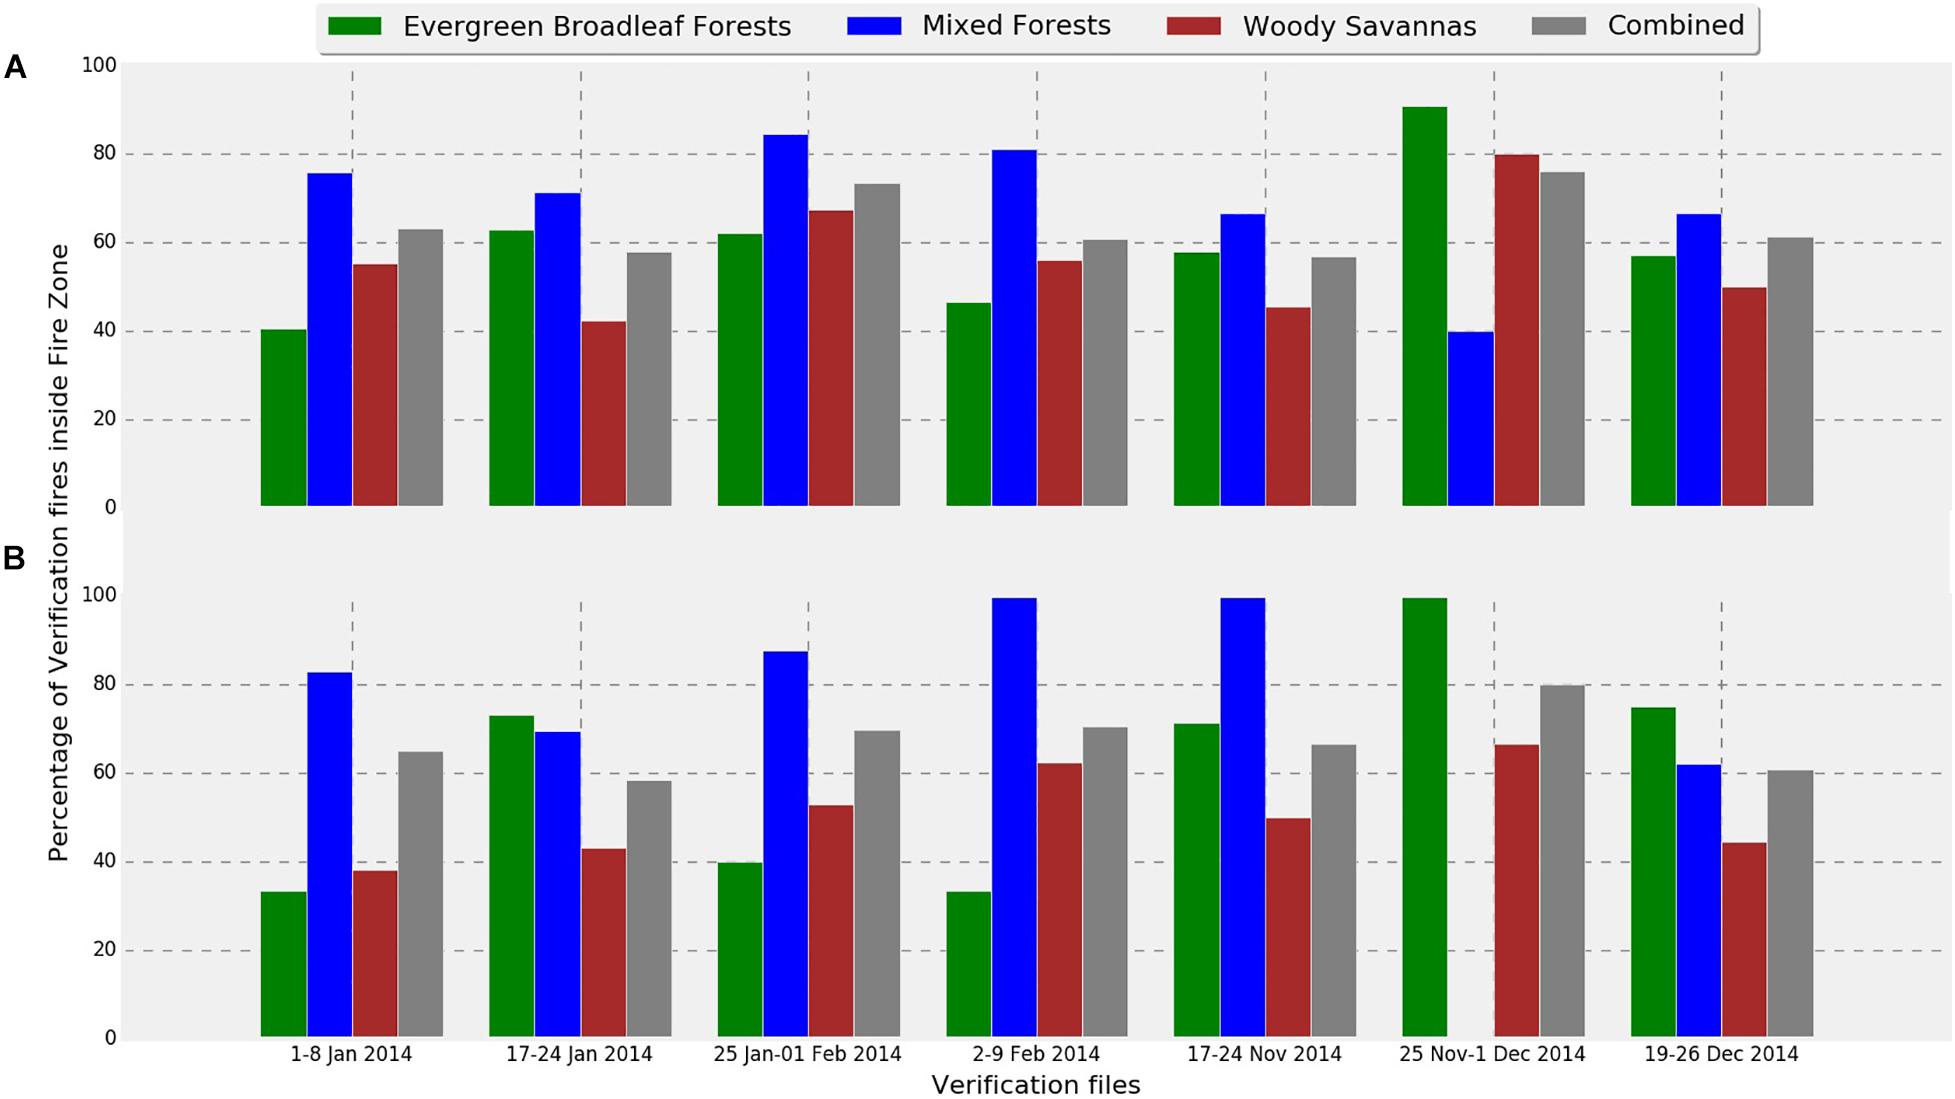
Figure 4. Verification results of models for each of the three land covers. “Combined” refers to the collective percentage of verification fires in all the three land covers studied. (A) Fires with low confidence level (>80%), and (B) fires with higher confidence level (>95%).
Training Supervised Machine Learning Algorithm
The training and test files both had a total of 65 features. Before training, model feature selection was carried out by applying a two-fold cross validation loop for SVM on the training dataset. For this purpose, recursive features elimination using a linear SVM kernel was employed. The features identified are presented in Table 2. Different models (a total of 3) were trained for different land covers using the relevant features identified. After the data preprocessing and preparation steps, the final training datasets were used to train SVM models for each of the land covers using Scikit-learn’s implementation of the SVC (support vector classification) algorithm in the Python programming environment. Since, the training datasets had class imbalance and SVM requires a balanced dataset as an input, therefore, a minority oversampling technique called synthetic minority over-sampling technique (SMOTE) was incorporated in the final model.
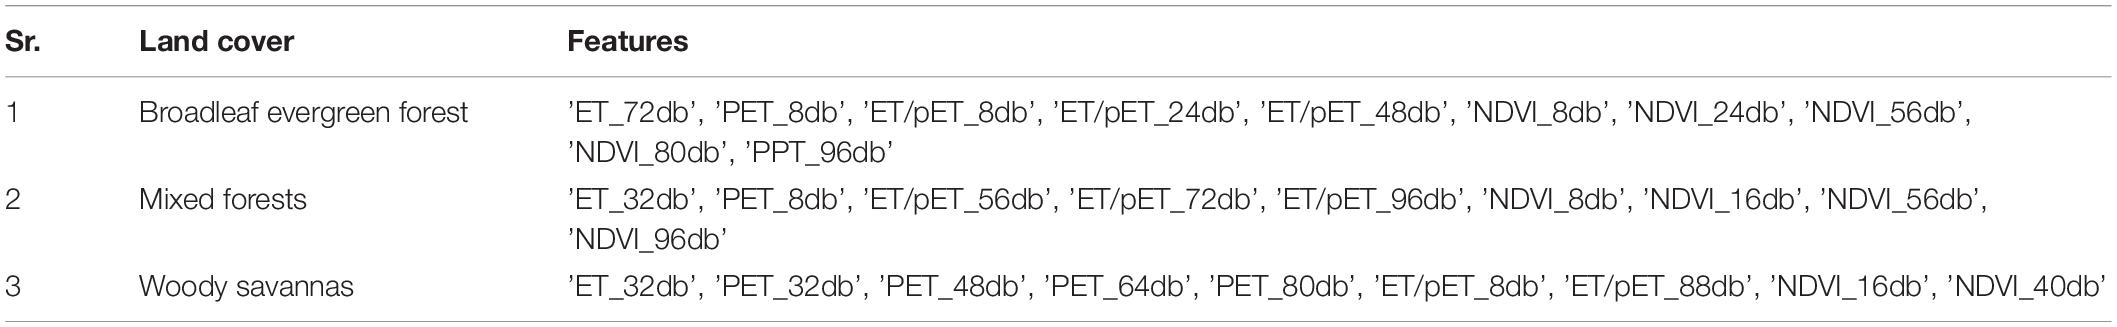
Table 2. Features selected.
Testing and Implementation of SVM Model
Since the SMOTE model was incorporated in the training phase of the model, therefore the training and testing process was carried out iteratively 10 times so that the randomness introduced as a result of SMOTE analysis could be reduced. Average results of the model metrics (e1–e6) have been presented in Table 3 for a total of 10 iterations for each land cover in the test dataset. After training and testing of the machine learning models, their performance was verified to assess their predictive ability in real-world implementation. For this purpose a total of seven grid files (verification grid files) were selected from the year 2014. These files were selected from the months of November to February which usually constitute the fire season in the study area. These verification grid files were then classified using the same model parameters selected during the training and testing stages. The classification results were then verified using a set of verification fires. Verification fires were fire event locations from MODIS’s MCD14ML data product on the date of the verification grid files and seven days in the future from that date (fires locations for a period of eight days from the date of the verification grids file). So verification was a two-step process, (1) classify verification grid files into fire and non-fire grid cells using the model trained and, (2) overlay relevant verification fires on top of respective verification grid files and evaluate the performance of the model on the basis of the number of verification fires falling in the correct fire class.
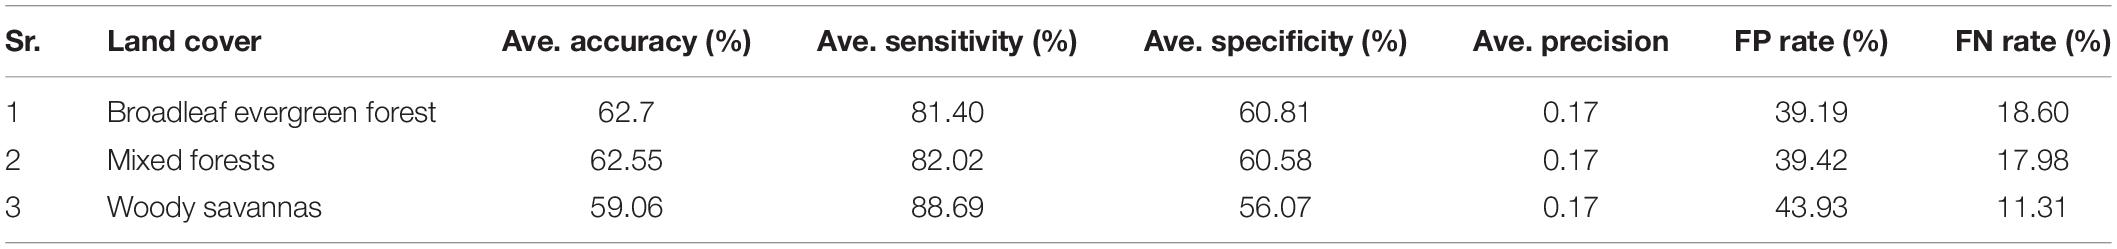
Table 3. Accuracy metrics for models (test dataset).
Model Evaluation on Test Dataset
Table 3 gives a detailed report of the performance of different models for different land covers across various evaluation metrics (e1–e6). None of the models performed well with accuracy and precision metrics, however, sensitivity showed that all models could identify the majority of fires in the test dataset. Low precision and accuracy were expected as negative examples used in the test dataset were not true negatives and were only identified as reliable negatives using a fire threshold and the PU learning process. The presence of grid cells labeled as negatives in the test dataset that were similar to the fire grid cells led to a large number of false positives and overall reduced accuracy and also lower precision. The false positive (FP) rate was very high suggesting that close to half of the non-fire grid cells in test set were similar to fire grid cells in the training dataset. Whereas the false negative (FN) rate was very low, suggesting that the majority of the fire grid cells were correctly classified. These results suggest that the models can classify fire grid cells with a bias toward sensitivity.
Results and Discussion
Figure 4 provide the verification results of models for each of the three land covers, while Figure Figure 5 focuses on the model performance for mixed forest land cover. Figures 6–12 provide the overall results of the classification and the location of the verification fires.
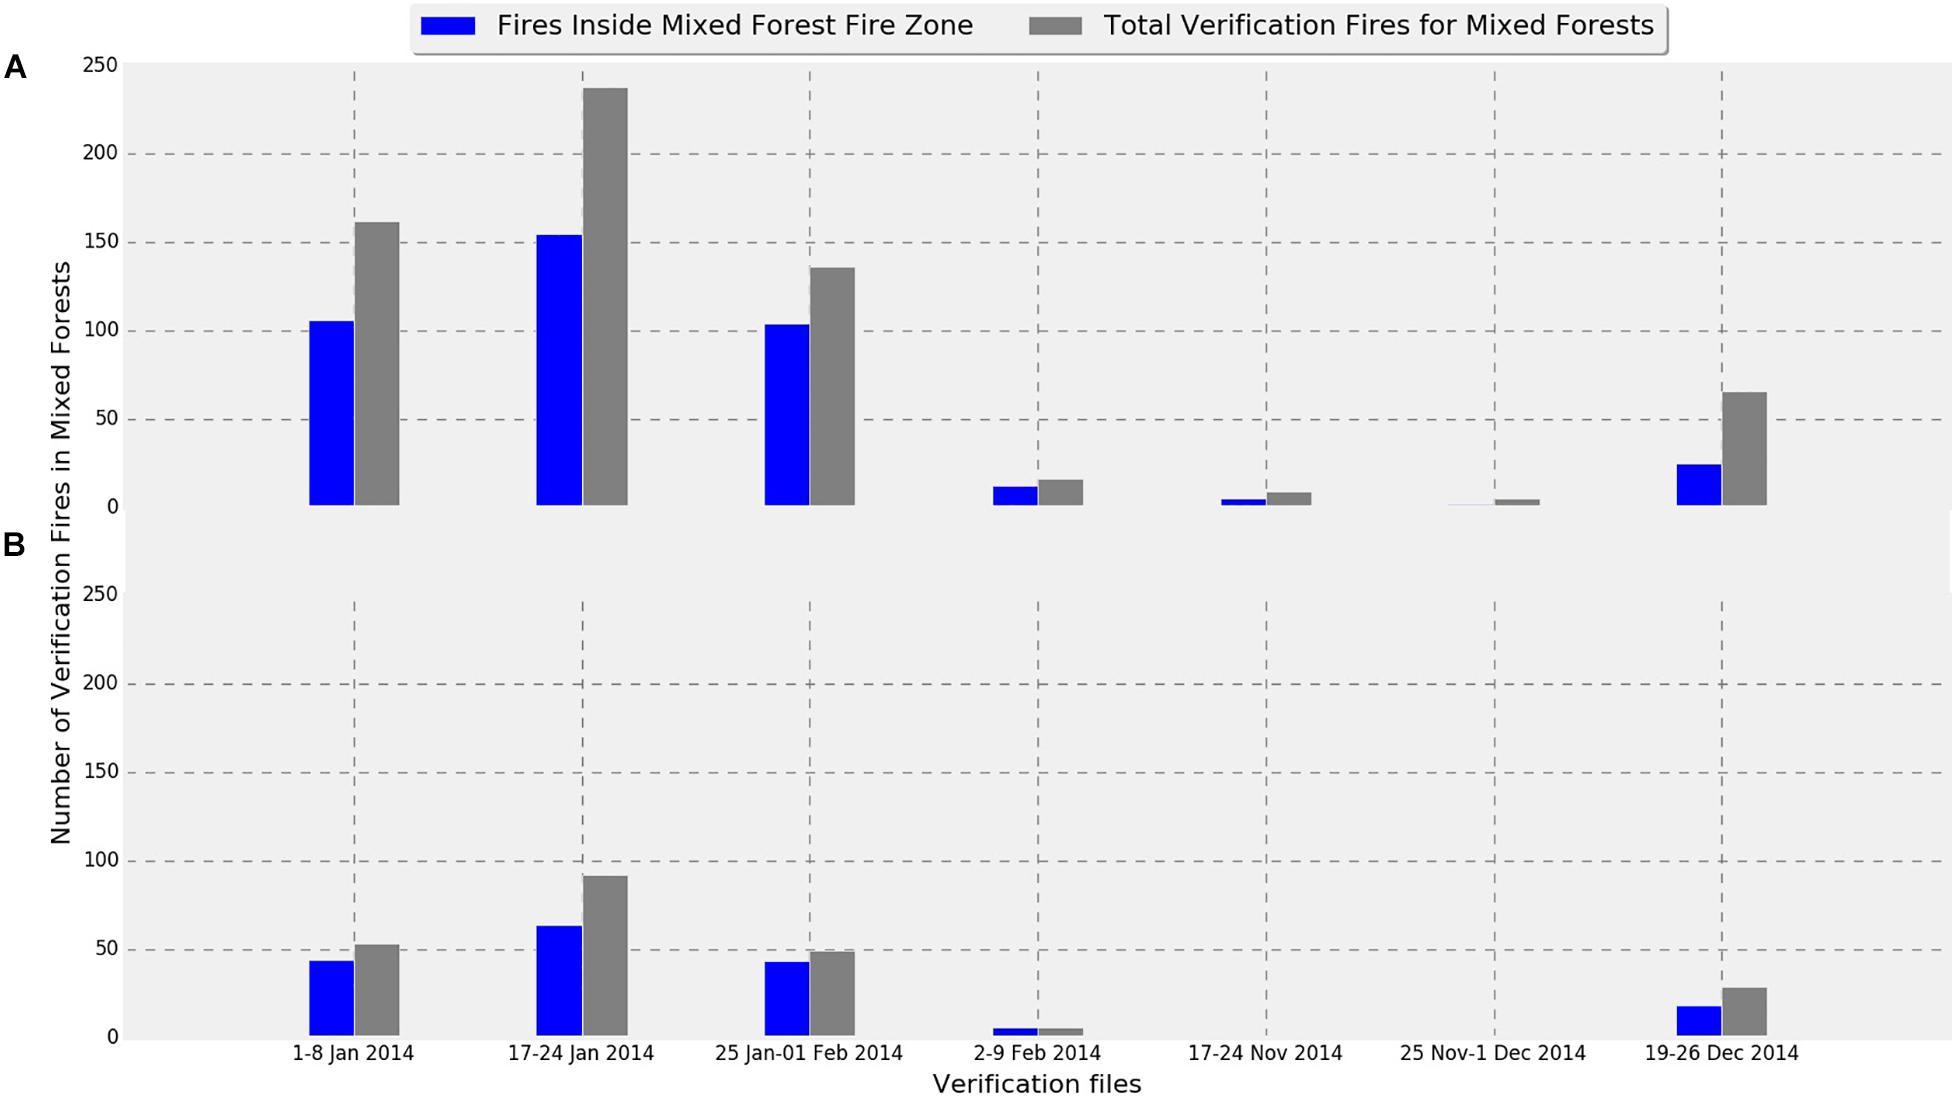
Figure 5. Verification fire distribution in the mixed forest land cover compared to the verification fire falling in the fire zone. (A) Fires with low confidence level (>80%), and (B) fires with higher confidence level (>95%).
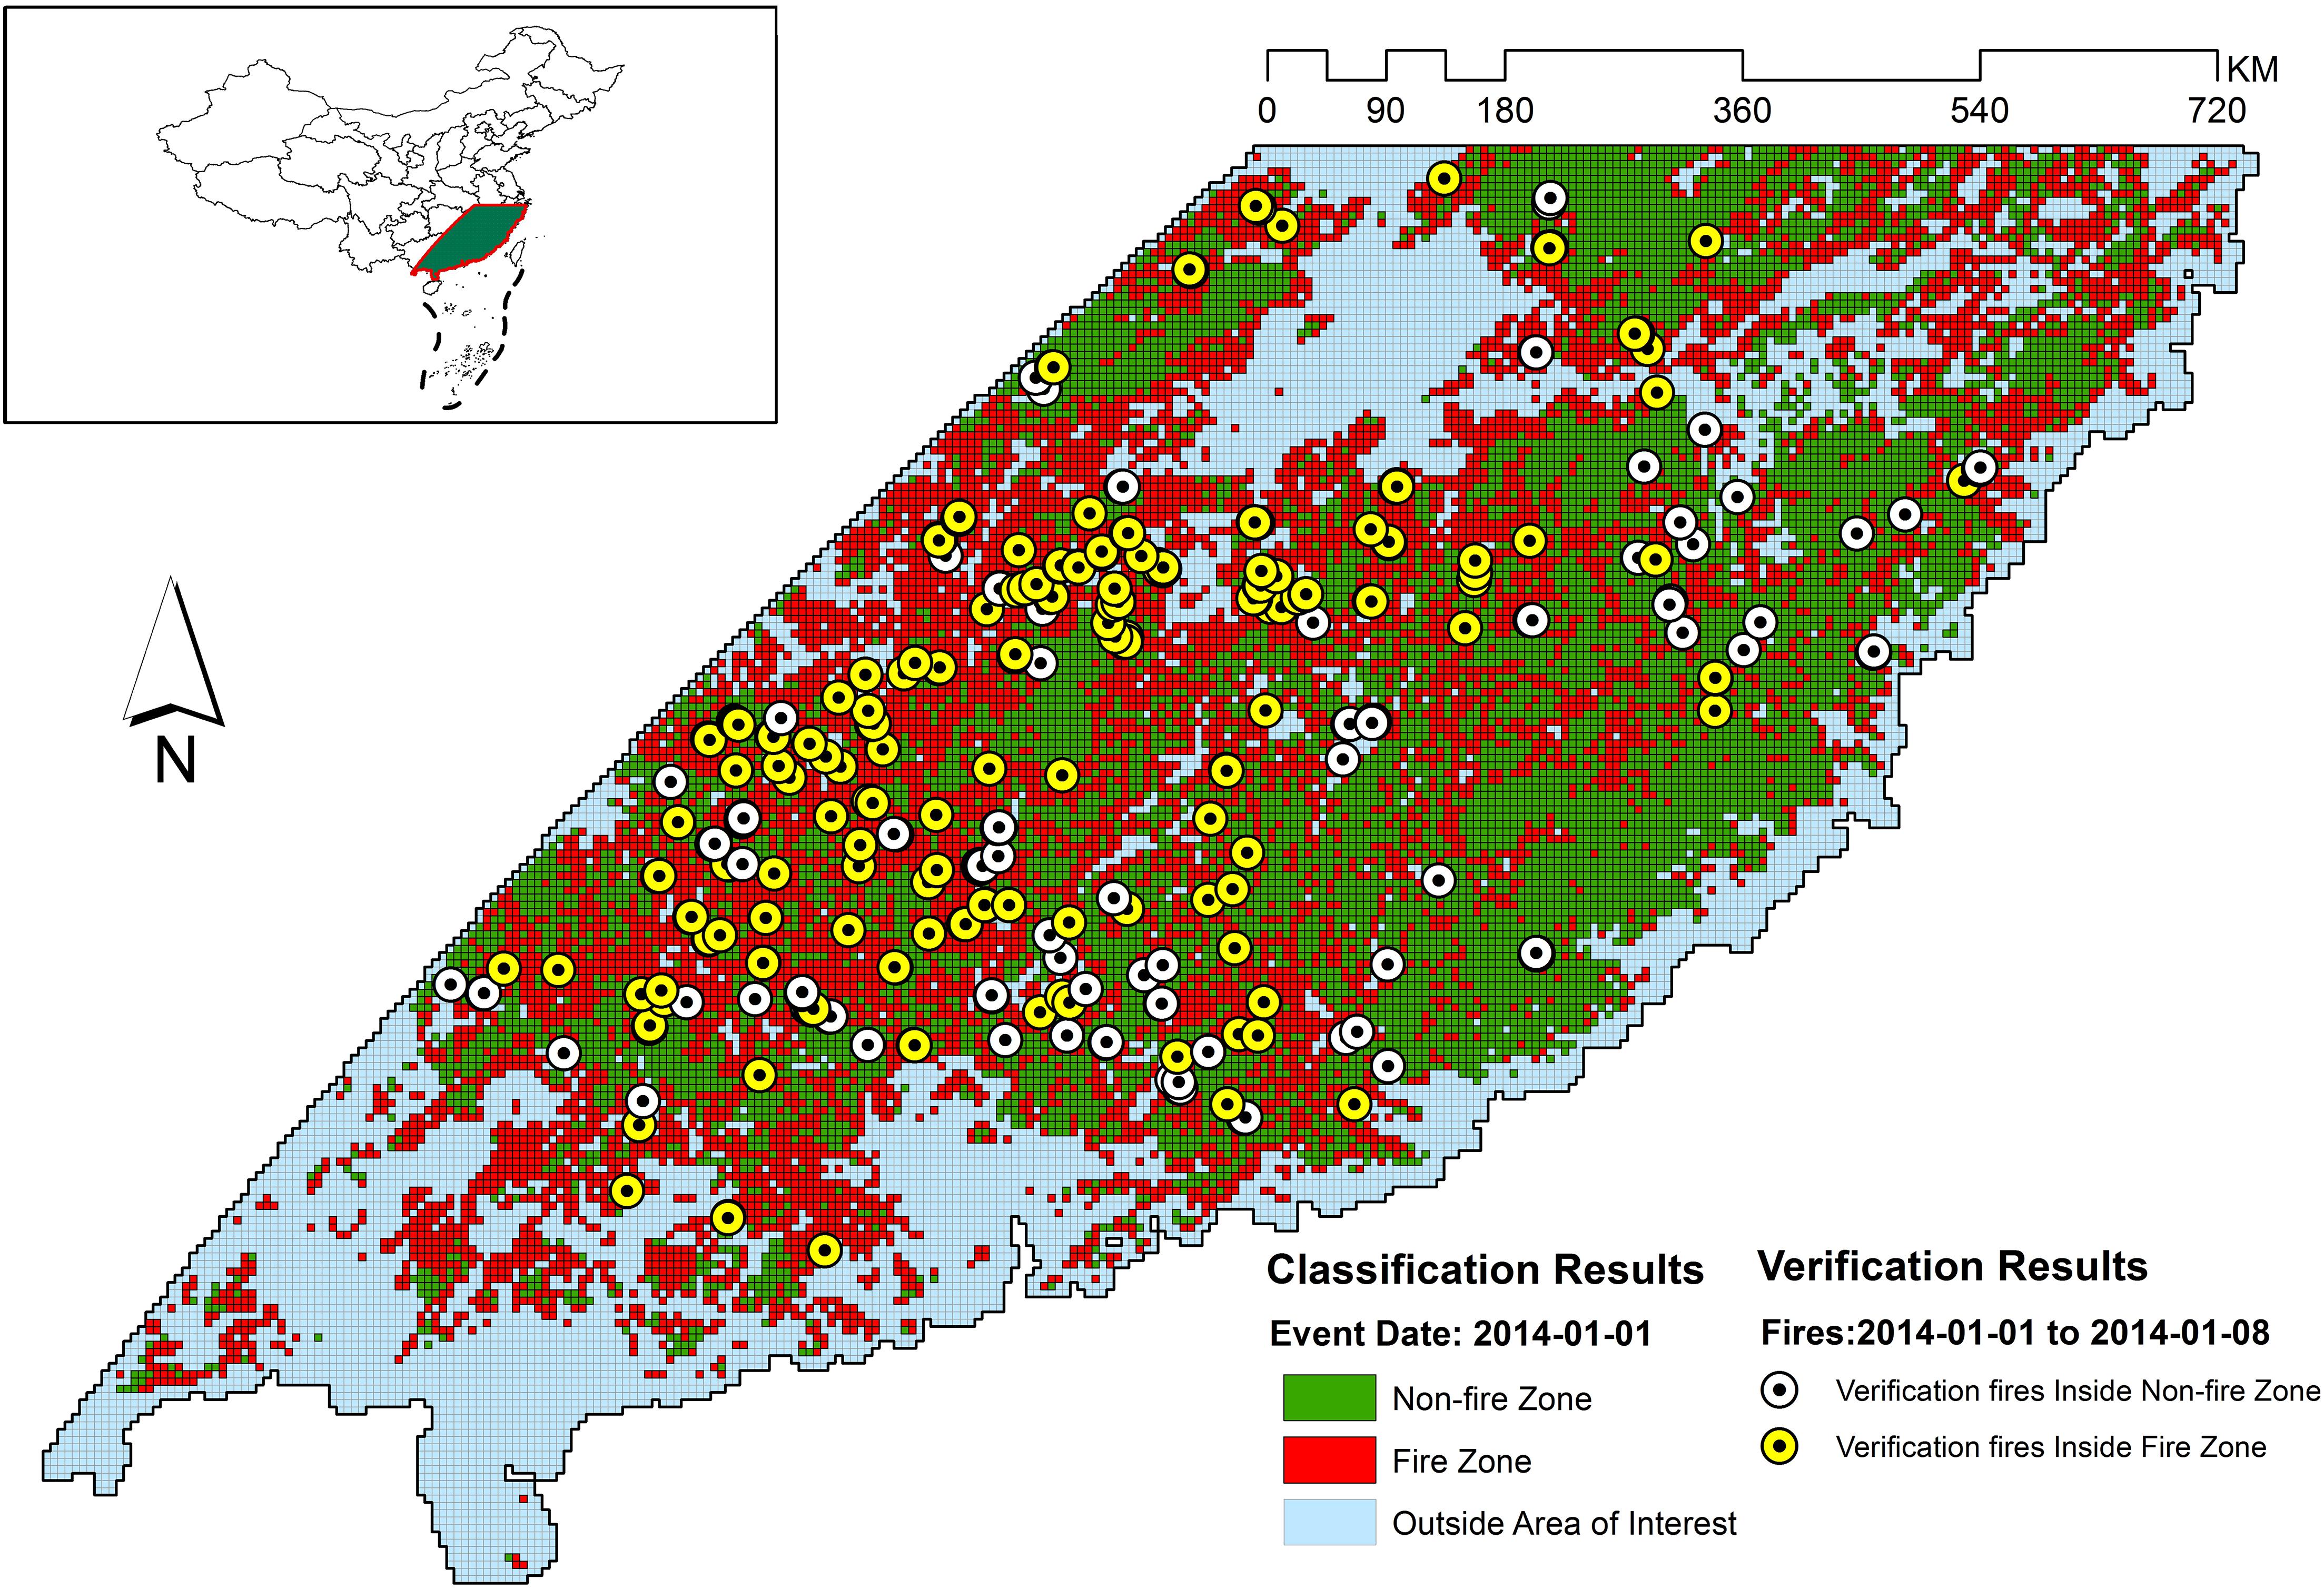
Figure 6. Classification and verification results for 2014-01-01.
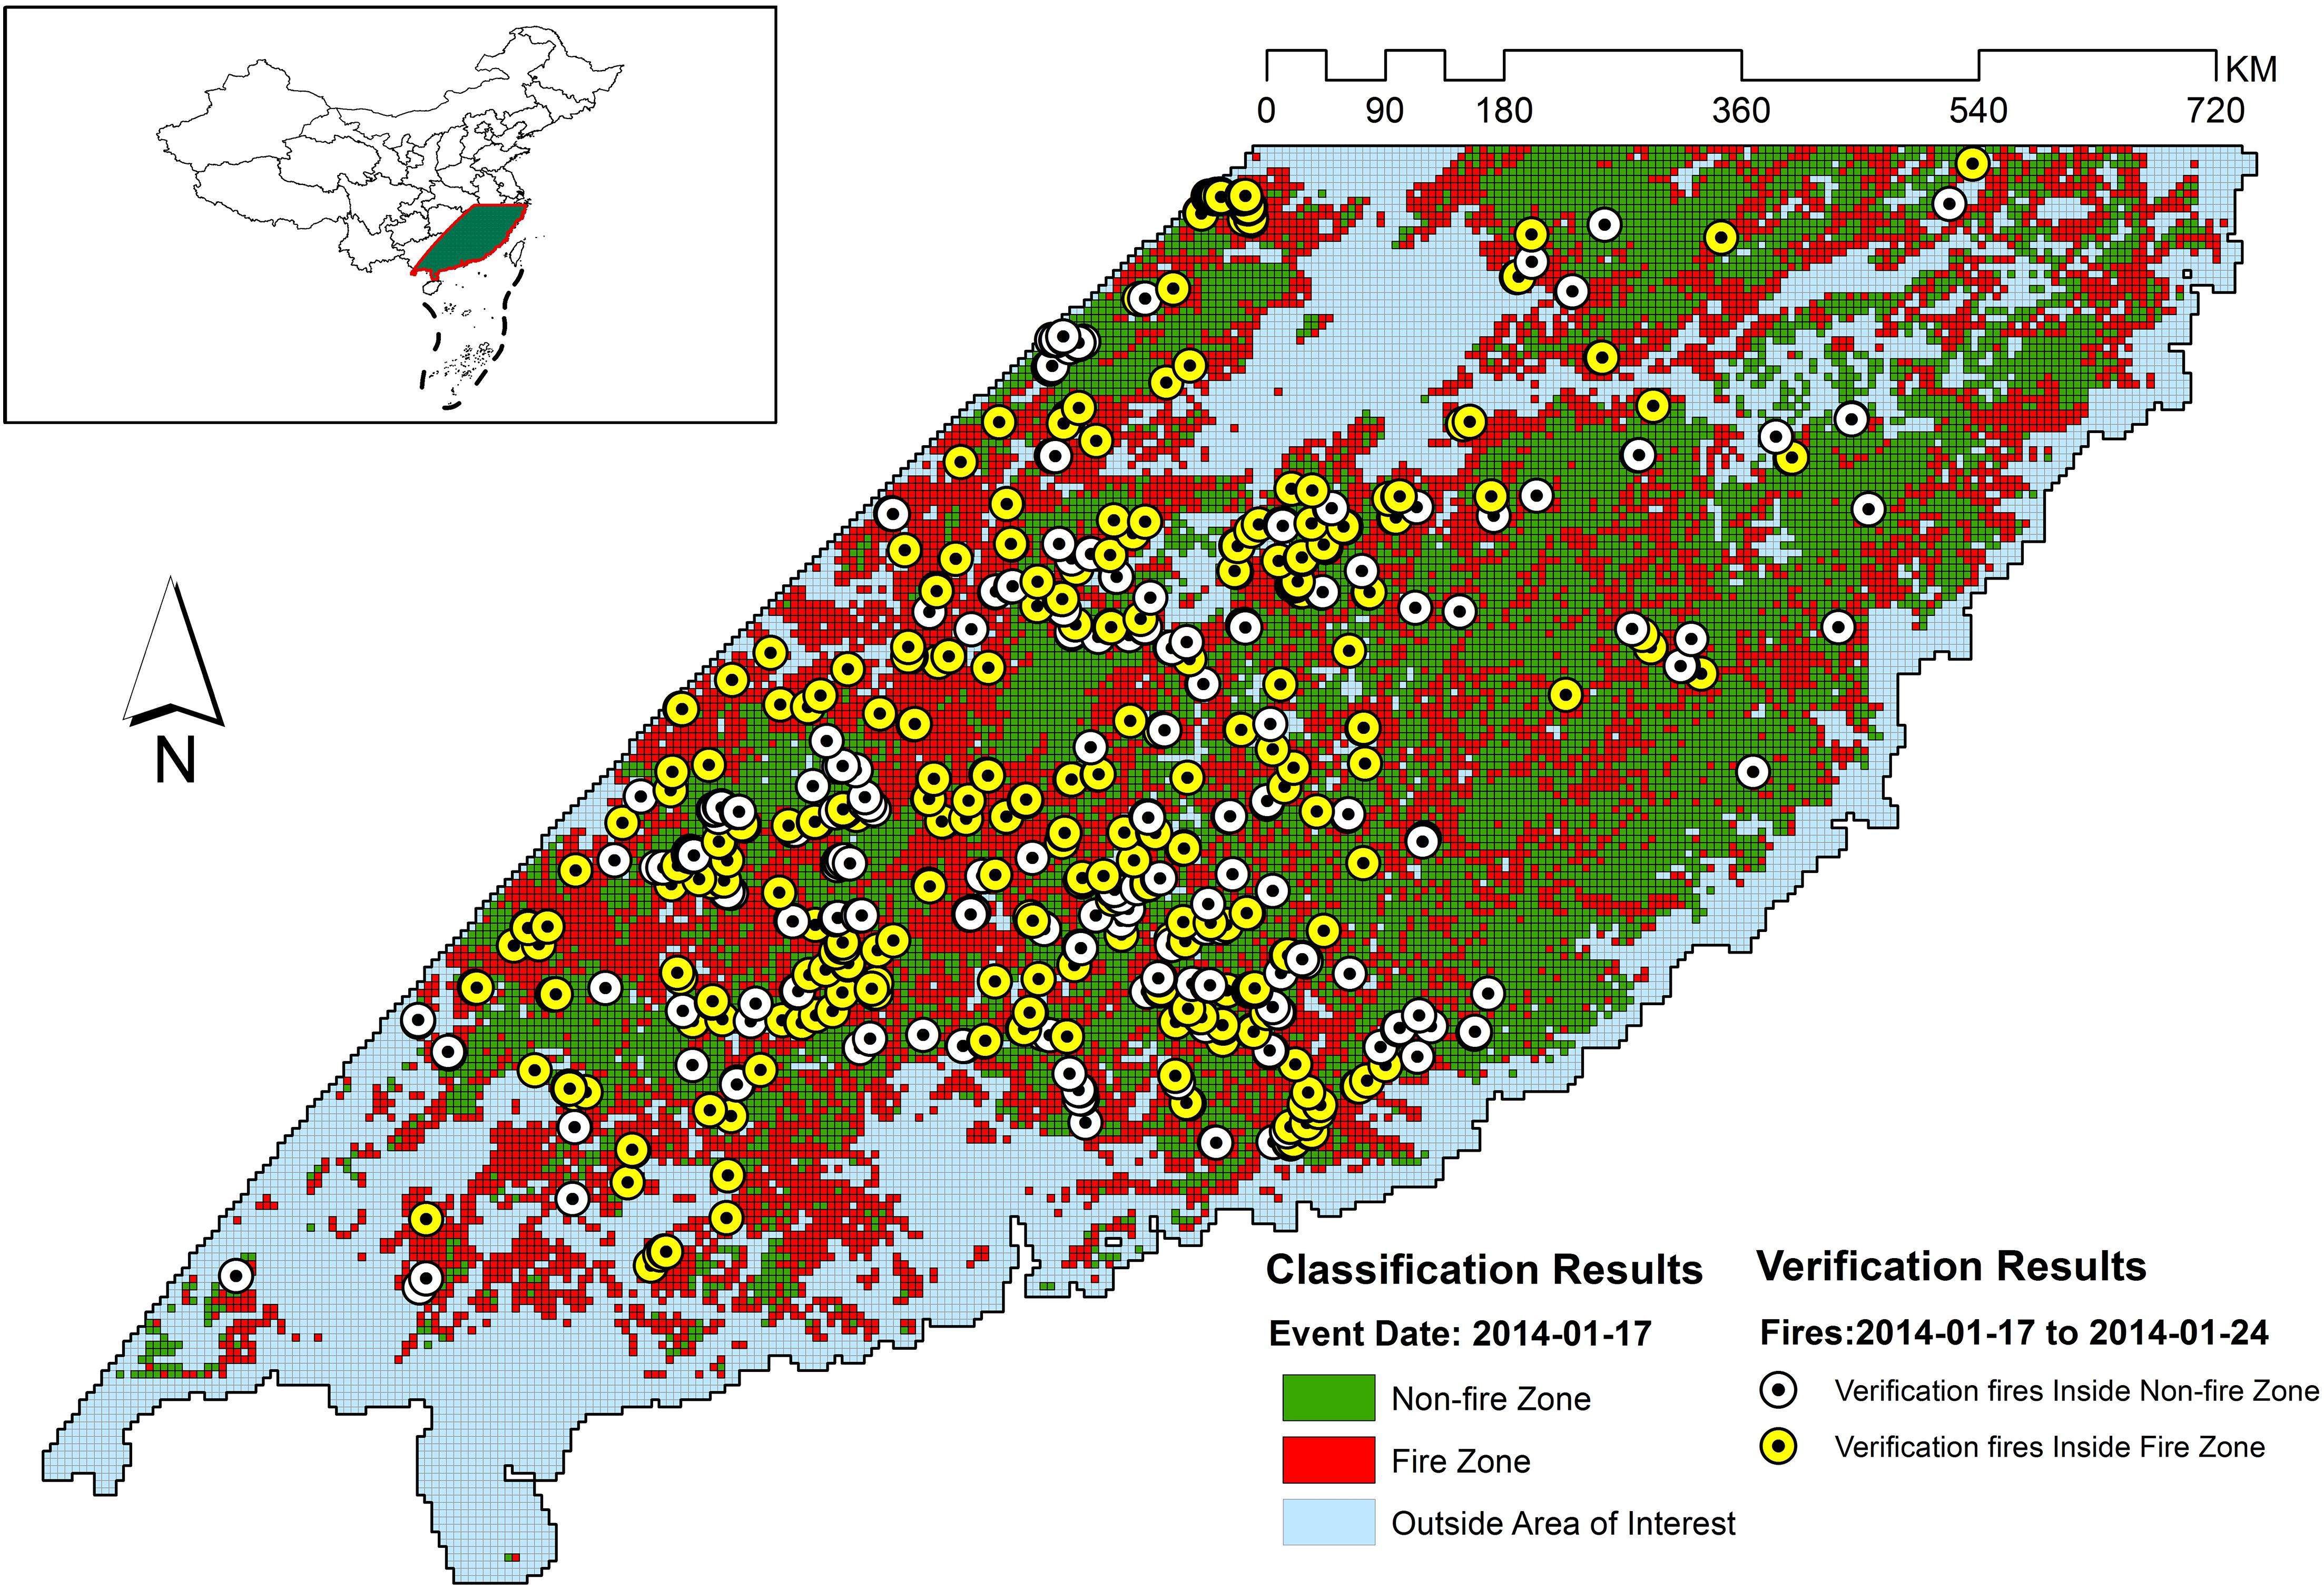
Figure 7. Classification and verification result for 2014-01-17.
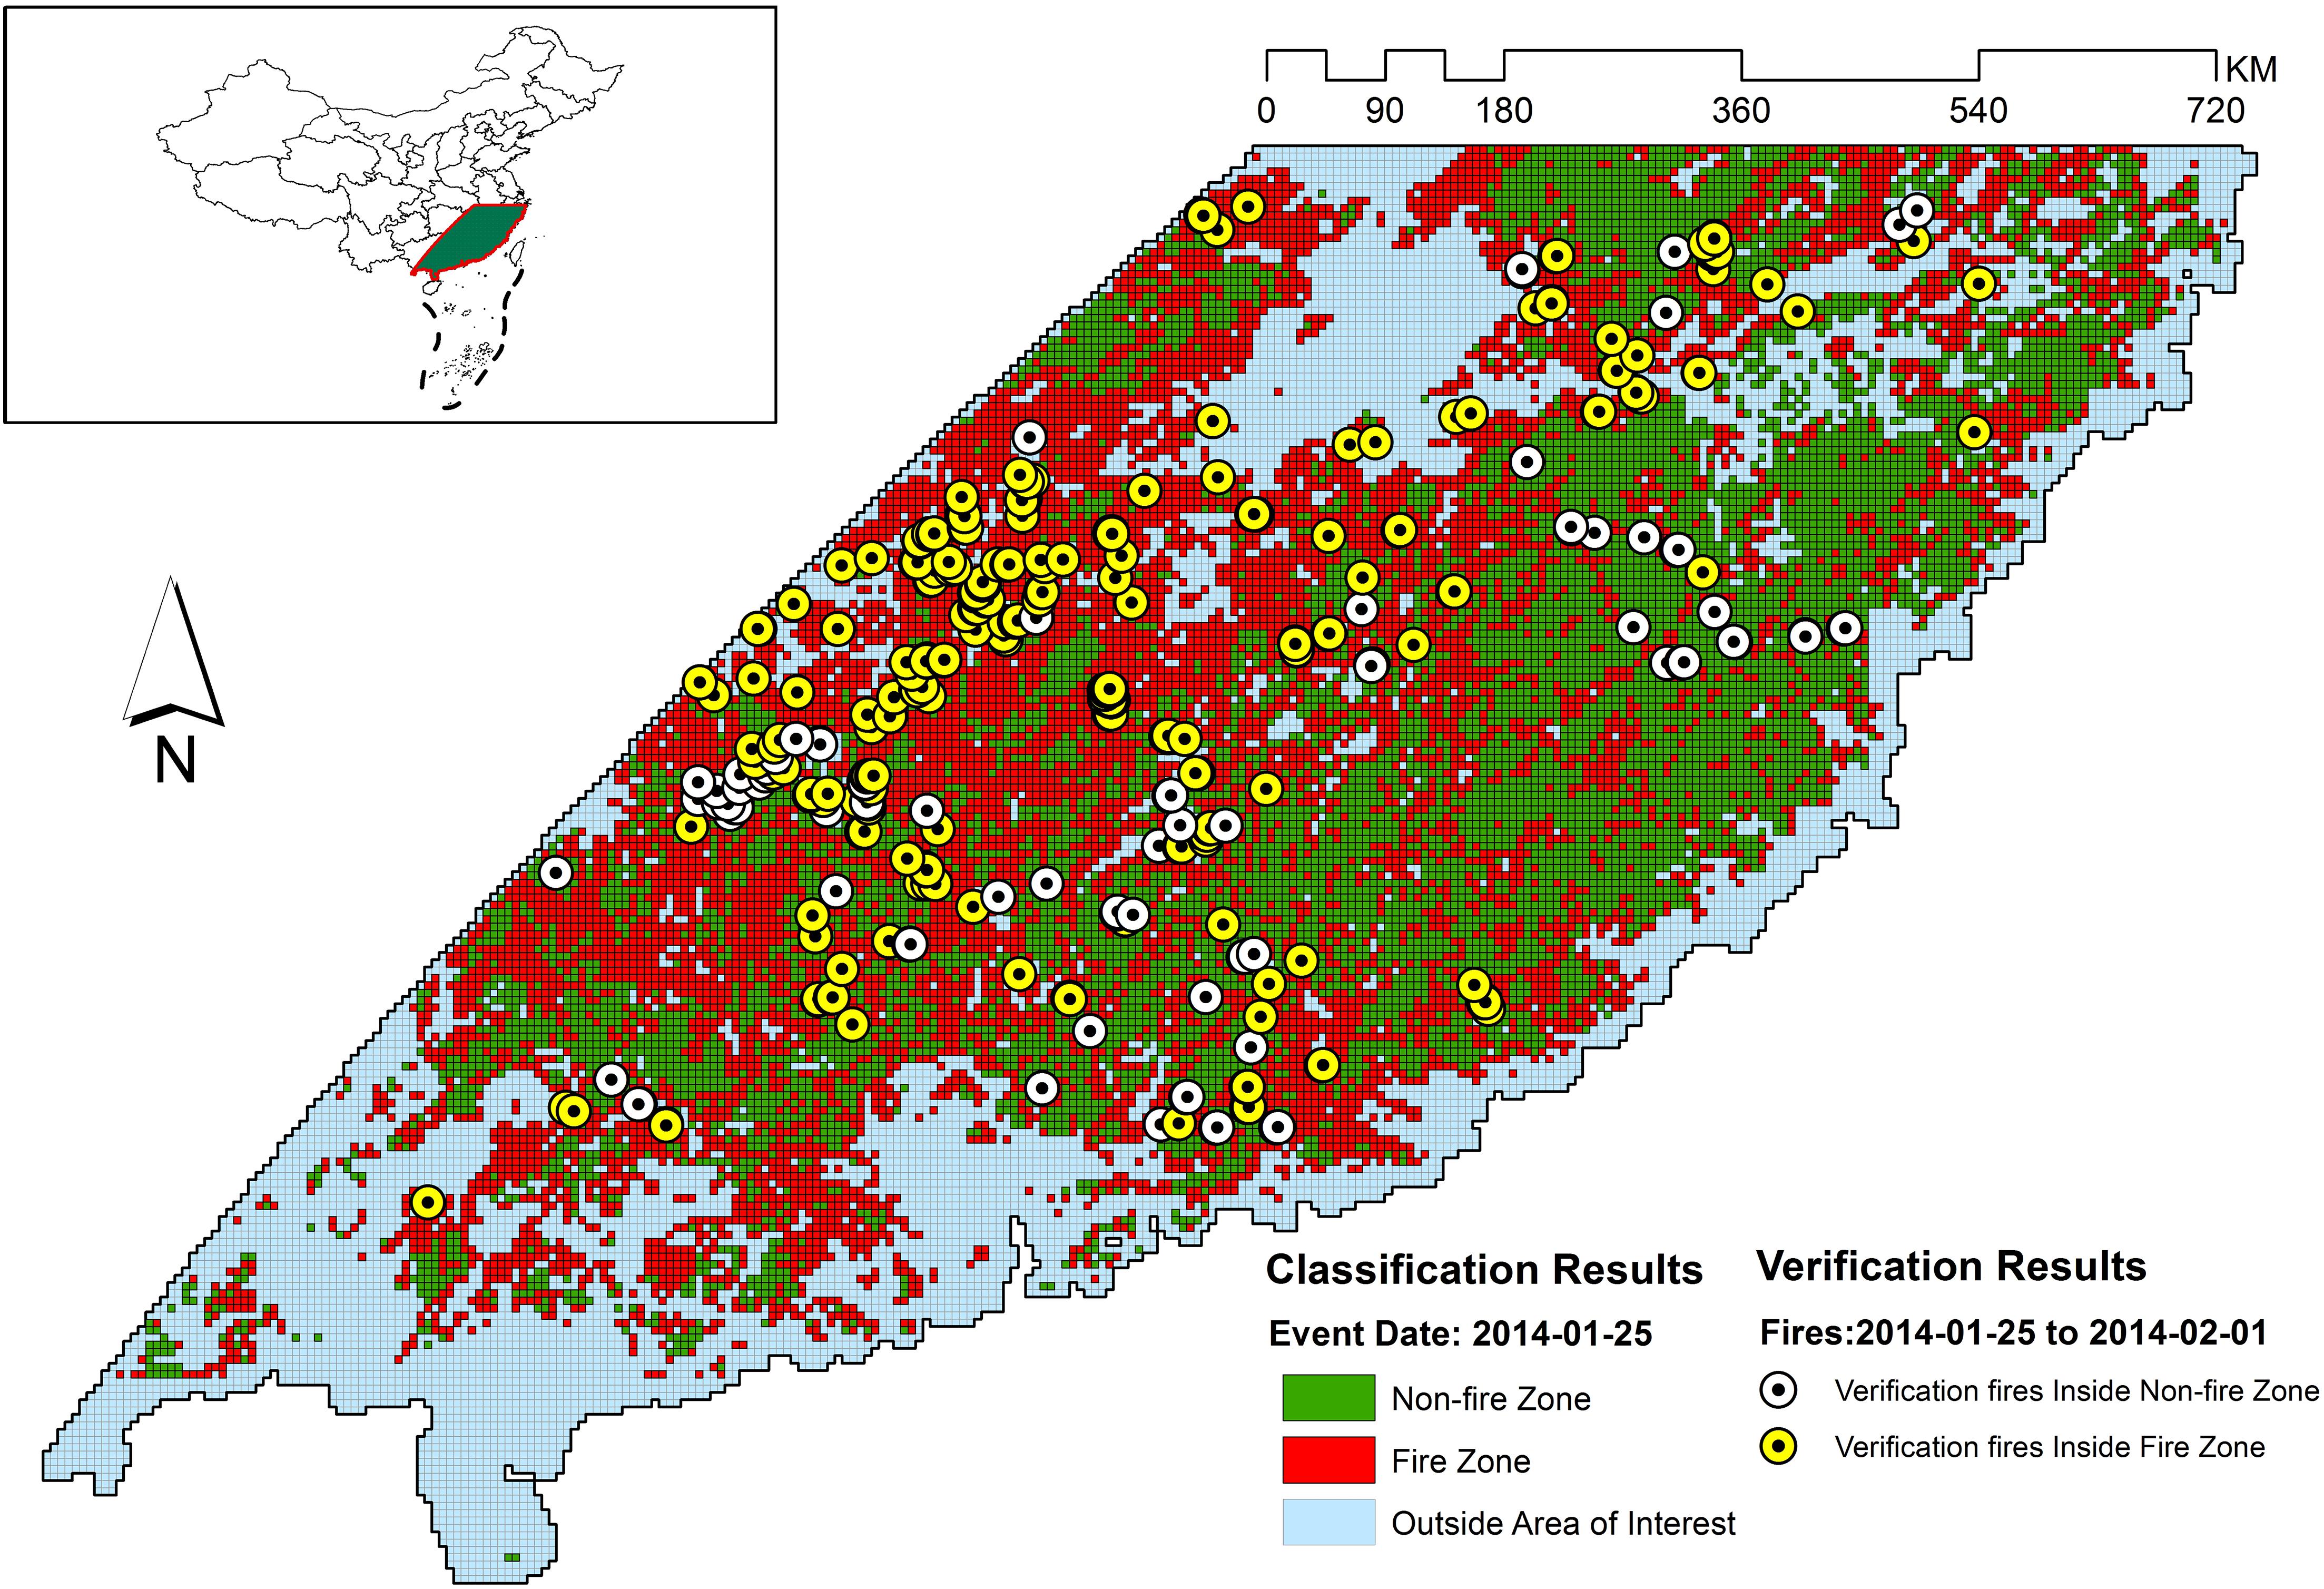
Figure 8. Classification and verification results for 2014-01-25.
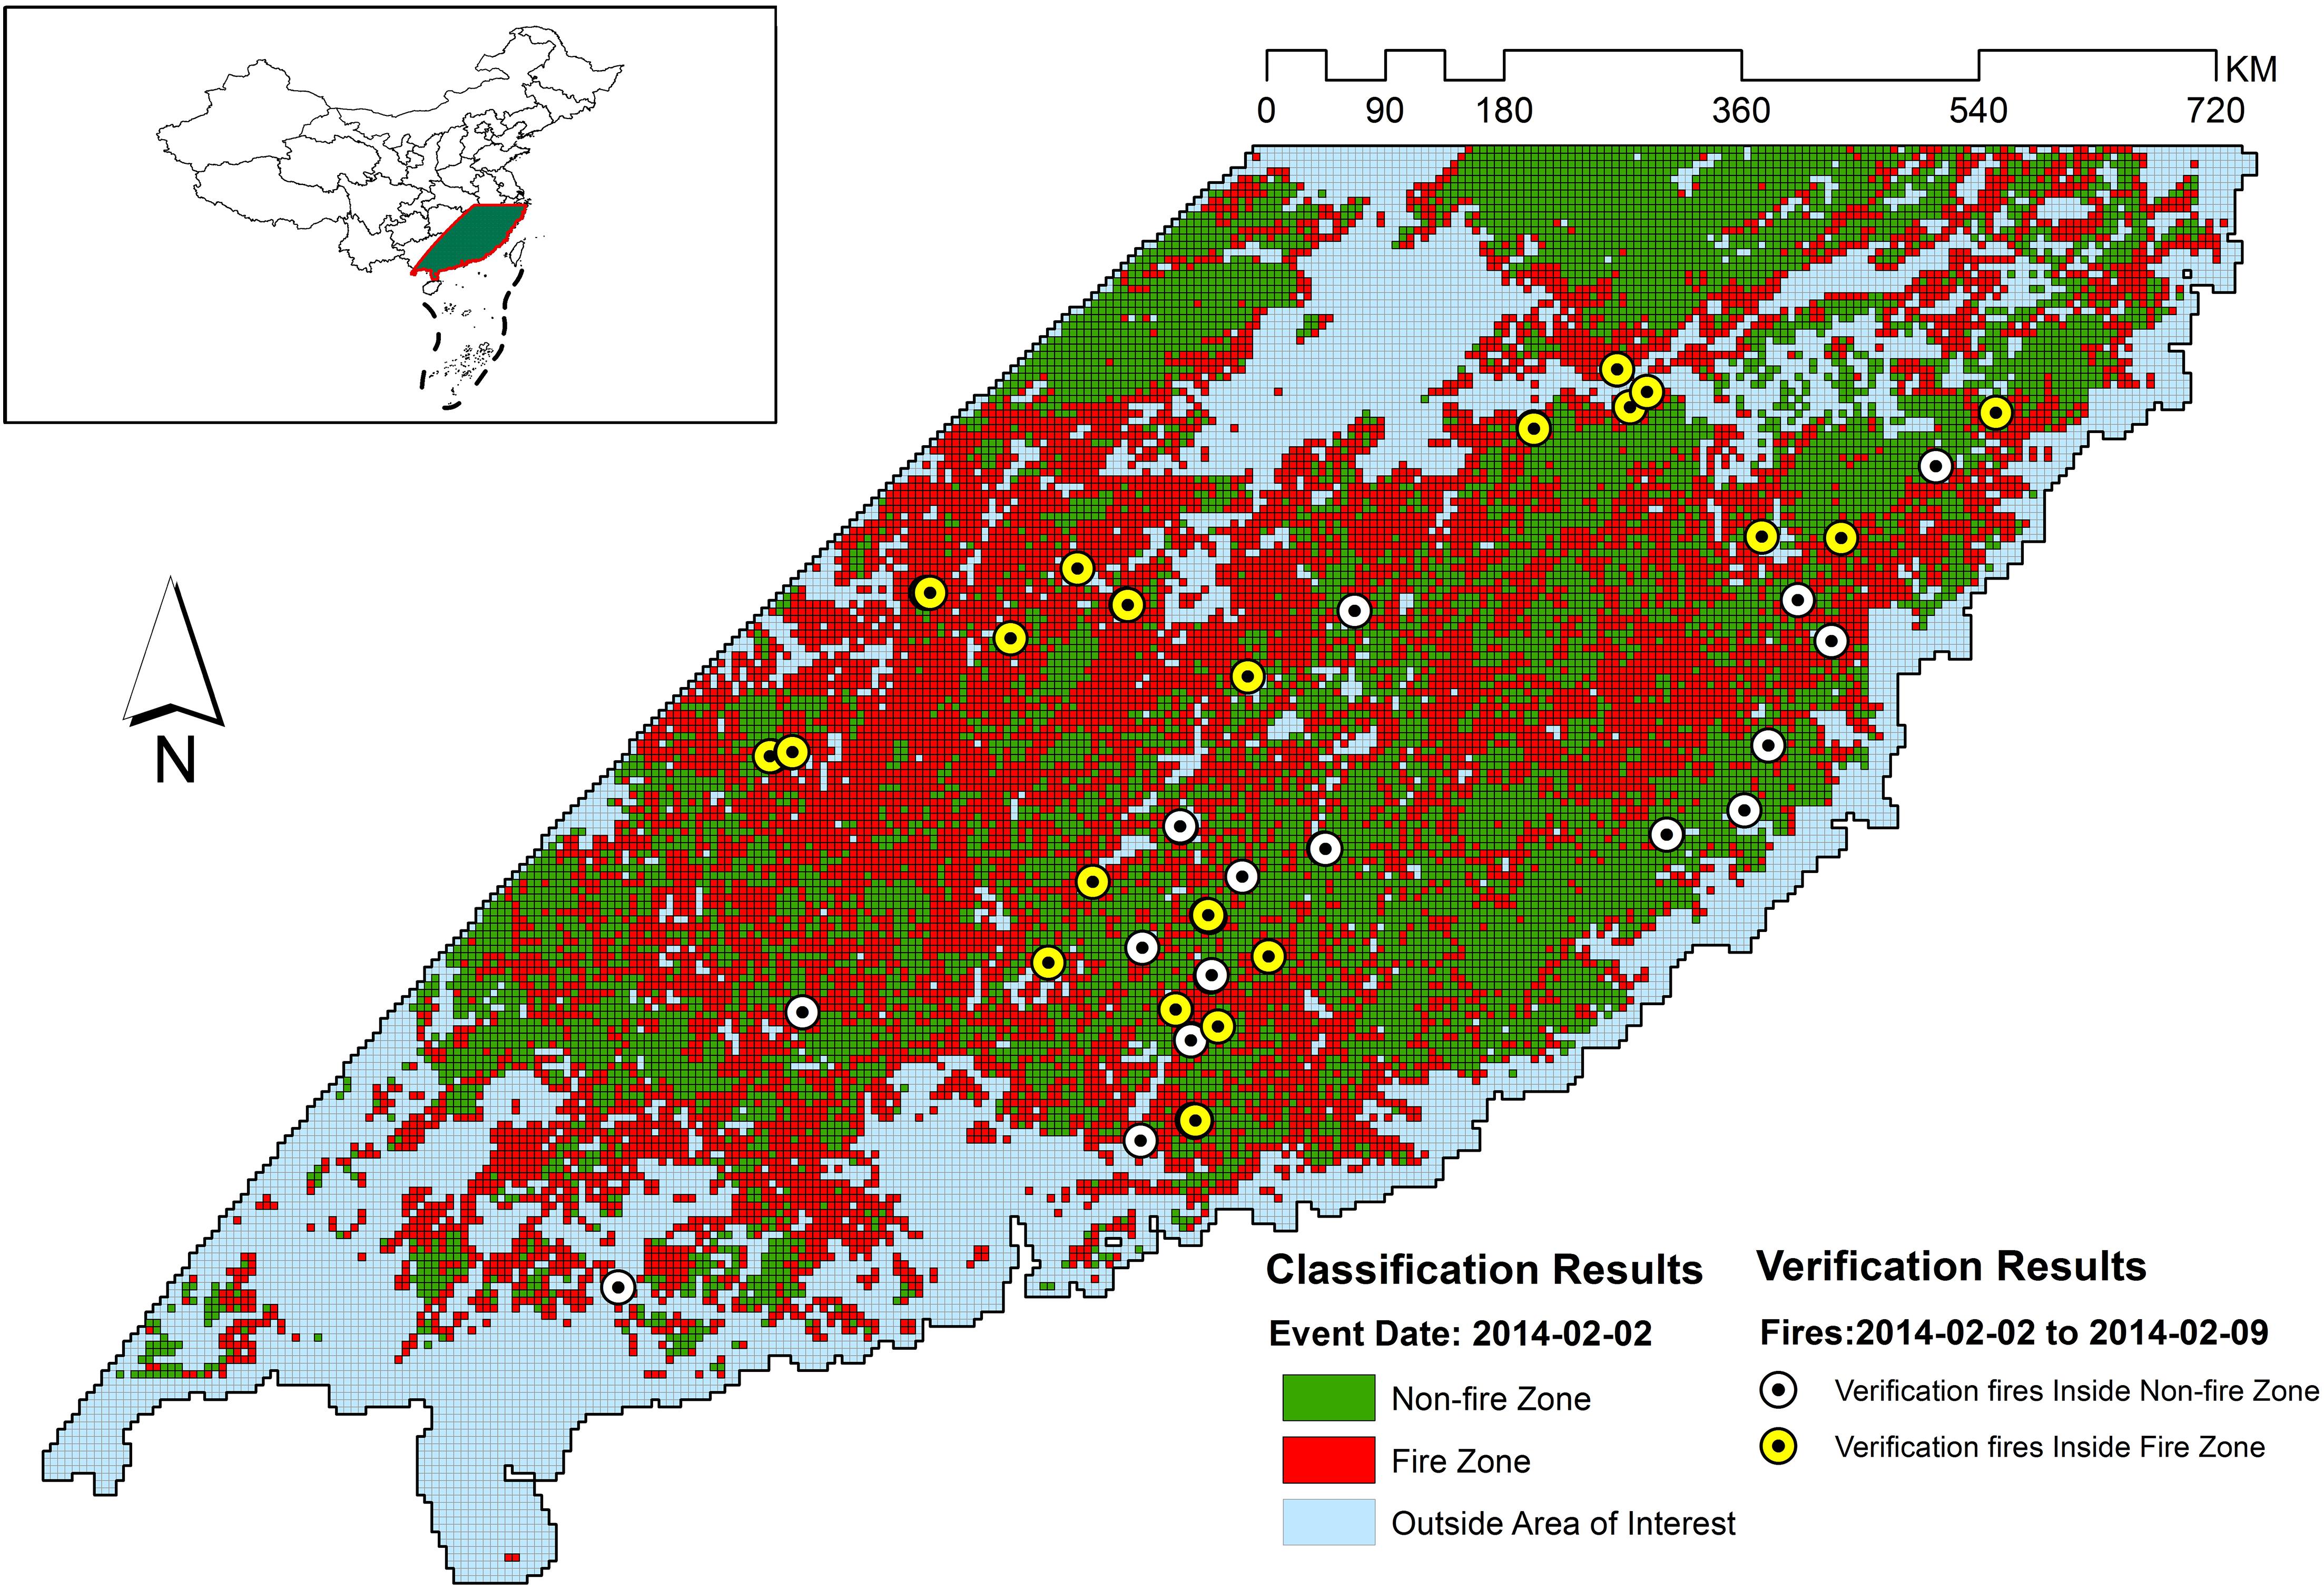
Figure 9. Classification and verification results for 2014-02-02.
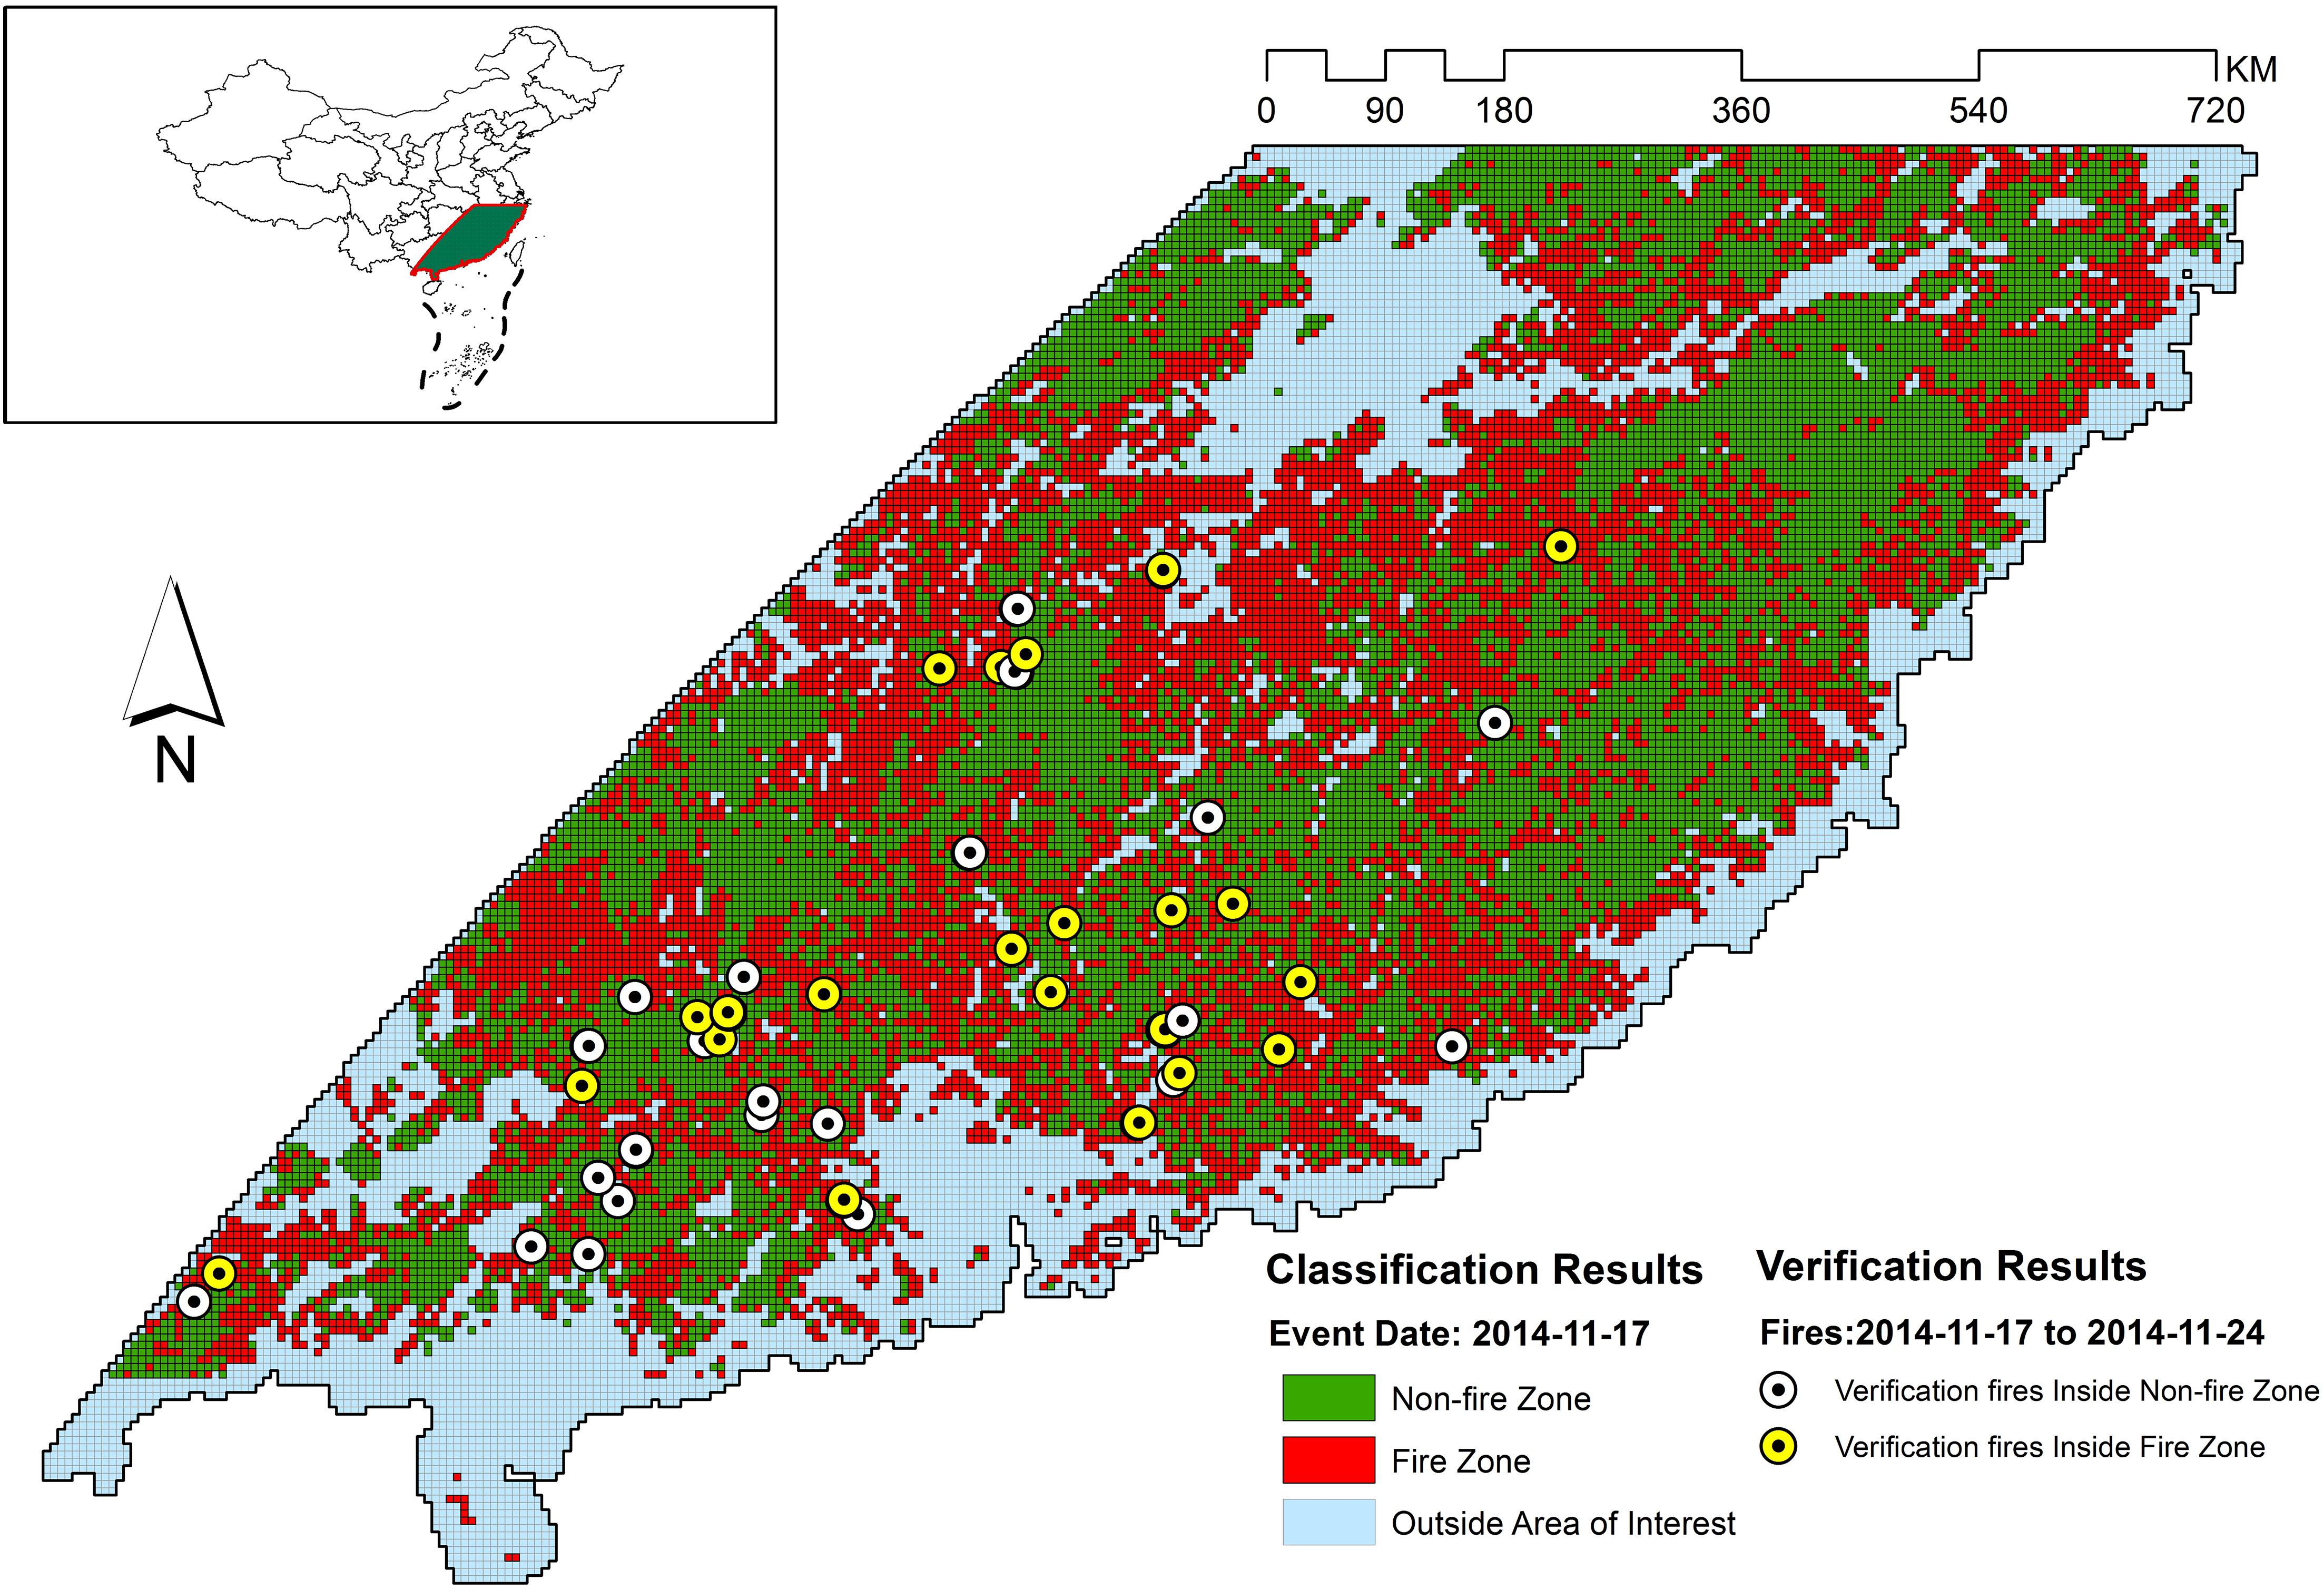
Figure 10. Classification and verification results for 2014-11-17.
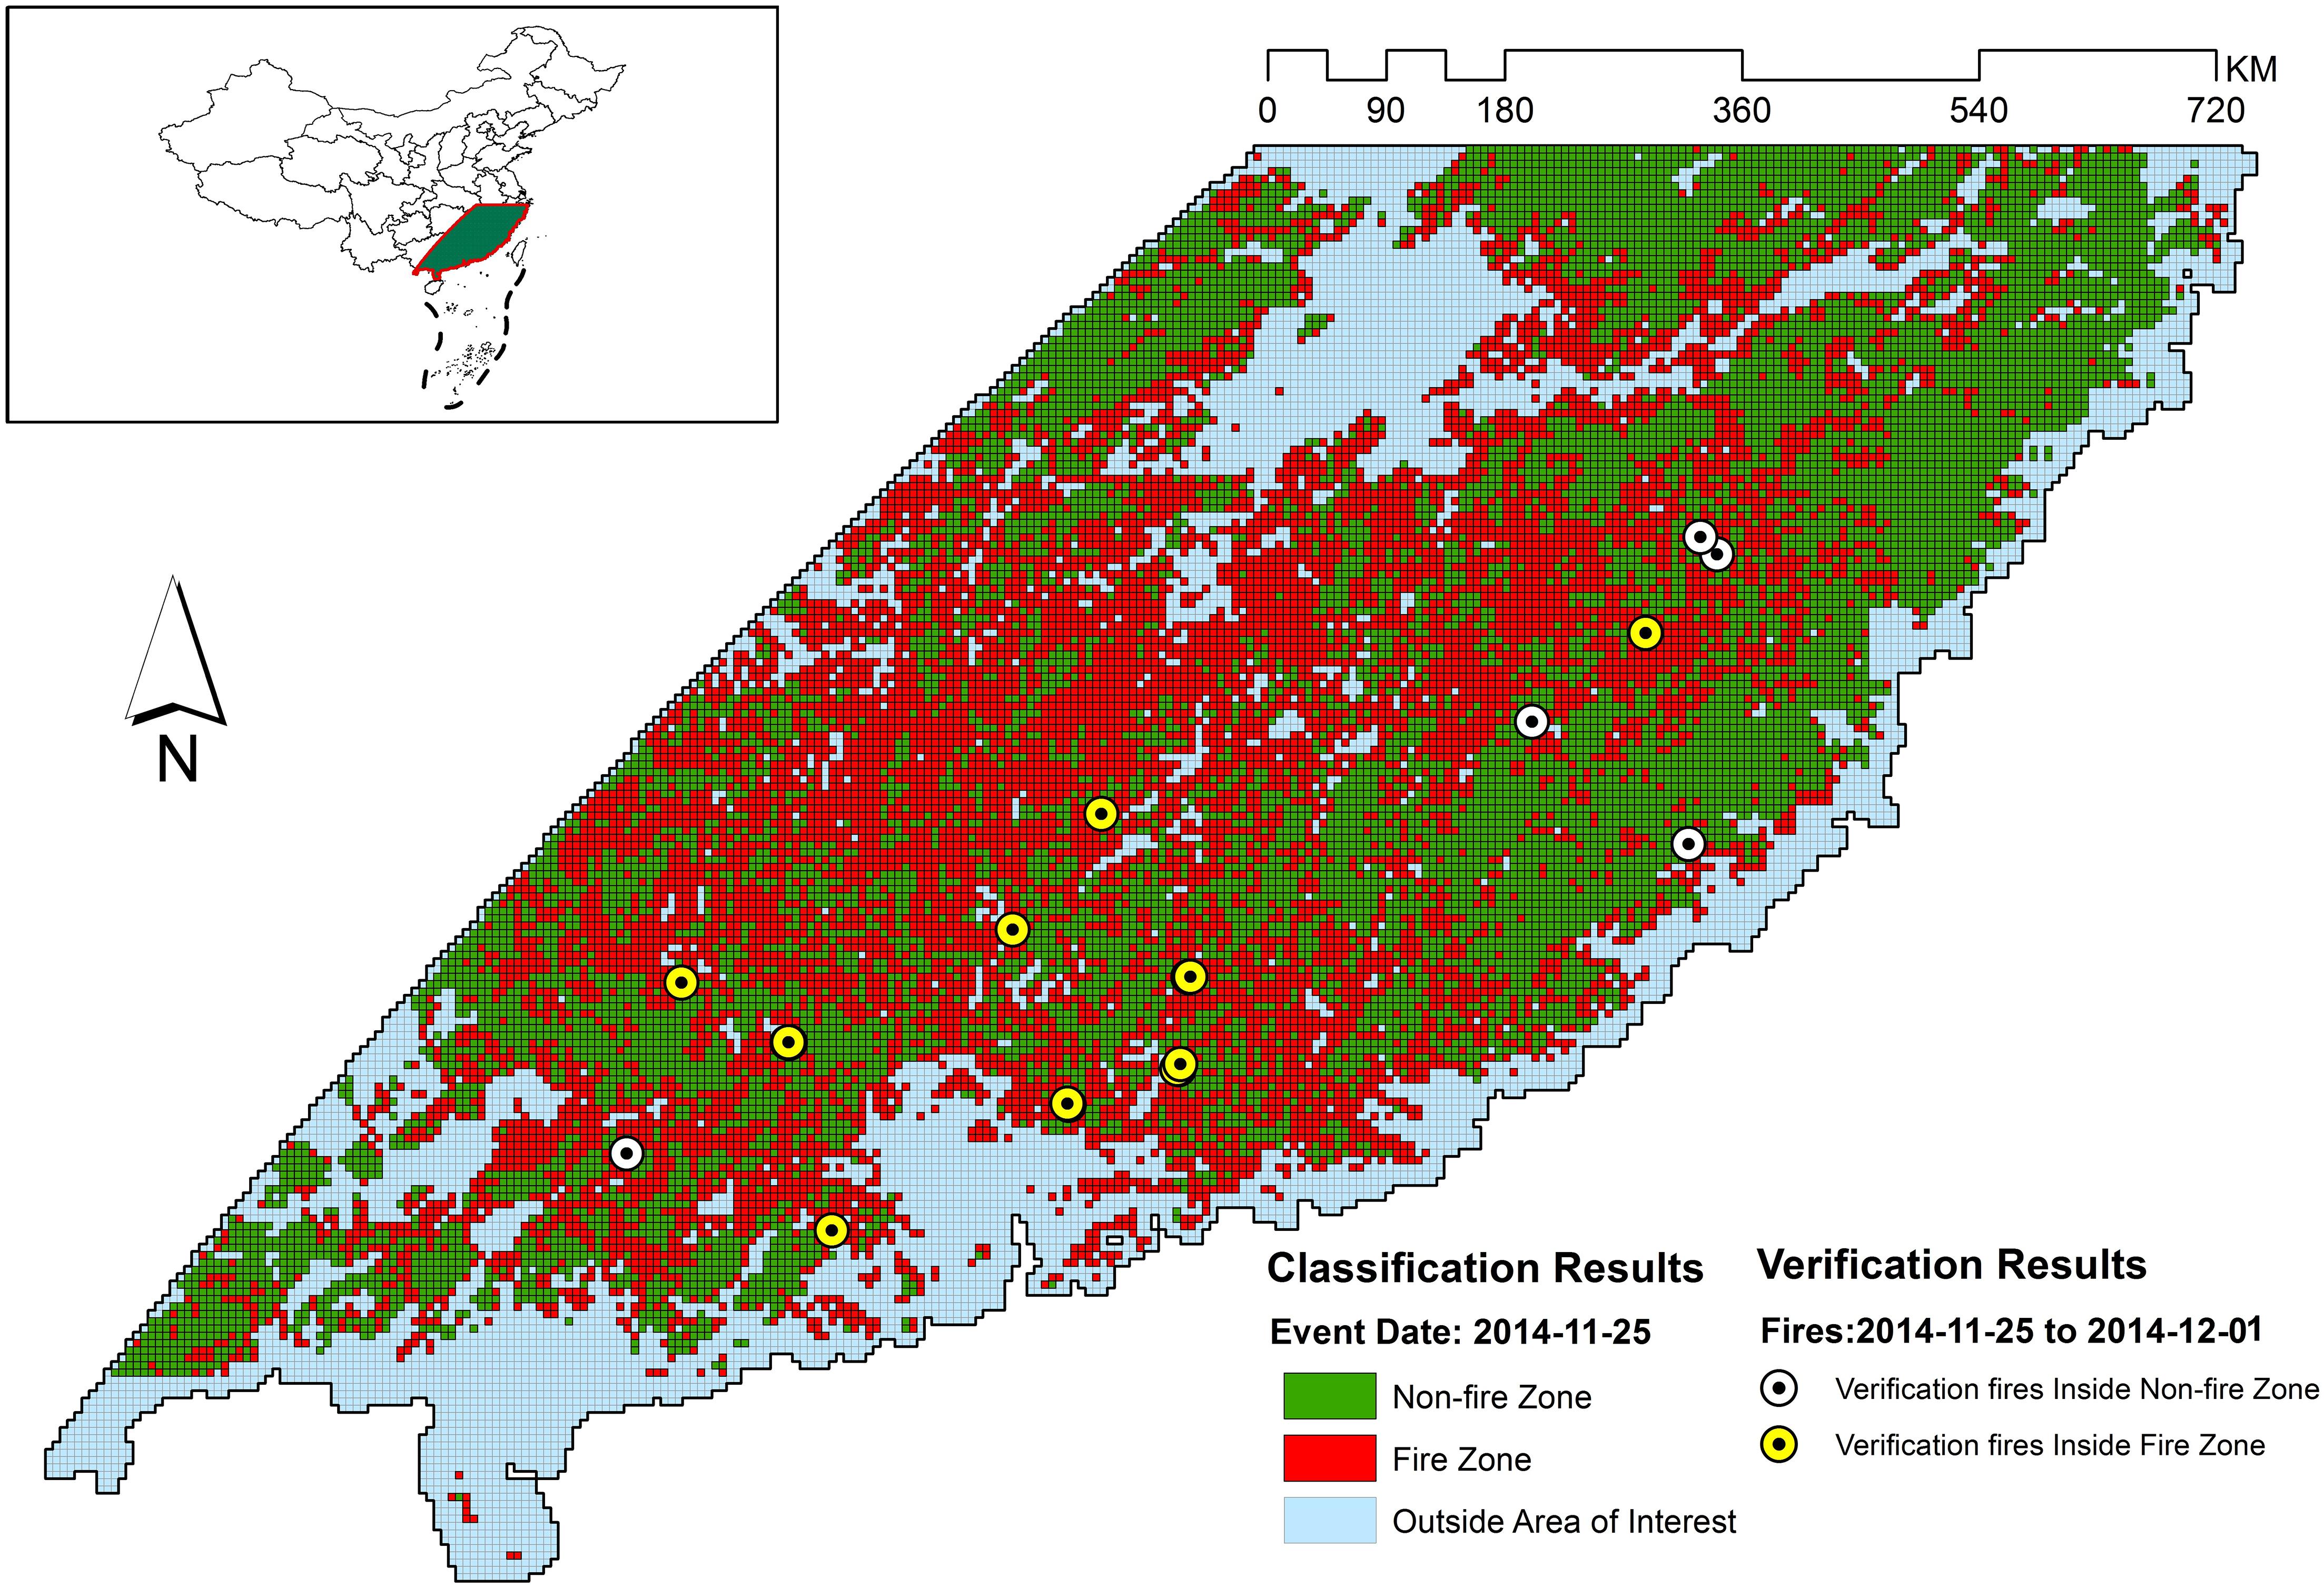
Figure 11. Classification and verification results for 2014-11-25.
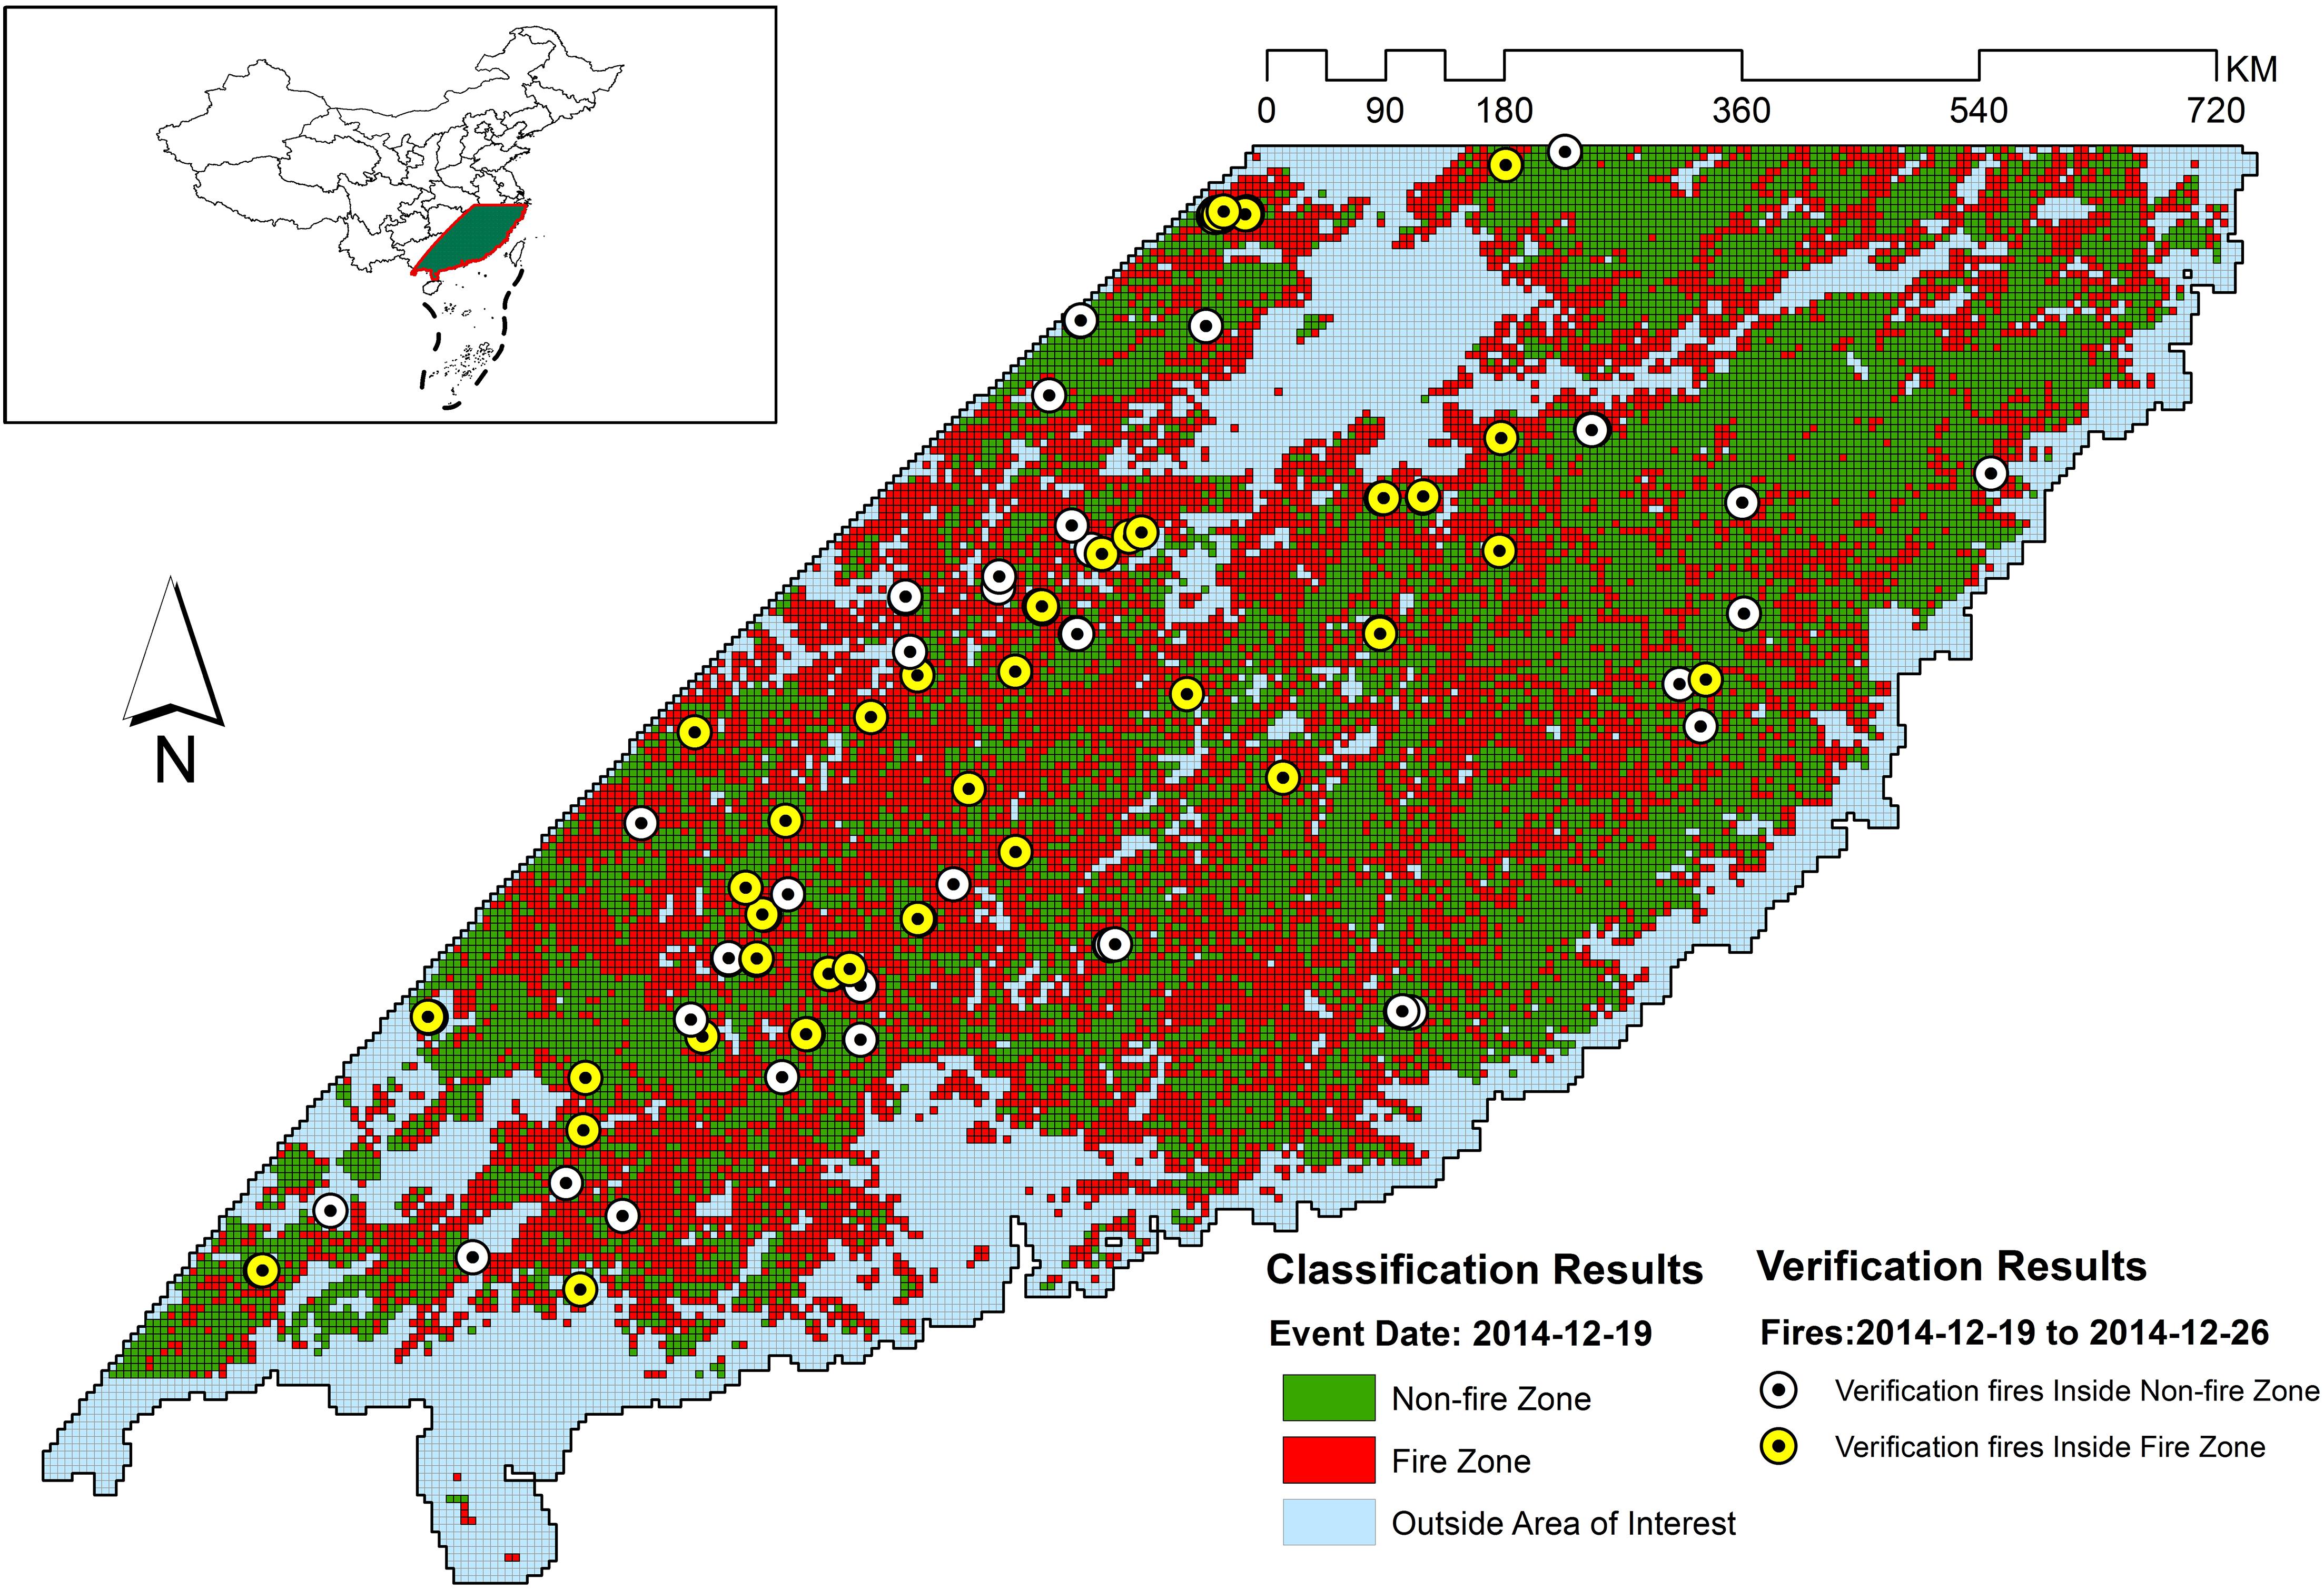
Figure 12. Classification and verification results for 2014-12-19.
Figures 5–11 provide the overall results of the classification and the location of verification fires. These images were classified into “Non-fire zone” – collection of grid cells classified as fire grid cells and “Fire zone” – collection of grid cells classified as non-fire grid cells. The verification fires were the collection of fires from the MCD14ML data product. The verification fires were used as corroborating evidence that the fire zone was correctly classified as future fire events have been recorded in the fire zones suggesting that the information on fire-prone conditions captured by the model can be used to classify environmental conditions as fire-prone. Therefore, the number of verification fires falling within the fire class was used as a metric to evaluate the performance of the model in real-world practical implementations. The verification fires were divided into two groups. The first group had fires with a confidence level >80%, as defined by MCD14ML data product which is the same as the fire grid cells that were used to train the models. The second group of verification fires was the subset of the first group and only included verification fires with a confidence level over 95%, as defined by the MCD14ML data product. Higher confidence generally results in fewer false detections and therefore increases the confidence in model performance if these high confidence fire detections fall within the fire zones.
Figure 12 gives the overall performance of the three models combined. Collectively for the entire study area, the three models identified approximately 60% of fires consistently for each individual grid file. Percentages were slightly better in almost all verification files when high confidence fires were considered (Figure 12B). Looking at the individual performances of the three models developed for evergreen broadleaf forest, mixed forest, and woody savannas land covers, mixed forest comes out as the best model with consistent results mostly above 70%. However, models for evergreen broadleaf forest and woody savannas performed poorly with highly inconsistent results. Percentages of verification fires inside fire zones improved considerably when only considering higher confidence verification fires. With the exception of verification data from December 19, 2014 – December 26, 2014, the mixed forest model performed well with both high and low confidence verification data.
The weakest performance of the mixed forest model was observed for the fire data from November 17–24, 2014, November 25–December 1, 2014, and December 19–26, 2014 with 66.67, 40, and 66.67% of fires from verification files falling in the fire zone. Looking at Figure 5B an interesting observation can be made, with the exception of verification data from December 19–26, most of the verification fires that fell into the non-fire classification had a confidence level lower than 95. This suggests that the quality of verification fires used also affected the verification results. For example, the lowest performing verification data from November 25–December 1 did not have any high confidence fires and therefore was likely the reason for the low percentage of verification fires falling within the fire class. The verification fires that were in the non-fire classification zones from November 17–24 and November 25–December 1 were fires from lower confidence levels. However, the nominal performance with low confidence verification fires and drop in number of high confidence verification fire from December 19–26 in the mixed forest fire risk zone cannot be explained. There might be some other underlying factors contributing to this behavior that has not been considered in this study.
Several factors were identified that led to the differences in performance between different models. First of all the study area selected had a much broader spatial coverage of mixed forests (10,866 grid cells), which was more than the combined number of grid cells that constitute the area of the other two land cover classes (4,860 grid cells for broadleaf evergreen forests and 4,588 grid cells for woody savannas). Understandably, the number of fire training samples in the mixed forest (692) was also larger than the other two land cover classes (415 for broadleaf evergreen forests and 575 grid cells for woody savannas). This provided the mixed forest model with a higher number of fire grid cells during the training stage. Another important factor was the number of training grid cells drawn from an individual grid file created for a particular date, as it improved the ability of the model to capture more information on conditions prevalent during that particular date. Even though, the number of grid files from which training samples were drawn was highest for woody savannas (156) as compared to mixed forest (134) and broadleaf evergreen forest (119) but the number of the training fire grid cells drawn from each individual grid files put the mixed forest land cover at an advantage as it had a larger percentage of grid files (50%) from which samples greater than 2 were drawn as compared to 48% for broadleaf evergreen forest and 41.02% of woody savannas land covers.
Representation also becomes more important in the context of PU learning as these fire grid cells were used to identify reliable negatives. The larger the number of samples representing fire conditions, the more reliable the negatives would be when identified through the PU learning process. Another important reason for the better performance of the mixed forest model may be the environmental parameters chosen for the study. Looking at the correlations in a previous study (Shirazi et al., 2017), it can be observed that most of the stronger correlations are predominantly in the mixed forest region. This suggests that these climatic parameters better represent the relationship between climate and mixed forest land covers as compared to the other two. So, sample representations combined with the feature representation for mixed forests resulted in a better model for mixed forest land cover.
Looking at the verification results beyond the inter-model performance, overall several important factors were observed to have contributed to the performance of the model demonstrated in this study. Initially it is important to highlight that verification of the model in real-world conditions was challenging as there was no benchmark dataset to verify if the fire or non-fire girds cells were correctly classified. In a real-world scenario, non-fire conditions are very difficult to label as any gird cell without ignition/trigger is a non-fire grid. The PU learning component of the process helped to identify reliable negatives, however, they were limited by the variance of fire conditions captured by the fire-labeled grid cells in the database. If a training dataset captures a broad range of environmental conditions prone for fire events, it can compute a more accurate decision boundary between the two classes.
Broadly it can be understood that verification fires will fall outside the classified fire zone if (1) the conditions change with time and environmental conditions at the previously non-fire grids change to fire-prone – in this case (a) if the environmental conditions change within a time frame shorter than the resolution of the observed time series (approx. a week), the verification fires will fall outside the classified fire zone as the model was trained using environmental data a week prior to fire event and, (b) classification results will become obsolete with time depending on the pace of changes in environmental conditions, (2) if the training data lack examples similar to the verification fires then it might not have taken this into consideration when drawing the decision boundary to separate the two classes – in this case increasing the training data will help to improve model performance as was observed in the case of the mixed forest model, (3) the environmental parameters used lacked sufficient predictive ability and therefore required the addition of more features that can help explain certain verification fires not falling within the classified fire risk zone. Understandably, the verification results were the result of interplay of all of these factors highlighted above.
The temporal resolution of the time series seems to be capturing the variations within different environmental parameters providing good information for the model to learn the trends that are leading to fire-prone conditions. However, there is room to improve the spatial precision of fire risk classification. Using high spatial resolution images for these climatic parameters may not be useful, as spatial variability in climatic parameters is not very high. Nevertheless identifying and introducing finer scale features that have a good correlation with fire activity and exhibit higher spatial variability as compared to the environmental parameter used in this study should provide the necessary improvement in the learning ability of the model.
One of the limitations of this study was the loss of valuable positive examples for training and testing data at the database development stage. This loss was largely due to incomplete information within individual records. The strategy adopted in this study was to remove the entire records if it had even a single missing value in one of the features. It is likely that the performance of all the models can be improved by calculating generalized values for these erroneous or missing values. This is an important consideration for future improvements to the methodology. In the future, it may also be interesting to see if the MODIS fire burn area product may be used for labeling fire grid cells.
Overall, the performance of the model and the designed methodology can both develop by improving the different limitations of the model identified above and by improving the methodology of verification. The role of each factor affecting the model performance can be evaluated through detailed studies in the future.
Conclusion
Models constructed for different land covers exploiting the relationship between fire and environmental parameters including precipitation, evapotranspiration, potential evapotranspiration, moisture balance, and NDVI show that these parameters have the potential for use in estimating fire risk through the use of a classification algorithm. It also highlights that the information within the three-month time series of these climatic parameters provides valuable information about the interlinked and underlying changes leading to fire-prone conditions. The PU learning technique has the ability to identify reliable negative results provided ample reliable positive samples are available. However, there is much room for improvement for its use in fire risk classification as implemented in this study.
The model performed best for the mixed forest land cover as compared to the broadleaf evergreen forest and woody savannas land covers most likely because of the better representation of mixed forest in the training samples. It is likely that models for the other two land cover classes might improve in performance if training data are improved. It will also be interesting to see if the volume of training data by including data from other similar regions can improve the results. It was also realized that if multiple models can be constructed for different land covers, they can be combined to provide fire gird classification for an entire region.
Data Availability Statement
Publicly available datasets were analyzed in this study. This data can be found here: https://earthdata.nasa.gov/earth-observation-data/near-real-time/firms/active-fire-data; https://lpdaac.usgs.gov/product_search/; and https://disc.gsfc.nasa.gov/mirador-guide.
Author Contributions
ZS implemented the research and wrote the manuscript. LW designed the research. VB evaluated and implemented the statistical analyses. All authors edited the manuscript.
Funding
This research was funded by the National Natural Science Foundation of China (No. 41871345), the International Partnership Program of the Chinese Academy of Sciences (No. 131211KYSB20170046), the National Key R&D Program of China (No. 2017YFE0100800), and RFBR, MOST, and DST of Russia according to the research project (No. 19-55-80021).
Conflict of Interest
The authors declare that the research was conducted in the absence of any commercial or financial relationships that could be construed as a potential conflict of interest.
Footnotes
- ^ eomf.ou.edu
- ^ https://ladsweb.modaps.eosdis.nasa.gov/missions-andmeasurements/modis/ (accessed February 24, 2021).
References
Bondur, V. G. (2011). Satellite monitoring of wildfires during the anomalous heat wave of 2010 in Russia. Izv. Atmos. Ocean. Phys. 47, 1039–1048. doi: 10.1134/S0001433811090040
Bondur, V. G. (2014). Modern approaches to processing large hyperspectral and multispectral aerospace data flows. Izv. Atmos. Ocean. Phys. 50, 840–852. doi: 10.1134/S0001433814090060
Bondur, V. G. (2016). Satellite monitoring of trace gas and aerosol emissions during wildfires in Russia. Izv. Atmos. Ocean. Phys. 52, 1078–1091. doi: 10.1134/S0001433816090103
Bondur, V. G., and Ginzburg, A. S. (2016). Emission of carbon-bearing gases and aerosols from natural fires on the territory of Russia based on space monitoring. Dokl. Earth Sci. 466, 148–152. doi: 10.1134/S1028334X16020045
Bondur, V. G., and Gordo, K. A. (2018). Satellite monitoring of burnt-out areas and emissions of harmful contaminants due to forest and other wildfires in Russia. Izv. Atmos. Ocean. Phys. 54, 955–965. doi: 10.1134/S0001433818090104
Bondur, V. G., Gordo, K. A., and Kladov, V. L. (2017). Spacetime distributions of wildfire areas and emissions of carbon-containing gases and aerosols in northern Eurasia according to satellite-monitoring data. Izv. Atmos. Ocean. Phys. 53, 859–874. doi: 10.1134/S0001433817090055
Bondur, V. G., Mokhov, I. I., Voronova, O. S., and Sitnov, S. A. (2020). Satellite monitoring of Siberian wildfires and their effects: features of 2019 anomalies and trends of 20-year changes. Dokl. Earth Sci. 492, 370–375. doi: 10.1134/S1028334X20050049
Bondur, V. G., and Vorobev, V. E. (2015). Satellite monitoring of impact arctic regions. Izv. Atmos. Ocean. Phys. 51, 949–968. doi: 10.1134/S0001433815090054
Brewer, C. K., Winne, J. C., Redmond, R. L., Opitz, D. W., and Mangrich, M. V. (2005). Classifying and mapping wildfire severity: a comparison of methods. Photogramm. Eng. Remote Sensing 71, 1311–1320.
Chawla, N. V., Bowyer, K. W., Hall, L. O., and Kegelmeyer, W. P. (2002). SMOTE: synthetic minority over-sampling technique. J. Artif. Intell. 2, 321–357. doi: 10.1002/eap.2043
Chen, F., Yu, B., and Li, B. (2018). A practical trial of landslide detection from single-temporal Landsat8 images using contour-based proposals and random forest: a case study of national Nepal. Landslides 15, 453–464. doi: 10.1007/s10346-017-0884-x
Chen, F., and Yu, B. (2019). Earthquake-induced building damage mapping based on multi-task deep learning framework. IEEE Access 7, 181396–181404. doi: 10.1109/ACCESS.2019.2958983
Chen, F., Zhang, M. M., Guo, H. D., Allen, S., Kargel, J., Haritashya, U., et al. (2021). Annual 30 m dataset for glacial lakes in High Mountain Asia from 2008 to 2017. Earth Syst. Sci. Data 13, 741–766. doi: 10.5194/essd-13-741-2021
Chen, F., Zhang, M., Tian, B., and Li, Z. (2017). Extraction of glacial lake outlines in Tibet plateau using Landsat 8 imagery and google earth engine. IEEE J. Sel. Top. Appl. Earth Obs. Remote Sens. 10, 4002–4009. doi: 10.1109/JSTARS.2017.2705718
Chen, Y. (2009). “Learning classifiers from imbalanced, only positive and unlabeled data sets,” in Proceedings of the 14th ACM SIGKDD International Conference on Knowledge Discovery and Data Mining, (August 2008), Las Vegas, NV, 1–5. doi: 10.1145/1401890.1401920
Chowdhury, E. H., and Hassan, Q. K. (2015). Development of a new daily-scale forest fire danger forecasting system using remote sensing data. Remote Sens. 7, 2431–2448. doi: 10.3390/rs70302431
Coen, J. L., and Schroeder, W. (2013). Use of spatially refined satellite remote sensing fire detection data to initialize and evaluate coupled weather-wildfire growth model simulations. Geophys. Res. Lett. 40, 5536–5541. doi: 10.1002/2013GL057868
Cortez, P., and Morais, A. (2007). “A data mining approach to predict forest fires using meteorological data. new trends in artificial intelligence,” in Proceedings of the 13th Portuguese Conference on Artificial Intelligence (EPIA 2007, Vol. 2007, Guimarães, 512–523.
Dragozi, E., Gitas, I. Z., Stavrakoudis, D. G., and Theocharis, J. B. (2014). Burned area mapping using support vector machines and the FuzCoC feature selection method on VHR IKONOS imagery. Remote Sens. 6, 12005–12036. doi: 10.3390/rs61212005
du Plessis, M. C., Niu, G., and Sugiyama, M. (2014). “Analysis of learning from positive and unlabeled data,” in Proceedings of the 27th International Conference on Neural Information Processing Systems, (Cambridge, MA: MIT Press), 703–711.
Eskandari, S., Amiri, M., Sãdhasivam, N., and Pourghasemi, H. R. (2020a). Comparison of new individual and hybrid machine learning algorithms for modeling and mapping fire hazard: a supplementary analysis of fire hazard in different counties of Golestan Province in Iran. Nat. Hazards 104, 305–327. doi: 10.1007/s11069-020-04169-4
Eskandari, S., Miesel, J. R., and Pourghasemi, H. R. (2020b). The temporal and spatial relationships between climatic parameters and fire occurrence in northeastern Iran. Ecol. Indic. 118:106720. doi: 10.1016/j.ecolind.2020.106720
Eskandari, S., Pourghasemi, H. R., and Tiefenbacher, J. P. (2020c). Relations of land cover, topography, and climate to fire occurrence in natural regions of Iran: applying new data mining techniques for modeling and mapping fire danger. For. Ecol. Manag. 473:118338. doi: 10.1016/j.foreco.2020.118338
Fang, L., Yang, J., Zu, J., Li, G., and Zhang, J. (2015). Quantifying influences and relative importance of fire weather, topography, and vegetation on fire size and fire severity in a Chinese boreal forest landscape. For. Ecol. Manag. 356, 2–12. doi: 10.1016/j.foreco.2015.01.011
Guettouche, M. S., Derias, A., Boutiba, M., and Boudella, A. (2011). A fire risk modelling and spatialization by GIS. J. Geogr. Inf. Sys. 3, 254–265. doi: 10.4236/jgis.2011.33022
Guo, H. (2017a). Big data drives the development of earth science. Big Earth Data 1, 1–3. doi: 10.1080/20964471.2017.1405925
Guo, H., Nativi, S., Liang, D., Craglia, M., Wang, L., Schade, S., et al. (2020). Big Earth Data science: an information framework for a sustainable planet. Int. J. Digit. Earth 13, 743–767. doi: 10.1080/17538947.2020.1743785
Guo, H. (2017b). Big earth data: a new frontier in earth and information sciences. Big Earth Data 1, 4–20. doi: 10.1080/20964471.2017.1403062
Han, W., Feng, R., Wang, L., and Cheng, Y. (2018). A semi-supervised generative framework with deep learning features for high-resolution remote sensing image scene classification. ISPRS J. Photogramm. Remote Sens. 145, 23–43. doi: 10.1016/j.isprsjprs.2017.11.004
Han, J., Zuo, W., Liu, L., Xu, Y., and Peng, T. (2016). Building text classifiers using positive, unlabeled and ‘outdated’ examples. Concurr. Comput. Prac. Exp. 28, 3691–3706. doi: 10.1002/cpe.3879
Hansen, M. C., Wang, L., Song, X.-P., Tyukavina, A., Turubanova, S., Potapov, P. V., et al. (2020). The fate of tropical forest fragments. Sci. Adv. 6:eaax8574. doi: 10.1126/sciadv.aax8574
Jain, S., and Bhatia, M. P. S. (2013). Performance investigation of support vector regression using meteorological data. Int. J. Database Theory Appl. 6, 109–117.
Jiang, M., Hu, Z., Ding, Y., Fang, D., Li, Y., Wei, L., et al. (2012). “Estimation of vegetation water content based on MODIS: application on forest fire risk assessment,” in Proceedings of the 2012 20th International Conference on Geoinformatics, Vol. 2012, Hong Kong, 2–5. doi: 10.1109/Geoinformatics.2012.6270322
Lee, W. S., and Liu, B. (2003). “Learning with positive and unlabeled examples using weighted logistic regression,” in Proceedings of the 20th International Conference on International Conference on Machine Learning, (Palo Alto, CA: AAAI Press), 448–455.
Li, X., and Liu, B. (2003). “Learning to classify texts using positive and unlabeled data,” in Proceedings of the 18th International Joint Conference on Artificial Intelligence, (San Francisco, CA: Morgan Kaufmann Publishers Inc), 587–592.
Lin, Z., Chen, F., Li, B., Yu, B., Jia, H., Zhang, M., et al. (2019). A contextual and multitemporal active-fire detection algorithm based on Feng Yun-2G S-VISSR data. IEEE Trans. Geosci. Remote Sens. 57, 1–13. doi: 10.1109/TGRS.2019.2923248
Lin, Z., Chen, F., Niu, Z., Li, B., Yu, B., Jia, H., et al. (2018). An active fire detection algorithm based on multi-temporal FengYun-3C VIRR data. Remote Sens. Environ. 211, 376–387. doi: 10.1016/j.rse.2018.04.027
Liu, B., Dai, Y., Li, X., Lee, W. S., and Yu, P. S. (2003). “Building text classifiers using positive and unlabeled examples,” in Proceedings of the 3rd IEEE International Conference on Data Mining, (Washington, DC: IEEE Computer Society), 179.
Liu, B., Lee, W. S., Yu, P. S., and Li, X. (2002). “Partially supervised classification of text documents,” in Proceedings of the 19th International Conference on Machine Learning, (San Francisco, CA: Morgan Kaufmann Publishers Inc), 387–394.
Liu, W., Wang, S., Zhou, Y., Wang, L., Zhu, J., and Wang, F. (2016). Lightning-caused forest fire risk rating assessment based on case-based reasoning: a case study in DaXingAn Mountains of China. Nat. Hazards 81, 347–363. doi: 10.1007/s11069-015-2083-1
Manevitz, L. M., and Yousef, M. (2002). One-class svms for document classification. J. Mach. Learn. Res. 2, 139–154.
Massada, A. B., Syphard, A. D., Stewart, S. I., and Radeloff, V. C. (2013). Wildfire ignition-distribution modelling: a comparative study in the Huron-Manistee National Forest, Michigan, USA. Int. J. Wildland Fire 22, 174–183.
Mordelet, F., and Vert, J. P. (2014). A bagging SVM to learn from positive and unlabeled examples. Pattern Recognit. Lett. 37, 201–209. doi: 10.1016/j.patrec.2013.06.010
Parisien, M. A., and Moritz, M. A. (2009). Environmental controls on the distribution of wildfire at multiple spatial scales. Ecol. Monogr. 79, 127–154. doi: 10.1890/07-1289.1
Pye, J., Rauscher, H., Sands, Y., Lee, D. C., and Beatty, J. S. (2010). Advances in threat assessment and their application to forest and rangeland management. General Tech. Rep. PNW-GTR-802 2:708.
Rodrigues, M., and De la Riva, J. (2014). An insight into machine-learning algorithms to model human-caused wildfire occurrence. Environ. Model. Softw. 57, 192–201. doi: 10.1016/j.envsoft.2014.03.003
Shirazi, Z., Guo, H., Chen, F., Yu, B., and Li, B. (2017). Assessing the impact of climatic parameters and their inter-annual seasonal variability on fire activity using time series satellite products in South China (2001–2014). Nat. Hazards 85, 1393–1416. doi: 10.1007/s11069-016-2631-3
Tian, X., Zhao, F., Shu, L., and Wang, M. (2013). Distribution characteristics and the influence factors of forest fires in China. For. Ecol. Manag. 310, 460–467. doi: 10.1016/j.foreco.2013.08.025
Vuttipittayamongkol, P., and Elyan, E. (2020). Neighbourhood-based undersampling approach for handling imbalanced and overlapped data. Inf. Sci. 509, 47–70. doi: 10.1016/j.ins.2019.08.062
Wang, N., Chen, F., Yu, B., and Qin, Y. (2020). Segmentation of large-scale remotely sensed images on a Spark platform: a strategy for handling massive image tiles with the MapReduce model. ISPRS J. Photogramm. Remote Sens. 162, 137–147. doi: 10.1016/j.isprsjprs.2020.02.012
Wang, L., Li, C., Ying, Q., Cheng, X., Wang, X., Li, X., et al. (2012). China’s urban expansion from 1990 to 2010 determined with satellite remote sensing. Chinese Bull. Sci. 57, 2802–2812. doi: 10.1007/s11434-012-5235-7
Yakubu, I., and Duker, A. A. (2015). Review of methods for modelling forest fire risk and hazard. Afr. J. Environ. Sci. Tech. 9, 155–165. doi: 10.5897/AJEST2014.1820
Yool, S. R. (2001). Enhancing fire scar anomalies in AVHRR NDVI time-series data. Geocarto Int. 16, 7–14. doi: 10.1080/10106040108542177
Yu, B., and Chen, F. (2017). Fire risk prediction using remote sensed products: a case of Cambodia. Photogramm. Eng. Remote Sens. 83, 19–25 doi: 10.14358/PERS.83.1.19
Yu, B., Chen, F., and Xu, C. (2020). Landslide detection based on contour-based deep learning framework in case of national scale of Nepal in 2015. Comput. Geosci. 135:104388. doi: 10.1016/j.cageo.2019.104388
Yu, B., Yang, L., and Chen, F. (2018). Semantic segmentation for high spatial resolution remote sensing images based on convolution neural network and pyramid pooling module. IEEE J. Sel. Top. Appl. Earth Obs. Remote Sens. 11, 3252–3261. doi: 10.1109/JSTARS.2018.2860989
Yu, H., Han, J., and Chang, K. C.-C. (2002). “PEBL: positive example based learning for web page classification using SVM,” in Proceedings of the 8th ACM SIGKDD International Conference on Knowledge Discovery and Data Mining, (New York, NY: Association for Computing Machinery), 239–248. doi: 10.1145/775047.775083
Zhang, Y. P., Zhang, L. N., and Wang, Y. C. (2010). “Cluster-based majority under-sampling approaches for class imbalance learning,” in Proceedings of the 2010 2nd IEEE International Conference on Information and Financial Engineering, ICIFE 2010, (Chongqing: IEEE), 400–404. doi: 10.1109/ICIFE.2010.5609385
Keywords: natural hazards, fire, remote sensing, machine learning, support vector machine, PU-learning, big Earth data, digital disaster reduction
Citation: Shirazi Z, Wang L and Bondur VG (2021) Modeling Conditions Appropriate for Wildfire in South East China – A Machine Learning Approach. Front. Earth Sci. 9:622307. doi: 10.3389/feart.2021.622307
Received: 28 October 2020; Accepted: 26 April 2021;
Published: 09 June 2021.
Edited by:
Christos H. Halios, Public Health England, United KingdomReviewed by:
Hamid Reza Pourghasemi, Shiraz University, IranGrant James Williamson, University of Tasmania, Australia
Copyright © 2021 Shirazi, Wang and Bondur. This is an open-access article distributed under the terms of the Creative Commons Attribution License (CC BY). The use, distribution or reproduction in other forums is permitted, provided the original author(s) and the copyright owner(s) are credited and that the original publication in this journal is cited, in accordance with accepted academic practice. No use, distribution or reproduction is permitted which does not comply with these terms.
*Correspondence: Lei Wang, d2FuZ2xlaUByYWRpLmFjLmNu