 Roberto Tonini1*
 Pio Di Manna2
 Stefano Lorito1
 Jacopo Selva3
 Manuela Volpe1
 Fabrizio Romano1
 Roberto Basili1
 Beatriz Brizuela1
 Manuel J. Castro4
 Marc de la Asunción4
 Daniela Di Bucci5Mauro Dolce5
 Alexander Garcia3
 Steven J. Gibbons6
 Sylfest Glimsdal6
 José M. González-Vida7
 Finn Løvholt6
 Jorge Macías4
 Alessio Piatanesi1Luca Pizzimenti1
 Carlos Sánchez-Linares4Eutizio Vittori2
- 1Istituto Nazionale di Geofisica e Vulcanologia, Sezione di Roma 1, Roma, Italy
- 2Istituto Superiore per la Protezione e la Ricerca Ambientale, Roma, Italy
- 3Istituto Nazionale di Geofisica e Vulcanologia, Sezione di Bologna, Bologna, Italy
- 4Dpto. de Análisis Matemático, Estadística e Investigación Operativa y Matemática Aplicada, Facultad de Ciencias, Universidad de Málaga, Málaga, Spain
- 5Dipartimento della Protezione Civile, Rome, Italy
- 6Norwegian Geotechnical Institute, Oslo, Norway
- 7Dpto. de Matemática Aplicada, ETSII, Universidad de Málaga, Málaga, Spain
Inundation maps are a fundamental tool for coastal risk management and in particular for designing evacuation maps and evacuation planning. These in turn are a necessary component of the tsunami warning systems’ last-mile. In Italy inundation maps are informed by a probabilistic tsunami hazard model. Based on a given level of acceptable risk, Italian authorities in charge for this task recommended to consider, as design hazard intensity, the average return period of 2500 years and the 84th percentile of the hazard model uncertainty. An available, regional-scale tsunami hazard model was used that covers the entire Italian coastline. Safety factors based on analysis of run-up variability and an empirical coastal dissipation law on a digital terrain model (DTM) were applied to convert the regional hazard into the design run-up and the corresponding evacuation maps with a GIS-based approach. Since the regional hazard cannot fully capture the local-scale variability, this simplified and conservative approach is considered a viable and feasible practice to inform local coastal risk management in the absence of high-resolution hazard models. The present work is a first attempt to quantify the uncertainty stemming from such procedure. We compare the GIS-based inundation maps informed by a regional model with those obtained from a local high-resolution hazard model. Two locations on the coast of eastern Sicily were considered, and the local hazard was addressed with the same seismic model as the regional one, but using a higher-resolution DTM and massive numerical inundation calculations with the GPU-based Tsunami-HySEA nonlinear shallow water code. This study shows that the GIS-based inundation maps used for planning deal conservatively with potential hazard underestimation at the local scale, stemming from typically unmodeled uncertainties in the numerical source and tsunami evolution models. The GIS-based maps used for planning fall within the estimated “error-bar” due to such uncertainties. The analysis also demonstrates the need to develop local assessments to serve very specific risk mitigation actions to reduce the uncertainty. More in general, the presented case-studies highlight the importance to explore ways of dealing with uncertainty hidden within the high-resolution numerical inundation models, e.g., related to the crude parameterization of the bottom friction, or the inaccuracy of the DTM.
Introduction
Tsunami early warning systems (TEWS) play a significant role in protecting coastal areas from the tsunami threat. The first TEWS was developed for the Pacific Ocean after the tsunami following the Mw 8.6 Aleutian Islands earthquake on the April 1, 1946. Since then, the development of increasingly accurate and reliable TEWS was strongly fostered under the lead of United Nations international agencies, in collaboration with the Member States, in particular after the devastating December 26, 2004 Indian Ocean tsunami. These political efforts, together with rapid technological developments during recent decades, increased the number of TEWS worldwide and their monitoring capabilities, extending the coverage of tsunami monitoring activities to virtually all the oceans worldwide (Bernard and Titov, 2015; Angove et al., 2019; Mulia and Satake, 2020).
Within the framework of the Intergovernmental Coordination Group for the Tsunami Early Warning and Mitigation System in the North-eastern Atlantic, the Mediterranean and connected seas (ICG/NEAMTWS), the Italian Tsunami Alert Center at the Istituto Nazionale di Geofisica e Vulcanologia (CAT-INGV) started operating 24/7 from October 1, 2014 as Candidate Tsunami Service Providers (TSPs) for the NEAM region (North-eastern Atlantic, the Mediterranean and connected seas, Bernardi et al., 2015; Amato, 2020). CAT-INGV is the upstream component of the Italian Tsunami Warning System (SiAM; see also the national implementing decrees of SiAM directive, DPCM, 2017; Dipartimento della Protezione Civile, 2018), constituted also by the Italian Civil Protection Department (DPC) and the Italian Institute for Environmental Protection and Research (ISPRA). As the other NEAM TSPs (CENALT, France; NOA, Greece; KOERI, Turkey; IPMA, Portugal), CAT-INGV is committed to deliver messages for potential earthquake-generated tsunamis, containing the alert levels and the estimated time of arrival at preselected forecast points along the coasts. The two alert levels established by the ICG/NEAMTWS agency are advisory/orange (tsunami runup ≤ 1 m) and watch/red (tsunami runup >1 m). Once an alert message has been generated, it is disseminated by CAT-INGV to the IOC/UNESCO subscriber Member States, and by DPC over Italian territory. DPC also carries out specific actions related to the forecasted alert levels (Dipartimento della Protezione Civile, 2018).
An upper limit for the expected runup is not specified by the NEAMTWS protocols and alert messages, which only forecast a state of significant inundation with runup >1 m. Coastal risk managers must then define this limit by identifying the inundation-prone areas with evacuation maps. Since it is impossible to define a deterministic maximum inundation, an upper boundary must be set as the evacuation distance which has a certain probability of being exceeded in a given time frame, in principle corresponding to a given risk reduction level for the same vulnerability and exposure levels. The probabilistic hazard frameworks are ideal in this respect, as they provide estimates of the exceedance probability for given intensity measures and for specific time frames. Such an approach, which we can refer to as a “uniform hazard”, is commonly adopted for seismic building codes. For example, the design seismic action is often set as the one having a probability of being exceeded of 0.1 (10%) or 0.02 (2%) in 50 years (corresponding respectively to 475 and 2,475 years Average Return Period, hereinafter ARP), mostly within a “multi-tier” approach related to different performance levels, e.g., ranging from life-safety to building collapse as a target (ASCE/SEI 7-16, 2017; NTC, 2018). The use of a homogeneous risk target is sometimes advocated: it would be more consistent with the final use of seismic design maps to adopt a “uniform risk” assumption, in which the design ground motions are defined to provide the same level of risk everywhere, e.g., the annual probability of collapse (e.g., Luco et al., 2007). More recently, an approach based on probabilistic tsunami hazard analysis has been adopted in tsunami building codes, considering different performance levels, similarly to what is done for seismic design, and assuming a design probability of 0.02 (2%) in 50 years corresponding to the longer ARP of 2,475 years for the collapse prevention performance level (Chock et al., 2016). Authorities and stakeholders can use the same principles for land-use design (e.g., Geist and Lynett, 2014).
A specific difficulty with Probabilistic Tsunami Hazard Analysis (PTHA) is that representing the seismic source variability can require up to millions of scenarios, especially in areas where the crustal intermediate-magnitude seismicity provides a relevant contribution (Selva et al., 2016). Although the use of numerical simulations is by far the most accredited tool to model tsunami propagation and inundation (Behrens and Dias, 2015), a massive use of tsunami simulations on high-resolution topo-bathymetric grids still represents a challenge in several practical applications because of the computational cost. Inundation simulations are also subject to the availability of very accurate and detailed DTMs both on- and off-shore of the sites of interest which, even when available, may represent an important uncertainty source (e.g., Griffin et al., 2015; Song and Goda, 2019), also related to the choice of appropriate roughness values (e.g., Kaiser et al., 2011; Griffin et al., 2015). Therefore, the combination of numerical simulations offshore and rapid approximated methods onshore is a common practice as alternative to explicit numerical inundation simulations (Grezio et al., 2017, Grezio et al., 2020).
The method proposed by the Italian DPC to local authorities to define evacuation maps (Dipartimento della Protezione Civile, 2018) embodies this philosophy: 1) the design probability for the watch/red alert is fixed through the selection of the 2,500 years ARP and 84th percentile of the epistemic uncertainty from a regional and relatively coarse-scale Seismic PTHA (SPTHA, in the current implementation is the NEAMTHM18, NEAM Tsunami Hazard Model 2018; Basili et al., 2018; Basili et al., 2019; Basili et al., 2021), evaluated off-shore and amplified to the coast; 2) the extension of the evacuation area is the outcome of a chain of simplified and conservative approximations, including some “safety factors”. The details of the procedure are subsequently provided in this paper. Very similar approaches that inspired the Italian authorities have been adopted by New Zealand (Leonard et al., 2008; Fraser and Power, 2013; MCDEM, 2016) and Samoa (Wright et al., 2011). Defining inundation maps is not only important for the population to know where people have to evacuate in case of a tsunami alert, but it is also important for the local contingency planning, e.g., to identify tsunami-safe emergency management locations (local emergency centers and areas), further than for coastal planning in general.
The aim of the present work is to evaluate the performance of the Italian evacuation maps, as defined at the national level, in comparison with two more detailed case-studies at local scale. Starting from the same seismic model defined in the regional NEAMTHM18, a site-specific SPTHA, including massive high-resolution numerical inundation simulations (Gibbons et al., 2020), is here used to obtain the inundation maps for several different design levels, for two selected target sites in South-Eastern Sicily, Italy. These sites are the coastal zones in the vicinity and around the cities of Catania and Siracusa, two touristic, commercial and industrial urbanized areas, comprising harbour infrastructures and heterogeneous morphological terrain features (e.g., flat beaches, cliffs, jagged inlets), representing a test for a broad range of different coastal settings. This area has experienced destructive tsunamis in the past, as documented by both historical (Maramai et al., 2014; Maramai et al., 2019) and geological (De Martini et al., 2012; Polonia et al., 2017) evidence, with a rich and still open scientific debate on the causative sources of the most important events, in particular regarding the earthquakes occurred in 1693 and 1908 (Piatanesi and Tinti, 1998; Gutscher et al., 2006; Gerardi et al., 2008; Favalli et al., 2009; Pino et al., 2009; Billi et al., 2010; Tonini et al., 2011; Aloisi et al., 2013; Convertito and Pino, 2014; Ridente et al., 2014; Meschis et al., 2019).
The local SPTHA quantifies the exceedance probability as a function of the inland tsunami intensity (here, the maximum inundation height) on a regular grid of points at the simulation resolution (here, 10 m at the two target sites). This allows the extraction of high-resolution inundation lines corresponding to different ARPs and epistemic uncertainty percentiles, including the ones recommended for planning by the Italian DPC, for comparison with the evacuation maps derived from the simplified method. Uncertainties not explicitly modeled in the local SPTHA are also subsequently considered and estimated to first order. To discriminate between different uncertainty sources, the procedure used for the official inundation zones, originally applied to all the Italian coasts using a coarser DTM, is here applied to the same high-resolution DTM used for the numerical inundation simulations, yet based on the same hazard input. This updated version of the inundation maps can be compared with those obtained through local SPTHA to deal with the method approximations, and with the official maps to directly address the impact of DTM uncertainties.
Development of Inundation Maps
In this section, the basic elements defining the inundation maps are introduced. We describe the procedure developed to design the maps adopted for tsunami risk-management in Italy from regional SPTHA, as well as the methodology for developing inundation maps starting from site-specific high-resolution SPTHA. In the following, for convenience, any quantity derived from the Italian authorities’ indications to define the inundation maps (i.e., the 2,500 years ARP and the 84th percentile) are labeled as “design” quantities.
The Tsunami Hazard Regional Model
The indications issued by the Italian DPC for evacuation maps (Dipartimento della Protezione Civile, 2018) are based on a regional SPTHA model. In their current implementation, the reference SPTHA is the NEAMTHM18 (Basili et al., 2018). The NEAMTHM18 was produced in the frame of the TSUMAPS-NEAM project (http://www.tsumaps-neam.eu/; Basili et al., 2019). The model is the first long-term SPTHA for the entire NEAM region, covering a very high number of seismic sources and estimating inundation probability at a relatively coarse regional scale.
In NEAMTHM18, well-constrained seismic sources (as subduction interfaces or major fault systems) and diffuse crustal seismicity are treated separately and the epistemic uncertainty is estimated using an ensemble modeling technique (Selva et al., 2016; Basili et al., 2021). Offshore sea surface elevations are obtained by linear combinations of pre-computed elementary source scenarios (Molinari et al., 2016), which are propagated with the 2D shallow-water tsunami numerical code Tsunami-HySEA (de la Asunción et al., 2013), up to water depths of 50 m along a set of points of interest (POIs) spaced at about 20 km from each other (a subset of these points in the Mediterranean Sea is shown in Figure 1A). Offshore sea surface elevations are then transformed into maximum inundation height (MIH) through a simplified amplification factor (AF) method accounting for amplitudes, periods and polarities of the incident waves (Glimsdal et al., 2019).
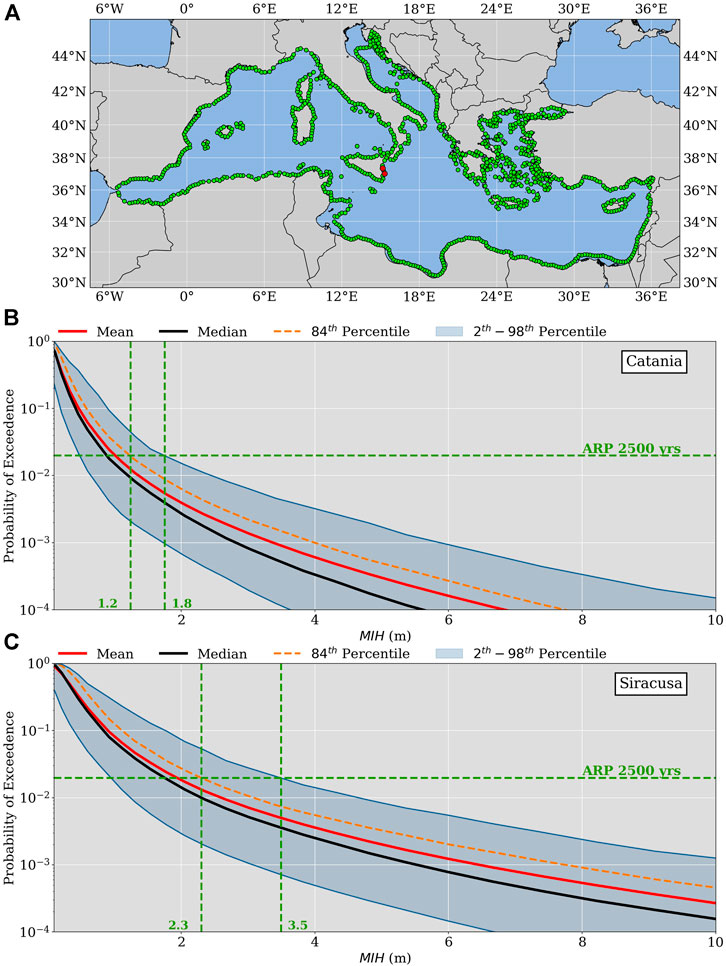
FIGURE 1. Location of the points of interest (POIs, green dots) in the NEAMTHM18 tsunami hazard model for the Mediterranean area only [panel (A)]: the two POIs in front of Catania and Siracusa, used for the present case-study, are highlighted (red dots); the corresponding hazard curves [Catania, panel (B), and Siracusa, panel (C), respectively] are shown for different quantities: the mean (red line), the median (black line), the 84th percentile (orange line) and the interval 2nd–98th percentiles (blue area). For both POIs,
The final results consist of a set of hazard curves (probability of exceedance in 50 years vs. MIH) at each POI. This set describes the epistemic uncertainty on the hazard, and it is summarized through the mean, median, and different percentiles (Figures 1B,C). NEAMTHM18 includes several sources of uncertainty, among which those related to the seismic recurrence modeling, to the simplified modeling of the seismic source, as well as to the tsunami modeling (generation, propagation and inundation). Noteworthy, several rather strong approximations exist, which can be considered appropriate for a regional-scale SPTHA. Full details can be found in Basili et al. (2021), in the TSUMAPS-NEAM project documentation (Basili et al., 2019), and in several studies dealing with specific aspects of the SPTHA methodology used therein (e.g., Molinari et al., 2016; Selva et al., 2016; Davies et al., 2017; Glimsdal et al., 2019; Scala et al., 2020; Taroni and Selva, 2020; Tonini et al., 2020).
Design of Italian Inundation Maps
Inundation maps in Italy feature two zones, corresponding to the advisory/orange and watch/red alert levels, respectively (Dipartimento della Protezione Civile, 2018). All the inundation maps are available through the Tsunami Map Viewer (http://sgi2.isprambiente.it/tsunamimap).
The extent of the advisory/orange zone is nominally set to 1 m elevation everywhere, to be consistent with the definition of advisory alert level (runup ≤1 m). Currently, to conservatively accommodate uncertainties of the DTM, the boundary of the advisory inundation zone is fixed where the DTM features a topography of 2 m above the average sea level.
The watch/red zone should define the inland extension of the potentially inundated area after an alert message forecasting a runup >1 m. To define an upper limit for the inundation distance the following procedure is adopted:
1. From NEAMTHM18, the MIH with the 2,500 years ARP at the 84th percentile of the epistemic uncertainty distribution is selected for each POI along the Italian coasts (among those in Figure 1A).
2. A design
3. The design
4. The design runup
5. The local inundation zone is obtained for
6. To find the inundation zone corresponding to
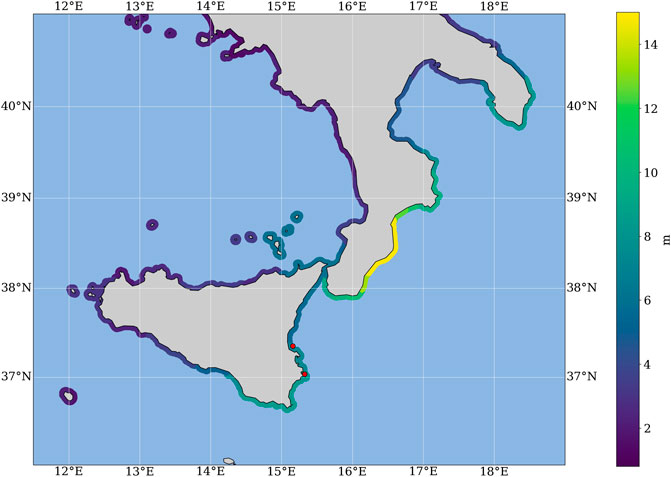
FIGURE 2. Map showing the results of the searching radius algorithm described in Design of Italian Inundation Maps section. Each coastline point is associated to a value of
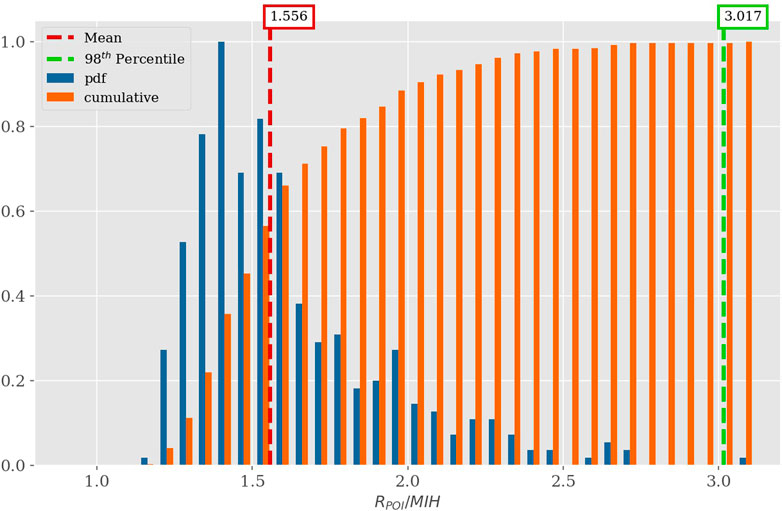
FIGURE 3. Empirical probability density function (EPDF, blue bars) and empirical cumulative density function (ECDF, orange bars) of the ratio between the maximum Run-up (
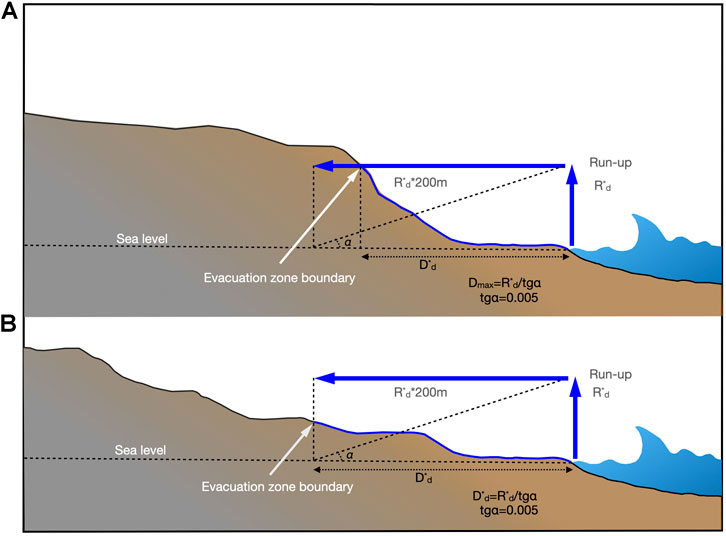
FIGURE 4. Sketch of the method used to drawn inundation maps:
This first generation of the Italian tsunami inundation maps for emergency planning was elaborated using a composite DTM combining elevation data from different sources. High-resolution LIDAR data (1 m and 2 m resolution with a vertical accuracy as good as 25 cm), provided by MATTM (Ministry of the Environment) for the coastal zone only, have been integrated with the best available mid-resolution DTMs (2, 5, 10 m), provided by single administrative Regions of Italy, in order to obtain the complete coverage of the potential inundation areas. Other input data are the trace of the main waterways (scale 1:10.000) as an update of the national river networks of ISPRA-SINAnet (http://www.sinanet.isprambiente.it/it/sia-ispra/download-mais/reticolo-idrografico/view), and the coast line derived from satellite and aerial images analysis available for the year 2009 at the Geoportale Nazionale (http://www.pcn.minambiente.it/mattm/), used only when applying the GIS-based procedure to achieve greater precision (item 6. above), while it was not deemed necessary to replace the less precise ISTAT coastline of (item 2.), since the latter is used in conjunction with search radii of 40 km. For both the segments of coast here considered as case-studies in south-eastern Sicily we used the hazard curves of the two nearest POIs to the locations (Figure 1) and the run-up design value approximated for excess to the next discrete values is
Inundation Maps for the Case-Studies in South-Eastern Sicily
To test the performance of the method described in the previous section, in this study we produce several new inundation map versions.
A first version, coined GIS-based version, is obtained by repeating the procedure described in Design of Italian Inundation Maps section, but adopting a more accurate local DTM. More specifically, we used the same high-resolution DTM (10 m) implemented in the tsunami simulations to compute local SPTHA (see next section and also Gibbons et al., 2020). This DTM was produced by mosaicking rasters with different horizontal cell resolutions and then resampling them to a 10 m horizontal cell. For the land portion the used datasets were a 1 m cell resolution raster near the coastal zone (The Geology and Geotechnologies Laboratory, INGV, http://www.ingv.it/it/monitoraggio-e-infrastrutture-per-la-ricerca/laboratori/laboratorio-geologia-e-geotecnologia, provided the LiDAR dataset in the framework of an agreement with the Ministry of the Environment, Earth and Sea, http://www.pcn.minambiente.it - Italian National Geoportal, owner of the data) with the 25 m horizontal cell resolution EU-DEM Digital Elevation Model over Europe (EU-DEM-4258: 1 arcsec - 5 arcsec, EU-DEM-3035: 25 m, color shaded DEM derived from the EU-DEM-3035: 25m, produced using Copernicus data and information funded by the European Union - EU-DEM layers); for the offshore portion the DTM was obtained by interpolating the data available from the MaGIC project (foglio 32 e foglio 33, data from the MaGIC project, Dipartimento della Protezione Civile, http://dati.protezionecivile.it/) and then mosaicking the result to the EMODnet Digital Bathymetry raster (EMODnet Bathymetry Consortium, 2018). For both case-studies, we used the
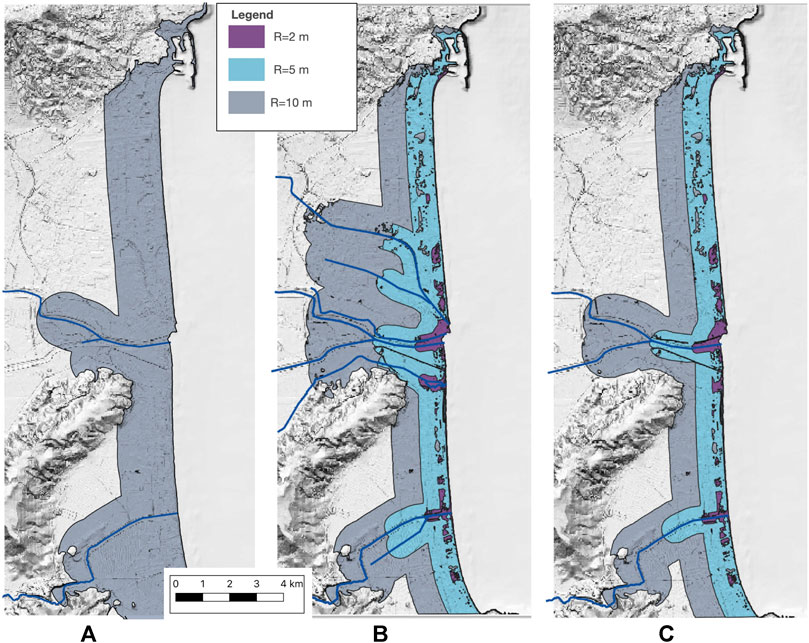
FIGURE 5. The first generation inundation map of Catania [panel (A)] is compared with the GIS-based version inundation maps calculated for this work, using the more detailed DTM described in Inundation Maps for the Case-Studies in South-Eastern Sicily section, for different values of
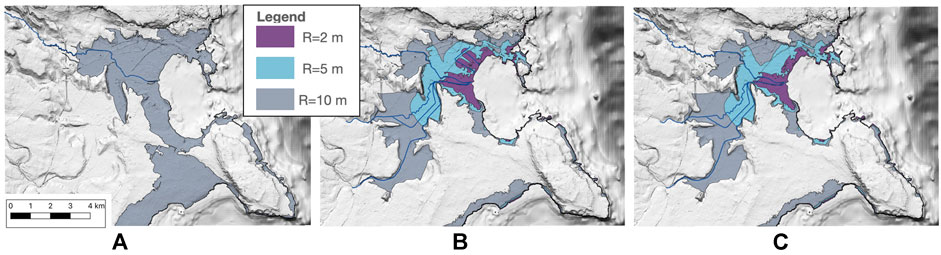
FIGURE 6. Same as Figure 5, but for Siracusa.
A second version of inundation maps is estimated adopting the same procedure, but using specific values of
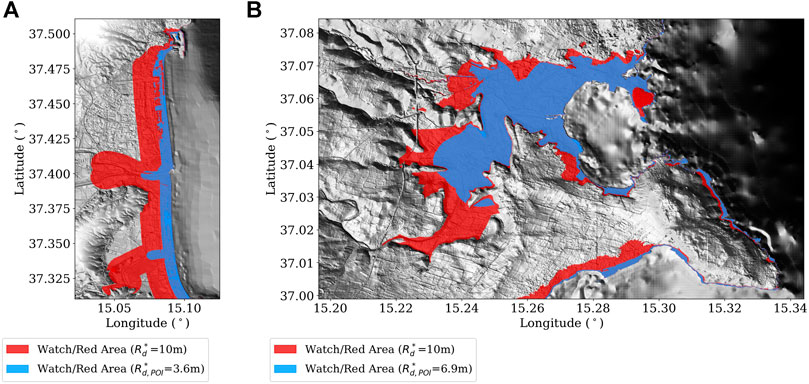
FIGURE 7. Comparison between the Watch/Red areas designed for
We anticipate that a third version is obtained for the values of
Inundation Maps From Local High-Resolution NLSW-Based SPTHA for Catania and Siracusa
Another version of inundation maps, coined SPTHA-based inundation maps, is obtained using a classical approach (e.g., González et al., 2009) directly from the local SPTHA, based on explicit, high-resolution (NLSW) modeling of the tsunami inundation (Gibbons et al., 2020).
The use of a regional SPTHA as input for a higher-resolution local SPTHA allows for a pre-screening of the full variability of seismic sources, selecting only those which contribute significantly to the hazard at the site of interest. Reducing the number, or the computational cost, of high-resolution tsunami inundation simulations is often essential. In this respect, techniques based on cluster analysis (Lorito et al., 2015; Volpe et al., 2019; Williamson et al., 2020) or statistical emulators (Sarri et al., 2012) have been proposed. In the present work, given the availability of massive High-Performance Computing resources, a significant reduction of simulations is obtained with a hazard disaggregation approach (Gibbons et al., 2020).
The number of scenarios defined in NEAMTHM18 for the Mediterranean basin is of the order of 107, making the computational task potentially extremely demanding. However, the tsunamis from many of these scenarios are negligible at the sites of interest. A first significant reduction is obtained by selecting only the scenarios which produce a tsunami elevation greater than 0.01 m at the selected target POIs (red dots in Figure 8), resulting in little more than 106 scenarios, most of which in common between Catania and Siracusa, see Table 1. Then, hazard disaggregation is performed to select only the scenarios which reproduce a prescribed fraction of the total hazard (99%) simultaneously at the two POIs in the MIH interval between 1 m and 4 m (Figure 9). The reason for choosing this interval is that it should guarantee the inclusion of the scenarios which significantly contribute to the hazard curves around the design 2,500 years ARP and 84th percentile of the model uncertainty selected for planning, (Figures 1B,C). This is exactly the same approach followed by Gibbons et al. (2020), and most of the numerical simulations are the same as well. As already discussed by Gibbons et al. (2020), given that the selection and the hazard reproduction are operated at two offshore locations, we cannot expect to perfectly reproduce the hazard everywhere onshore, because the difference between two tsunami waveforms may change during inundation: for example, this can be due to non-linear effects such as wave breaking, energy dissipation during inundation, or because of co-seismic coastal uplift or subsidence. It is also worth noting that the regional hazard curve for Siracusa is significantly higher than that for Catania for the considered ARP (Figure 1). For this reason, while the MIH range between 1 and 4 m turns out to be suitable to produce the onshore hazard curves for Catania (Gibbons et al., 2020), to better reproduce the hazard for Siracusa, we also modeled the scenarios obtained from the disaggregation in the interval 4–8 m, in addition to the 1–4 m range. We may conclude that the disaggregation procedure and applied ranges turned out to be quite accurate while remaining remarkably efficient, since the scenarios to be modeled were reduced, in total, to about 46,000 (i.e., the amount of scenarios is reduced by ∼96%, see Table 1).
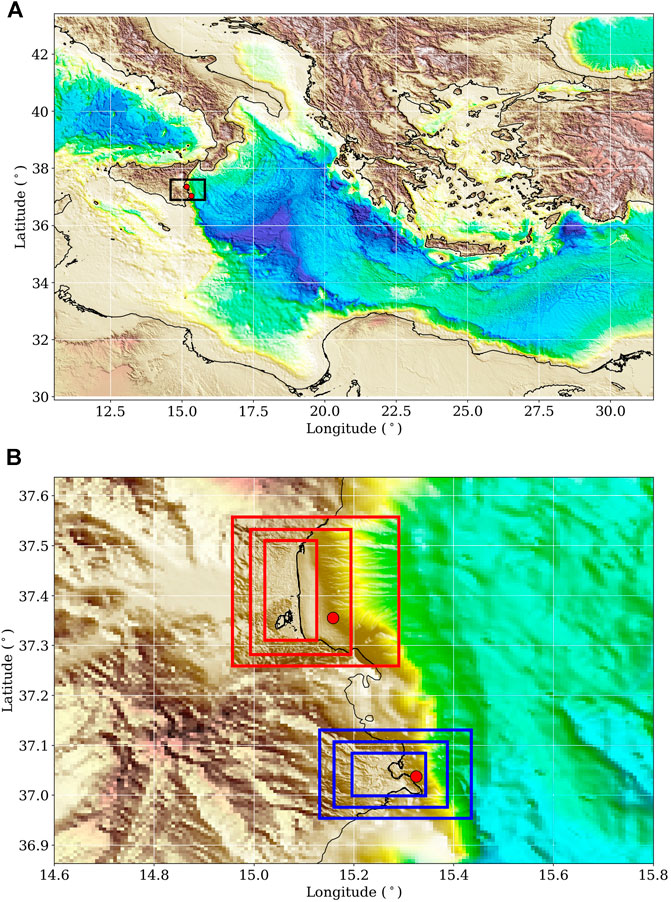
FIGURE 8. Extension of the computational domain [panel (A)] showing the selected POIs used to perform the disaggregation analysis (red dots, as in Figure 1); the target area [black rectangle in the panel (A)] is zoomed to illustrate the inner levels (2nd, 3rd and 4th) of the nested grids [panel (B)] for inundation modeling in Catania (red rectangles) and Siracusa (blue rectangles). Grid resolution is 640 m for the larger domain in the top panel and 160, 40 and 10 m for the inner levels shown in the bottom panel.
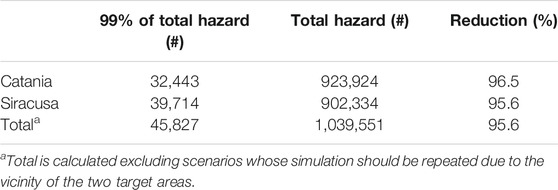
TABLE 1. Number of scenarios resulting from the disaggregation procedure representing the 99% of the hazard for both Catania and Siracusa in their respective MIH intervals. The number of required simulations with respect to the total number of scenarios representing the hazard in the same interval of MIH is strongly reduced by about 96%.
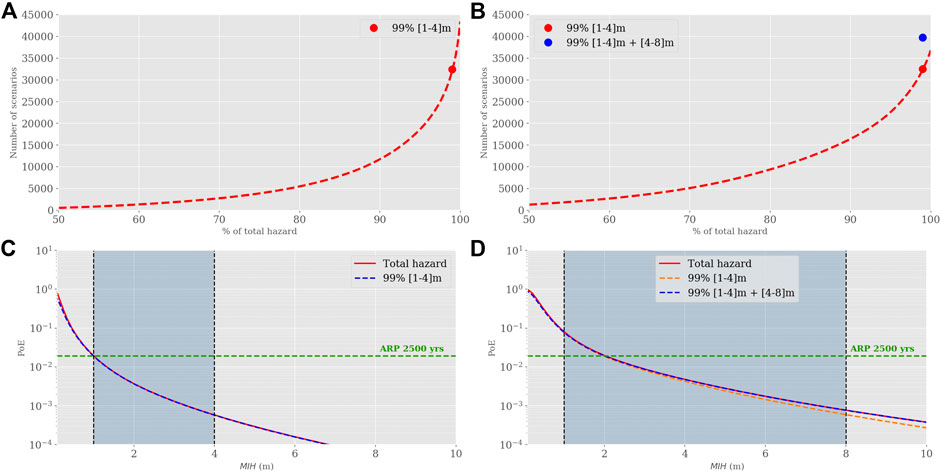
FIGURE 9. Number of scenarios needed to represent the 99% (Table 1) of the total hazard for both target sites [Catania, in panels (A) and Siracusa, in panel (B)] in the selected interval of tsunami intensity (range [1–4] m for Catania and ranges [1–4] and [4–8] m for Siracusa). The corresponding hazard curves [panels (C) and (D) for Catania and Siracusa, respectively] in the respective MIH ranges are overlapped with the ones representing the total hazard. For Siracusa results without the [4–8]m range are shown to illustrate the discrepancy with respect the total hazard curve [orange line in panel (D)] and the number of additional scenarios [blue dot in panel (B)] needed to well represent the total hazard.
For the sake of completeness, we recall that the tsunami scenarios are simulated with Tsunami-HySEA, a non-linear hydrostatic shallow-water multi-GPU code (GPU, Graphics Processing Unit; de la Asunción et al., 2013; Macías et al., 2017), exploiting a nested grid algorithm. Tsunami-HySEA models in a single code tsunami generation, open-ocean propagation and nested grid inundation using progressively finer grid resolution of the coastal areas (Macías et al., 2016). The code has undergone an intensive process of model validation and verification following, in particular, the benchmarking standards of the NTHMP, the National Tsunami Hazard and Mitigation Program, United States (Macías et al., 2017; Macías et al., 2020a; Macías et al., 2020b). Four-level nested topo-bathymetric grids were used here (Figure 8). Three of them are local grids with progressively higher resolution (160, 40, and 10 m) and one is a global grid with the coarsest resolution (640 m), ensuring the analysis of the source-to-target propagation in the open sea. The 640 m grid was derived from the GEBCO topo-bathymetry model. The finest local 10 m grid is the same presented in the previous section for the construction of the inundation maps. To guarantee depth compatibility between all the nested local grids, a bilinear resampling algorithm was then applied to the 10 m grid, producing the local intermediate grids with 40 m and 160 m cell resolution (Gibbons et al., 2020). Bottom friction is treated with a Manning’s coefficient of 0.03. The initial sea-level anomaly is obtained for each modeled seismic scenario through an elastic instantaneous dislocation model (Okada, 1992). The single-scenario Tsunami-HySEA simulation takes approximately 25 min on the MARCONI-100 supercomputer at CINECA, meaning that approximately 19,000 GPU hours were required to complete the set of selected scenarios. With 1024 simulations able to run in parallel, around 18 h of clock-time are needed to perform these calculations.
The simulation results obtained in the highest-resolution innermost grids at the two locations are then aggregated to calculate the hazard curves in each grid cell on land if reached by a minimum threshold of water (here, 0.01 m). Specifically, the hazard curves are obtained in each point x as
where dT is the exposure time (50 years as in NEAMTHM18), h is the threshold inundation height,
The same seismic model
Inundation maps are then derived by selecting the tsunami intensity corresponding to a given value of the ARP, which is the reciprocal of the mean annual rate
Finally, it is important to remark that some uncertainties associated with the tsunami source (e.g., heterogeneous material properties, variability of fault dimensions, time-dependence, non-hydrostaticity), or with the tsunami propagation and inundation modeling (e.g., limits of the NLSW model, uniform Manning coefficient, wave dispersion, details of coastal morphology) are not quantitatively addressed in the present study. Neither is addressed the impact associated with potentially inaccurate bathymetry and topography models.
Results
The main goal of our analysis was to compare the current strategy to define inundation maps, used to draw the evacuation areas for the Italian coasts and based on the regional hazard NEAMTHM18, with the hazard results obtained from local SPTHA models, hence evaluating the whole chain of adopted assumptions and approximations described in Design of Italian Inundation Maps section. This analysis was carried out in the two target areas of Catania and Siracusa.
We recall that the GIS-based inundation maps and those from the local SPTHA based on numerical simulations, which are compared to each other in this section, were obtained using the same DTM. In Inundation Maps for the Case-Studies in South-Eastern Sicily section, we have also qualitatively addressed the impact of using a different DTM and different treatments for the rivers onto the design of the inundation maps; we have observed that the latter is more influential than the differences between the DTMs (Figures 5, 6).
As described in Design of Italian Inundation Maps section, for national planning the
A first and direct comparison between the inundation maps from the local SPTHA at 2,500 years ARP for the 84th percentile (Inundation Maps From Local High-Resolution NLSW-Based SPTHA for Catania and Siracusa section) and the GIS-based inundation maps (Inundation Maps for the Case-Studies in South-Eastern Sicily section; the first version, with the same design values as for the national planning) has been performed (Figure 10). The choice of
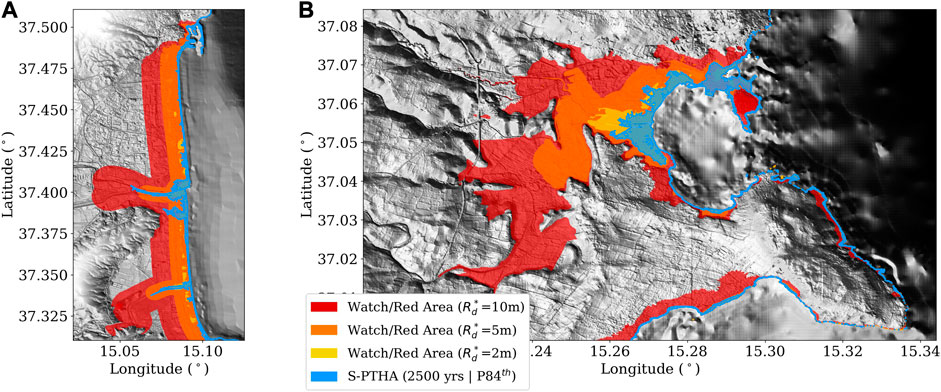
FIGURE 10. Watch/Red areas designed for different values of
Selecting different ARPs and/or different percentiles, we can quantify the extent of this discrepancy. Firstly, we compare the impact of the epistemic uncertainty modeled on the local SPTHA by using different percentiles while keeping the ARP of 2,500 years fixed (Figures 11A,B). As expected, the inundation zone for the 98th percentile extends farther than those for the 50th and the 84th percentiles. However, they remain well within the watch/red inundation area defined with
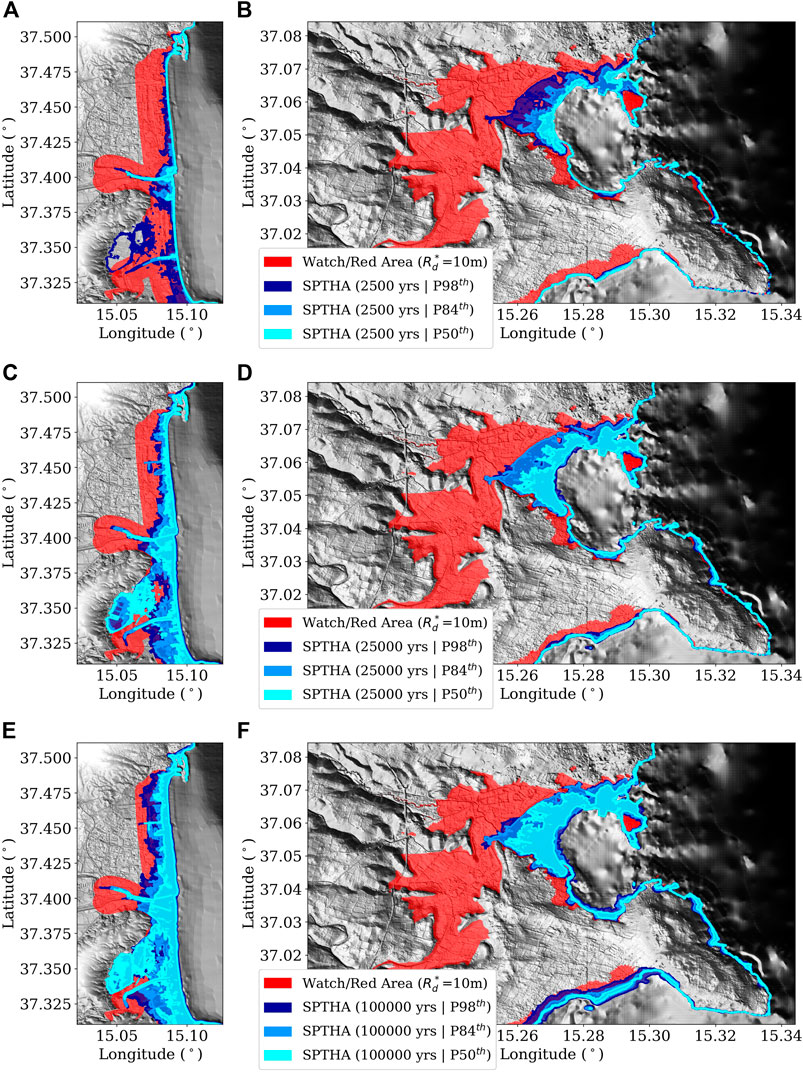
FIGURE 11. Comparison between the Watch/Red areas designed for
It is worthy to note that the effect of the epistemic uncertainty for the 100,000 years ARP is smaller than for shorter ARPs (Figure 11). The hazard curves for a single target point (Figure 1) show, as expected when dealing with relatively rare events, that the longer the ARP (smaller PoE), the larger the difference between the tsunami intensity obtained with different percentiles of the epistemic uncertainty. However, when we look at the inundation areas, we observe the opposite behaviour, with the uncertainty on the hazard intensity unexpectedly decreasing for longer ARPs. We then argue that this can be the result of an underestimation of the epistemic uncertainty of the local SPTHA, and that the discrepancy between GIS-based and SPTHA-based maps cannot be entirely due to an overestimation of the former. Indeed, we stress once again that the regional SPTHA includes the epistemic uncertainty associated with the source model (Basili et al., 2021), which is the same as in the GIS-based approach. This uncertainty relates to the earthquake mean annual rates, the difference between empirical scaling relations, the slip heterogeneity and depth-dependent features of subduction zones (Scala et al., 2020). Conversely, the local SPTHA does not include the further epistemic uncertainty treatment applied in NEAMTHM18 using amplification factors (Glimsdal et al., 2019), stemming from numerical modeling of the co-seismic displacement, tsunami generation, and tsunami evolution up to inundation. In our local SPTHA, this uncertainty is in principle reduced by the use of NLSW simulations in place of the stochastic inundation treatment included by the local amplification factors, provided that we are not introducing a bias. Several sources of epistemic uncertainty currently exist also when using numerical inundation simulations, as discussed at the end of Inundation Maps From Local High-Resolution NLSW-Based SPTHA for Catania and Siracusa section. Nevertheless, the development of a robust inclusion of epistemic uncertainty into NLSW-based SPTHA is beyond the scope of this paper. As an alternative, one could also forbear from making detailed simulations, and perform a finer-scale version of the NEAMTHM18 PTHA, with more closely-spaced POIs, to better represent the MIH uncertainty through the higher-resolution amplification factors. Here, as anticipated at the end of Inundation Maps for the Case-Studies in South-Eastern Sicily section, and similarly to Scala et al. (2020), we roughly and probably much more conservatively quantify these uncertainties following Davies et al. (2017), such as:
where
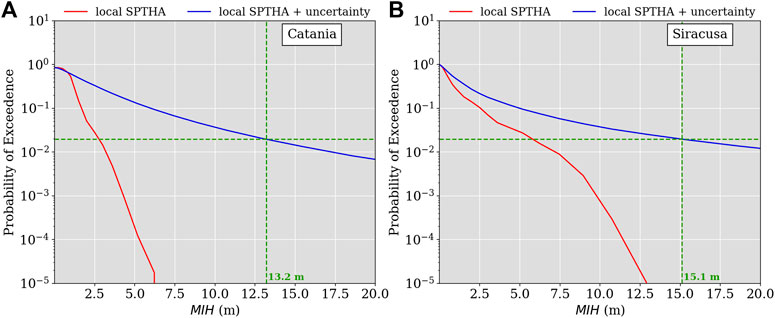
FIGURE 12. Example of hazard curves calculated on land through the local SPTHA without (red lines) and with (blue lines) the epistemic uncertainty. The selected curves are the ones corresponding to the maximum intensity in Catania (panel A, 13.2 m) and Siracusa (panel B, 15.1 m) at the ARP equal to 2,500 years (green dashed lines).
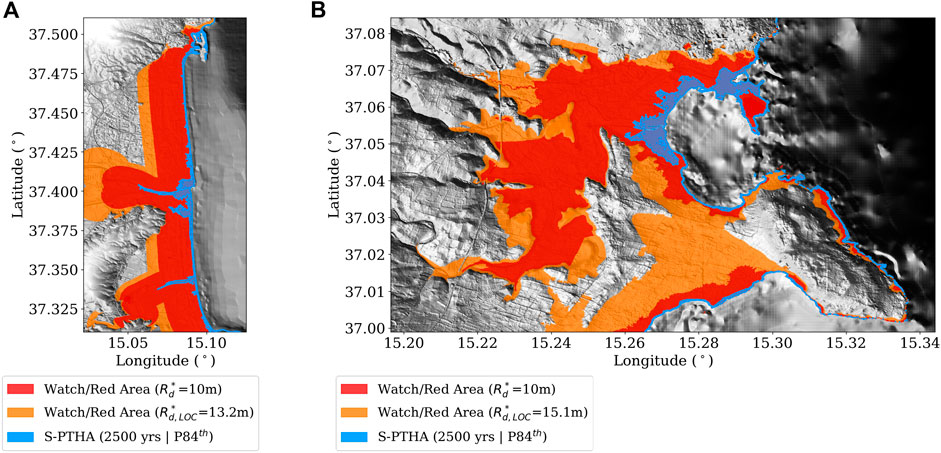
FIGURE 13. For both Catania [panel (A)] and Siracusa [panel (B)], the watch/red alert areas designed using the values of
We performed one last experiment, to check how inundation maps based on a worst-case scenario approach would compare with the GIS-based and the hybrid ones we have just introduced by adding uncertainty to the local SPTHA-based maps. We define the worst-case inundation scenario as a composite one from the envelope of all the wet grid points (with wave height >0.01 m), from all the scenarios modeled for the SPTHA, irrespective of the single scenario probability. Even though we have not traced back the scenarios contributing to the maximum inundation distance, we may argue that they are a limited number of relatively high magnitude earthquakes. Actually, such a worst-case corresponds to the SPTHA inundation map for an ARP tending to infinity, which includes all points where a non-identically-zero hazard curve exists (that is exceeding with non-zero probability the threshold of 0.01 m). This composite inundation distance from the envelope of all maximum inundation distances is shown in Figure 14, along with the other inundation maps. In the Catania plain, the worst-case inundation distance exceeds all the others with exception of limited zones along the rivers. In Siracusa, the comparison is more complex: in the northern area the worst-case inundation is similar to the extension of the
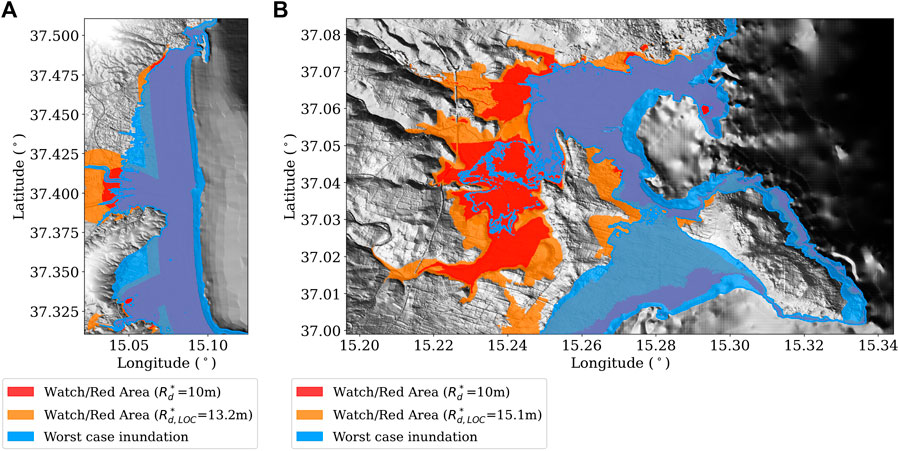
FIGURE 14. Watch/Red areas designed for
Discussion
The method for designing tsunami evacuation maps for the Italian coasts has been analyzed to understand its limits and advantages, and for addressing to what extent it can be updated through local SPTHA studies. Our findings highlight several important points that should be taken into account for both local high-resolution SPTHA and tsunami coastal and evacuation planning.
The GIS-based method is severely affected by how many secondary riverbeds (depending on their sizes or flow rates) are assumed to be relevant, also when using the same DTM (Figures 5, 6). The impact of less accurate DTM models had, at least in our case-study, a relatively smaller impact on the definition of inundation zones. However, the situation can be different in other cases depending on the extent of the discrepancies between the DTMs, so we cannot generalize this conclusion. It is noted that DTM uncertainty can be significant, and the treatment can be imposed based on the setting. In PTHA for landslides in Norway for instance, evacuation zones occur on very steep slopes, and here 10 m horizontal distance is added as an additional buffer to the computed hazard zones (e.g., Løvholt et al., 2020). This equals the resolution of the local DTM, and due to the steep slopes, this can involve additional safety factors of the order of 1 m or more.
Regional-SPTHA-informed, GIS-based, inundation maps (defined in Inundation Maps for the Case-Studies in South-Eastern Sicily section) were compared with those derived from a local SPTHA using high resolution inundation simulation, in two specific target areas. Two SPTHA models have been used: one without considering epistemic uncertainty specifically associated with numerical inundation simulations (Inundation Maps From Local High-Resolution NLSW-Based SPTHA for Catania and Siracusa section), and one, dubbed as “hybrid”, which includes a possible maximum estimate of this uncertainty (Results section). In a sense, we have defined an “error bar” for the inundation distance related to a given ARP and percentile from local SPTHA. In this way, we are preliminarily exploring the combination of deterministic tsunami modeling with the epistemic uncertainty in tsunami generation, propagation and inundation modeling. We recall that the superposition of uncertainty with deterministic simulations was already considered by some authors, yet in the context of a worst-case scenario approach (Tonini et al., 2011).
Our most important outcome is possibly that the inundation maps resulting from the GIS-based method used for national planning lie within the error bar bound by the NLWS-based model with and without uncertainty treatment. The GIS-based maps overestimated the extension of the inundation zone with respect to the maps obtained from local SPTHA with no uncertainty in the tsunami propagation model. Conversely, they underestimated the extension of the inundation zone when an upper bound of this uncertainty is considered in the hybrid approach.
Another significant outcome is that it results crucial to further characterize these uncertainties to reduce as much as possible this “error bar” or, in more classical terms, to reduce the epistemic uncertainty. Noteworthily, we find that ignoring the epistemic uncertainty of tsunami modeling may have a major impact on local hazard results, potentially producing severe underestimations. Thus, even if local SPTHA studies, in principle, reduce the uncertainty on the definition of local run-up maxima, disregarding completely the related uncertainty may be dangerous. We remark that the parametrization we used is a maximization of the epistemic uncertainty, derived from a global analysis. This highlights two main findings: 1) the important role played by the (usually neglected) uncertainty in tsunami modeling in hazard assessment and, consequently, in the definition of evacuation planning strategies and 2) the need of detailed local analyses based on local data to better calibrate the parametrization of the uncertainties. Nevertheless, it seems that in the absence of more detailed studies, the currently adopted choices for the national planning, which were the outcome of extensive discussions among the decision-makers and different scientific actors at the national level, remain fully justified.
Further considerations on such choices can be certainly made. The use of a regional SPTHA, as main input to determine the value of
A final remark would be that, as a further experiment, a worst-case inundation scenario was produced and compared to the other approaches. This worst-case is based on maximizing the estimated impact, rather than using the biggest earthquake magnitude available. This is similar to the definition of the 2,500-years Tsunami Design Zone in the United States (Wei et al., 2017), based on the PTHA offshore tsunami amplitude at 100 m depth, in which a “super-scenario” is defined according to the maxima of the maxima of all the simulated tsunamis in front of the coast and, then, the corresponding inundation is numerically calculated. As a result of the huge range of scenarios included in our seismic model, the variability for this SPTHA-based worst-case is more extensively explored than usually done for typical worst-case studies, based on a few earthquakes only. We argue that using such an approach may make sense for some critical infrastructures, yet complementing the worst-case effects by using some information from SPTHA about their ARPs. However, as for local-SPTHA, we note that the uncertainty associated with NLSW simulations is not considered also in the definition of this worst-case. On the other hand, if inundation uncertainty was introduced, the definition of worst-case would become even more difficult (e.g., log-normal are unbounded for large values), which challenges by itself the meaning of a worst-case approach not characterized by probability or ARP ranges. Without this, the meaning of the differences with an SPTHA-based approach may remain unclear.
Conclusion and Future Directions
Tsunami evacuation maps designed for the Italian coasts have been evaluated and discussed using the results of a local SPTHA performed in the two target areas of Catania and Siracusa, Sicily, for which it was possible to run high resolution tsunami inundation simulations.
We demonstrated that, in lack of a local and detailed hazard analysis, the proposed procedure to define evacuation areas has a good degree of reliability, since the resulting maps are bound by the “error bar” defined by the outputs obtained from a local SPTHA performed with and without the estimation of its epistemic uncertainty.
The analysis underlines the importance to perform local studies using the proper level of data resolution, whenever available, to best serve specific risk mitigation actions, which may require a thorough site-specific uncertainty quantification. Nevertheless, strategies to improve the input regional assessment, such as using a higher density of POIs and/or a refinement of source parameters, would not only improve the regional analysis itself but also enhance the subsequent local analyses.
Awaiting for future site-specific PTHA studies, our results highlight the importance of quantifying the uncertainties that can affect numerical inundation modeling and are instead usually neglected. Not modeling these uncertainties can introduce important biases in the hazard evaluations. However, we have only scratched the surface here, and a specific definition of an uncertainty framework for tsunami inundation models and the calibration of site-specific SPTHA with local data is still required. A detailed local analysis, with massive simulations to explore the impact of the different assumptions and uncertainties is needed. The ongoing PRACE Project “Local Probabilistic Tsunami Hazard Assessment for HPC - TsuHazAP” (see https://prace-ri.eu/hpc-access/project-access/project-access-awarded-projects/projects-awarded-under-prace-project-access-call-21/) is providing us a framework to start dealing with the above identified issues, and in particular with the sensitivity to local seismic source mechanism discretization, the effects of uncertainty on bathymetry and topography, and treatment of onshore friction.
Data Availability Statement
The raw data supporting the conclusions of this article will be made available by the authors, without undue reservation.
Author Contributions
RT, PM, SL, JS, and MV conceived the experiment and prepared the first draft of the manuscript. All the authors contributed to the implementation of the analysis, to revising the article and approved the submitted version.
Funding
The work is funded by TSUMAPS-NEAM (grant agreement ECHO/SUB/2015/718568/PREV26), ChEESE Center of Excellence (grant agreement 823844) and benefited of the agreement between Istituto Nazionale di Geofisica e Vulcanologia and the Italian Presidenza del Consiglio dei Ministri, Dipartimento della Protezione Civile (DPC). Computing resources at the Barcelona Supercomputer Center (BSC), Spain, were used under grant AECT-2020-1-0009. Some of the authors benefited also of the project “Assessment of Cascading Events triggered by the Interaction of Natural Hazards and Technological Scenarios involving the release of Hazardous Substances,” funded by the Italian Ministry MIUR PRIN (Progetti di Ricerca di Rilevante Interesse Nazionale) 2017—Grant 2017CEYPS8. Optimization and testing of the Tsunami-HySEA computational engine was partly performed using Piz Daint at CSCS (The Swiss National Computer Center) under the PRACE preparatory access N. 2010PA4869. We further acknowledge PRACE for awarding us access to Marconi100 based in Italy at Cineca (Italian National Computer Center) under the project Local Probabilistic Tsunami Hazard Assessment for HPC (TsuHazAP), PRACE award number 2020225386.
Conflict of Interest
SG, SG and FL were employed by the company Norwegian Geotechnical Institute.
The remaining authors declare that the research was conducted in the absence of any commercial or financial relationships that could be construed as a potential conflict of interest.
Acknowledgments
This study has benefited from funding provided by the Italian Presidenza del Consiglio dei Ministri, Dipartimento della Protezione Civile (DPC). This paper does not necessarily represent DPC official opinion and policies. The research leading to these results has received funding from the European Union's Horizon 2020 research and innovation programme under the ChEESE project, grant agreement No. 823844. The authors would like to thank all the participants in the SiAM meetings for their insightful contribution to the discussion: Alessandro Amato, Giovanni Arena, Fabrizio Bernardi, Luigi D’Angelo, Maurizio Ferla, Francesco Lalli, Francesco Mariano Mele, Paola Pagliara, Eleonora Pannunzi, Stefano Pintore, Marzia Santini e Antonella Scalzo.
References
Aloisi, M., Bruno, V., Cannavò, F., Ferranti, L., Mattia, M., Monaco, C., et al. (2013). Are the source models of the M 7.1 1908 Messina Straits earthquake reliable? Insights from a novel inversion and a sensitivity analysis of levelling data. Geophys. J. Int. 192, 1025–1041. doi:10.1093/gji/ggs062
Amato, A. (2020). Some reflections on tsunami Early Warning Systems and their impact, with a look at the NEAMTWS. BGTA 61, 403–420. doi:10.4430/bgta0329
Angove, M., Arcas, D., Bailey, R., Carrasco, P., Coetzee, D., Fry, B., et al. (2019). Ocean observations required to minimize uncertainty in global tsunami forecasts, warnings, and emergency response. Front. Mar. Sci. 6, 350. doi:10.3389/fmars.2019.00350
ASCE/SEI 7-16 (2017). Minimum design loads and associated criteria for buildings and other structures. Reston, Virginia: American Society of Civil Engineers.
Basili, R., Brizuela, B., Herrero, A., Iqbal, S., Lorito, S., Maesano, F. E., et al. (2018). NEAM tsunami hazard model 2018 (NEAMTHM18): online data of the probabilistic tsunami hazard model for the NEAM region from the TSUMAPS-NEAM project. Roma: Istituto Nazionale Di Geofisica E Vulcanologia.
Basili, R., Brizuela, B., Herrero, A., Iqbal, S., Lorito, S., Maesano, F. E., et al. (2019). NEAMTHM18 documentation: the making of the TSUMAPS-NEAM tsunami hazard model 2018. Roma: Istituto Nazionale di Geofisica e Vulcanologia (INGV). doi:10.5281/Q20zenodo.3406625
Basili, R., Brizuela, B., Herrero, A., Iqbal, S., Lorito, S., Maesano, F. E., et al. (2021). The making of the NEAM tsunami hazard model 2018 (NEAMTHM18). Front. Earth Sci. 8, 616594. doi:10.3389/feart.2020.616594
Behrens, J., and Dias, F. (2015). New computational methods in tsunami science. Phil. Trans. R. Soc. A 373 (2053), 20140382
Bernard, E., and Titov, V. (2015). Evolution of tsunami warning systems and products. Philos. Trans. R. Soc. Math. Phys. Eng. Sci. 373, 20140371. doi:10.1098/rsta.2014.0371
Bernardi, F., Lomax, A., Michelini, A., Lauciani, V., Piatanesi, A., and Lorito, S. (2015). Appraising the early-est earthquake monitoring system for tsunami alerting at the Italian candidate tsunami service provider. Nat. Hazards Earth Syst. Sci. 15, 2019–2036. doi:10.5194/nhess-15-2019-2015
Billi, A., Minelli, L., Orecchio, B., and Presti, D. (2010). Constraints to the cause of three historical tsunamis (1908, 1783, and 1693) in the messina straits region, sicily, southern Italy. Seismol. Res. Lett. 81, 907–915. doi:10.1785/gssrl.81.6.907
Bommer, J. J., and Abrahamson, N. A. (2006). Why do modern probabilistic seismic-hazard analyses often lead to increased hazard estimates? Bull. Seismol. Soc. Am. 96, 1967–1977. doi:10.1785/0120060043
Chock, G., Yu, G., Thio, H. K., and Lynett, P. J. (2016). Target structural reliability analysis for tsunami hydrodynamic loads of the ASCE 7 standard. J. Struct. Eng. 142, 04016092. doi:10.1061/(ASCE)ST.1943-541X.0001499
Convertito, V., and Pino, N. A. (2014). Discriminating among distinct source models of the 1908 Messina Straits earthquake by modelling intensity data through full wavefield seismograms. Geophys. J. Int. 198, 164–173. doi:10.1093/gji/ggu128
Davies, G., Griffin, J., Løvholt, F., Glimsdal, S., Harbitz, C., Thio, H. K., et al. (2017). A global probabilistic tsunami hazard assessment from earthquake sources. Geol. Soc. Lond. Spec. Publ. 456, 219–244. doi:10.1144/SP456.5
de la Asunción, M., Castro, M. J., Fernández-Nieto, E. D., Mantas, J. M., Acosta, S. O., and González-Vida, J. M. (2013). Efficient GPU implementation of a two waves TVD-WAF method for the two-dimensional one layer shallow water system on structured meshes. Comput. Fluids 80, 441–452. doi:10.1016/j.compfluid.2012.01.012
De Martini, P. M., Barbano, M. S., Pantosti, D., Smedile, A., Pirrotta, C., Del Carlo, P., et al. (2012). Geological evidence for paleotsunamis along eastern Sicily (Italy): an overview. Nat. Hazards Earth Syst. Sci. 12, 2569–2580. doi:10.5194/nhess-12-2569-2012
Dipartimento della Protezione Civile (2018). Presidenza del Consiglio dei Ministri - Dipartimento della Protezione Civile - decreto 2 ottobre 2018. Indicazioni alle Componenti ed alle Strutture operative del Servizio nazionale di protezione civile per l’aggiornamento delle pianificazioni di protezione civile per il rischio maremoto, (18A07309) (GU Serie Generale n.266 del 15-11-2018). Available at: http://www.protezionecivile.gov.it/amministrazione-trasparente/provvedimenti/dettaglio/-/asset_publisher/default/content/indicazioni-alle-componenti-ed-alle-strutture-operative-del-servizio-nazionale-di-protezione-civile-per-l-aggiornamento-delle-pianificazioni-di-prot-1 (Accessed November 15, 2018).
DPCM (2017). Direttiva Del Presidente Del Consiglio Dei Ministri 17 febbraio 2017 Istituzione del Sistema d'Allertamento nazionale per i Maremoti generati da sisma - SiAM. (17A03755) (GU Serie Generale n.128 del 05-06-2017). Available at: http://www.gazzettaufficiale.it/atto/serie_generale/caricaDettaglioAtto/originario?atto.dataPubblicazioneGazzetta=2017-06-05&atto.codiceRedazionale=17A03755 (Accessed June 05, 2017).
EMODnet Bathymetry Consortium (2018). EMODnet digital bathymetry (DTM 2018). doi:10.12770/18FF0D48-B203-4A65-94A9-5FD8B0EC35F6
Favalli, M., Boschi, E., Mazzarini, F., and Pareschi, M. T. (2009). Seismic and landslide source of the 1908 straits of messina tsunami (sicily, Italy). Geophys. Res. Lett. 36, 16304. doi:10.1029/2009GL039135
Fraser, S., and Power, W. L. (2013). Validation of a GIS-based attenuation rule for indicative tsunami evacuation zone mapping. Lower Hutt, New Zealand: GNS Science Reports, 2.
Geist, E., and Lynett, P. (2014). Source processes for the probabilistic assessment of tsunami hazards. Oceanography 27, 86–93. doi:10.5670/oceanog.2014.43
Gerardi, F., Barbano, M. S., Martini, P. M. D., and Pantosti, D. (2008). Discrimination of tsunami sources (earthquake versus landslide) on the basis of historical data in eastern sicily and southern CalabriaDiscrimination of tsunami sources on the basis of historical data in eastern sicily/southern Calabria. Bull. Seismol. Soc. Am. 98, 2795–2805. doi:10.1785/0120070192
Gibbons, S. J., Lorito, S., Macías, J., Løvholt, F., Selva, J., Volpe, M., et al. (2020). Probabilistic tsunami hazard analysis: high performance computing for massive scale inundation simulations. Front. Earth Sci. 8, 591549. doi:10.3389/feart.2020.591549
Glimsdal, S., Løvholt, F., Harbitz, C. B., Romano, F., Lorito, S., Orefice, S., et al. (2019). A new approximate method for quantifying tsunami maximum inundation height probability. Pure Appl. Geophys. 176, 3227–3246. doi:10.1007/s00024-019-02091-w
González, F. I., Geist, E. L., Jaffe, B., Kânoğlu, U., Mofjeld, H., Synolakis, C. E., et al. (2009). Probabilistic tsunami hazard assessment at Seaside, Oregon, for near- and far-field seismic sources. J. Geophys. Res. 114, C11023. doi:10.1029/2008JC005132
Grezio, A., Babeyko, A., Baptista, M. A., Behrens, J., Costa, A., Davies, G., et al. (2017). Probabilistic tsunami hazard analysis: multiple sources and global applications. Rev. Geophys. 55, 1158–1198. doi:10.1002/2017RG000579
Grezio, A., Cinti, F. R., Costa, A., Faenza, L., Perfetti, P., Pierdominici, S., et al. (2020). Multisource bayesian probabilistic tsunami hazard analysis for the gulf of naples (Italy). J. Geophys. Res. Oceans 125, e2019JC015373. doi:10.1029/2019JC015373
Griffin, J., Latief, H., Kongko, W., Harig, S., Horspool, N., Hanung, R., et al. (2015). An evaluation of onshore digital elevation models for modeling tsunami inundation zones. Front. Earth Sci. 3, 32. doi:10.3389/feart.2015.00032
Gutscher, M.-A., Roger, J., Baptista, M. A., Miranda, J. M., and Tinti, S. (2006). Source of the 1693 Catania earthquake and tsunami (southern Italy): new evidence from tsunami modeling of a locked subduction fault plane. Geophys. Res. Lett. 33, L08309. doi:10.1029/2005GL025442
Kaiser, G., Scheele, L., Kortenhaus, A., Løvholt, F., Römer, H., and Leschka, S. (2011). The influence of land cover roughness on the results of high resolution tsunami inundation modeling. Nat. Hazards Earth Syst. Sci. 11, 2521–2540. doi:10.5194/nhess-11-2521-2011
Leonard, G. S., Power, W. L., Lukovic, B., Smith, W. D., Langridge, R. M., Johnston, D. M., et al. (2008). Interim tsunami evacuation planning zone boundary mapping for the Wellington and Horizons regions defined by a GIS-calculated attenuation rule. Lower Hutt, New Zealand: GNS Science Reports, 30.
Lorito, S., Selva, J., Basili, R., Romano, F., Tiberti, M. M., and Piatanesi, A. (2015). Probabilistic hazard for seismically induced tsunamis: accuracy and feasibility of inundation maps. Geophys. J. Int. 200, 574–588. doi:10.1093/gji/ggu408
Løvholt, F., Glimsdal, S., and Harbitz, C. B. (2020). On the landslide tsunami uncertainty and hazard. Landslides 17, 2301–2315. doi:10.1007/s10346-020-01429-z
Løvholt, F., Glimsdal, S., Harbitz, C. B., Zamora, N., Nadim, F., Peduzzi, P., et al. (2012). Tsunami hazard and exposure on the global scale. Earth Sci. Rev. 110, 58–73. doi:10.1016/j.earscirev.2011.10.002
Luco, N., Ellingwood, B. R., Hamburger, R. O., Hooper, J. D., Kimball, J. K., and Kircher, C. A. (2007). Risk-targeted versus current seismic design maps for the conterminous United States. Available at: https://pubs.er.usgs.gov/publication/70045059 (Accessed November 7, 2020).
Macías, J., Castro, M. J., and Escalante, C. (2020a). Performance assessment of the Tsunami-HySEA model for NTHMP tsunami currents benchmarking. Laboratory data. Coast. Eng. 158, 103667. doi:10.1016/j.coastaleng.2020.103667
Macías, J., Castro, M. J., Ortega, S., and González-Vida, J. M. (2020b). Performance assessment of Tsunami-HySEA model for NTHMP tsunami currents benchmarking. Field cases. Ocean Model. 152, 101645. doi:10.1016/j.ocemod.2020.101645
Macías, J., Castro, M. J., Ortega, S., Escalante, C., and González-Vida, J. M. (2017). Performance benchmarking of tsunami-HySEA model for NTHMP’s inundation mapping activities. Pure Appl. Geophys. 174, 3147–3183. doi:10.1007/s00024-017-1583-1
Macías, J., Mercado, A., González-Vida, J. M., Ortega, S., and Castro, M. J. (2016). Comparison and computational performance of tsunami-HySEA and MOST models for LANTEX 2013 scenario: impact assessment on Puerto Rico coasts. Pure Appl. Geophys. 173, 3973–3997. doi:10.1007/s00024-016-1387-8
Maramai, A., Brizuela, B., and Graziani, L. (2014). The euro-mediterranean tsunami catalogue. Ann. Geophys. 57, 0435. doi:10.4401/ag-6437
Maramai, A., Graziani, L., and Brizuela Reyes, B. (2019). Italian Tsunami Effects Database (ITED): the first database of tsunami effects observed along the Italian coasts. Available at: https://ingv.maps.arcgis.com/apps/webappviewer/index.html?id=a14231712588470ea1c4454301b8294c&showLayers=ITED_Observation_Points_OP_ (Accessed September 30, 2020).
MCDEM (2016). Tsunami evacuation zones. Director’s guideline for Civil defence emergency management groups. New Zealand: Published by the Ministry of Civil Defence & Emergency Management.
Meschis, M., Roberts, G. P., Mildon, Z. K., Robertson, J., Michetti, A. M., and Faure Walker, J. P. (2019). Slip on a mapped normal fault for the 28 th December 1908 Messina earthquake (Mw 7.1) in Italy. Sci. Rep. 9, 6481. doi:10.1038/s41598-019-42915-2
Molinari, I., Tonini, R., Lorito, S., Piatanesi, A., Romano, F., Melini, D., et al. (2016). Fast evaluation of tsunami scenarios: uncertainty assessment for a Mediterranean Sea database. Nat. Hazards Earth Syst. Sci. 16, 2593–2602. doi:10.5194/nhess-16-2593-2016
Mulia, I. E., and Satake, K. (2020). Developments of tsunami observing systems in Japan. Front. Earth Sci. 8, 145. doi:10.3389/feart.2020.00145
NTC (2018). Norme Tecniche per le Costruzioni 2018. Aggiornamento delle "Norme tecniche per le costruzioni". Gazzetta Ufficiale Serie Generale n.42 del 20-02-2018 - suppl. Ordinario n. 8. Italian Building Code (in Italian). Available at: https://www.gazzettaufficiale.it/eli/id/2018/2/20/18A00716/sg/pdf (Accessed September 30, 2020).
Okada, Y. (1992). Internal deformation due to shear and tensile faults in a half-space. Bull. Seismol. Soc. Am. 82, 1018–1040.
Piatanesi, A., and Tinti, S. (1998). A revision of the 1693 eastern Sicily earthquake and tsunami. J. Geophys. Res. Solid Earth 103, 2749–2758. doi:10.1029/97JB03403
Pino, N. A., Piatanesi, A., Valensise, G., and Boschi, E. (2009). The 28 december 1908 messina straits earthquake (MW 7.1): a great earthquake throughout a century of seismology. Seismol. Res. Lett. 80, 243–259. doi:10.1785/gssrl.80.2.243
Polonia, A., Nelson, C. H., Romano, S., Vaiani, S. C., Colizza, E., Gasparotto, G., et al. (2017). A depositional model for seismo-turbidites in confined basins based on Ionian Sea deposits. Mar. Geol. 384, 177–198. doi:10.1016/j.margeo.2016.05.010
Ridente, D., Martorelli, E., Bosman, A., and Chiocci, F. L. (2014). High-resolution morpho-bathymetric imaging of the Messina Strait (Southern Italy). New insights on the 1908 earthquake and tsunami. Geomorphology 208, 149–159. doi:10.1016/j.geomorph.2013.11.021
Sarri, A., Guillas, S., and Dias, F. (2012). Statistical emulation of a tsunami model for sensitivity analysis and uncertainty quantification. Nat. Hazards Earth Syst. Sci. 12, 2003–2018. doi:10.5194/nhess-12-2003-2012
Scala, A., Lorito, S., Romano, F., Murphy, S., Selva, J., Basili, R., et al. (2020). Effect of shallow slip amplification uncertainty on probabilistic tsunami hazard analysis in subduction zones: use of long-term balanced stochastic slip models. Pure Appl. Geophys. 177, 1497–1520. doi:10.1007/s00024-019-02260-x
Selva, J., Tonini, R., Molinari, I., Tiberti, M. M., Romano, F., Grezio, A., et al. (2016). Quantification of source uncertainties in seismic probabilistic tsunami hazard analysis (SPTHA). Geophys. J. Int. 205, 1780–1803. doi:10.1093/gji/ggw107
Song, J., and Goda, K. (2019). Influence of elevation data resolution on tsunami loss estimation and insurance rate-making. Front. Earth Sci. 7, 19. doi:10.3389/feart.2019.00246
Taroni, M., and Selva, J. (2020). GR_EST: an OCTAVE/MATLAB toolbox to estimate Gutenberg–Richter law parameters and their uncertainties. Seismol. Res. Lett. 92, 508–516. doi:10.1785/0220200028
Tonini, R., Armigliato, A., Pagnoni, G., Zaniboni, F., and Tinti, S. (2011). Tsunami hazard for the city of Catania, eastern sicily, Italy, assessed by means of worst-case credible tsunami scenario analysis (WCTSA). Nat. Hazards Earth Syst. Sci. 11, 1217–1232. doi:10.5194/nhess-11-1217-2011
Tonini, R., Basili, R., Maesano, F. E., Tiberti, M. M., Lorito, S., Romano, F., et al. (2020). Importance of earthquake rupture geometry on tsunami modelling: the Calabrian Arc subduction interface (Italy) case study. Geophys. J. Int. 223, 1805–1819. doi:10.1093/gji/ggaa409
Volpe, M., Lorito, S., Selva, J., Tonini, R., Romano, F., and Brizuela, B. (2019). From regional to local SPTHA: efficient computation of probabilistic tsunami inundation maps addressing near-field sources. Nat. Hazards Earth Syst. Sci. 19, 455–469. doi:10.5194/nhess-19-455-2019
Wei, Y., Thio, H. K., Titov, V., Chock, G., Zhou, H., Tang, L., et al. (2017). “Inundation modeling to create 2,500-year return period tsunami design zone maps for the asce 7-16 standard,” in 16th World Conference on Earthquake Engineering, 16WCEE 2017, Santiago, CL, January 9–13, 2017, 10.
Williamson, A. L., Rim, D., Adams, L. M., LeVeque, R. J., Melgar, D., and González, F. I. (2020). A source clustering approach for efficient inundation modeling and regional scale probabilistic tsunami hazard assessment. Front. Earth Sci. 8, 591663. doi:10.3389/feart.2020.591663
Wright, K. C., Beavan, R. J., Daly, M. C., Gale, N. H., Leonard, G. S., Lukovic, B., et al. (2011). Filling a critical gap in end-to-end tsunami warning in the Southwest Pacific: a pilot project in Samoa to create scientifically robust, community-based evacuation maps. Lower Hutt, New Zealand: GNS Science. [GNS Science report. 2011/53 2 v].
Keywords: tsunamis, inundation maps, early warning, probabilistic hazard, numerical modeling, Italy
Citation: Tonini R, Di Manna P, Lorito S, Selva J, Volpe M, Romano F, Basili R, Brizuela B, Castro MJ, de la Asunción M, Di Bucci D, Dolce M, Garcia A, Gibbons SJ, Glimsdal S, González-Vida JM, Løvholt F, Macías J, Piatanesi A, Pizzimenti L, Sánchez-Linares C and Vittori E (2021) Testing Tsunami Inundation Maps for Evacuation Planning in Italy. Front. Earth Sci. 9:628061. doi: 10.3389/feart.2021.628061
Received: 10 November 2020; Accepted: 02 February 2021;
Published: 11 March 2021.
Edited by:
Clara Armaroli, University Institute of Higher Studies in Pavia, ItalyReviewed by:
Marcello Di Risio, University of L’Aquila, ItalyGiuseppe Bilotta, National Institute of Geophysics and Volcanology, Italy
Copyright © 2021 Tonini, Di Manna, Lorito, Selva, Volpe, Romano, Basili, Brizuela, Castro, de la Asunción, Di Bucci, Dolce, Garcia, Gibbons, Glimsdal, González-Vida, Løvholt, Macías, Piatanesi, Pizzimenti, Sánchez-Linares and Vittori. This is an open-access article distributed under the terms of the Creative Commons Attribution License (CC BY). The use, distribution or reproduction in other forums is permitted, provided the original author(s) and the copyright owner(s) are credited and that the original publication in this journal is cited, in accordance with accepted academic practice. No use, distribution or reproduction is permitted which does not comply with these terms.
*Correspondence: Roberto Tonini, cm9iZXJ0by50b25pbmlAaW5ndi5pdA==