 Luqing Wang
 Qinglin Zhao1*
 Si Gao
 Wei Zhang
- 1Faculty of Information Technology, Macau University of Science and Technology, Macau, China
- 2School of Atmospheric Sciences, and Key Laboratory of Tropical Atmosphere-Ocean System, Ministry of Education, Sun Yat-sen University, Zhuhai, China
- 3Southern Marine Science and Engineering Guangdong Laboratory (Zhuhai), Zhuhai, China
- 4IIHR–Hydroscience & Engineering, The University of Iowa, Iowa City, IA, United States
- 5Department of Plants, Soils and Climate, Utah State University, Logan, UT, United States
The compound heat wave and extreme precipitation events are responsible for severe damages to the environment and human societies. Although major advances have been made in understanding the compound extremes (e.g., drought and heat wave), little is known about two types of extremes synchronized/connected in different regions in China. Here we identify a new type of compound extreme termed as “remote compound extreme” with the aid of a new extreme value detection method that combines isolated forest and quantile statistics. The new compound extremes are reflected by a statistically significant correlation (i.e., 0.52) between heat wave in the Pearl River Delta and extreme precipitation in the Yangtze River Delta. The remote compound extreme may be tied to the western Pacific subtropical high that modulates typhoons, surface temperature in the Pearl River Delta and extreme precipitation in the middle and lower reaches of the Yangtze River.
1. Introduction
Extreme weather and climate events have devastating effects, which have been projected to intensify under climate change (Murray and Ebi, 2012; National Academies of Sciences and Medicine, 2016; Stott, 2016). Extreme events like heat waves may claim thousands of lives every year and destroy ecological systems (Gasparrini and Armstrong, 2011; Peng et al., 2011; Ma et al., 2015). This is also true for extreme precipitation related to tropical cyclones, atmospheric rivers, monsoonal systems associated with flash floods across the globe (Christensen and Christensen, 2003; Teegavarapu, 2012; Yin et al., 2018; Zhang et al., 2018).
Mounting evidence has shown that extreme weather events are connected, rather than independent or isolated (Leonard et al., 2014; Zscheischler and Seneviratne, 2017; AghaKouchak et al., 2020; Raymond et al., 2020; Zscheischler et al., 2020). Over the past years, a new type of extreme events, so-called compound extreme, has been identified (Leonard et al., 2014; Zscheischler and Seneviratne, 2017; AghaKouchak et al., 2020; Raymond et al., 2020; Zscheischler et al., 2020), leading to cascading effects on human and the environment (AghaKouchak et al., 2018). Therefore, a better understanding of this new type of extreme climate events can pave the road for projecting future climate risk assessment.
Recent studies have documented compound extreme including concurrent drought and heat wave (Fischer et al., 2007), tropical cyclone and heat waves in the future climate (Matthews et al., 2019), concurrent wind and precipitation extremes (Martius et al., 2016), concurrent heat and air pollution (Zhong et al., 2017), heat stress followed by floods in the central United States (Zhang and Villarini, 2020), and precipitation and storm surge (Wahl et al., 2015; Lentz et al., 2016). Because these extremes have been identified in the same spatial region/domain, it is still unclear regarding whether compound extremes could be connected and located in different regions.
The Pearl River Delta in South China has been frequently attacked by heat waves (Sun et al., 2017; You et al., 2017; Liu et al., 2018; Deng et al., 2020). Moreover, the Yangtze River Delta is affected by the Meiyu belt that may lead to fluvial flooding (Ge et al., 2008; Han et al., 2015; Wang and Gu, 2016; Yin et al., 2016), with the 2020 summer flooding that has wreaked havoc in China (Guo et al., 2020; Wei et al., 2020). We are yet to understand whether the heat wave (extreme heat) in the former region relates to the extreme precipitation in the later region. We will examine whether, the extent to which and how the heat wave events in the Pearl River Delta are connected to extreme precipitation in the middle and lower reaches of the Yangtze River.
Moreover, the definition of extreme events (e.g., what precipitation is extreme) may lead to large uncertainties in analysis results (Rivas et al., 2008; Stephenson et al., 2008; Pendergrass, 2018). Here we propose a new extreme value detection method that combines machine learning (i.e., isolated forest) and statistical methods. The extreme detection method is an advanced machine learning algorithm, that identifies the outlier set, followed by using the quantile function to determine the critical point of the extreme value from the outlier set (Liu et al., 2008, 2012). Therefore, the main objective of this study is to identify and investigate a new type of compound extreme (termed as “remote compound extreme”) in China using machine learning technologies (i.e., isolated forest).
In what follows, the study area and data source, methods are introduced in section 2. In section 3, we give the analysis results and their interpretations. The paper is then concluded by a summary and discussion in section 4.
2. Data and Methodology
2.1. Study Area and Data Source
The present study focuses on extreme weather events that are connected across two regions (i.e., the Pearl River Delta and the Yangtze River Delta). The study area of this research thus covers the middle and lower reaches of the Yangtze River and the Pearl River Delta. We select daily temperature data in the Pearl River Delta region and daily precipitation data in the middle and lower reaches of the Yangtze River region, during June and July from 1979 to 2020.
We obtain daily precipitation and temperature data from the European Center for Medium-Range Weather Forecasts (ECMWF) ERA-5 reanalysis data with a spatial resolution of 0.25°. The 500-hPa geopotential height, 850 hPa winds and 500 hPa vertical velocity (omega) are also used to diagnose large-scale circulation that is conducive to extreme precipitation and temperature events across the study regions. Typhoon information is obtained from the Shanghai Typhoon Institute best track data.
2.2. A New Extreme Detection Method
This paper combines the isolated forest method and the quantile statistical method to propose a new extreme detection method.
2.2.1. Isolation Forest
In this paper, we use the isolated forest algorithm (Liu et al., 2008, 2012) to find and detect outliers. The term isolation means “separating an instance from the rest of the instances.” Note that the isolated forest algorithm is different from “decision tree” and “random forest,” which are also commonly used machine learning methods. Since anomalies are “few and different” and therefore they are more susceptible to isolation. The method exploits two particularities of anomalies: they represent fewer instances in the observed set, and, compared to healthy instances, they have discrepant attribute-values.
Anomaly detection using iForest is a two-stage process. The first (training) stage builds isolation trees using subsamples of the training set. The second (testing) stage passes the test instances through isolation trees to obtain an anomaly score for each instance (Liu et al., 2008, 2012).
In the training stage, iTrees are constructed by recursively partitioning a subsample X′ until all instances are isolated. Details of the training stage can be found in Algorithms 1 and 2. Each iTree is constructed using a sub-sample X′ randomly selected without replacement from X, X′⊂X.
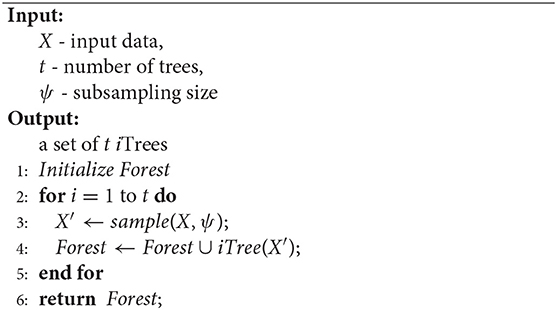
Algorithm 1: iForest(X, t, ψ)
There are two hyperparameters to the iForest algorithm in Algorithm 1: the subsampling size ψ and the number of trees t. The subsampling size ψ controls the training data size and the number of trees t controls the ensemble size.
The normal points tend to be isolated at the deeper end of the tree, whereas anomalies are closer to the tree root, due to their singularity nature. The shorter the average path length, the higher the chances to be anomalies. Hence, the anomaly score s is then defined by:
where n is the number of samples in the dataset, E(h(x)) is the average of path length h(x)from a group of isolation tree, and c(n) is the average of h(x) given n, used for normalizing the path length.
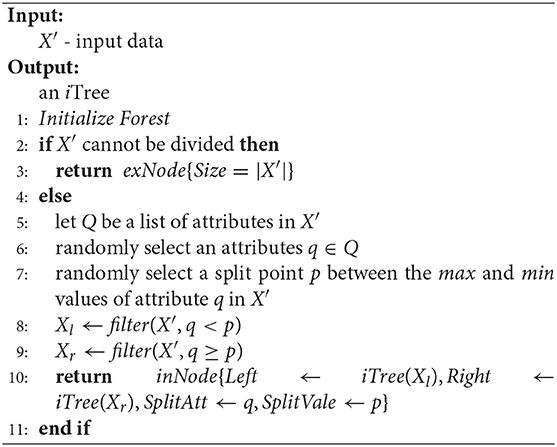
Algorithm 2: iTree(X′)
Details of the testing stage can be found in Algorithm 3.
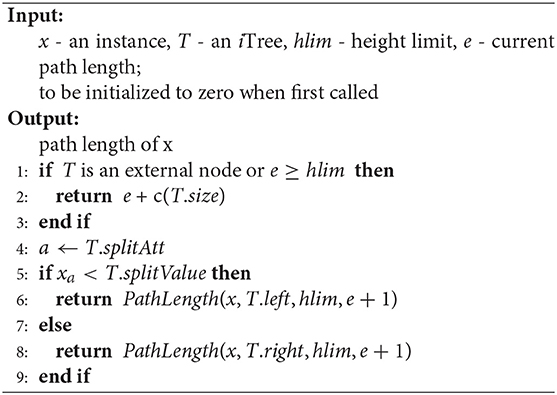
Algorithm 3: PathLength(x, T, hlim, e)
2.2.2. Quantile Statistical Methods
In probability and statistics, the quantile function, associated with a probability distribution of a random variable, specifies the value of the random variable such that the probability of the variable is less than or equal to the given probability. It is also called the percent-point function or inverse cumulative distribution function.
With reference to a continuous and strictly monotonic distribution function, for example the cumulative distribution function of a random variable X, the quantile function Q returns a threshold value x below which random draws from the given c.d.f would fall p percent of the time (Parzen, 2004).
In terms of the distribution function F, the quantile function Q is then defined by:
2.2.3. A New Extreme Detection Method
Definition of extreme values: In this paper, we treat extreme values as a subset of outliers. Therefore, we first use the isolated forest algorithm to identify and label the outliers of temperature or precipitation at each spatial grid, and then for the outliers of each grid point, the 95-quantile method is used to determine the critical point of the extreme value, and the value greater than the critical point is defined as the extreme value.
We use “isolated forest,” which is an advanced machine learning algorithm, to detect the outlier set, followed by using the quantile function in statistics to determine the critical point of the extreme value from the outlier set. We finally identify values greater than the critical point as extreme values. We apply this extreme identification methodology to precipitation and temperature data over the Pearl River Delta and the middle and lower reaches of the Yangtze River in China.
In this paper, we propose a new extreme value detection algorithm as shown in Algorithm 4. The return value label of the isolated forest model uses −1 to denote the outlier. After that, the percentile function is used to obtain the critical value of the pth percentile, and finally record the points greater than the critical value in the original vector as extreme values to realize the discovery and identification of extreme values.
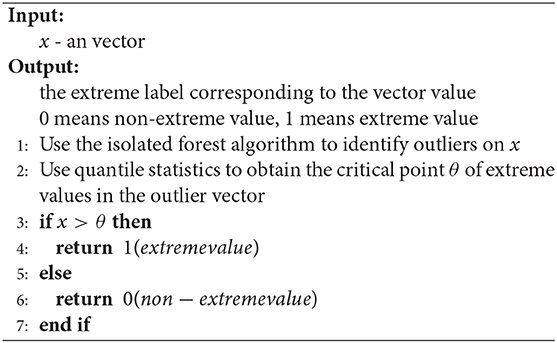
Algorithm 4: A new extreme detection method
Based on the assumption that extreme values are outliers, we propose a new extreme value detection method introduced in this paper. Compared with other algorithms, the isolated forest algorithm (Liu et al., 2012) has better generalization ability and robustness in the detection and recognition of outliers. It can be applied to univariate or multivariate outlier detection and identification problems, and absorbs the advantages of ensemble learning ideas.
This new extreme value detection method, on the one hand, absorbs the advantages of the isolated forest algorithm in the detection and identification of outliers, on the other hand, it also incorporates the method of using statistics to determine extreme values in related papers. It belongs to a comprehensive method of extreme value discovery and recognition, and uses advanced machine learning technology and traditional statistical methods. Compared with using a single method, it has a stronger learning ability and recognition.
3. Analysis Results and Interpretation
We start with analyzing the climatology of temperature and precipitation across the study area: the Pearl River Delta and the middle and lower reaches of the Yangtze River (Figure 1). The middle and lower reaches of the Yangtze River exhibit higher climatological precipitation (e.g., 10 mm/day) than the other regions in South China during June and July (Figure 1, left panel). Meanwhile, a high climatological surface temperature is observed in the Pearl River Delta, suggesting a high risk of heat wave events (Figure 1, right panel). It is noted that the climatological surface temperature in Hunan and Jiangxi provinces is also high during June and July (Figure 1, right panel). In order to detect extreme temperature and precipitation, we apply the new extreme value detection method to detect extreme precipitation and extreme temperature in June and July in the Pearl River Delta and the middle and lower reaches of the Yangtze River. The spatial pattern of extreme precipitation and extreme temperature (Figure 2) is different from that for climatological precipitation and temperature (Figure 1). Because the extreme precipitation date and extreme temperature date occurred simultaneously for 169 days, accounting for 30.8% of the extreme temperature date, based on the extreme precipitation and extreme temperature at each grid point under the coincident date, we found that Figure 2A has more blank areas (missing values) than Figure 2B. Specifically, the regions with extreme temperature are shifted poleward compared with climatological temperature (Figures 1, 2). The high-low-high tripolar pattern of climatological precipitation (Figure 1) cannot be identified for extreme precipitation (Figure 2). Extreme precipitation exhibits high values in eastern Guangdong Providence and a large portion of the middle and lower reaches of the Yangtze River.
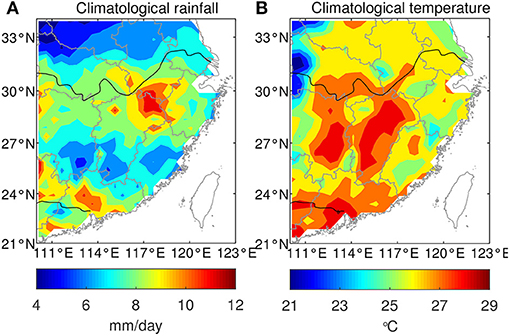
Figure 1. Spatial distribution of climatological mean (A) precipitation (mm/day) and (B) temperature (°C) during June and July of 1979–2020 in Southeast China.
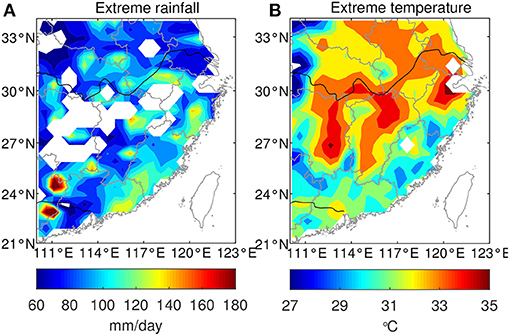
Figure 2. Spatial distribution of composite (A) extreme precipitation (mm/day) and (B) extreme temperature (°C) for the date of compound precipitation and temperature extremes in Southeast China during June and July of 1979–2020.
Figure 3 displays composite winds at 850 and 500 hPa vertical velocity during the days with compound precipitation and temperature extremes in Southeast China. The updraft (negative omega) is consistent with regions in the middle and lower reaches of the Yangtze River with extreme precipitation (Figure 2). Meanwhile, the downdraft associated with high temperature is located in the western part of the Pearl River Delta (Figure 3). The composite 500-hPa circulation pattern during days of the compound extreme features teleconnections that propagate from the east of the Philippines to South China (Figure 3). This 500-hPa circulation pattern, together with the pattern of 500-hPa omega, serves to interpret the compound extreme (Figures 2, 3). The easterly winds along the north flank of the cyclonic system (Figure 3) can transport water vapor from the Pacific Ocean to the continent and may also contribute to the precipitation over Yangtze River (Yu et al., 2020). The circulation patterns are similar to the circulations related to tropical cyclones (known as typhoons in the western North Pacific) because previous studies have suggested some potential connections between tropical cyclones and heat waves (Parker et al., 2013; Lin, 2019; Matthews et al., 2019; Zhong et al., 2019). During the days with compound extremes, tropical cyclones are located close to or inside the study region (Figure 4), in agree with previous studies showing that tropical cyclones may be associated with heat waves (Parker et al., 2013; Lin, 2019; Matthews et al., 2019; Zhong et al., 2019). During 1979–2019, we identify 157 days of compound extremes, 85 of which are accompanied by typhoons located west of 130°E. Therefore, 54% of compound extremes coincide with typhoon activities, indicating an association between the compound extreme and typhoons. While tropical cyclones are influenced by large-scale circulation in terms of steering flow (tracks), genesis and intensity, these storms can also modulate the climatology of the background large-scale circulation (Arakane and Hsu, 2020). Although typhoons may modulate the circulations conducive to the compound extreme, typhoon tracks are overall controlled by the subtropical high. Therefore, the major driver of the compound extreme is the subtropical high with typhoons playing a certain role.
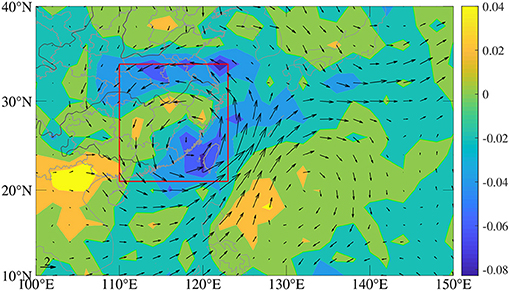
Figure 3. Composite winds at 850 hPa (vector, m/s) and vertical velocity (omega) at 500 hPa (shading, Pa/s) for the date of compound precipitation and temperature extremes in Southeast China during June and July of 1979–2020. Red rectangular denotes the study area.
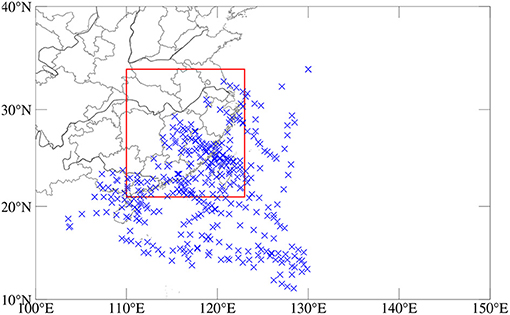
Figure 4. Six-hourly tropical cyclone positions (blue crosses) west of 130°E for the date of compound precipitation and temperature extremes in Southeast China during June and July of 1979–2019. Note that tropical cyclone positions in 2020 are not shown because the tropical cyclone best-track data in 2020 are not yet available. Red rectangular denotes the study area.
Based on the new extreme value identification method, we find the date of extreme temperature and the date of extreme precipitation in the middle and lower reaches of the Pearl River and the Yangtze River Delta. We use the date of extreme temperature as the reference point, and analyze the date of extreme precipitation lags 0–60 in sequence. When the date of extreme precipitation lags behind the date obtained after 18 days, 49.18% of the date is included in the date of extreme temperature. This relationship is shown in Figure 5.
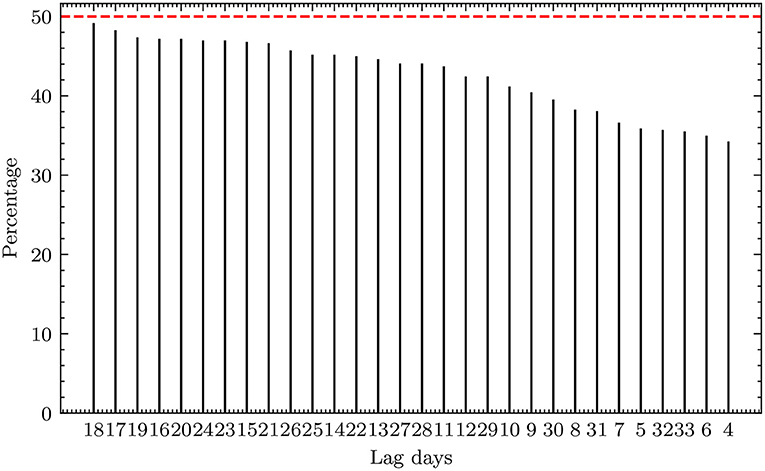
Figure 5. Probability distribution of different days after extreme precipitation date lagging extreme temperature date.
To examine whether there is an association between extreme temperature in the Pearl River Delta and extreme precipitation in the Yangtze River Delta, we calculate the Pearson correlation coefficient between the median value of extreme temperature in the former region and the median value of extreme precipitation in the later region (Figure 6). There is a statistically significant Pearson correlation (0.52) between the median value of extreme temperature and the median value of extreme precipitation during the 26 years when we can detect extreme temperature and precipitation (Figure 6A). The Kendall's tau (0.35) between the median value of extreme temperature and the median value of extreme precipitation is also statistically significant at the 0.05 level. The significant association between the two types of extremes suggests the compound nature of this event (remote compound extremes). That is, heat wave characterized by extreme temperature in the Pearl River Delta may be concurrent and connected with extreme precipitation events in the Yangtze River Delta (Figure 6). At the same time, we compared and analyzed the use of the 95% quantile method to identify extreme values, and found that the correlation between the annual median value of extreme temperature in the Pearl River Delta and extreme precipitation in the Yangtze River Delta is weak (0.12), which does not meet statistical significance (Figure 6B). The results by using the 99th percentile lead to a correlation of 0.33, which is not statistically significant (Figure 6C).
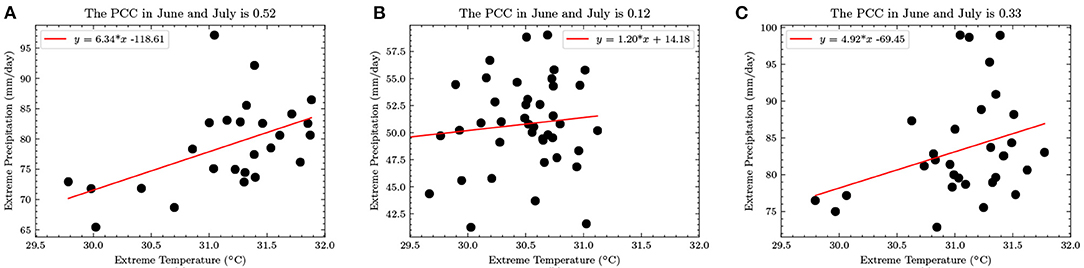
Figure 6. The scatter plot of extreme temperature in the Pearl River Delta and extreme precipitation in the Yangtze River Delta during June and July using (A) a new extreme detection method, (B) the traditional 95th quantile method, (C) the traditional 99th quantile method.
In addition to potential impacts of typhoons on the compound extremes, the physical mechanisms underlying the remote compound extremes may be tied to the subtropical high that modulates weather and climate in China, responsible for extreme temperature and precipitation. Figure 7 exhibits the 5,880-gpm contour of 500-hPa geopotential height when extreme temperature and precipitation events occurred. The subtropical high during extreme temperature is quite consistent with that during extreme precipitation (Figure 7). When the subtropical high shift westward and sits on the Pearl River Delta, there tends to excite heat waves. Meanwhile, this subtropical high setting is also conducive to extreme precipitation in the Yangtze River Delta because strong moisture transport to this region is prevalent along the western flank of the subtropical high (Figure 7). Subtropical high also modulates the steering flow, which determines typhoon tracks (Gao et al., 2020). Therefore, the subtropical high plays a dominant role with typhoons playing secondary roles.
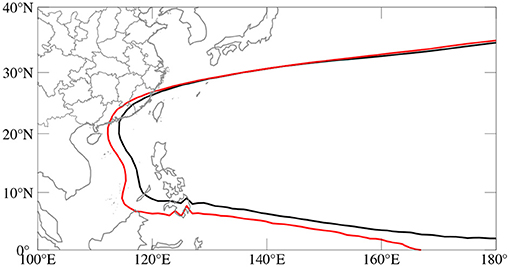
Figure 7. The 5,880-gpm contour (red) of 500-hPa geopotential height for the 26 years with extreme temperature in the Pearl River Delta and extreme precipitation in the Yangtze River Delta during June and July, and the climatological mean 5,880-gpm contour (black) during June and July of 1979–2020.
4. Conclusions and Discussion
Although major advances have been made in understanding the compound extremes (e.g., drought and heat wave), little is known about two types of extremes synchronized/connected in different regions. Here we have identified a new type of compound extremes termed as “remote compound extremes” with the aid of a new extreme value detection method that combines isolated forest and quantile statistics. The main findings of this paper are summarized as follows.
1. We apply a new extreme detection method that combines isolated forest and quantile methods to identify the extreme temperature and precipitation, thereby leading to the new compound extremes.
2. We have found a statistically significant correlation (i.e., 0.52) between the heat waves in the Pearl River Delta and extreme precipitation in the Yangtze River Delta, suggesting the existence of the remote compound extremes.
3. The remote compound extreme may be tied to the western Pacific subtropical high that modulate typhoons, surface temperature in the Pearl River Delta and extreme precipitation in the middle and lower reaches of the Yangtze River.
This study for the first time quantifies the occurrence of this type of compound extreme using machine learning technologies and attempts to understand this compound. Efforts are still required to dissect the exact mechanisms underlying this compound extreme. Our future work will focus on three aspects of the new compound extreme. First, we will evaluate this new type of compound extremes across different regions. Second, we will examine the capability of climate models in simulating and reproducing this compound extreme. Last but not least, further study will focus on the predictability of this new type of extremes among the seasonal forecasting systems [e.g., The North American Multi-Model Ensemble (Kirtman et al., 2014)].
Data Availability Statement
Publicly available datasets were analyzed in this study. This data can be found at: https://climexp.knmi.nl/ERA5/era5_t2m_daily.nc, https://climexp.knmi.nl/ERA5/era5_tp_daily.nc.
Author Contributions
LW: conceptualization, methodology, formal analysis, figure, and writing—original draft. QZ: writing—review and editing. SG: figure, review, and editing. WZ: conceptualization, writing—review and editing. LF: review and editing. All authors contributed to the article and approved the submitted version.
Funding
This study was jointly supported by the National Key R&D Program of China (2019YFC1510400), the National Natural Science Foundation of China (File nos. 61872451 and 61872452), the Science and Technology Development Fund, Macau SAR (File nos. 0098/2018/A3, 0076/2019/A2, and 0037/2020/A1), and the Macao Science and Technology Development Fund under Macao Funding Scheme for Key R&D Projects (0025/2019/AKP).
Conflict of Interest
The authors declare that the research was conducted in the absence of any commercial or financial relationships that could be construed as a potential conflict of interest.
References
AghaKouchak, A., Chiang, F., Huning, L. S., Love, C. A., Mallakpour, I., Mazdiyasni, O., et al. (2020). Climate extremes and compound hazards in a warming world. Annu. Rev. Earth Planet. Sci. 48, 519–548. doi: 10.1146/annurev-earth-071719-055228
AghaKouchak, A., Huning, L. S., Chiang, F., Sadegh, M., Vahedifard, F., Mazdiyasni, O., et al. (2018). How do natural hazards cascade to cause disasters? Nature 561, 458–460. doi: 10.1038/d41586-018-06783-6
Arakane, S., and Hsu, H. H. (2020). A tropical cyclone removal technique based on potential vorticity inversion to better quantify tropical cyclone contribution to the background circulation. Clim. Dyn. 54, 3201–3226. doi: 10.1007/s00382-020-05165-x
Christensen, J. H., and Christensen, O. B. (2003). Severe summertime flooding in Europe. Nature 421, 805–806. doi: 10.1038/421805a
Deng, K., Yang, S., Gu, D., Lin, A., and Li, C. (2020). Record-breaking heat wave in southern china and delayed onset of South China sea summer monsoon driven by the pacific subtropical high. Clim. Dyn. 54, 3751–3764. doi: 10.1007/s00382-020-05203-8
Fischer, E. M., Seneviratne, S. I., Lüthi, D., and Schär, C. (2007). Contribution of land–atmosphere coupling to recent European summer heat waves. Geophys. Res. Lett. 34. doi: 10.1029/2006GL029068
Gao, S., Zhu, L., Zhang, W., and Shen, X. (2020). Impact of the pacific meridional mode on landfalling tropical cyclone frequency in China. Q. J. R. Meteorol. Soc. 146, 2410–2420. doi: 10.1002/qj.3799
Gasparrini, A., and Armstrong, B. (2011). The impact of heat waves on mortality. Epidemiology 22:68. doi: 10.1097/EDE.0b013e3181fdcd99
Ge, Q., Guo, X., Zheng, J., and Hao, Z. (2008). Meiyu in the middle and lower reaches of the Yangtze river since 1736. Chin. Sci. Bull. 53, 107–114. doi: 10.1007/s11434-007-0440-5
Guo, Y., Wu, Y., Wen, B., Huang, W., Ju, K., Gao, Y., et al. (2020). Floods in China, covid-19, and climate change. Lancet Planet. Health 4, e443–e444. doi: 10.1016/S2542-5196(20)30203-5
Han, L., Xu, Y., Pan, G., Deng, X., Hu, C., Xu, H., et al. (2015). Changing properties of precipitation extremes in the urban areas, Yangtze river delta, China, during 1957–2013. Nat. Hazards 79, 437–454. doi: 10.1007/s11069-015-1850-3
Kirtman, B. P., Min, D., Infanti, J. M., Kinter James, L. I, Paolino, D. A., et al. (2014). The North American multimodel ensemble: phase-1 seasonal-to-interannual prediction; phase-2 toward developing intraseasonal prediction. Bull. Am. Meteorol. Soc. 95, 585–601. doi: 10.1175/BAMS-D-12-00050.1
Lentz, E. E., Thieler, E. R., Plant, N. G., Stippa, S. R., Horton, R. M., and Gesch, D. B. (2016). Evaluation of dynamic coastal response to sea-level rise modifies inundation likelihood. Nat. Clim. Change 6, 696–700. doi: 10.1038/nclimate2957
Leonard, M., Westra, S., Phatak, A., Lambert, M., van den Hurk, B., McInnes, K., et al. (2014). A compound event framework for understanding extreme impacts. Wiley Interdiscipl. Rev. Clim. Change 5, 113–128. doi: 10.1002/wcc.252
Lin, N. (2019). Tropical cyclones and heatwaves. Nat. Clim. Change 9, 579–580. doi: 10.1038/s41558-019-0537-2
Liu, F. T., Ting, K. M., and Zhou, Z. H. (2008). “Isolation forest,” in 2008 Eighth IEEE International Conference on Data Mining (Pisa: IEEE), 413–422. doi: 10.1109/ICDM.2008.17
Liu, F. T., Ting, K. M., and Zhou, Z. H. (2012). Isolation-based anomaly detection. ACM Trans. Knowl. Discov. Data 6, 1–39. doi: 10.1145/2133360.2133363
Liu, X., Tang, Q., Zhang, X., and Sun, S. (2018). Projected changes in extreme high temperature and heat stress in China. J. Meteorol. Res. 32, 351–366. doi: 10.1007/s13351-018-7120-z
Ma, W., Zeng, W., Zhou, M., Wang, L., Rutherford, S., Lin, H., et al. (2015). The short-term effect of heat waves on mortality and its modifiers in china: an analysis from 66 communities. Environ. Int. 75, 103–109. doi: 10.1016/j.envint.2014.11.004
Martius, O., Pfahl, S., and Chevalier, C. (2016). A global quantification of compound precipitation and wind extremes. Geophys. Res. Lett. 43, 7709–7717. doi: 10.1002/2016GL070017
Matthews, T., Wilby, R. L., and Murphy, C. (2019). An emerging tropical cyclone–deadly heat compound hazard. Nat. Clim. Change 9, 602–606. doi: 10.1038/s41558-019-0525-6
Murray, V., and Ebi, K. L. (2012). IPCC Special Report on Managing the Risks of Extreme Events and Disasters to Advance Climate Change Adaptation (SREX). Cambridge: Cambridge University Press, 582.
National Academies of Sciences Engineering, and Medicine. (2016). Attribution of Extreme Weather Events in the Context of Climate Change. Washington, DC: National Academies Press.
Parker, T. J., Berry, G. J., and Reeder, M. J. (2013). The influence of tropical cyclones on heat waves in southeastern Australia. Geophys. Res. Lett. 40, 6264–6270. doi: 10.1002/2013GL058257
Parzen, E. (2004). Quantile probability and statistical data modeling. Stat. Sci. 19, 652–662. doi: 10.1214/088342304000000387
Pendergrass, A. G. (2018). What precipitation is extreme? Science 360, 1072–1073. doi: 10.1126/science.aat1871
Peng, R. D., Bobb, J. F., Tebaldi, C., McDaniel, L., Bell, M. L., and Dominici, F. (2011). Toward a quantitative estimate of future heat wave mortality under global climate change. Environ. Health Perspect. 119, 701–706. doi: 10.1289/ehp.1002430
Raymond, C., Horton, R. M., Zscheischler, J., Martius, O., AghaKouchak, A., Balch, J., et al. (2020). Understanding and managing connected extreme events. Nat. Clim. Change 10, 611–621. doi: 10.1038/s41558-020-0790-4
Rivas, D., Caleyo, F., Valor, A., and Hallen, J. M. (2008). Extreme value analysis applied to pitting corrosion experiments in low carbon steel: Comparison of block maxima and peak over threshold approaches. Corros. Sci. 50, 3193–3204. doi: 10.1016/j.corsci.2008.08.002
Stephenson, D. B., Diaz, H., and Murnane, R. (2008). Definition, diagnosis, and origin of extreme weather and climate events. Clim. Extremes Soc. 340, 11–23. doi: 10.1017/CBO9780511535840.004
Stott, P. (2016). How climate change affects extreme weather events. Science 352, 1517–1518. doi: 10.1126/science.aaf7271
Sun, Q., Miao, C., AghaKouchak, A., and Duan, Q. (2017). Unraveling anthropogenic influence on the changing risk of heat waves in China. Geophys. Res. Lett. 44, 5078–5085. doi: 10.1002/2017GL073531
Teegavarapu, R. S. (2012). Floods in a Changing Climate: Extreme Precipitation. Cambridge: Cambridge University Press.
Wahl, T., Jain, S., Bender, J., Meyers, S. D., and Luther, M. E. (2015). Increasing risk of compound flooding from storm surge and rainfall for major us cities. Nat. Clim. Change 5, 1093–1097. doi: 10.1038/nclimate2736
Wang, L., and Gu, W. (2016). The eastern China flood of June 2015 and its causes. Sci. Bull. 61, 178–184. doi: 10.1007/s11434-015-0967-9
Wei, K., Ouyang, C., Duan, H., Li, Y., Chen, M., Ma, J., et al. (2020). Reflections on the catastrophic 2020 Yangtze river basin flooding in southern China. Innovation 1:100038. doi: 10.1016/j.xinn.2020.100038
Yin, J., Gentine, P., Zhou, S., Sullivan, S. C., Wang, R., Zhang, Y., et al. (2018). Large increase in global storm runoff extremes driven by climate and anthropogenic changes. Nat. Commun. 9:4389. doi: 10.1038/s41467-018-06765-2
Yin, Y., Chen, H., Xu, C. Y., Xu, W., Chen, C., and Sun, S. (2016). Spatio-temporal characteristics of the extreme precipitation by L-moment-based index-flood method in the Yangtze river delta region, China. Theor. Appl. Climatol. 124, 1005–1022. doi: 10.1007/s00704-015-1478-y
You, Q., Jiang, Z., Kong, L., Wu, Z., Bao, Y., Kang, S., et al. (2017). A comparison of heat wave climatologies and trends in China based on multiple definitions. Clim. Dyn. 48, 3975–3989. doi: 10.1007/s00382-016-3315-0
Yu, J., Gao, S., Zhang, L., Shen, X., and Guo, L. (2020). Analysis of a remote rainstorm in the Yangtze river delta region caused by typhoon Mangkhut (2018). J. Mar. Sci. Eng. 8:345. doi: 10.3390/jmse8050345
Zhang, W., and Villarini, G. (2020). Deadly compound heat stress-flooding hazard across the central United States. Geophys. Res. Lett. 47:e2020GL089185. doi: 10.1029/2020GL089185
Zhang, W., Villarini, G., Vecchi, G. A., and Smith, J. A. (2018). Urbanization exacerbated the rainfall and flooding caused by hurricane Harvey in Houston. Nature 563, 384–388. doi: 10.1038/s41586-018-0676-z
Zhong, S., Qian, Y., Zhao, C., Leung, R., Wang, H., Yang, B., et al. (2017). Urbanization-induced urban heat island and aerosol effects on climate extremes in the Yangtze river delta region of China. Atmos. Chem. Phys. 17. doi: 10.5194/acp-17-5439-2017
Zhong, Z., Chen, X., Yang, X. Q., Ha, Y., and Sun, Y. (2019). The relationship of frequent tropical cyclone activities over the western north Pacific and hot summer days in central-eastern China. Theor. Appl. Climatol. 138, 1395–1404. doi: 10.1007/s00704-019-02908-7
Zscheischler, J., Martius, O., Westra, S., Bevacqua, E., Raymond, C., Horton, R. M., et al. (2020). A typology of compound weather and climate events. Nat. Rev. Earth Environ. 1, 333–347. doi: 10.5194/egusphere-egu2020-8572
Keywords: compound extremes, heat wave, extreme precipitation, extreme detection, isolation forest
Citation: Wang L, Zhao Q, Gao S, Zhang W and Feng L (2021) A New Extreme Detection Method for Remote Compound Extremes in Southeast China. Front. Earth Sci. 9:630192. doi: 10.3389/feart.2021.630192
Received: 16 November 2020; Accepted: 23 March 2021;
Published: 15 April 2021.
Edited by:
Jing-Jia Luo, Bureau of Meteorology, AustraliaReviewed by:
Xiaojing Jia, Zhejiang University, ChinaEduardo Zorita, Helmholtz Center for Materials and Coastal Research (HZG), Germany
Copyright © 2021 Wang, Zhao, Gao, Zhang and Feng. This is an open-access article distributed under the terms of the Creative Commons Attribution License (CC BY). The use, distribution or reproduction in other forums is permitted, provided the original author(s) and the copyright owner(s) are credited and that the original publication in this journal is cited, in accordance with accepted academic practice. No use, distribution or reproduction is permitted which does not comply with these terms.
*Correspondence: Qinglin Zhao, enFsaWN0QGhvdG1haWwuY29t