 Mingzhi Sun1
 Jinyun Guo
 Xin Liu
 Haihong Wang
- 1College of Geodesy and Geomatics, Shandong University of Science and Technology, Qingdao, China
- 2School of Geodesy and Geomatics, Wuhan University, Wuhan, China
- 3Chinese Academy of Surveying and Mapping, Beijing, China
Zhari Namco, a large lake in the Tibetan Plateau (TP), is sensitive to climate and environmental change. However, it is difficult to retrieve accurate and continuous lake levels for Zhari Namco. A robust strategy, including atmospheric delay correction, waveform retracking, outlier deletion, and inter-satellite adjustment, is proposed to generate a long-term series of lake levels for Zhari Namco through multi-altimeter data. Apparent biases are found in troposphere delay correction from different altimeter products and adjusted using an identical model. The threshold (20%) algorithm is employed for waveform retracking. The two-step method combining a sliding median filter and 2σ criterion is used to eliminate outliers. Tandem mission data of altimeters are used to estimate inter-satellite bias. Finally, a 27-year-long lake level time series of Zhari Namco are constructed using the TOPEX/Poseidon-Jason1/2/3 (T/P-Jason1/2/3) altimeter data from 1992 to 2019, resulting in an accuracy of 10.1 cm for T/P-Jason1/2/3. Temperature, precipitation, lake area, equivalent water height, and in situ gauge data are used for validation. The correlation coefficient more than 0.90 can be observed between this result and in situ gauge data. Compared with previous studies and existing database products, our method yields sequences with the best observational quality and the longest continuous monitoring in Zhari Namco. The time series indicates that the lake level in Zhari Namco has increased by ∼ 5.7 m, with an overall trend of 0.14 ± 0.01 m/yr, showing a fluctuating rate (1992–1999: −0.25 ± 0.05 m/yr, 2000–2008: 0.26 ± 0.04 m/yr, 2009–2016: −0.05 ± 0.03 m/yr, 2017–2019: 1.34 ± 0.34 m/yr). These findings will enhance the understanding of water budget and the effect of climate change in the TP.
Introduction
There are ∼1400 lakes greater than 1 km2 over the Tibetan Plateau (TP), most of which are closed and rarely disturbed by human activities (Ma et al., 2010). These high-altitude lakes are extremely sensitive to global climate change, and digesting their evolution is important for both hydrological and climatic analysis (Song et al., 2014). In practice, due to rugged topography and harsh environment of the TP, few in situ gauge observations can be used for lake level monitoring. Remote sensing has become the most feasible means to monitor the lake level change of high-altitude lakes.
Altimeter observations can be used to monitor changes in lake level. The accuracy of lake level provided by the geoscience laser altimeter system (GLAS) on the Ice, Cloud, and Land Elevation Satellite (ICESat) mission has reached the decimeter level (Zhang et al., 2011; Phan et al., 2012). The laser satellite’s ground footprint is 70 m in diameter, which allows GLAS to explore more lake levels in alpine lakes. The changes of lake level in 111 lakes on the TP are successfully extracted by ICESat/ICESat-2, and it is found that the lake level has a significant upward trend (Zhang et al., 2011, 2019a; Phan et al., 2012). GLAS data are used to detect seasonal and abrupt changes in lake level of 105 closed lakes and categorized the changes for understanding their temporal evolution patterns based on cluster analysis (Song et al., 2014). SAR Interferometry (SARIn), a new sort of satellite altimetry (e.g., CryoSat-2), can also gather worthwhile data for monitoring lake level changes on the TP (Kleinherenbrink et al., 2015; Jiang et al., 2017). Both ICESat/ICESat-2 and CryoSat-2 use non-repetitive orbits. The revisit period of ICESat/ICESat-2 is 91 days, while that of CryoSat-2 is 369 days, resulting in a sparse temporal sampling. This feature makes them improper for detecting periodic lake level alteration.
Compared with laser altimetry and SARIn altimetry, traditional radar altimetry can provide lake levels with dense sampling time. The TOPEX/Poseidon-Jason1/2/3 (T/P-Jason1/2/3) missions, revisiting the same site every 10 days, have collected lake level data from October 1992 to the present. Lake levels above the TP are monitored by T/P-Jason1/2/3, e.g., Khanka, La’nga Co, Ngangzi Co, Qinghai Lake, and Ngoring. The specifics of their lake levels are described and the response of lake levels to climate is analyzed (Hwang et al., 2005; Guo et al., 2011; Lee et al., 2011). The lake level sequences of plateau lakes are extracted from T/P altimeter data and the main factors of lake level change are discussed from the perspective of water balance (Gao et al., 2013; Hwang et al., 2016). Although there are altimetry satellite observations in some lakes, the data are intensely noisy because of the influence of steep lakeshore or lofty mountains. Due to the large footprint of radar altimeter, e.g., ∼2.2 km for T/P-Jason1/2/3 altimeters, the data reaped by altimeter are inconsistent with nominal data in terms of accuracy and quantity, resulting in loss of some data, because of the complex and rugged plateau terrain. There are several global datasets for inland lakes based on multiple satellite altimeters, such as, the Global Reservoir and Lake Monitor (G-REALM), the Hydroweb database, and the High-temporal-resolution water level data sets for lakes (HTRWLD). But the data processing method cannot be optimal in a single lake. The lake levels of Zhari Namco in these data sets are noisy and data in some periods are lacking. New data processing methods, such as waveform retracking and data filtering, can be used to procure the lake levels more accurately.
The objective of this paper is to show a technique for computing lake level changes in Zhari Namco from T/P-Jason1/2/3 altimeters. We study a range of problems, such as atmospheric path delay corrections, waveform retracking, outlier detection and bias adjustment. Other lake level products (G-REALM, HTRWLD, Hydroweb, and in situ gauge data), precipitation, temperature, lake area, and equivalent water height (EWH) data are used to further confirm the results of altimeter-derived lake levels over Zhari Namco. Our long-term altimeter result over Zhari Namco will provide important information for exploring this basin.
Study Area and Data
Study Area
Zhari Namco (alias Chi-jih) a large lake in the TP (Zhang, 2019), is located at 30°44′–31°05′ N and 85°19′–85°54′ E. The depth of the lake averages 3.6 m with a maximum depth of 71.55 m (Wang et al., 2010). Shoreline stretches 183 km, with a narrow north-south shoreline and an open east-west shoreline (Wang et al., 2010). The eastern shore of the lake is covered with swamps about 20 km. There are 10 ancient lake shorelines on the north and west banks, with the highest level 100 m higher than current flats, and there are three terraces in the southeast lakeside area. The lake is fed by snow and ice meltwater of the Cuoqin River and the Dalong River. Figure 1 shows the study area and satellite ground tracks passing through Zhari Namco. Lake basin boundaries are delineated using Shuttle Radar Topography Mission Digital Elevation Model (SRTM DEM).
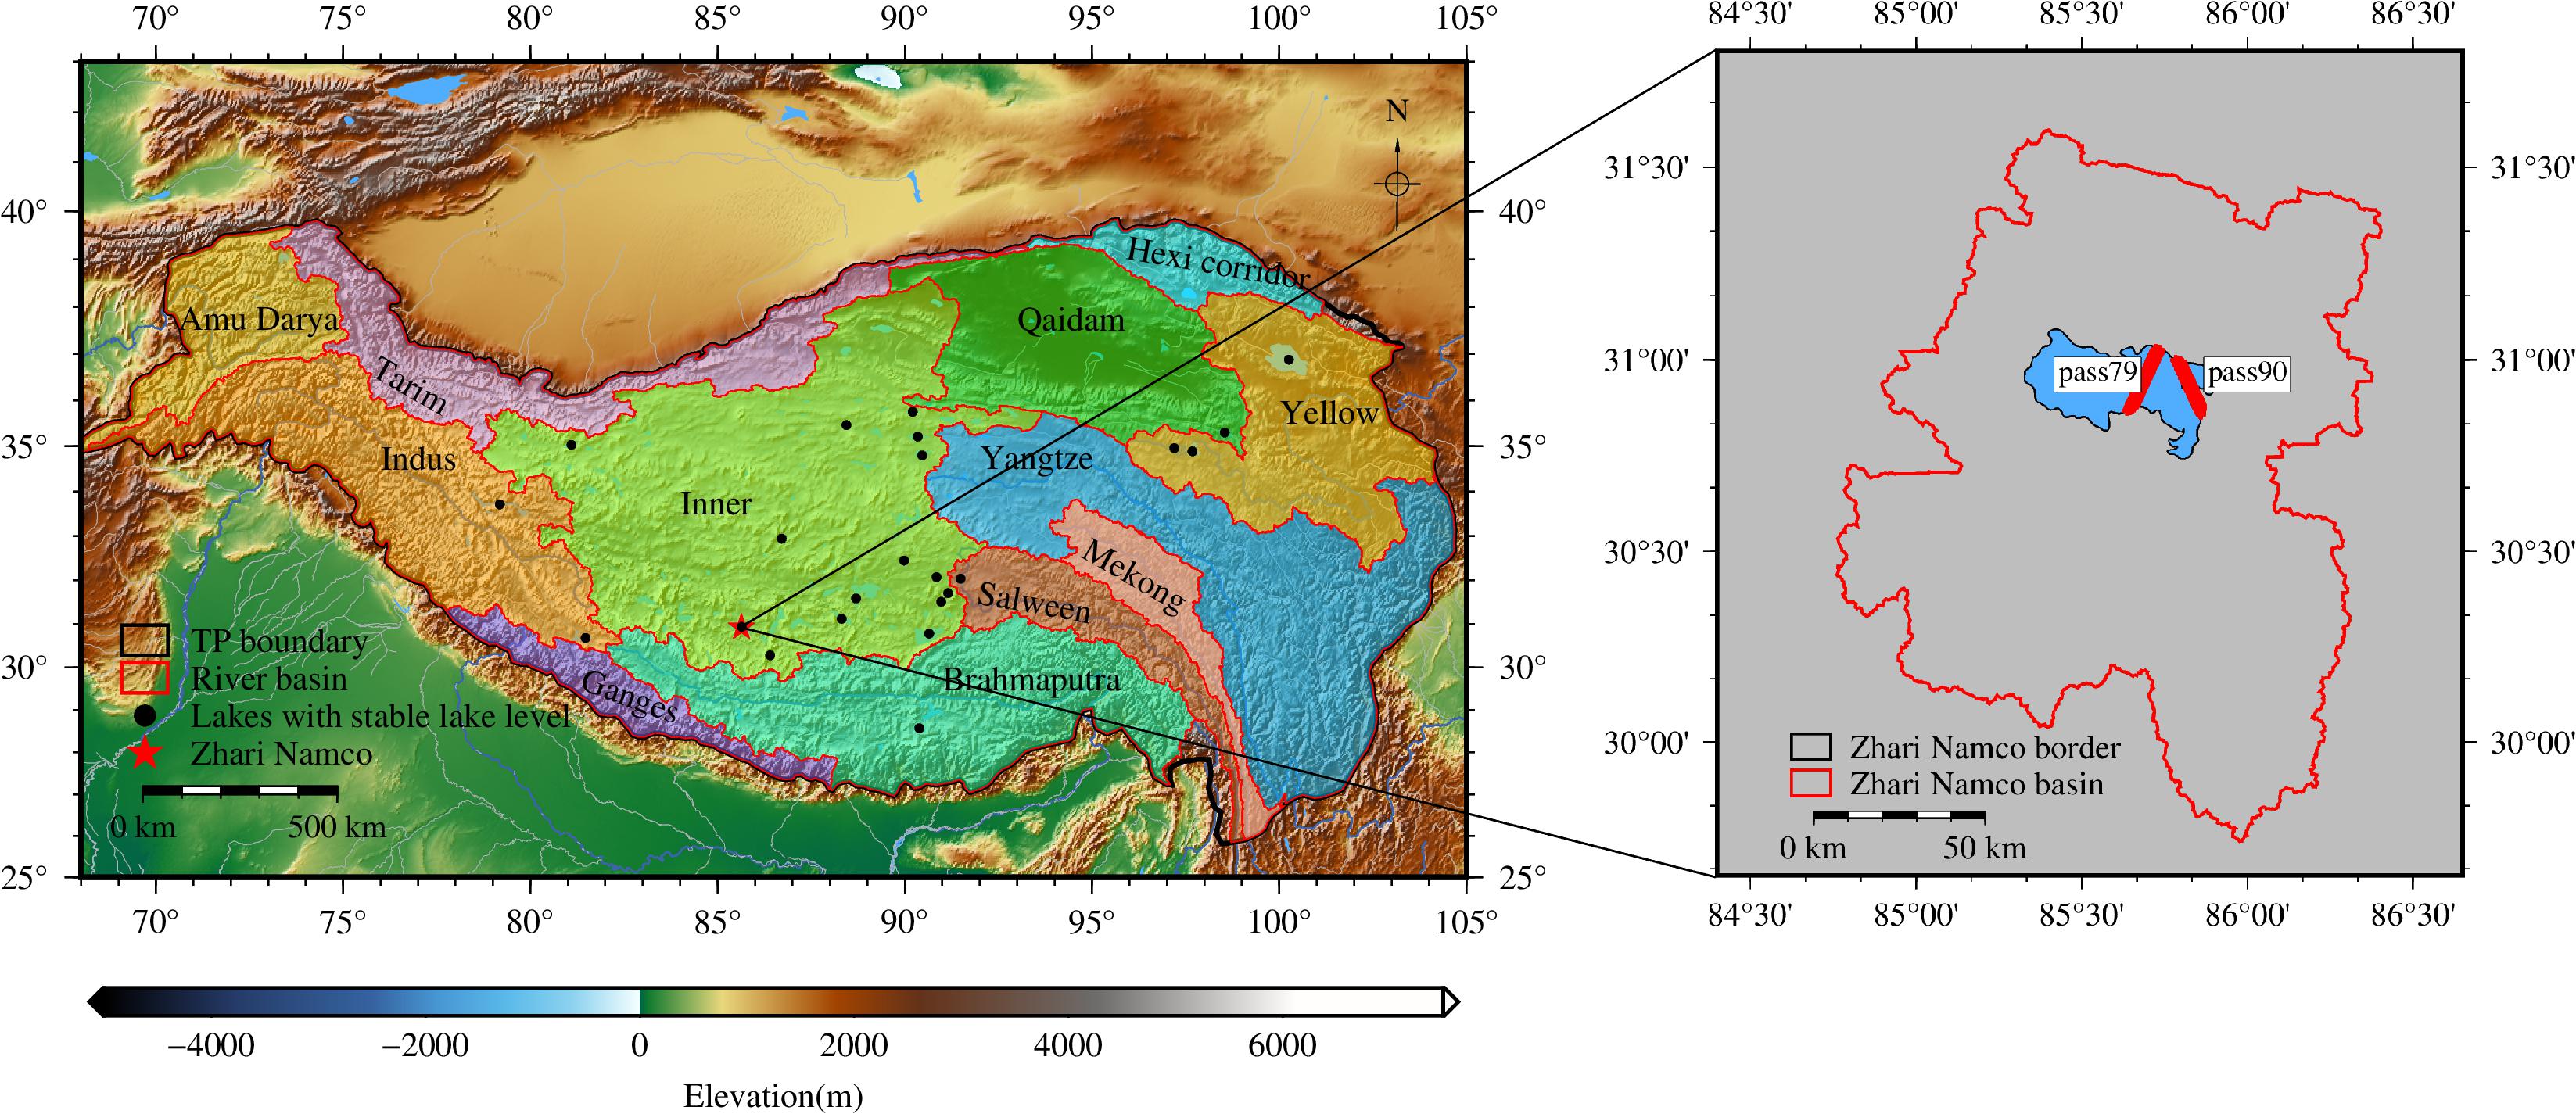
Figure 1. Study area and satellite ground tracks trough Zhari Namco.
T/P-Jason1/2/3 Altimetry Data
The altimeter data of T/P-Jason1/2/3 are free to download from the Archiving, Validation, and Interpretation of Satellite Oceanographic (AVISO)1. T/P satellite was launched on August 10, 1992, with a repetition period of 10 days. It is the first altimetry satellite of T/P-Jason1/2/3 series missions. T/P Geophysical Data Records (GDRs) are observed along the orbit. Jason-1, as the successor satellite of T/P, was launched in December 2001. Jason-2 was launched in 2008 and Jason-3 in 2016. As the next generation of satellites, their main characteristics (orbit, instrument, observation accuracy, etc.) are consistent with T/P. T/P-Jason1/2/3 missions share the ground track, which can be used to correct inter-satellite bias (Hwang et al., 2016). The Sensor Geophysical Data Record (SGDR) of Jason1/2/3 satellite contains 20 Hz along with orbit sampling data, and also includes waveform data composed of 104 waveform gates with a preset waveform gate of 32.5. Waveform retracking algorithm is used to correct the range of altimeter. The data of overlapped parts between two adjacent satellites are used to adjust the bias between satellites. The altimeter data used in this paper are shown in Table 1.
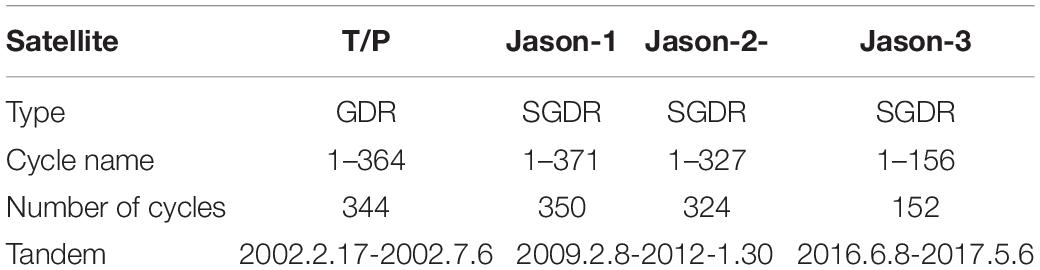
Table 1. Statistics of satellite altimeter data used in this study.
ECMWF Data
Surface pressure and vertical integral of water vapor from ERA-Interim are published by the European Centre for Medium-Range Weather Forecasts (ECMWF)2. The two sets of data, with a time resolution of 24 h and 6 h, are used to calculate dry troposphere correction (DTC) and wet troposphere correction (WTC), respectively (Wang et al., 2019). Since T/P GDR data do not include WTC in inland areas, the ERA-Interim data should be used to calculate this correction. The data are divided into grids of 0.75°. The geophysical correction for the location of the footprint is calculated using bilinear interpolation.
In situ Gauge Lake Level Data
The lake level observation of Zhari Namco from 2010 to 2017 (Lei et al., 2018) released by the national Tibetan Plateau Data Center (TPDC)3 is used as a reference to verify the lake level changes of other data sources. Since there is no clear datum, local benchmarks are used (Lei et al., 2017). The lake level is secured by a HOBO level gauge (U20-001-01) installed on the strand, then corrected using the barometer installed on the shore or pressure data of nearby weather stations, and then the real lake level changes are obtained, with the accuracy of less than 0.5 cm. Lake level data are obtained once a day except during glaciation.
G-REALM Lake Levels
Data from other products are compared with observations extracted by the method in this paper. We have searched these databases and found results over Zhari Namco in Global Reservoir and Lake Monitor (G-REALM)4. The University of Maryland, are routinely monitoring lake and reservoir height variations for many large lakes around the world (Schwatke et al., 2015). This comprises T/P (1992–2002), Jason-1 (2002–2008), Jason-2 (2008–2016), and Jason-3 (2016 to present). Nowadays, Jason-3 IGDR data are being used for near real-time operational monitoring at a 10-day resolution. ENVISAT products will be extended in time with data from the historical ERS and SARAL missions, and they will be appended with Sentinel-3A measurements which will provide near real-time monitoring at 27-day resolution.
Hydroweb Lake Levels
Hydroweb is a database built by Laboratoire d’Etudes en Géophysique et Océanographie Spatiales/Equipe Géodesie, Océanographie et Hydrologie Spatiales (Legos/GOHS) in France. The data are publicly available on their web site (http://hydroweb.theia-land.fr/hydroweb), free to use. The Zhari Namco lake levels (1992 to present) are based on data from a combination of satellites: SARAL, T/P, Jason-2/3, ICESat/ICESat-2, and Sentinel-3A. Gravity Recover and Climate Experiment (GRACE) Gravity Model 02 is the datum for Hydroweb lake levels (Crétaux et al., 2011). The lake level accuracy of Zhari Namco in Hydroweb is ∼10 cm.
High-Temporal-Resolution Water Level Data Sets
High-temporal-resolution water level data sets for lakes (HTRWLD) on the Tibetan Plateau (2000–2017) (Li et al., 2019b) are provided free of charge by TPDC (see text footnote 3). This developed data set provides lake level, hypsometric curves, and lake storage changes for 52 large lakes across the TP from 2000 to 2017. In situ gauge experiments agree with the theoretical analysis that the uncertainty of the optical water level is 0.1–0.2 m, comparable with that of altimetry water level. Among them, the water level time series of Zhari Namco is from June 10, 2001, to August 28, 2018. The databases are synthesized from Landsat, ENVISAT, CryoSat-2, and Jason-1/2/3, with elevation benchmarked EGM96 (Li et al., 2019a).
Precipitation and Temperature Data
In section “Water Reserves Inversion,” the response of lake level to climate change is further explored by using the “Climate Prediction Center (CPC) Global Unified Gauge-Based Analysis of Daily Precipitation” and “CPC Global Daily Temperature” in the lake basin. CPC Global data are provided free of charge by NOAA/OAR/ESRL PSL, Boulder, CO, United States5. This precipitation data set is part of products suite from the CPC Unified Precipitation Project that is underway at NOAA CPC (Chen et al., 2008). This temperature data set is used for verification by NOAA/CPC. The Shepard algorithm is used to grid the data into 0.5°. The daily average temperature can be generated from max and min.
Lake Area
The lakes larger than 1 km2 in Tibetan Plateau (V2.0) (1970s–2018) data (Zhang, 2019) are publicly released by TPDC (see text footnote 3). Lakes with area greater than 1 km2 are delineated from Landsat MSS/TM/ETM+/OLI data for the 1970s (1972–1976), but mostly ∼1990, ∼1995, ∼2000, ∼2005, ∼2010, and 2013–2018. The lake boundaries in the 1970s, ∼1990, ∼2000, and ∼2010 are derived from a study that employed visual interpretation (Zhang et al., 2014). To ensure that each lake boundary is precisely delineated, visual checking against the original Landsat images and manual editing of incorrect lake boundaries are also employed (Zhang et al., 2019b).
Equivalent Water Heights
The relationship between high water level and lake water storage is verified. EWH data from the Center for Space Research of the University of Texas6 RL06M.MSCNv02 EWH data product based on GRACE is distributed to verify the change of water reserves in the region from April 2002 to August 2019 (Watkins et al., 2015). The half-wavelength resolution of GRACE is 3°, and the range of 500 km is delineated to calculate the EWH of Zhari Namco.
Wind Speed Data
China Meteorological Forcing Dataset (CMFD) (1979–2018) (Kun and He, 2019) is a high spatial-temporal resolution gridded near-surface meteorological dataset downloaded from the TPDC (see text footnote 3). Its record starts from January 1979 and keeps extending (currently up to December 2018) with a temporal resolution of 3 h and a spatial resolution of 0.1°. Near-surface meteorological elements are provided in CMFD, including surface pressure, specific humidity, 10-m wind speed, downward shortwave radiation, downward longwave radiation, and precipitation rate (Yang et al., 2010; He et al., 2020).
SRTM DEM
Shuttle radar topography mission digital elevation model on the Tibetan Plateau (2012) (CIAT, 2015) obtained by TPDC (see text footnote 3) are used to extract lake watershed boundaries. This data set is mainly the SRTM terrain data obtained by International Center for Tropical Agriculture (CIAT)with the interpolation algorithm, which better fills the data void of SRTM 90.
River Basins Map Over the TP
The dataset of river basins map over the TP (2016) obtained by TPDC (see text footnote 3) is produced based on the SRTM DEM collected by Space Shuttle Radar terrain mission. There are 12 sub-basins over the Tibet Plateau (Figure 1), including Amu Darya, Brahmaputra, Ganges, Hexi Corridor, Indus, Inner, Mekong, Qaidam, Salween, Tarim, Yangtze, and Yellow. The outer boundary is based on the 2500-m contour line (Zhang et al., 2013; Zhang, 2016).
Materials and Methods
According to the principle of satellite altimetry, the lake level can be expressed as (e.g., Guo et al., 2010; Hwang et al., 2016),
where, LL is lake level, Sat_Alt is the altitude of the satellite above the reference ellipsoid, H_ Alt is the range measurement of altimeter after instrument corrections, V is the sum of the corrections, and N is the geoid height at the nadir point derived from a geoid model [EGM2008 in this study (Pavlis et al., 2012; Watkins et al., 2015)]. The corrections in Eq. 1 are shown as,
where, WTC is wet troposphere correction; DTC is dry troposphere correction; IC is ionosphere correction; Set is solid earth tide; Pol is pole tide, and RC is the range correction from waveform retracking. Solid earth tide and polar tide corrections can be accurately modeled using simulated values. The effects of RC, WTC, DTC, and IC on the altimeter range will be further addressed in section “Atmosphere Path Daly Corrections.” Compared with the above correction, other geophysical terms (e.g., hydrostatic variations, lake tide, thermal, wind piling-up effect, expansion) have less impact on altimeter range, so they can be ignored when calculating lake level. The observation processing flow of lake level generated by altimeter is shown in Figure 2.
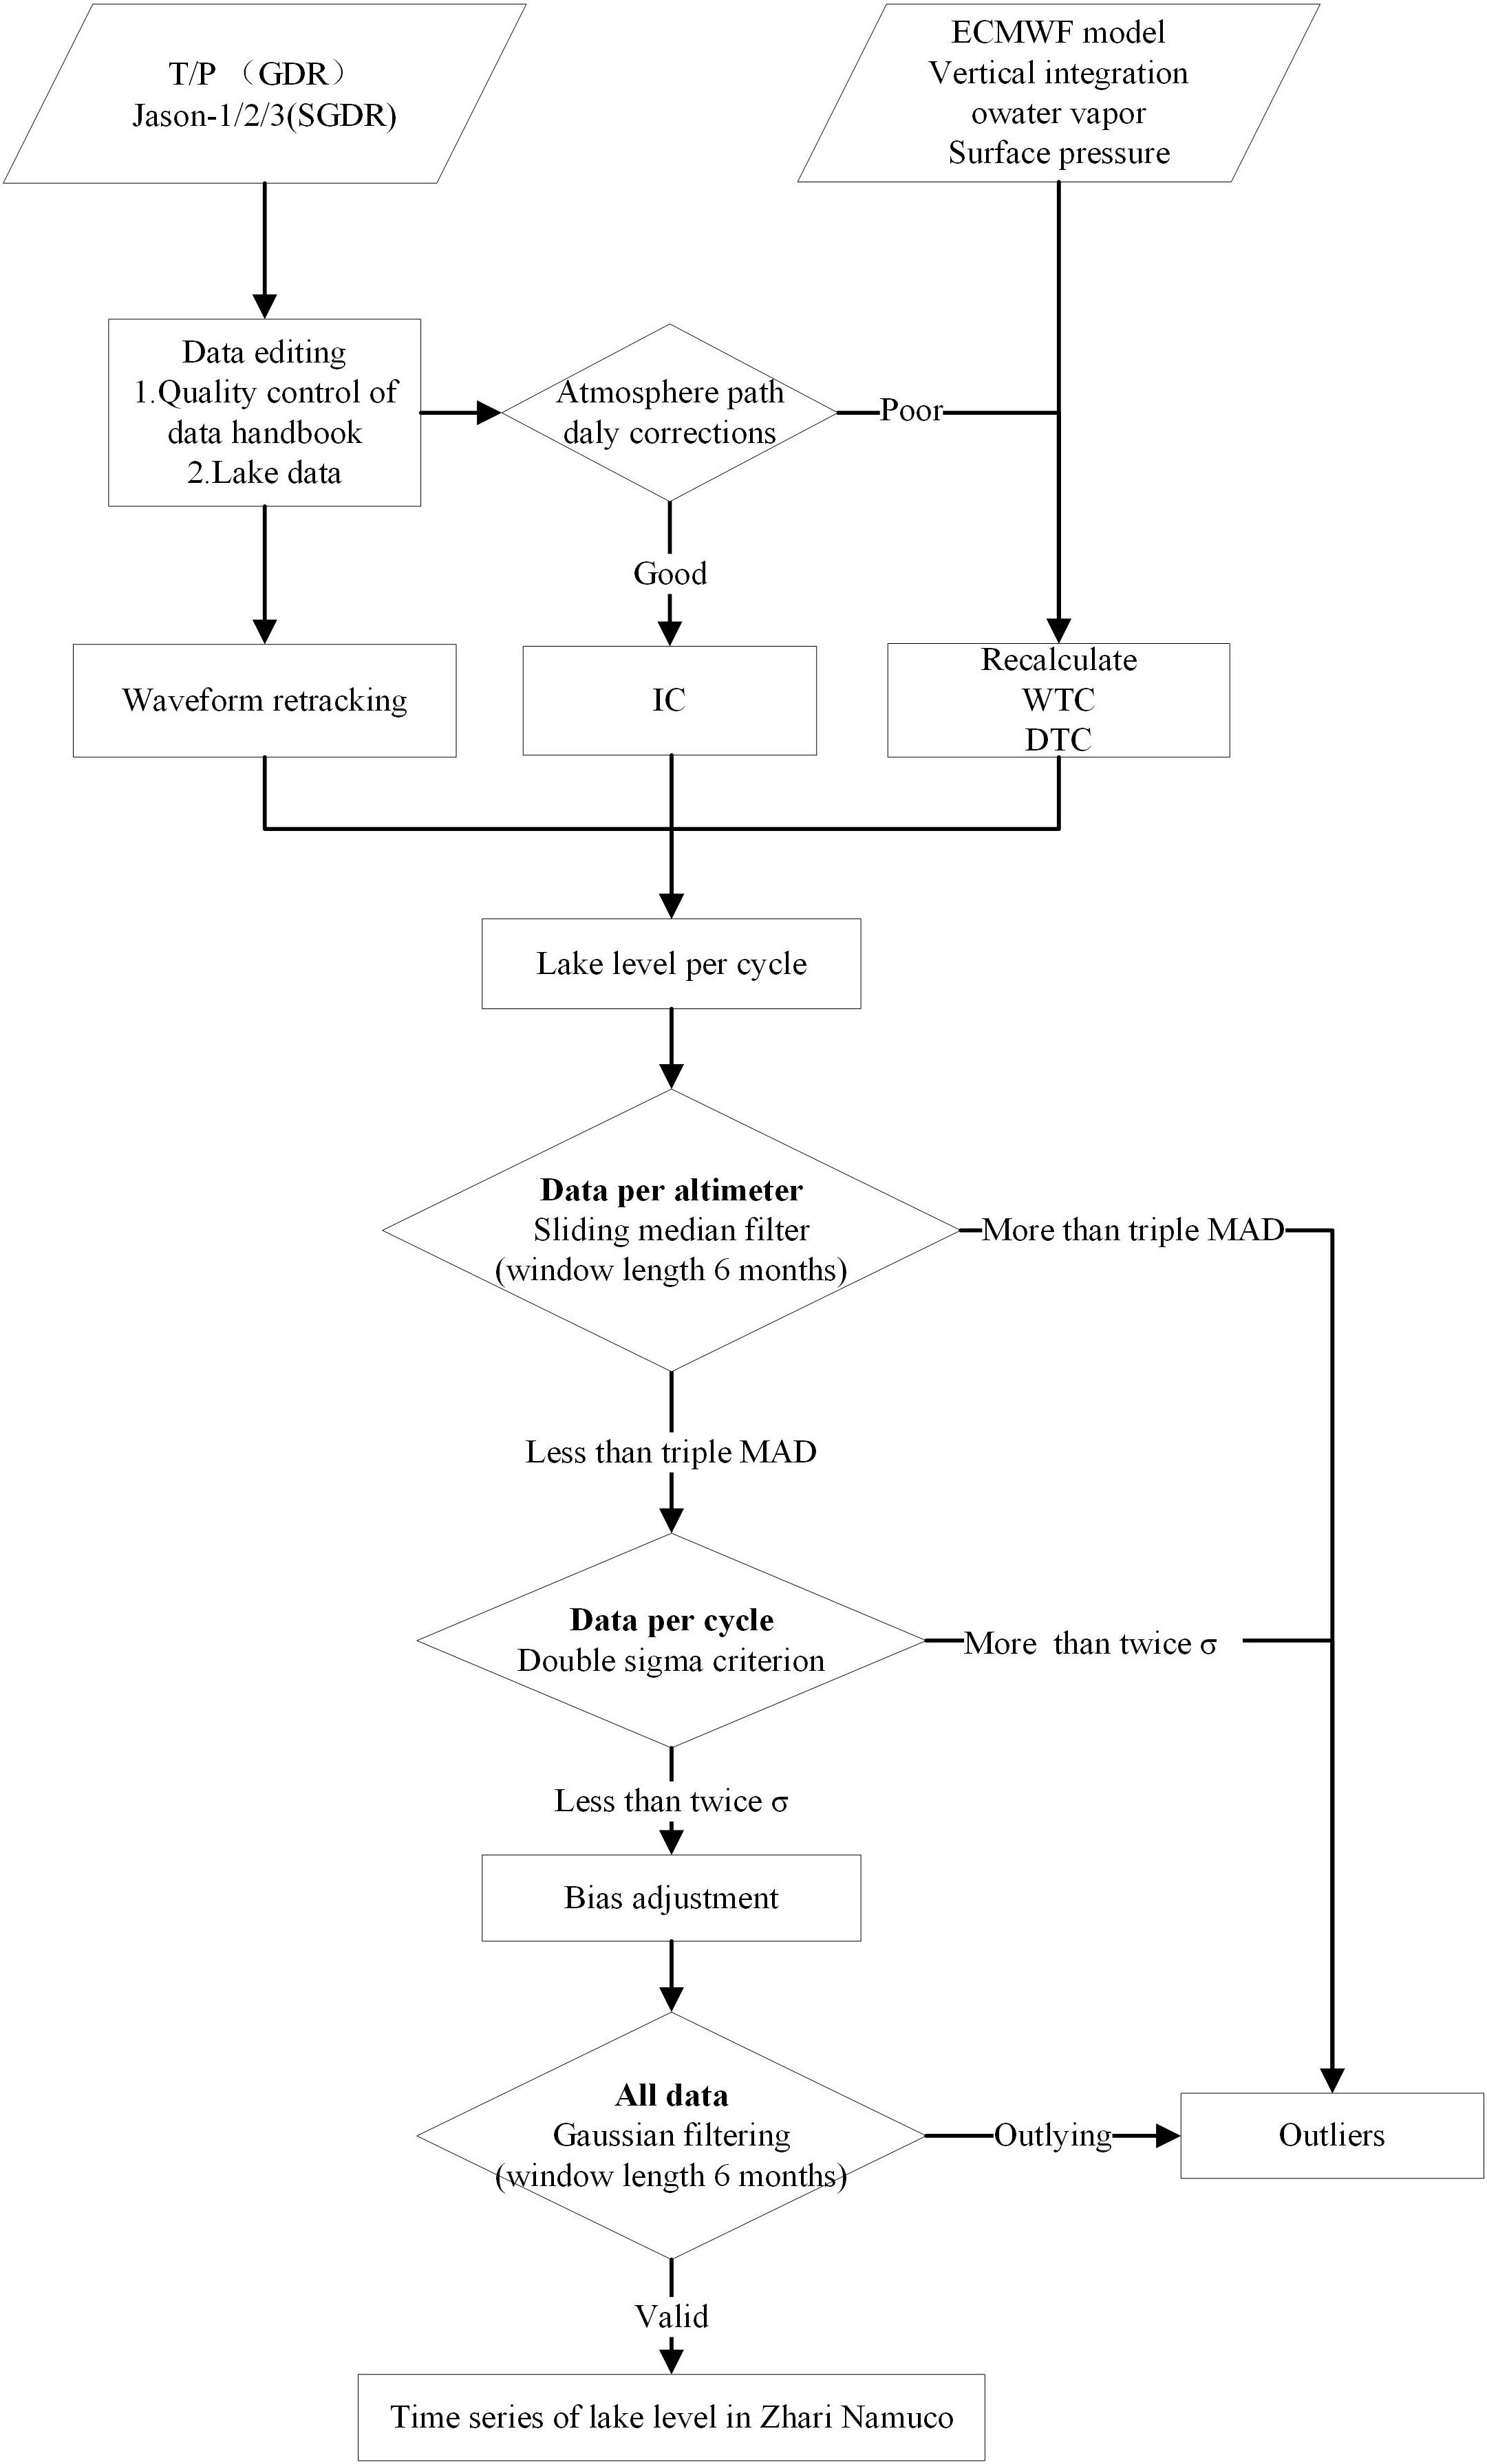
Figure 2. Satellite altimetry processing flow.
Atmosphere Path Daly Corrections
Bias, caused by the use of unsuitable models when combining multiple altimeter observations, is avoided, and atmospheric path delay corrections used in each altimeter product are checked. Figure 3 shows the atmosphere path delay corrections in the T/P (GDR), Jason-1 (SGDR), Jason-2 (SGDR), and Jason-3 (SGDR) in the Zhari Namco.
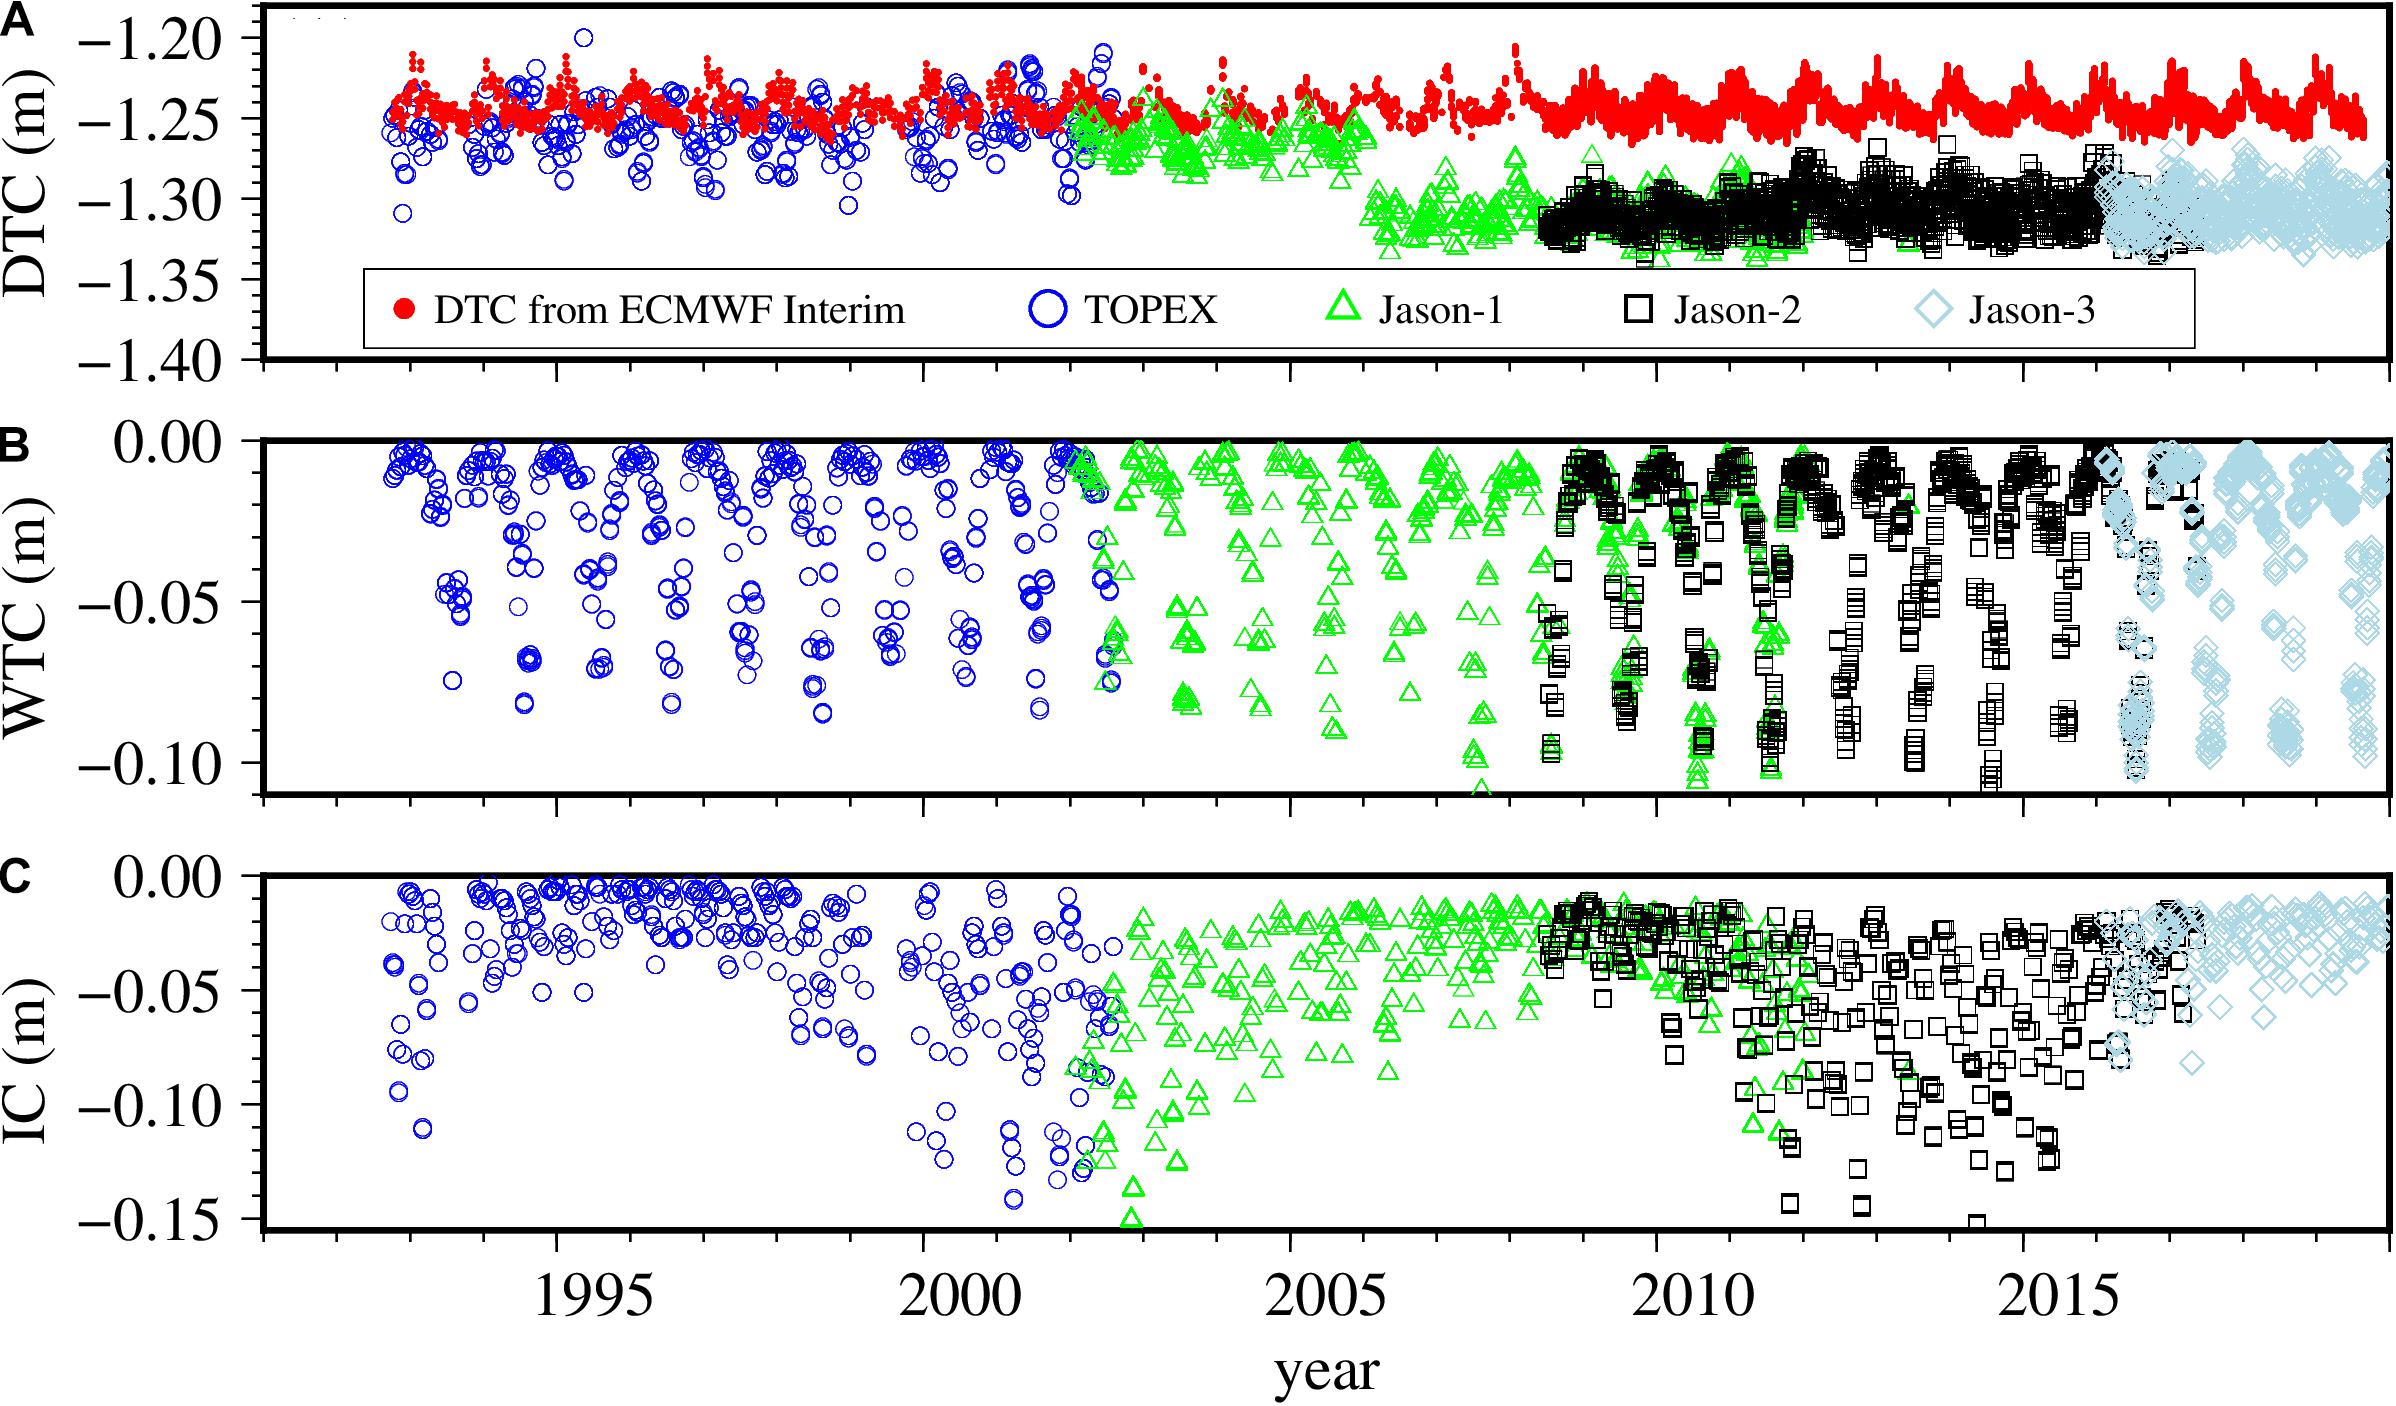
Figure 3. Atmospheric path delay correction of T/P-Jason1/2/3. (A) Dry troposphere correction (DTC). (B) Wet troposphere correction (WTC). (C) Ionosphere correction (IC).
Dry troposphere correction is usually calculated from model-assimilated weather data from ECMWF. The standard deviation (STD) of DTC retrieved by T/P (DGR) is 0.017 cm, while that of Jason1/2/3 is 0.011 cm. The DTC of T/P has more noise than that of Jason (Figure 3A). The DTC in T/P GDR uses sea level pressure instead of surface pressure, so it has a deviation of 1.06 m compared with Jason (Crétaux et al., 2008). The DTC in Jason-1 SGDR drops by 2.6 cm in 2006, due to the surface pressure deviation correction in the ECMWF model. Based on the above analysis, the ECMWF model is used to recalculate the DTC of T/P (Guo et al., 2012; Gao et al., 2014), which shows excellent consistency.
Radiometer measurements are contaminated by land, so WTC for inland must be recalculated using a numerical weather model. In Jason1/2/3 SGDR, WTC is calculated by ECMWF, but T/P is not given in this zone, which can be recalculated by,
where, ρvap(z) is water vapor density at altitude Z; and R is the maximum height (Hwang et al., 2005). The recalculated WTC in Figure 3B shows excellent consistency in the area. In mid-latitude region, the constant Teff = 6.19(cm3g−1) is taken based on the empirical value, where , Teff = 278K, and the integral of ρvap(z) comes from ECMWF.
The model values derived from the total electron content of the ionospheric correction (IC) are presented in Figure 3C. They are extracted from altimeter data products. T/P mission adopts a climatologic model (Bent model), and Global Ionospheric Maps (GIM) for Jason1/2/3 (Ho et al., 1997). Rosy consistency in both models, the IC gathered from the dataset can be used directly.
Waveform Retracking
In addition to geophysical corrections, survey quality is contaminated by land reflection waveforms. These land reflection waveforms cause the failure of the onboard tracker to exploit the accurate distance between the satellite and the bottom surface (Gao et al., 2014). Figure 4A shows the Jason-2 waveforms in 2010 over Zhari Namco. These waveforms are complex and seasonal. In winter, the waveforms with an extremely narrow trailing edge are dominant (Figure 4B). In summer, the waveforms are more complex, and some waveforms are similar to the ocean waveforms of the Brown model (Ho et al., 1997). In most cases, waveforms are contaminated by land, resulting in an abnormal peak at the trailing edge (Figure 4C). Calm lake surface will lead to a mirror wave in summer, and the wave amplitude is larger in winter due to high reflectivity of ice surface.
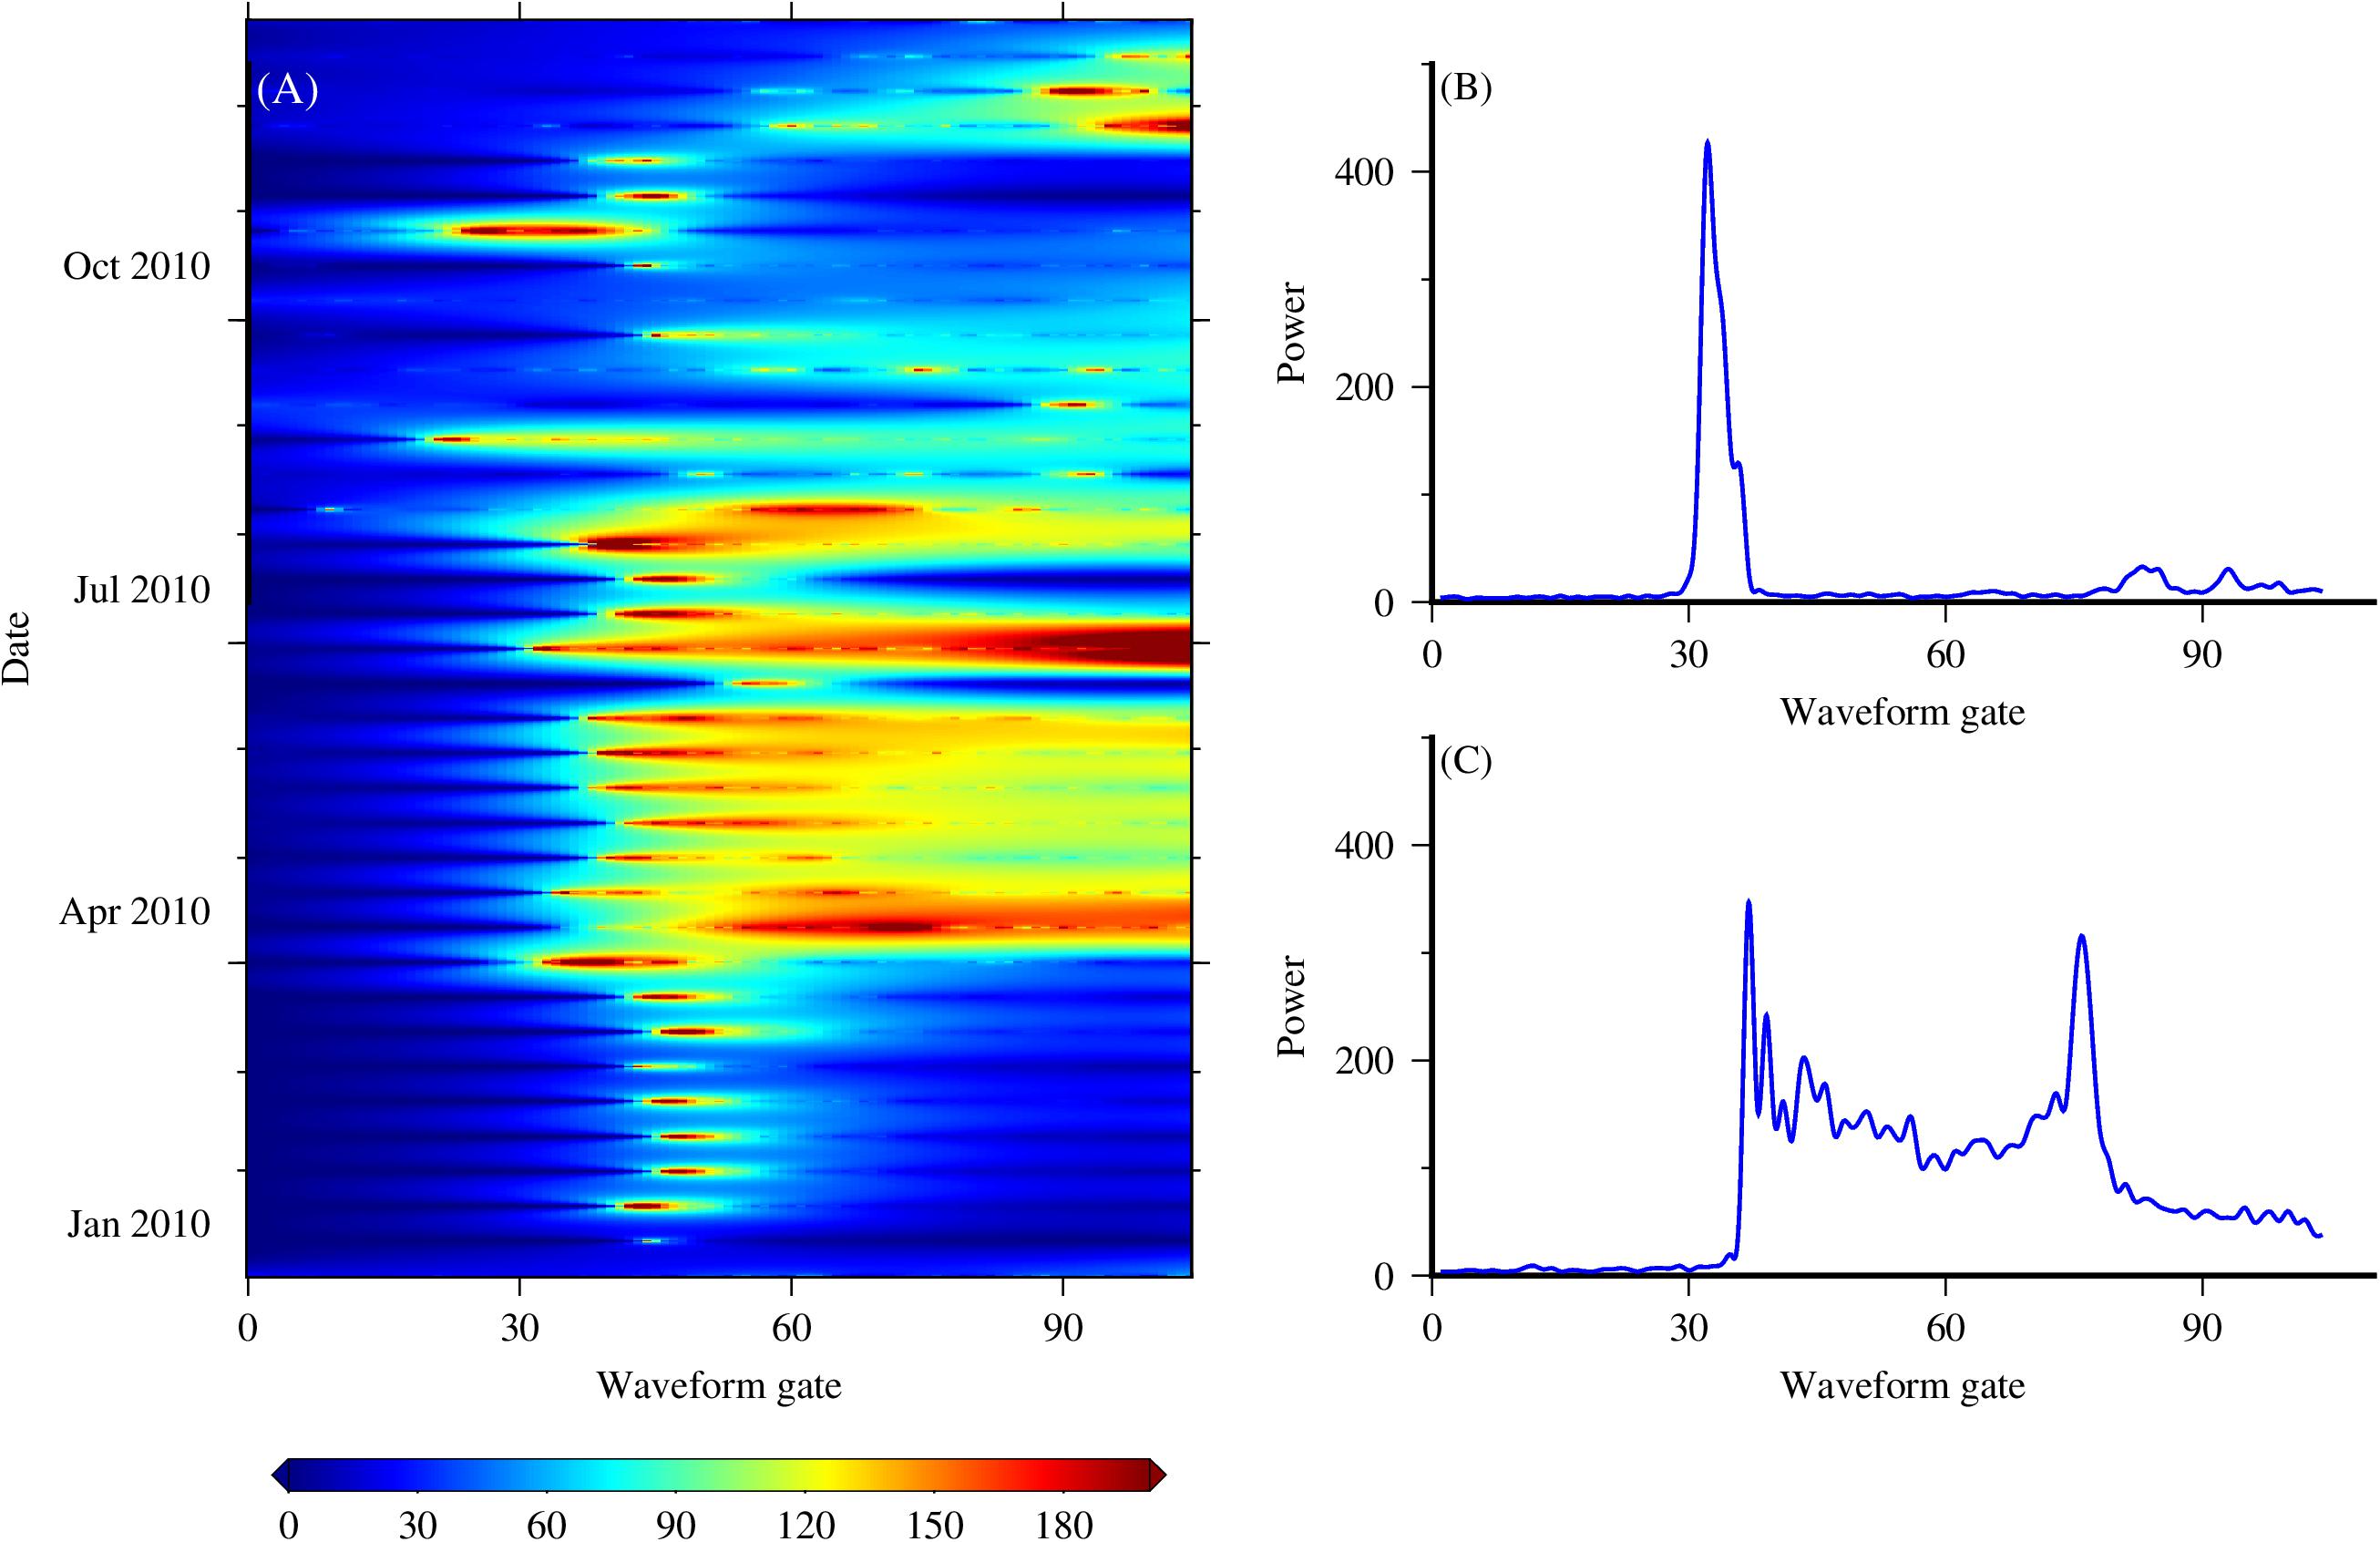
Figure 4. Waveform of Jason-2 altimeter in 2010. (A) The annual waveform. (B) Typical winter waveform. (C) Typical summer waveform.
The wave reflection on the lake deviates from the Brown model, necessitating the retracking of the waveform. In the threshold waveform retracking algorithm, the threshold selection has a significant impact on the result of waveform reset. The commonly used thresholds are 10%, 20%, and 50%. It is found that different thresholds are chosen depending on the reflection conditions in the study area. When the volume scattering plays a dominant role in the waveform shape (e.g., land, ice sheet, etc.), the threshold value is 10%; when the waveform is mainly affected by surface scattering (such as vast water), the 50% threshold can better represent the average surface elevation of radar wave footprint; when volume scattering and surface scattering play a leading role (such as inland lakes, wetlands, and offshore areas), the 20% threshold should be used as a compromise between the two extreme cases (Li et al., 2020). Zhari Namco is an inland lake with an average water depth of 3.6 m (Wang et al., 2010) so Threshold (20%) of waveform weight tracking method is used.
Outlier Detection and Mean Lake Level
TOPEX/Poseidon (GDR) is a product with a sampling frequency of 1 Hz that has three observations per cycle of Zhari Namco. Jason-1/2/3 (SGDR) is a product with a sampling frequency of 20 Hz, with more lake level observations in each cycle. Taking Jason-2 as an example, after eliminating the outliers, the average number of observations per cycle is 36.
Even after waveform retracking and geophysical correction are applied, the lake level is still noisy, so outliers should be eliminated before calculating the mean lake level of each cycle. It is arduous to eliminate all outliers by using a specific method. A two-step outlier detection method based on a sliding median filter and 2σ criterion is used (Okeowo et al., 2017). Here Jason-2 is taken as an example (Figure 5). Firstly, a sliding method for determining outliers is repeated for all periods until no more outliers are found. Observations are rejected as outliers, which are greater than three local median absolute deviations (MAD) from the local median over a 6-month-wide window. MAD is defined as,
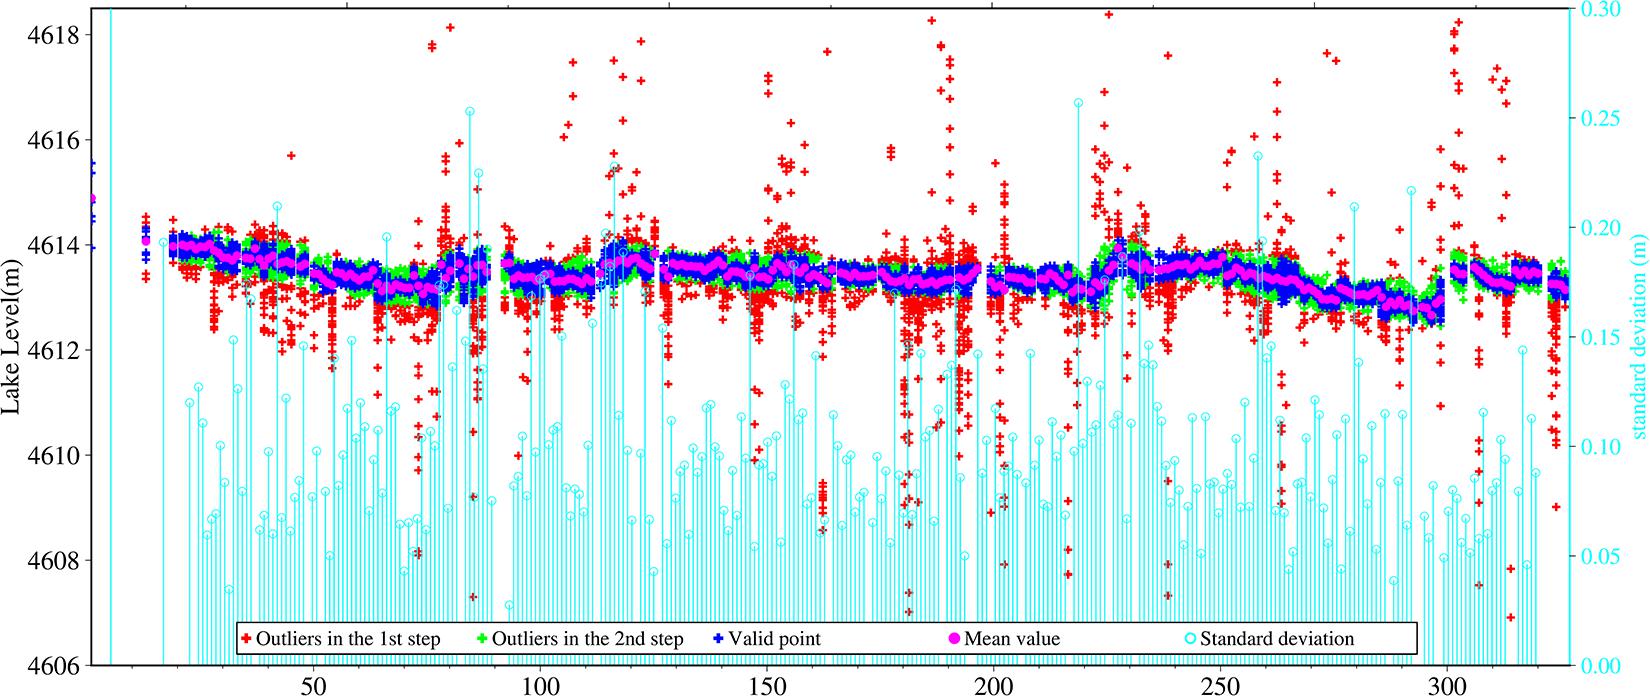
Figure 5. Example of outlier detection in the case of Jason-2 observations over Zhari Namco.
where, N is the total number of observations in the window. To obtain accurate lake levels, the second step is to adopt a more strict outliers detection standard. The 2σ criterion is repeatedly used in the observation of each cycle, i.e., the lake level more than twice the root mean square (RMS) error in each cycle is determined as the outlier and removed. The lake level STD of 83% cycles (Figure 5) is less than 0.15 m. The rejected outliers account for 37% of the total Jason-2 data, of which 78% can be eliminated by moving MAD. After eliminating outliers, the mean lake level is estimated for each cycle to construct the sequence.
Bias Adjustment
Bias adjustment refers to the systematic deviation between altimeters. In the fusion process of multiple altimeters, the observation data of each altimeter cannot be connected accurately, which needs to be adjusted to form a continuous time series. The bias adjustment is of great significance to the construction of time series with multi-mission data (Vu et al., 2018). Assuming that a lake is a wide plain, the lake height observed by altimeter A should be equal to the lake height observed by altimeter B at the same epoch tj. However, their difference,
is not equal to zero due to the bias and noise. N is the observations numbers of paired samples in the overlapping cycle of two missions. The bias can be determined by using synchronous data between two missions. Usually, two satellites do not overfly the lake at the same time. Interpolation is needed for the compute of differences, which may lead to interpolation error. The change of lake surface in a short period can be ignored in tandem missions (a flight mode for two satellites) setup of T/P-Jason1/2/3. The difference can be calculated directly.
The tandem flight of T/P-Jason1/2/3 missions makes overlapping observations between two sequential satellites for inter-satellite calibration (Gao et al., 2014). Due to the lack of overlapping data, the bias between T/P and Jason-1 uses observations at intervals of less than 30 days. The adjustment of the bias between Jason-1/2/3 uses lake level data with a time interval between the two altimeters of less than 5 days. Over the Zhari Namco, 10 paired-sample observations are found in the overlap between T/P and Jason-1. For Jason-1 and Jason-2, 57 paired-sample observations are retrieved. For Jason-2 and Jason-3, 20 paired-sample observations are searched.
The bias of Jason-1 with respect to T/P is 66.1 cm. Jason-2 has a mean lake level bias of 19.4 cm with respect to Jason-1. The bias of Jason-3 with respect to Jason-2 is −16.9 cm. Finally, all biases of Jason-1/2/3 with respect to T/P are tabulated in Table 2.
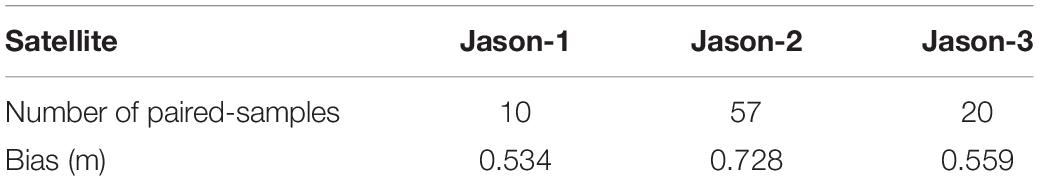
Table 2. Biases of Jason-1/2/3 with respect to T/P.
Results and Analysis
For the T/P-Jason1/2/3 missions from October 1992 to August 2019, the consistency of atmosphere path delay correction of each altimeter data is checked, and the corrections are recalculated. According to the waveform combined with the surface type, waveform corrections are calculated. From Eq. 1, abnormal lake levels are eliminated by a two-step method, then the average value of lake level in each cycle is obtained. After adjusting the bias between altimeters, the 27-year time series of lake level in Zhari Namco is generated with Gaussian filtering. Zhari Namco’s lake level rose by ∼ 5.7 m from 1992 to 2019, with an overall trend of 0.13 ± 0.02 m/yr, showing a fluctuating rate (1992–1999: −0.25 ± 0.05 m/yr, 2000–2008: 0.26 ± 0.04 m/yr, 2009–2016: −0.05 ± 0.03 m/yr, 2017–2019: 1.34 ± 0.34 m/yr). In this section, temperature, precipitation, EWH, and lake area are used to further confirm the change of lake levels.
Altimeter-Derived Lake Level Accuracy
Figure 6A shows the lake levels derived from T/P, Jason-1, Jason-2, and Jason-3. Jason-2, with effective observation in 285 cycles in Zhari Namco, is the altimeter with the most data extracted from four satellites. Jason-2 has an average of 36 observations per cycle. The average STD of each Jason-2 cycle is 10.8 cm. 284 of Jason-2’s 285 cycles have an STD of less than 30.0 cm, so 30.0 cm is used as the threshold of other altimeters data. T/P data are more unstable, and the maximum STD reaches nearly 90.0 cm. The reason is that T/P data have not been retracked and the amount of GDRs is relatively small. Figures 6B–E shows the distribution of STD for T/P-Jason1/2/3 altimeters, and it can be found that these STDs are normally distributed. They expectation (μ) and standard deviation (σ) are stable.
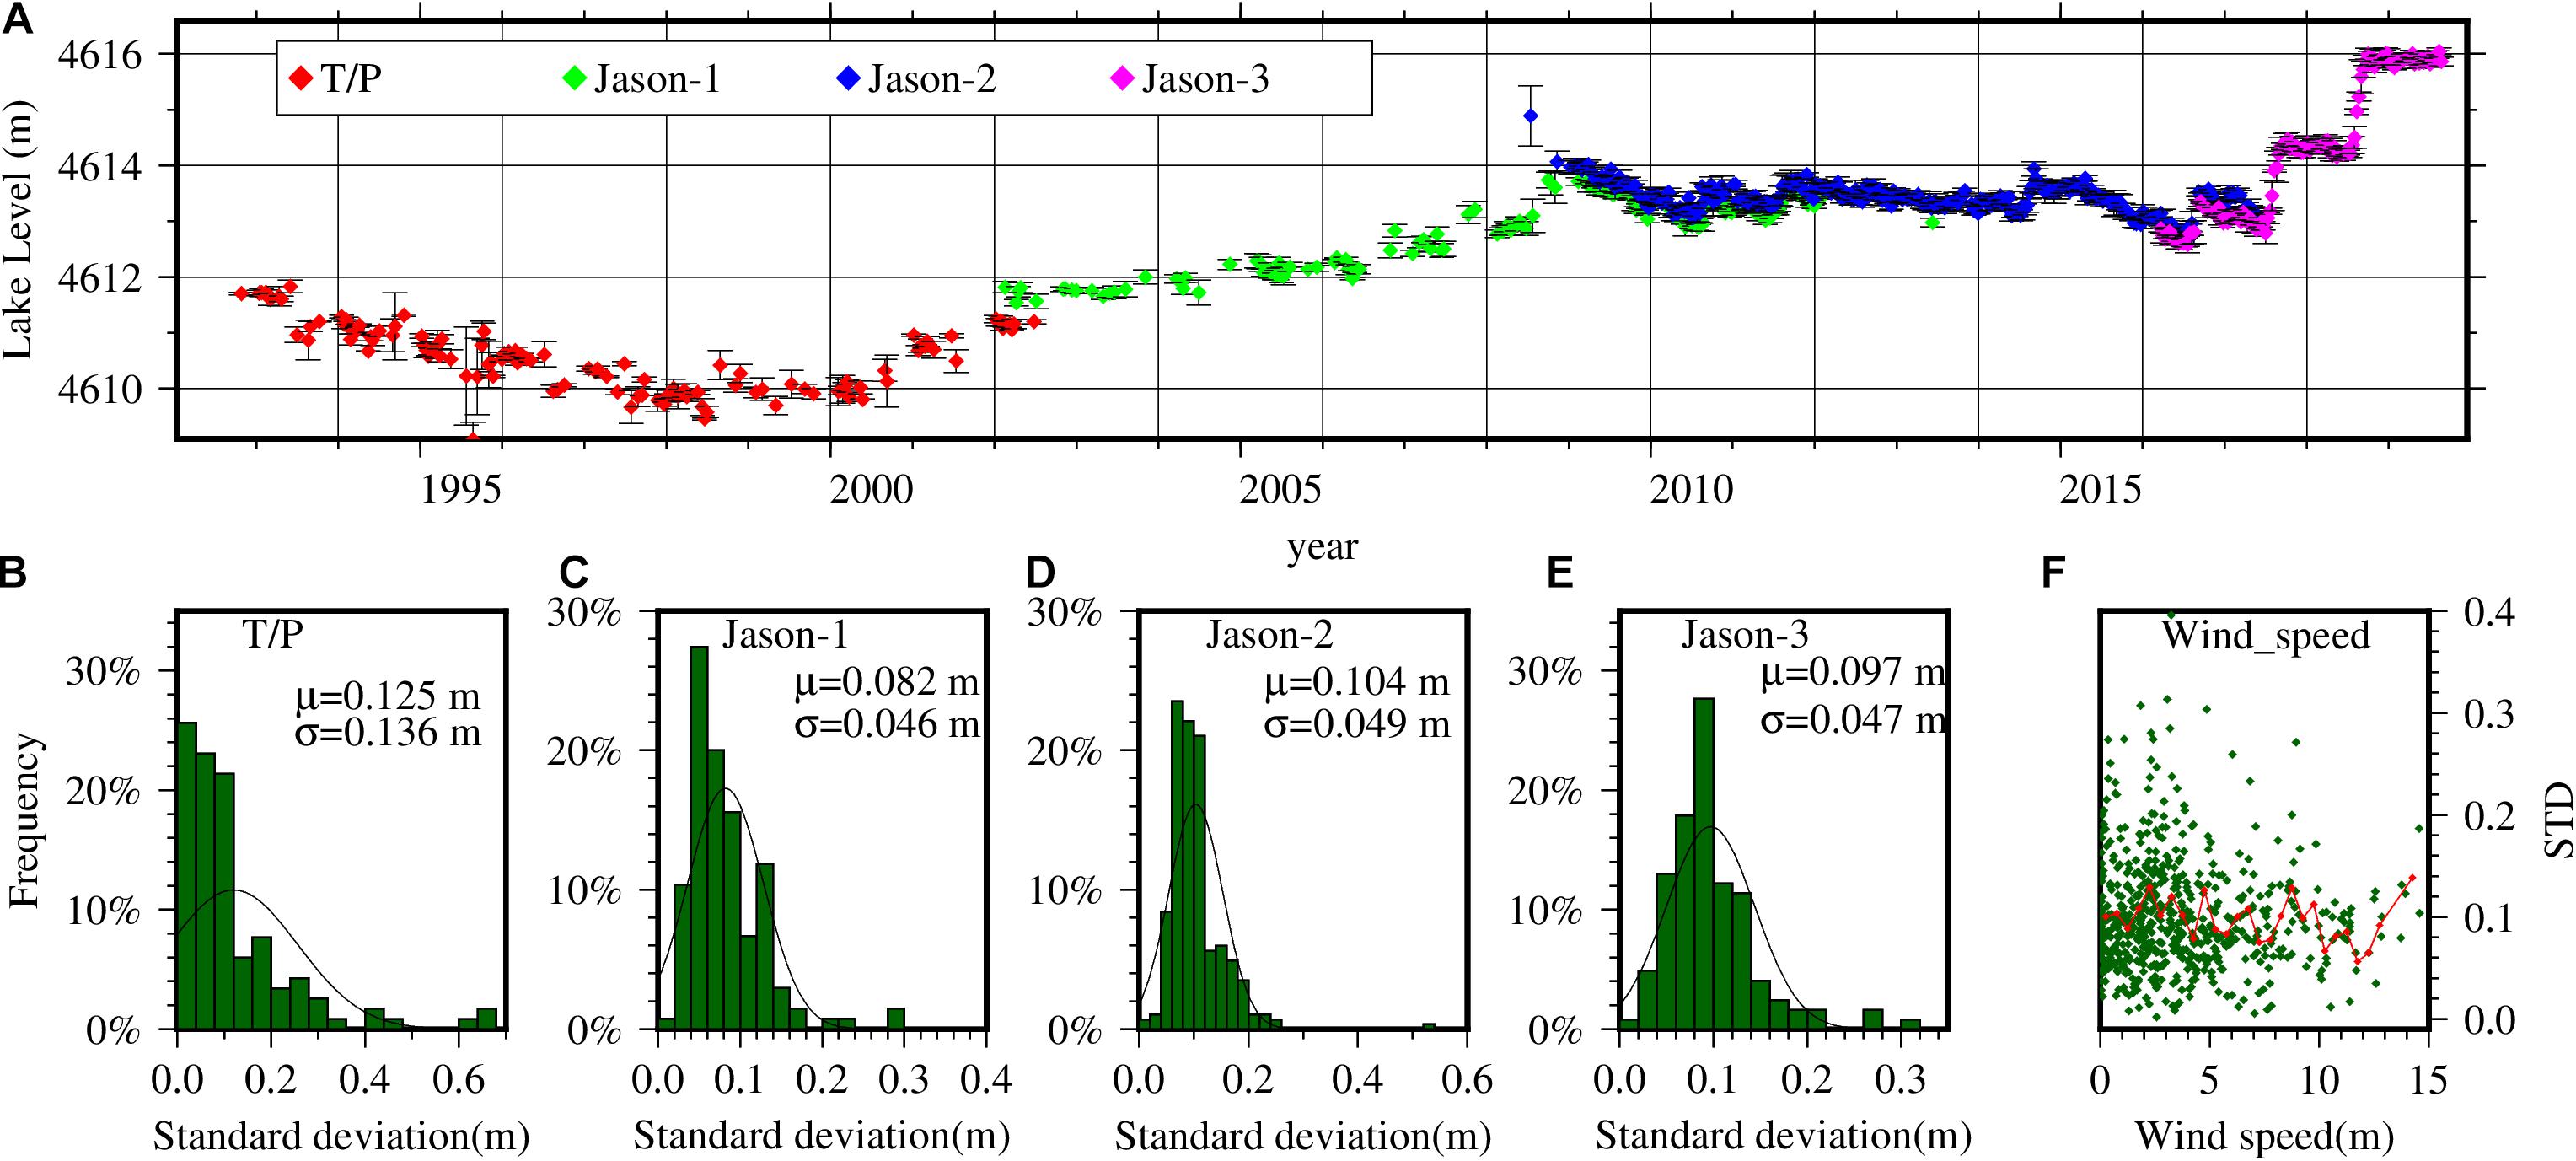
Figure 6. Mean lake level derived from various satellites and histograms of their STDs. (A) Mean lake level; (B) TOPEX/Poseidon; (C) Jason-1; (D) Jason-2; (E) Jason-3; (F) The relationship between wind speed and STD.
Wind speed (when the altimeter track passed) and the STD of lake levels are plotted in Figure 6F. In theory, wind can control water waves on lake surface, and further influence the lake level precisely. The correlation coefficient (CC) between wind speed and water level STD is −0.045, hence there is no significant correlation between them. The possible reasons are as follows: Surface wave field and wind surface roughness are approximately homogeneous within the proper satellite footprint (Fu and Cazenave, 2001). The lake level is obtained from the average distance measured by an altimeter in the footprint (Diameter ∼2.2 km). Besides, waveform retracking weakens the influence of complex waveforms. The effect of wind speed is small and hence ignored.
The results show that the accuracy of lake level in summer is lower than that in winter. In particular, the average STD of Jason-2 is 10.6 cm in July and August, and 10.2 cm in January and February. First of all, the complex shape of summer waveform reduces the accuracy of waveform retracking, and a more accurate waveform purification algorithm [automatically identify altimetry measurements corresponding to open water, ice and transition (Ziyad et al., 2020)] can improve the quality. Secondly, the change of lake boundary is not taken into account in the data screening process. A static coastline is used in the screening process, and some land observations are extracted, especially when lake level is low (e.g., T/P altimeter). The reduction of the lake area also makes satellite observations noisier, which is one of the reasons for the poor quality of T/P data. The establishment of a time-varying lakeshore model is strenuous, which requires satellite images and other sources. Therefore, a process for outlier removal is often used, instead of using dynamic shorelines.
Time Series of Lake Level
Before generating the time series of lake level, there are still some abnormal values and the time interval is inconsistent. Firstly, the remote observations larger than 2σ are removed from the observations after the bias adjustment, and then the missing data are linearly interpolated. Gaussian filtering is performed to generate a uniform and continuous sequence. The time series filtered with a 12-month window is too smooth, with intra-annual amplitudes dramatically attenuated. The results with a 3-month and a 6-month window length are rather similar, both keep in energy very well. Relatively, the former has more small spikes than the latter (Wang et al., 2019). Therefore, the 6-month-wide filter window is used.
According to the time series (see Figure 7), the lake level in Zhari Namco decreased before 1999, showing a negative growth trend of −0.25 m/yr, and continued to rise after 1999. After December 2008, the rising trend changed, and the lake level continued to decline slowly in the next 8 years. It is worth noting that the lake level rose by 1.3 m and 1.6 m, respectively, from June to November 2017 and July to November 2018. In the 20 years from 1999 to 2019, the lake level in Zhari Namco rose by ∼ 5.7 m. The average rising rate of lake level is 0.14 m/yr in the 27 years from 1992 to 2019.
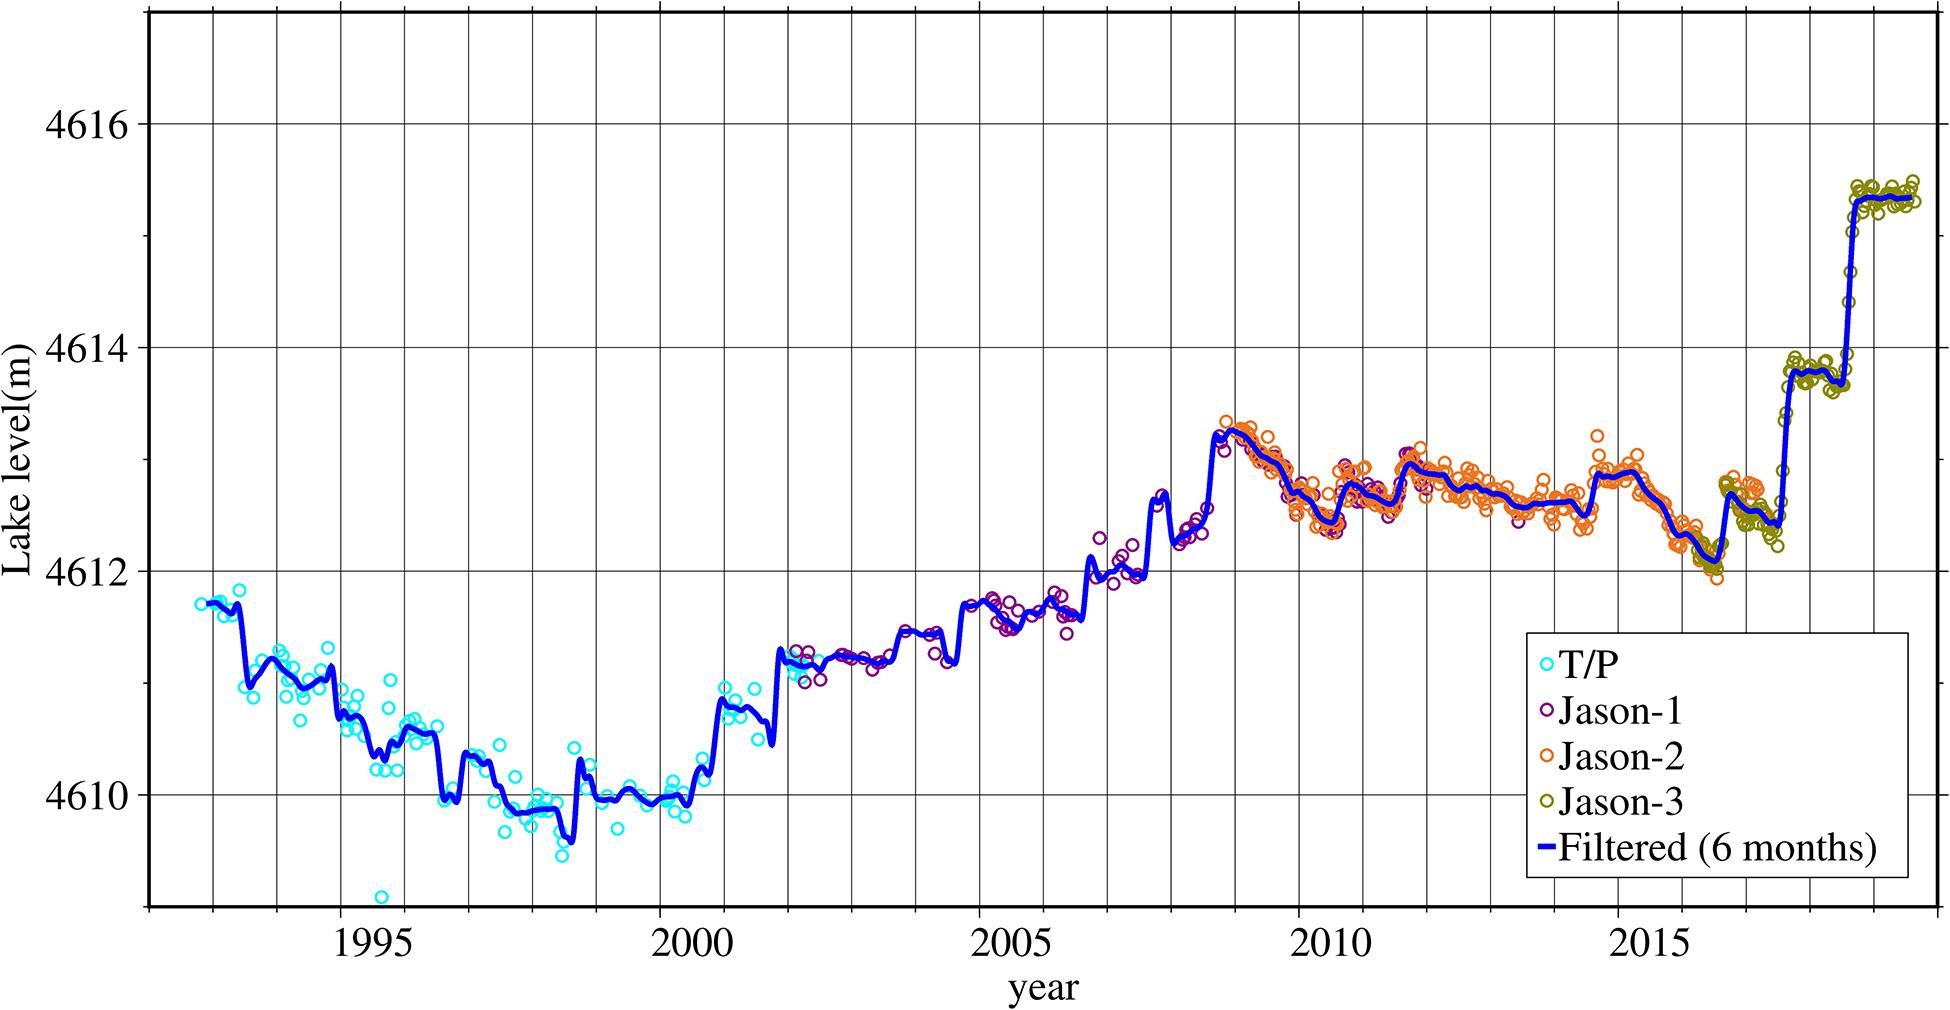
Figure 7. Time series of lake level in Zhari Namco.
Comparison With Other Databases
Figure 8 shows lake level changes in this study, G-REALM, HTRWLD, Hydroweb, and in situ gauge data. In the Jason-1 period, about 60% of the data in HTRWLD come from Landsat and ENVISAT. More valid values are collected by our method in the Jason-1 observation, while G-REALM has rarely valid values in the same task.
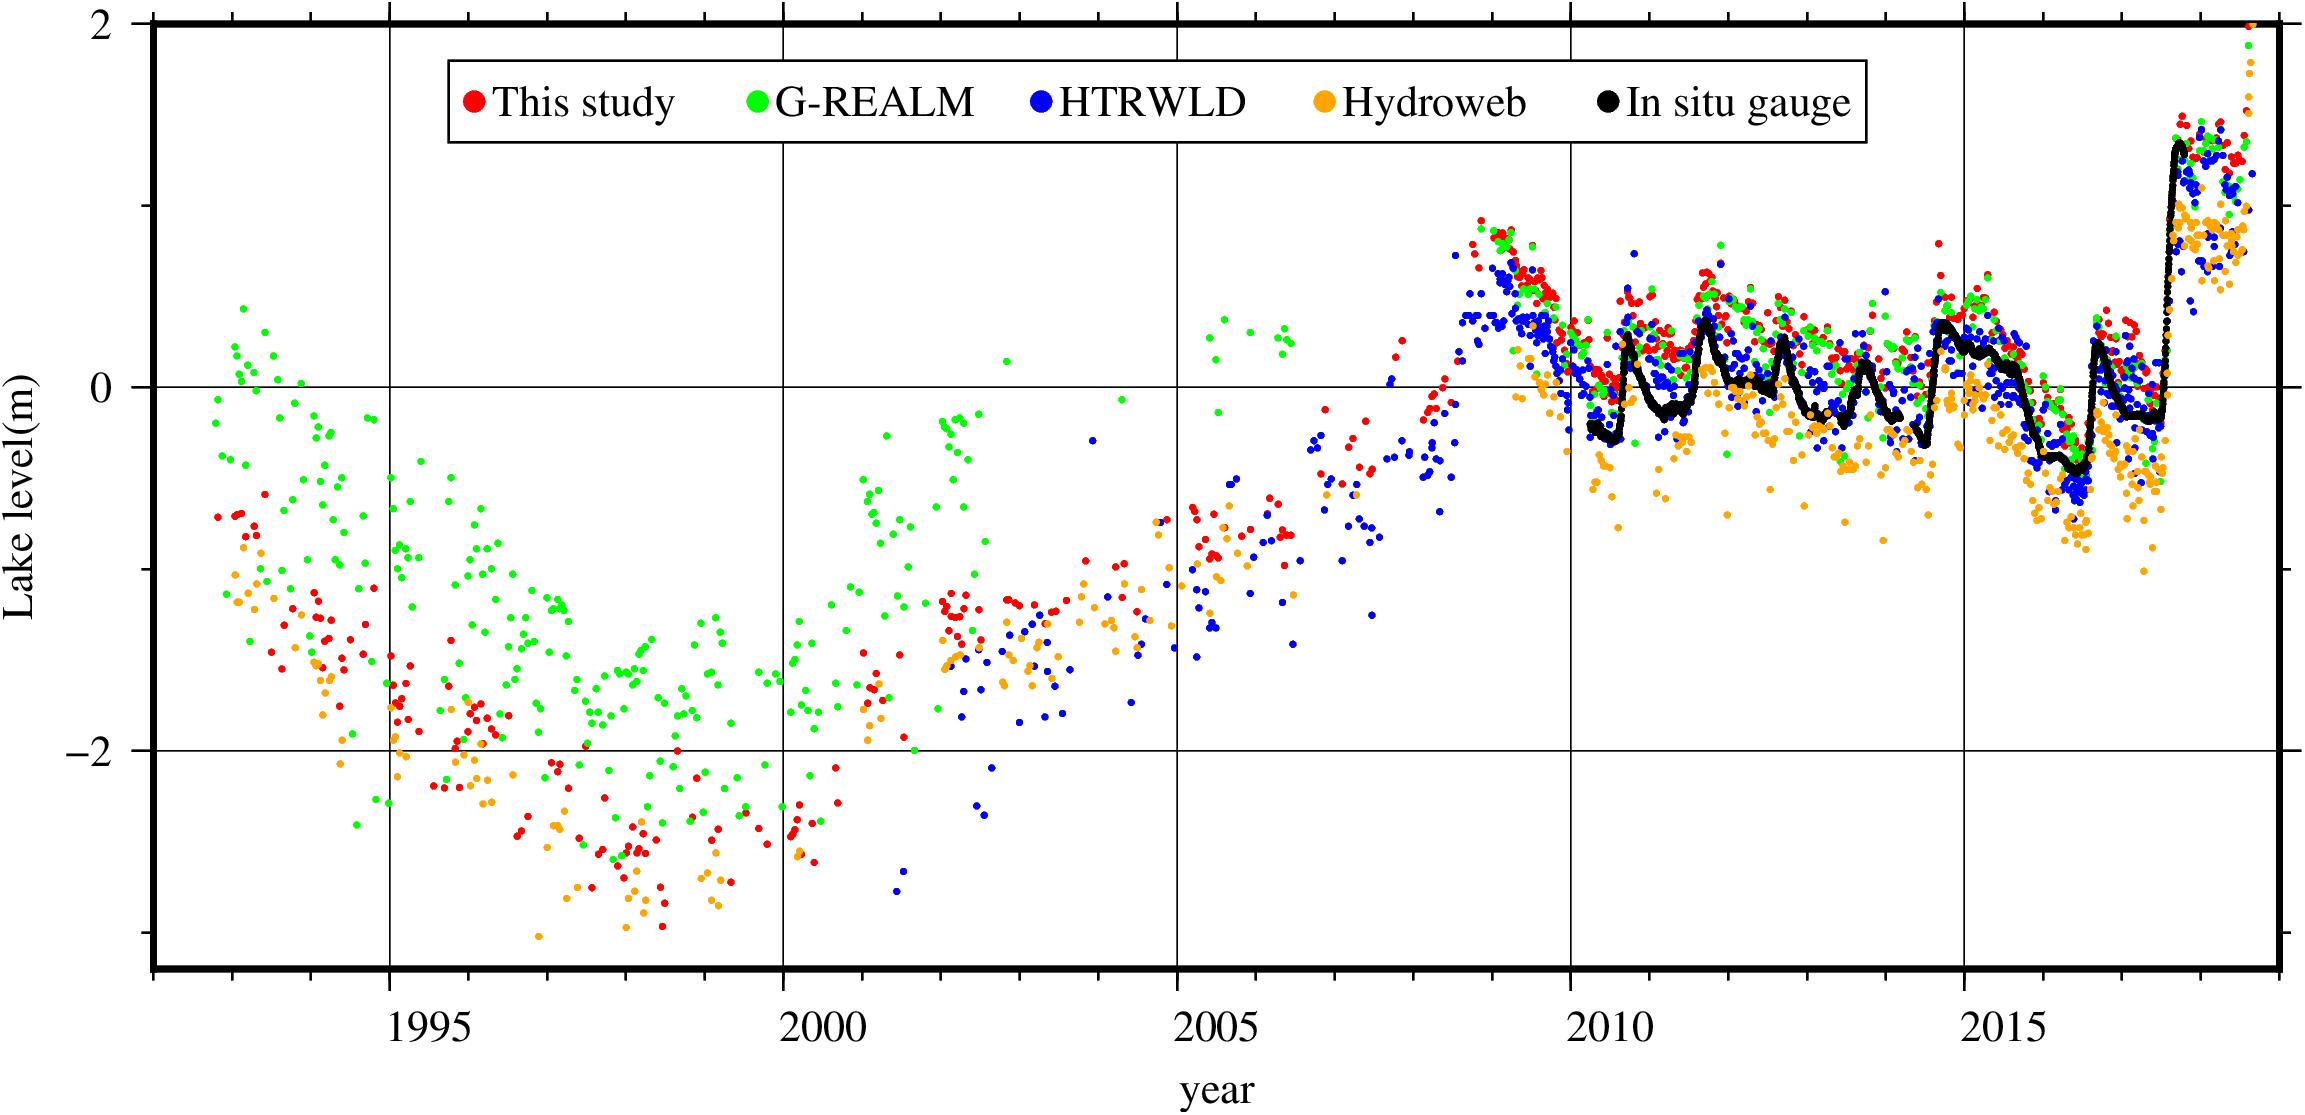
Figure 8. Lake level time series of Zhari Namco from this study, G-REALM, HTRWLD, Hydroweb, and in situ gauge data.
The data of other lake level products and in situ gauge data in the corresponding period (May 2010 – July 2017) are intercepted. The altimeter-derived lake level is discontinuous due to the elimination of outliers, and in situ gauge data show vacancy during the icing period. In the first step, the relative lake level is obtained by subtracting the average value of each data. In the second step, the 30-day series is obtained by linear interpolation. In the third step, Gaussian filtering with a window length of 6 months is carried out for each database, and the results are shown in Figure 9. Table 3 tabulates the statistical results. In order to prove that the lake level change of Zhari Namco in this study can best represent the real lake level change, we regard the in situ gauge lake level as the true value. Max, min, STD, RMS, and CC are calculated when comparing the quality of lake level data from different databases. The difference between this study and in situ gauge is the most stable (STD is the smallest), the deviation from the true value is the smallest (RMS is the smallest), and our data have the highest correlation with real lake level changes (CC is the largest). Our strategy yields the most plausible sequence of lake levels.
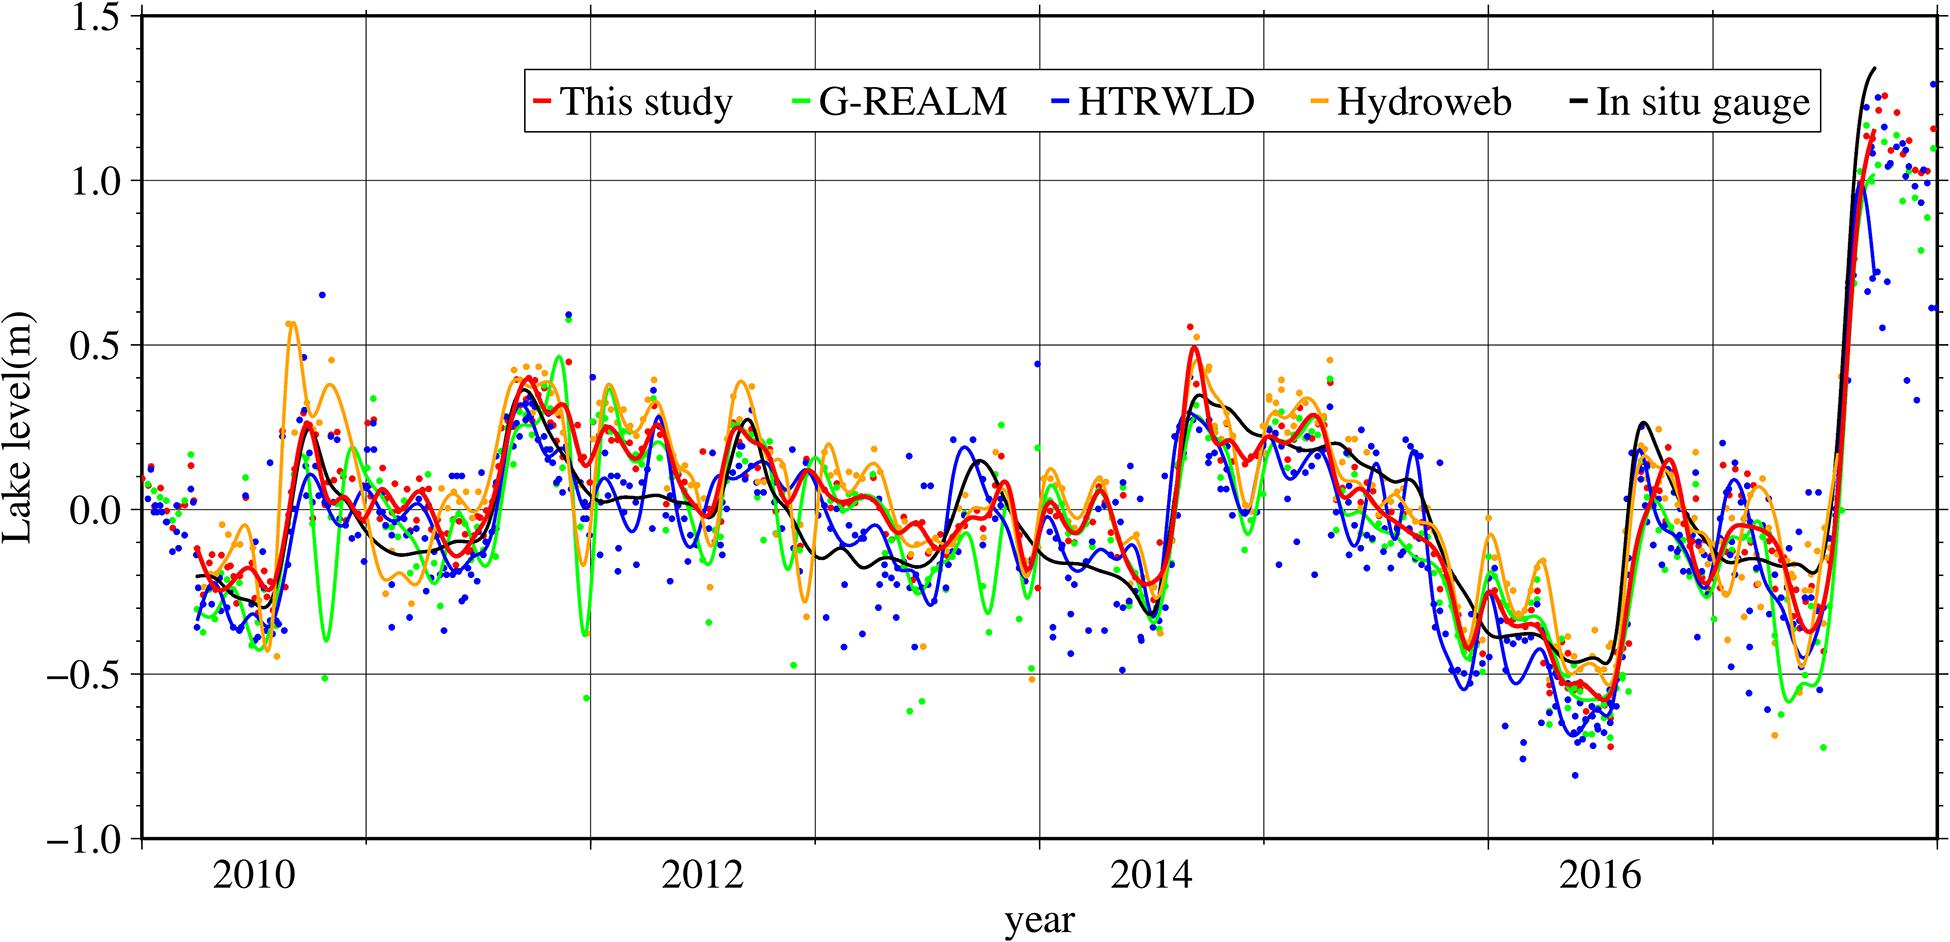
Figure 9. Lake level changes of the four databases corresponding to in situ gauge data.
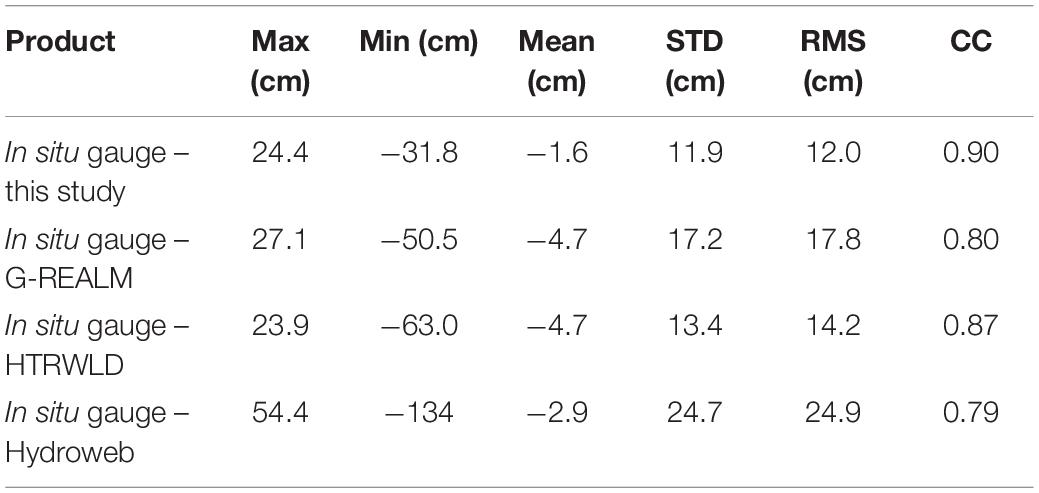
Table 3. Comparative statistics of lake level in Zhari Namco from different databases.
Water Reserves Inversion
Figure 10 shows the EWH time series of Zhari Namco detected by GRACE within 500 km from April 2002 to August 2019. EWH rose sharply in 2018, and the lake level also rose about 1.6 m in the same period. EWH has increased at a rate of 0.42 ± 0.10 cm/yr, and the rising rate of altimeter-derived lake level in Zhari Namco is 14.7 ± 0.03 cm/yr since 2002. The deviation between lake level and EWH is caused by different resolutions. Hence, the relationship between water volume and lake level monitored by GRACE needs to be further analyzed in combination with multi-source satellite data and hydrological model in the future (Guo et al., 2016).
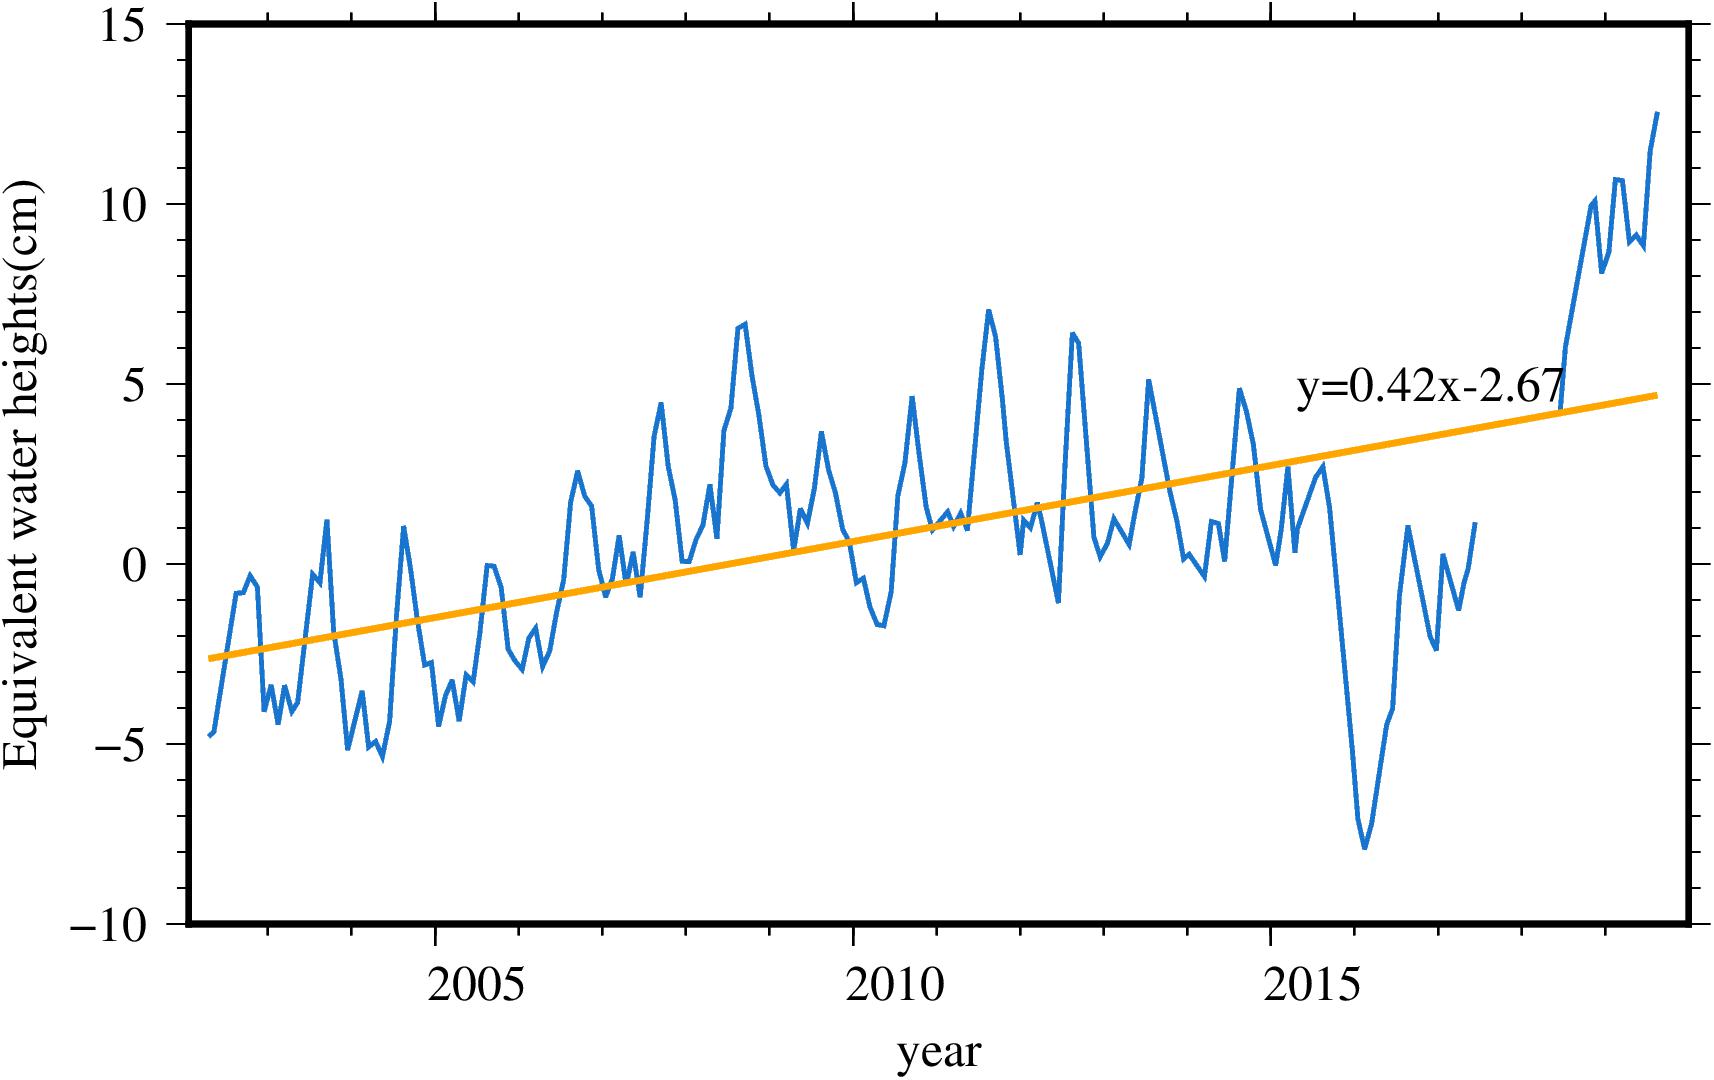
Figure 10. EWH time series.
Lake Area
The lake area of Zhari Namco has increased from 961.3 km2 in 1995 to 1046.3 km2 in 2018 owing to increased lake level (Figure 11; Zhang et al., 2019b). This is in accord with the change of lake level observed by altimetry. Due to the influence of the replenishing river, the slope of the west side of the lake is slow, and lake shoreline changes obviously. In 1995, the east lakeshore had an obvious inward zigzag coastline, flooded by water and moving outward in 2010. The lake area is consistent with the change of lake level. When the water level rose sharply in 2017 and 2018, the lake area also surged. It is enough to confirm the changing pattern of lake level.
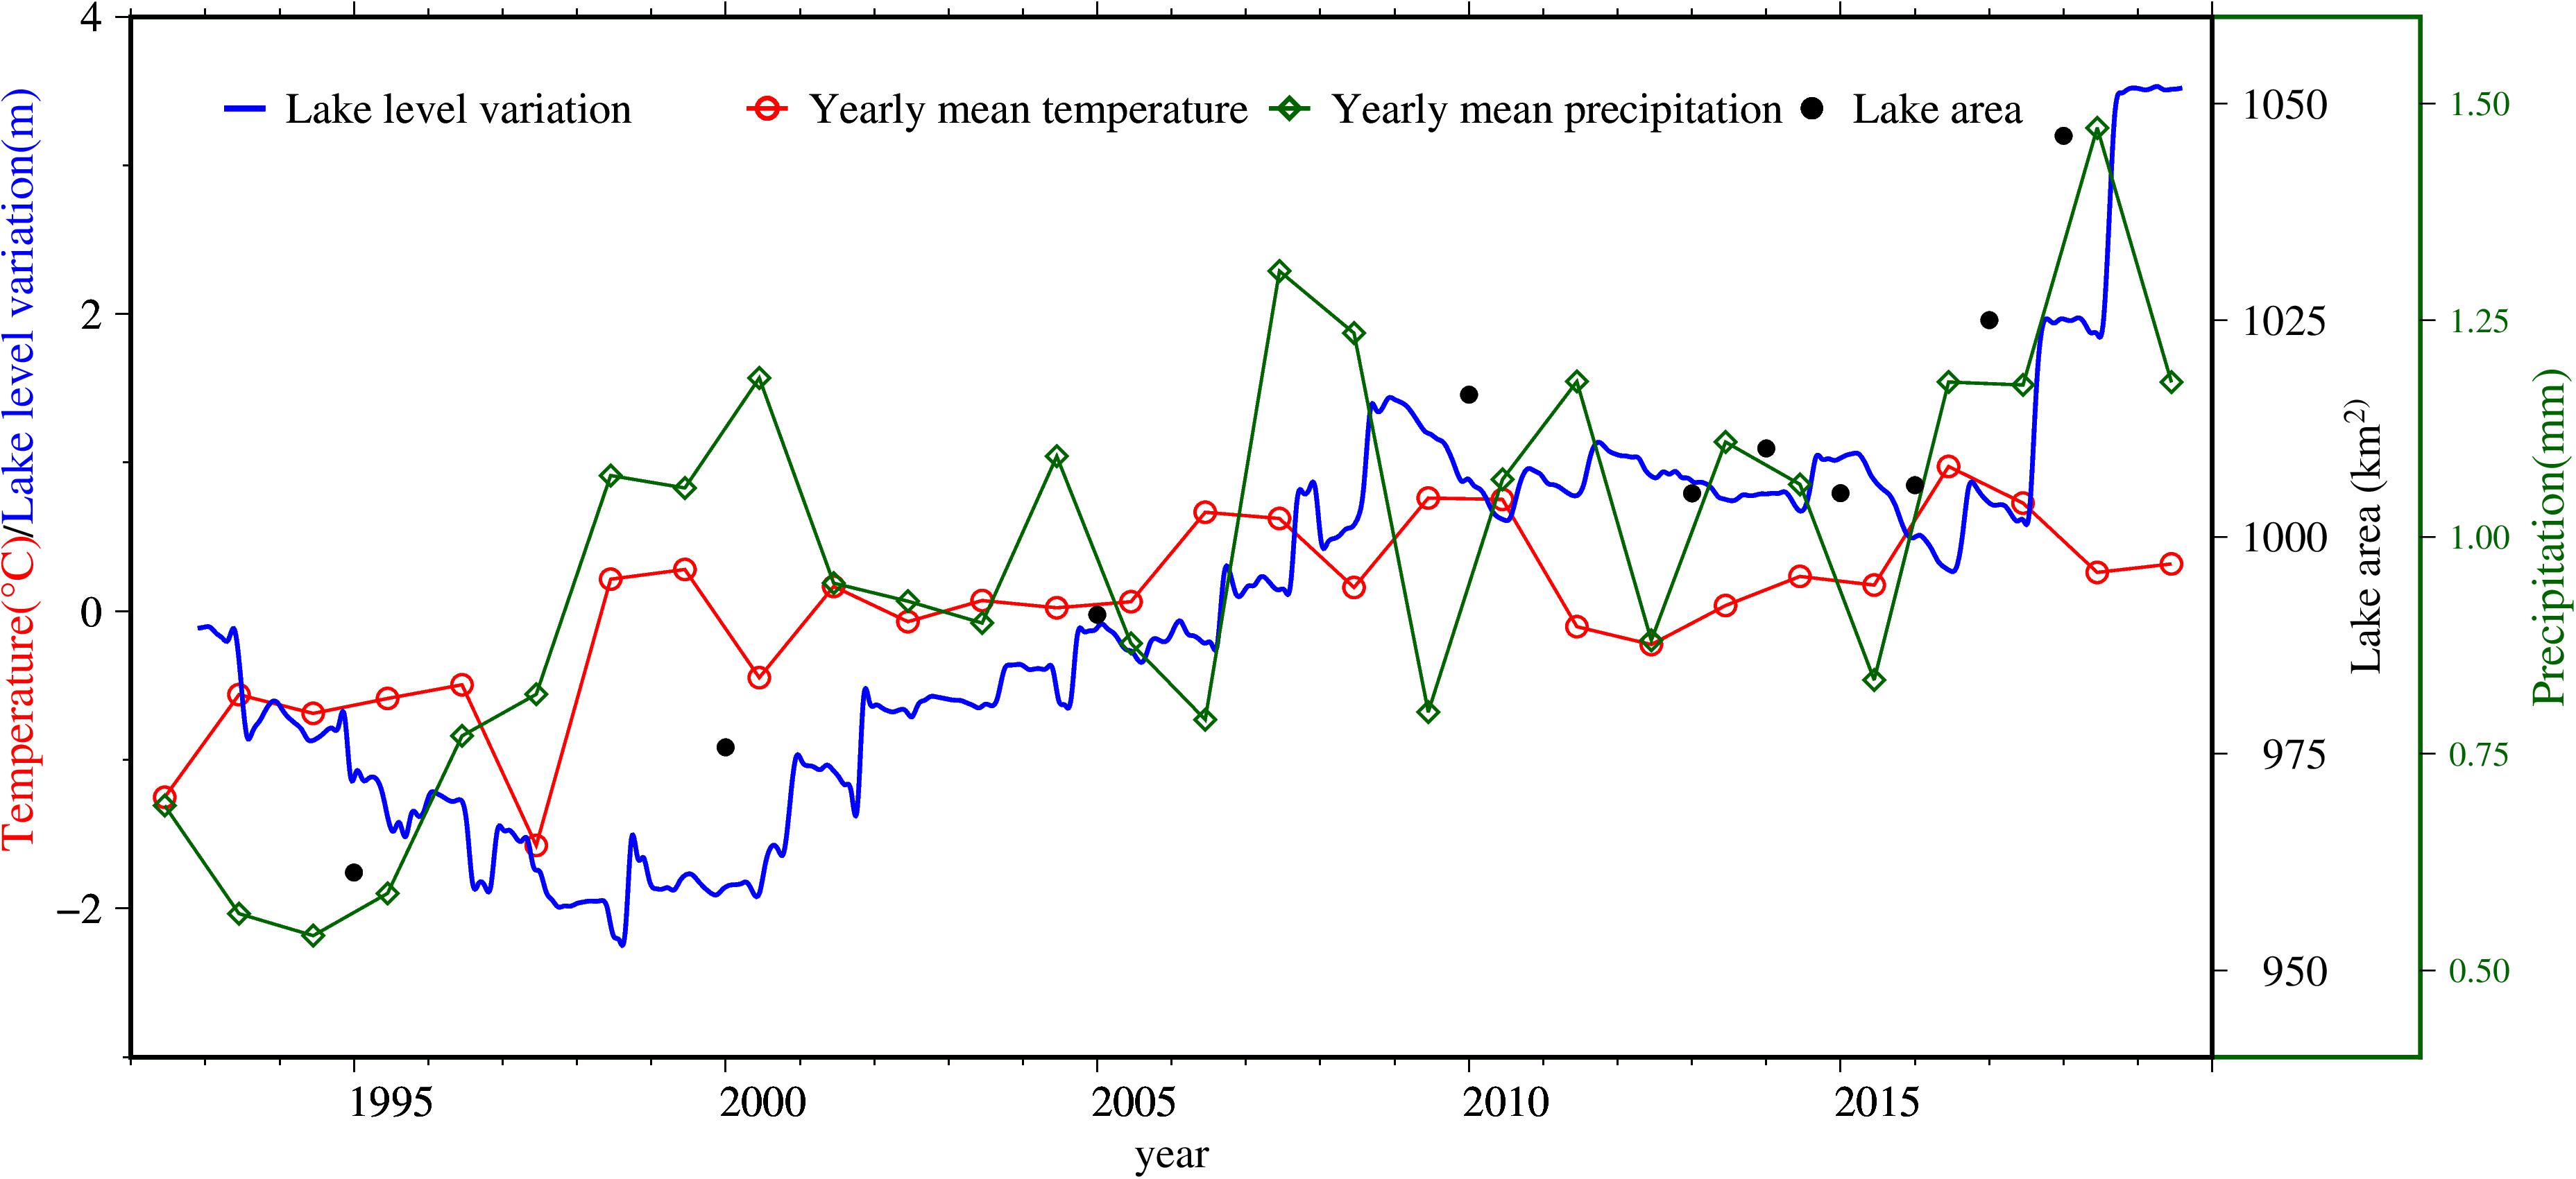
Figure 11. Variation of temperature, precipitation, lake level and area in Zhari Namco.
Temperature and Precipitation Associated With Lake Level Tendency
The annual mean air temperature between 1992 and 2018 obtained from CPC on the Zhari Namco basin is 0.049°C, in accord with the average temperature change in the TP (Zhang et al., 2020). Overall, the accelerated warming in the TP has led to rapid glacier retreat, snowmelt, and permafrost degradation (Bolch et al., 2019), affecting the water resources of TP. However, the relation between temperature and water reserves is complex. Warming and wetting since 1998 have created a more volatile atmosphere, triggering more deep convection and hence more precipitation (Yang et al., 2012).
Precipitation can plausibly explain the long-term trend of lake evolution and spatial patterns. Water balance of the Inner-TP lake is evaluated Inner-TP, and the results show that increased precipitation contributes to the dominant fraction of lake volume increase (∼74%), followed by glacier mass loss (∼13%), and permafrost thawing (∼12%) (Zhang et al., 2020). Figure 11 is the precipitation data of Zhari Namco basin, which shows that the increase of precipitation is the main reason for the rise of lake level after 1998. Nearby weather stations have also recorded increased precipitation in the area since late 1990 (Zhang et al., 2017; Du et al., 2019). The lake level from 2010 to 2015 is quite stable, which is also evident in Qinghai Lake (Zhang et al., 2019a) and other lakes (Figure 1) within TP (Zhang et al., 2020). These lakes are mainly located at the edges of the inner TP. During this period, there is no strong El Niño (Lei et al., 2019) and precipitation is stable. The clear inflection of lake level changes that occurred in 2015/2016 can be attributed to strong El Niño events (Zhang et al., 2020). There is a time lag between lake level change and precipitation (Lei et al., 2019). While precipitation increased in 2016, the lake level did not rise significantly until 2017.
According to the in situ gauge data, Dagze Co, located about 180 km away in the northeast of Zhari Namco, decreases by 2 m from 1976 to 1999 and increased by 8.2 m from 1999 to 2010 (Lei et al., 2014). The results are consistent with the lake level changes retrieved by the altimeter in Zhari Namco. The super El Niño event in 2015/2016 may lead to an abnormal change of lake level in the TP. After the end of the El Niño event, the inland lakes of the TP expanded rapidly. Especially in 2017, the lake rise was rare for many years. It is found that the seasonal fluctuation of lake level is between 0.3 and 0.6 m in normal years in Zhari Namco. However, in summer 2015, the lake level did not rise, but on the contrary, decreased slightly. Even so, the lake water rose 0.6 m in summer 2016 after El Niño and rose sharply to 1.6 m in 2017 (Lei et al., 2019), which is consistent with the trend in lake level retrieved by satellites in this study. Although the seasonal variations of precipitation, temperature, lake level, and lake area are consistent, the quantitative relationship between each factor and the water budget needs further survey.
Conclusion
Zhari Namco is one of the few Tibetan lakes which have been continually monitored by satellite altimeters for more than 25 years. Due to the rugged terrain and changeable environment, it is more difficult for altimeter to monitor its lake level. A robust strategy is used to generate the time series of lake levels using multi-mission data. Before merging multiple altimeters data, the consistency of geophysical corrections should be examined. For dry troposphere correction, there is a variance of about 1 m in TOPEX/Poseidon (T/P) and 2.6 cm in Jason-1. The surface pressure data from ECMWF are used to recalculate DTC. The reflection waveforms of the lake are polluted by land, and the front edge of the waveform deviates from the theoretical tracking point seriously. The threshold 20% algorithm is used for waveform retracking. The method of moving median filter and 2σ criterion is used to remove outliers. This method has good performance without any prior information. Bias adjustment is an essential step in the fusion of multi-source altimeters. Bias is estimated by paired observation samples, such as T/P and Jason-1, Jason-2, and Jason-3.
TOPEX/Poseidon-Jason1/2/3 observations are used to extract lake level time series from 1992 to 2019. During the 27 years, the average rising speed of lake level is 0.14 ± 0.01 m/yr. The mean standard deviation (STD) of observations from TOPEX/Poseidon-Jason1/2/3 (T/P-Jason1/2/3) is 10.1 cm. Compared with previous studies and existing database products, our method yields sequences with the best observational quality and the longest continuous monitoring. Continuous lake level can be provided by the running Jason-3 and the upcoming follow-up task Jason- CS. Precipitation is the main factor affecting the variation of lake level, and the future climate is predicted to be even warmer and moister, hence it is predicted that lake area and level in Zhari Namco will continue to rise in the near term.
Data Availability Statement
The datasets presented in this study can be found in online repositories. The names of the repository/repositories and accession number(s) can be found in the article/supplementary material.
Author Contributions
XL and JG: the study design. MS: data processing and manuscript writing. JG, XL, JY, HW, and CL: data collection and scientific analysis. All authors contributed to the article and approved the submitted version.
Funding
This study was supported by the National Natural Science Foundation of China (Grant Nos. 41774001 and 41374009), Autonomous and Controllable Special Project for Surveying and Mapping of China (Grant No. 816-517), and the SDUST Research Fund (Grant No. 2014TDJH101).
Conflict of Interest
The authors declare that the research was conducted in the absence of any commercial or financial relationships that could be construed as a potential conflict of interest.
Acknowledgments
We would like to acknowledge the Archiving, Validation, and Interpretation of Satellite Oceanographic (AVISO) providing the T/P Geophysical Data Record (GDRs) and the Jason-1/2/3 sensor data record (SGDR) (https://www.aviso.altimetry.fr/), and European Centre for Medium-Range Weather Forecasts (ECMWF) providing for surface pressure and vertical integral of water vapor data (https://apps.ecmwf.int/datasets/data/interim-full-daily/levtype=sfc/), the National Tibetan Plateau Data Center (TPDC) (https://data.tpdc.ac.cn/) providing for China Meteorological Forcing Dataset (CMFD) (1979–2018), SRTM DEM data on the Tibetan Plateau (2012), dataset of river basins map over the TP (2016), high-temporal-resolution water level data sets for lakes (HTRWLD) on the Tibetan Plateau during (2000–2017), and the lake surface area dynamics on the Tibetan Plateau (Version 1.0) (1984–2016). The United States Department of Agriculture’s Foreign Agricultural Service (USDA-FAS) providing for Global Reservoir and Lake Monitor (G-REALM) data (https://ipad. fas.usda.gov/cropexplorer/global_reservoir/gr_regional_chart.asp x?regionid=che&reservoir_name=Cha-jih), Hydroweb data from LEGOS/GOHS are obtained at http://hydroweb.theia-land.fr/hydroweb. The CPC Global Unified Gauge-Based Analysis of Daily Precipitation and CPC Global Daily Temperature data provided by the NOAA/OAR/ESRL PSL, Boulder, CO, United States (https://psl.noaa.gov/data/gridded/), the Center for Space Research of the University of Texas providing for the RL06M.MSCNv02 equivalent water height data (http://www2.csr.utexas.edu/grace/RL06_mascons.html).
Footnotes
- ^ https://www.aviso.altimetry.fr/
- ^ https://www.ecmwf.int/
- ^ http://data.tpdc.ac.cn/
- ^ https://ipad.fas.usda.gov/
- ^ https://psl.noaa.gov/
- ^ http://www2.csr.utexas.edu/grace/
References
Bolch, T., Shea, J. M., Liu, S., Azam, F. M., Gao, Y., Gruber, S., et al. (2019). Status and Change of the Cryospherein the Extended Hindu Kush HimalayaRegion. The Salmon Tower Building, NY: Springer International Publishing.
Chen, M., Shi, W., Xie, P., Silva, V. B. S., Kousky, V. E., Wayne, H. R., et al. (2008). Assessing objective techniques for gauge-based analyses of global daily precipitation. J. Geophys. Res. 113:D04001. doi: 10.1029/2007jd009132
CIAT (2015). SRTM DEM data on the Tibetan Plateau (2012). Cali: CIAT. doi: 10.11888/Geogra.tpdc.270486
Crétaux, J. F., Arsen, A., Calmant, S., Kouraev, A., Vuglinski, V., Bergé-Nguyen, M., et al. (2011). SOLS: a lake database to monitor in the Near Real Time water level and storage variations from remote sensing data. Adv. Space Res. 47, 1497–1507. doi: 10.1016/j.asr.2011.01.004
Crétaux, J.-F., Calmant, S., Romanovski, V., Shabunin, A., Lyard, F., Bergé-Nguyen, M., et al. (2008). An absolute calibration site for radar altimeters in the continental domain: Lake Issykkul in Central Asia. J. Geod. 83, 723–735. doi: 10.1007/s00190-008-0289-7
Du, W., Liu, X., Guo, J., Shen, Y., Li, W., and Chang, X. (2019). Analysis of the melting glaciers in Southeast Tibet by ALOS-PALSAR data. Terrestr. Atmosph. Ocean. Sci. 30, 7–19. doi: 10.3319/tao.2018.07.09.03
Fu, L.-L., and Cazenave, A. (2001). Satellite Altimetry and Earth Sciences: A Handbook of Techniques and Applications. Magarpatta: A Harcourk Science and Technology Company.
Gao, L., Hao, L., and Chen, X. (2014). Evaluation of ERA-interim monthly temperature data over the Tibetan Plateau. J. Mount. Sci. 11, 1154–1168. doi: 10.1007/s11629-014-3013-5
Gao, L., Liao, J., and Shen, G. (2013). Monitoring lake-level changes in the Qinghai-Tibetan Plateau using radar altimeter data (2002-2012). J. Appl. Remote Sens. 7:073470. doi: 10.1117/1.Jrs.7.073470
Guo, J., Mu, D., Liu, X., Yan, H., Sun, Z., and Guo, B. (2016). Water storage changes over the tibetan plateau revealed by GRACE mission. Acta Geophys. 64, 463–476. doi: 10.1515/acgeo-2016-0003
Guo, J., Sun, J., Chang, X., Guo, S., and Liu, X. (2011). Correlation analysis of NINO3.4 SST and inland lake level variations monitored with satellite altimetry: case studies of lakes hongze, Khanka, La-ang, Ulungur, Issyk-kul and Baikal. Terrestr. Atmosph. Ocean. Sci. 22, 203–213. doi: 10.3319/TAO.2010.09.17.01(TibXS)
Guo, J., Sun, J., Chang, X., and Liu, X. (2010). Water level variation of bosten lake monitored with TOPEX/poseidon and Its correlation with NINO3 SST. Acta Geodaet. Cartogr. Sin. 39, 221–226. doi: 10.1051/jphyscol:1989560
Guo, J., Yang, L., Liu, X., Hwang, C., and Yang, H. (2012). On temporal-spatial distribution of backscatter coefficients over China determined by TOPEX/Poseidon mission. Sci. China Earth Sci. 55, 2068–2083. doi: 10.1007/s11430-012-4524-y
He, J., Yang, K., Tang, W., Lu, H., Qin, J., Chen, Y., et al. (2020). The first high-resolution meteorological forcing dataset for land process studies over China. Sci. Data 7, 25–35. doi: 10.1038/s41597-020-0369-y
Ho, C. M., Wilson, B. D., Mannucci, A. J., Lindqwister, U. J., and Yuan, D. N. (1997). A comparative study of ionospheric total electron content measurements using global ionospheric maps of GPS, TOPEX radar and the bent model. Radio Sci. 32, 1499–1512. doi: 10.1029/97rs00580
Hwang, C., Cheng, Y.-S., Han, J., Kao, R., Huang, C.-Y., Wei, S.-H., et al. (2016). Multi-decadal monitoring of lake level changes in the Qinghai-tibet plateau by the TOPEX/poseidon-family altimeters: climate implication. Rem. Sens. 8, 446–467. doi: 10.3390/rs8060446
Hwang, C., Peng, M.-F., Ning, J., Luo, J., and Sui, C.-H. (2005). Lake level variations in China from TOPEX/Poseidon altimetry: data quality assessment and links to precipitation and ENSO. Geophys. J. Int. 161, 1–11. doi: 10.1111/j.1365-246X.2005.02518.x
Jiang, L., Nielsen, K., Andersen, O., and Bauer-Gottwein, P. (2017). Monitoring recent lake level variations on the Tibetan Plateau using CryoSat-2 SARIn mode data. J. Hydrol. 544, 109–124. doi: 10.1016/j.jhydrol.2016.11.024
Kleinherenbrink, M., Lindenbergh, R., and Ditmar, P. (2015). Monitoring of lake level changes on the Tibetan Plateau and Tian Shan by retracking Cryosat SARIn waveforms. J. Hydrol. 521, 119–131. doi: 10.1016/j.jhydrol.2014.11.063
Kun, Y., and He, J. (2019). China Meteorological Forcing Dataset (1979-2018). Beijing: National Tibetan Plateau Data Center. doi: 10.11888/AtmosphericPhysics.tpe.249369.file
Lee, H., Shum, C., Tseng, K., Guo, J., and Kuo, C. (2011). Present-day lake level variation from envisat altimetry over the northeastern qinghai-tibetan plateau: links with precipitation and temperature. Terrestr. Atmospher. Ocean. Sci. 22, 169–175. doi: 10.3319/TAO.2010.08.09.01(TibXS)
Lei, Y., Yang, K., Wang, B., Sheng, Y., Bird, B. W., Zhang, G., et al. (2014). Response of inland lake dynamics over the Tibetan Plateau to climate change. Clim. Change 125, 281–290. doi: 10.1007/s10584-014-1175-3
Lei, Y., Yao, T., and Yang, K. (2018). The Water Level Observation of Lakes on the Tibetan Plateau (2010-2017). Beijing: National Tibetan Plateau Data Center. doi: 10.11888/Hydrology.tpe.249464.db
Lei, Y., Yao, T., Yang, K., Sheng, Y., Kleinherenbrink, M., Yi, S., et al. (2017). Lake seasonality across the Tibetan Plateau and their varying relationship with regional mass changes and local hydrology. Geophys. Res. Lett. 44, 892–900. doi: 10.1002/2016gl072062
Lei, Y., Zhu, Y., Wang, B., Yao, T., Yang, K., Zhang, X., et al. (2019). Extreme lake level changes on the tibetan plateau associated with the 2015/2016 El Niño. Geophys. Res. Lett. 46, 5889–5898. doi: 10.1029/2019gl081946
Li, X., Long, D., Huang, Q., Han, P., Zhao, F., and Wada, Y. (2019a). High-temporal-resolution water level and storage change data sets for lakes on the Tibetan Plateau during 2000-2017 using multiple altimetric missions and Landsat-derived lake shoreline positions. Earth Syst. Sci. Data 11, 1603–1627. doi: 10.5194/essd-11-1603-2019
Li, X., Long, D., Huang, Q., Han, P., Zhao, F., and Wada, Y. (2019b). High-Temporal-Resolution Water Level and Storage Change Data Sets For Lakes on the Tibetan Plateau During 2000-2017. London: PANGAEA. doi: 10.1594/PANGAEA.898411
Li, Z., Liu, X., Guo, J., Yuan, J., Niu, Y., and Ji, B. (2020). A new method of satellite radar altimeter waveform retracking based on waveform derivative. Rev. Int. Métodos Numér. Para Cálculo Dis. Ingen. 36, 1–4. doi: 10.23967/j.rimni.2020.10.002
Ma, R., Yang, G., Duan, H., Jiang, J., Wang, S., Feng, X., et al. (2010). China’s lakes at present: number, area and spatial distribution. Sci. China Earth Sci. 54, 283–289. doi: 10.1007/s11430-010-4052-6
Okeowo, M., Lee, H., Hossain, F., and Getirana, A. (2017). Automated generation of lakes and reservoirs water elevation changes from satellite radar altimetry. Ieee J. Select. Topics Appl. Earth Observat. Remote Sens. 10, 3465–3481. doi: 10.1109/jstars.2017.2684081
Pavlis, N. K., Holmes, S. A., Kenyon, S. C., and Factor, J. K. (2012). The development and evaluation of the Earth gravitational model 2008 (EGM2008). J. Geophys. Res. Solid Earth 117:B04406. doi: 10.1029/2011jb008916
Phan, V., Lindenbergh, R., and Menenti, M. (2012). ICESat derived elevation changes of Tibetan lakes between 2003 and 2009. Int. J. Appl. Earth Observat. Geoinform. 17, 12–22. doi: 10.1016/j.jag.2011.09.015
Schwatke, C., Dettmering, D., Bosch, W., and Seitz, F. (2015). DAHITI – an innovative approach for estimating water level time series over inland waters using multi-mission satellite altimetry. Hydrol. Earth Syst. Sci. 19, 4345–4364. doi: 10.5194/hess-19-4345-2015
Song, C., Huang, B., Ke, L., and Richards, K. (2014). Seasonal and abrupt changes in the water level of closed lakes on the Tibetan Plateau and implications for climate impacts. J. Hydrol. 514, 131–144. doi: 10.1016/j.jhydrol.2014.04.018
Vu, P., Frappart, F., Darrozes, J., Marieu, V., Blarel, F., Ramillien, G., et al. (2018). Multi-Satellite altimeter validation along the french atlantic coast in the southern bay of biscay from ERS-2 to SARAL. Remote Sens. 10, 93–125. doi: 10.3390/rs10010093
Wang, H., Chu, Y., Huang, Z., Hwang, C., and Chao, N. (2019). Robust, long-term lake level change from multiple satellite altimeters in tibet: observing the rapid rise of ngangzi co over a New Wetland. Remote Sens. 11:558. doi: 10.3390/rs11050558
Wang, J., Peng, P., Ma, Q., and Zhu, L. (2010). Modem limnological features of Tangra Yumco and Zhari Namco, Tibetan Plateau. J. Lake Sci. 22, 629–632. doi: 10.18307/2010.0422
Watkins, M. M., Wiese, D. N., Yuan, D.-N., Boening, C., and Landerer, F. W. (2015). Improved methods for observing Earth’s time variable mass distribution with GRACE using spherical cap mascons. J. Geophys. Res. Solid Earth 120, 2648–2671. doi: 10.1002/2014jb011547
Yang, K., Ding, B., Qin, J., Tang, W., Lu, N., and Lin, C. (2012). Can aerosol loading explain the solar dimming over the Tibetan Plateau? Geophys. Res. Lett. 39:L20710. doi: 10.1029/2012gl053733
Yang, K., He, J., Tang, W., Qin, J., and Cheng, C. C. K. (2010). On downward shortwave and longwave radiations over high altitude regions: observation and modeling in the Tibetan Plateau. Agricult. Forest Meteorol. 150, 38–46. doi: 10.1016/j.agrformet.2009.08.004
Zhang, G. (2016). Dataset of River Basins Map Over the TP(2016). Beijing: National Tibetan Plateau Data Center. doi: 10.11888/BaseGeography.tpe.249465.file
Zhang, G. (2019). The Lakes Larger Than 1km2 in Tibetan Plateau (V2.0) (1970s-2018). Beijing: National Tibetan Plateau Data Center. doi: 10.11888/Hydro.tpdc.270303
Zhang, G., Chen, W., and Xie, H. (2019a). Tibetan Plateau’s Lake level and volume changes from NASA’s ICESat/ICESat−2 and landsat missions. Geophys. Res. Lett. 46, 13107–13118. doi: 10.1029/2019gl085032
Zhang, G., Luo, W., Chen, W., and Zheng, G. (2019b). A robust but variable lake expansion on the Tibetan Plateau. Sci. Bull. 64, 1306–1309. doi: 10.1016/j.scib.2019.07.018
Zhang, G., Xie, H., Kang, S., Yi, D., and Ackley, S. F. (2011). Monitoring lake level changes on the Tibetan Plateau using ICESat altimetry data (2003–2009). Remote Sens. Environ. 115, 1733–1742. doi: 10.1016/j.rse.2011.03.005
Zhang, G., Yao, T., Piao, S., Bolch, T., Xie, H., Chen, D., et al. (2017). Extensive and drastically different alpine lake changes on Asia’s high plateaus during the past four decades. Geophys. Res. Lett. 44, 252–260. doi: 10.1002/2016gl072033
Zhang, G., Yao, T., Xie, H., Kang, S., and Lei, Y. (2013). Increased mass over the Tibetan Plateau: from lakes or glaciers? Geophys. Res. Lett. 40, 2125–2130. doi: 10.1002/grl.50462
Zhang, G., Yao, T., Xie, H., Yang, K., Zhu, L., Shum, C. K., et al. (2020). Response of tibetan plateau lakes to climate change: trends, patterns, and mechanisms. Earth Sci. Rev. 208, 103269–103291. doi: 10.1016/j.earscirev.2020.103269
Zhang, G., Yao, T., Xie, H., Zhang, K., and Zhu, F. (2014). Lakes’ state and abundance across the Tibetan Plateau. Chin. Sci. Bull. 59, 3010–3021. doi: 10.1007/s11434-014-0258-x
Keywords: satellite altimetry, TOPEX/Poseidon, Jason1/2/3, Zhari Namco, lake level
Citation: Sun M, Guo J, Yuan J, Liu X, Wang H and Li C (2021) Detecting Lake Level Change From 1992 to 2019 of Zhari Namco in Tibet Using Altimetry Data of TOPEX/Poseidon and Jason-1/2/3 Missions. Front. Earth Sci. 9:640553. doi: 10.3389/feart.2021.640553
Received: 11 December 2020; Accepted: 10 March 2021;
Published: 29 March 2021.
Edited by:
Peng Liu, Institute of Remote Sensing and Digital Earth (CAS), ChinaReviewed by:
Guoqing Zhang, Institute of Tibetan Plateau Research (CAS), ChinaXiangjun Liu, Northwest Normal University, China
Copyright © 2021 Sun, Guo, Yuan, Liu, Wang and Li. This is an open-access article distributed under the terms of the Creative Commons Attribution License (CC BY). The use, distribution or reproduction in other forums is permitted, provided the original author(s) and the copyright owner(s) are credited and that the original publication in this journal is cited, in accordance with accepted academic practice. No use, distribution or reproduction is permitted which does not comply with these terms.
*Correspondence: Jinyun Guo, Z3VvanlAc2R1c3QuZWR1LmNu; amlueXVuZ3VvMUAxMjYuY29t; Chengming Li, Y21saUBjYXNtLmFjLmNu