 V. Tritakis
 I. Contopoulos1
 V. Christofilakis
- 1Research Center for Astronomy and Applied Mathematics Academy of Athens, Athens, Greece
- 2Mariolopoulos-Kanaginis Foundation for Environmental Research, Athens, Greece
- 3Electronics-Telecommunications and Applications Lab, University of Ioannina, Ioannina, Greece
A set of various short artificial disturbances from rifle firings, car engine operation, car radio, shakings of the apparatus, etc., were generated deliberately near our ELF recording stations in order to identify their footprint on the recordings of atmospheric electromagnetic radiation in the Schumann resonance (SR) band (from about 2–50 Hz). Such disturbances simulate anthropogenic noises from hunters, hikers, campers, etc., which may occur in a remote-isolated ELF recording station. We expect that our work will assist fellow scientists to differentiate between artificial signals created from anthropogenic activity and real signals attributable to geophysical phenomena.
Introduction
Schumann resonances (SRs) have gained great interest in the last 20 years. The reason is the recent identification of several correlations between SR activity and geophysical, even biological phenomena. For readers who are not familiar with SR, we briefly mention that these are extremely low frequency (ELF) atmospheric electromagnetic waves in the frequency band of 2–50 Hz. They are characterized by a set of spectral modes centered around 7.8, 14, 21, 28, and 35 Hz. SRs are quasi-stationary electromagnetic waves created in the spherical cavity between the earth’s surface and the lower layers of the ionosphere. This spherical cavity is a natural waveguide that acts as an electromagnetic resonance cavity in the ELF band. The primary sources of SR are lightning discharges which emit electromagnetic radiation in a very wide range of frequencies. These signals are, in turn, amplified by the natural waveguide between the surface of the earth and the lower layers of the ionosphere, creating the resonances that were studied theoretically for the first time by the German physicist W. Schumann (1952) and confirmed experimentally by Balser and Wagner (1960, 1962).
Since the beginning of the 21st century, the important publications of Williams (1992, 2005) triggered a great shift in the interest of the scientific community toward the practical applications of SR. Williams reported how SR variations could be a sensitive measure of temperature fluctuations in the tropical atmosphere related to the lightning flash rate.
A strong correlation between SR intensity and the global surface temperature at latitude intervals that exceed ± 45° was also found by Sekiguchi et al. (2006). Concerning the local conditions in the greater geographic area of Greece, the work of Nastos et al. (2014) stands out.
They studied the spatiotemporal analysis of lightning activity over Greece for 1 year using data from the Greek meteorological service. Furthermore, Proestakis et al. (2016) studied the association between lightning activity and aerosols in the Mediterranean region. Tatsis et al. (2016, 2020a) also studied SR correlations with local and global lightning centers.
Several other articles relating SR with earthquakes, biology, and other applied sciences have also appeared. An increase in SR intensity was observed before the 2004 Mid-Niigata Prefecture earthquake and the 2007 Noto Hantou earthquake which was followed by a decrease after the occurrence of the earthquakes, implying a connection between SR and earthquake activity (Ohta et al., 2009). Extreme electromagnetic events (EEEs) that may be described as an increase of intensity in the frequency range around 20–25 Hz, as well as a shift of its peak frequency, have been detected before and after several medium-magnitude earthquakes in Northern Greece (Christofilakis et al., 2019; Florios et al., 2019, 2020). Similar results were observed during the 1999 Taiwan earthquake (Hayakawa et al., 2005, 2008; Xinyang et al., 2013).
Informative wide range reviews about this new branch of Seismo-electromagnetism have been published by Hayakawa and Molchanov (2007); Petraki et al. (2015), and Pulinets and Ouzounov (2016).
The main point of this article is to describe common incidental “noises” that may be introduced by anthropogenic activities in order to identify and exclude them from the raw recordings. For this reason, we performed tests during two different dates, in two different places, under different environmental conditions. We hope that our work will contribute to the diagnosis and rejection of incident ELF signals, thus assisting fellow scientists with the collection of reliable, good-quality SR data.
Observation Sites and Hardware
There are two SR recording sites in Greece. The first one is located in the North close to the Greek-Albanian border (39∘ 54′ 49,8′′N/20∘ 35′ 26,1′′ E) [hereafter North Observational Site (NOS)] and the second one in the South on top of Mount Parnon (37∘ 13′18,33′′ N/22∘ 36′ 42,12′′E) [hereafter South Observational Site (SOS)] in the district of Laconia (Figure 1). The technical characteristics and details of the hardware operating at the two sites have been described in detail in previous publications (Tatsis et al., 2015, 2020b; Votis et al., 2018).
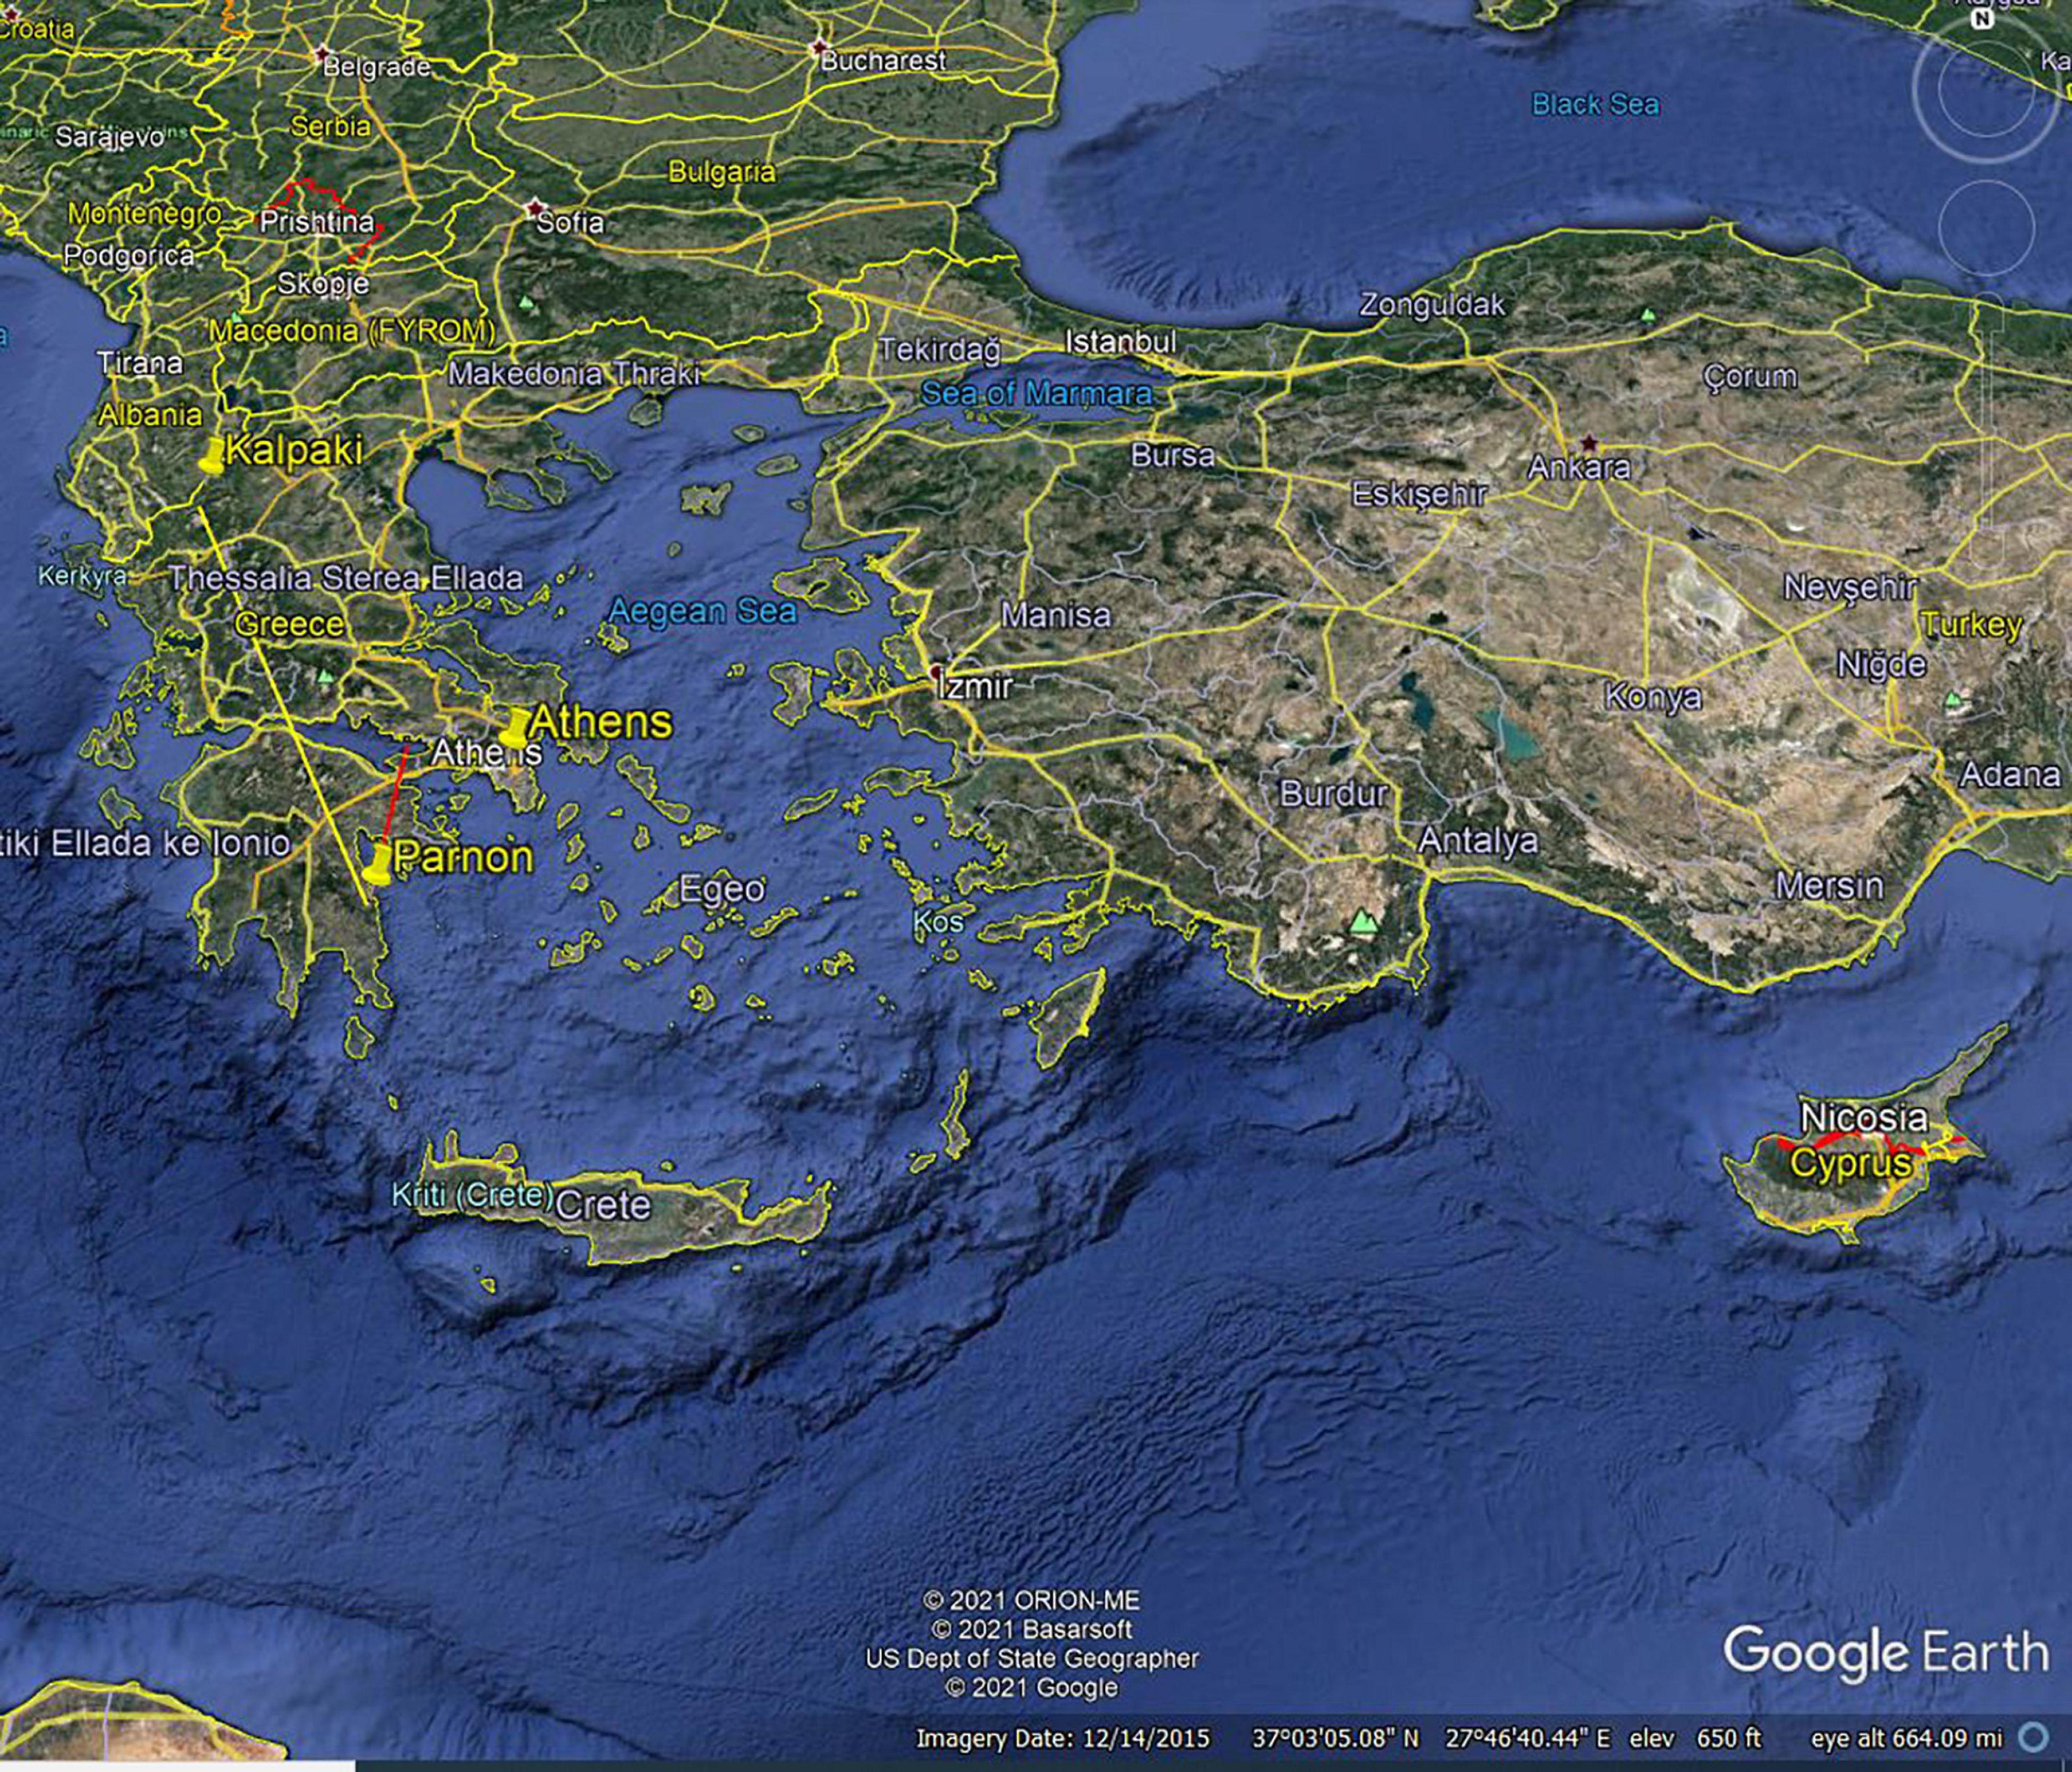
Figure 1. North and South Observational Sites in Greece connected with a yellow line. An extra site is also shown in Mount Penteli close to Athens where a set of tests were performed.
The NOS operates since 2016 in a small country-chapel and contains two coils orientated along the N-S and E-W directions, respectively. The SOS operates from the beginning of 2020 near the top of Mount Parnon in a shelter of the Greek Forest Services and contains, for the time being, only one N-S coil. The generation and recording of incidental “noises” were performed with one N-S coil in two places in two different time periods. The first test took place in an inhabited area outside Athens (Mount Penteli, near Drafi), and the second one in the SOS (Figure 2).
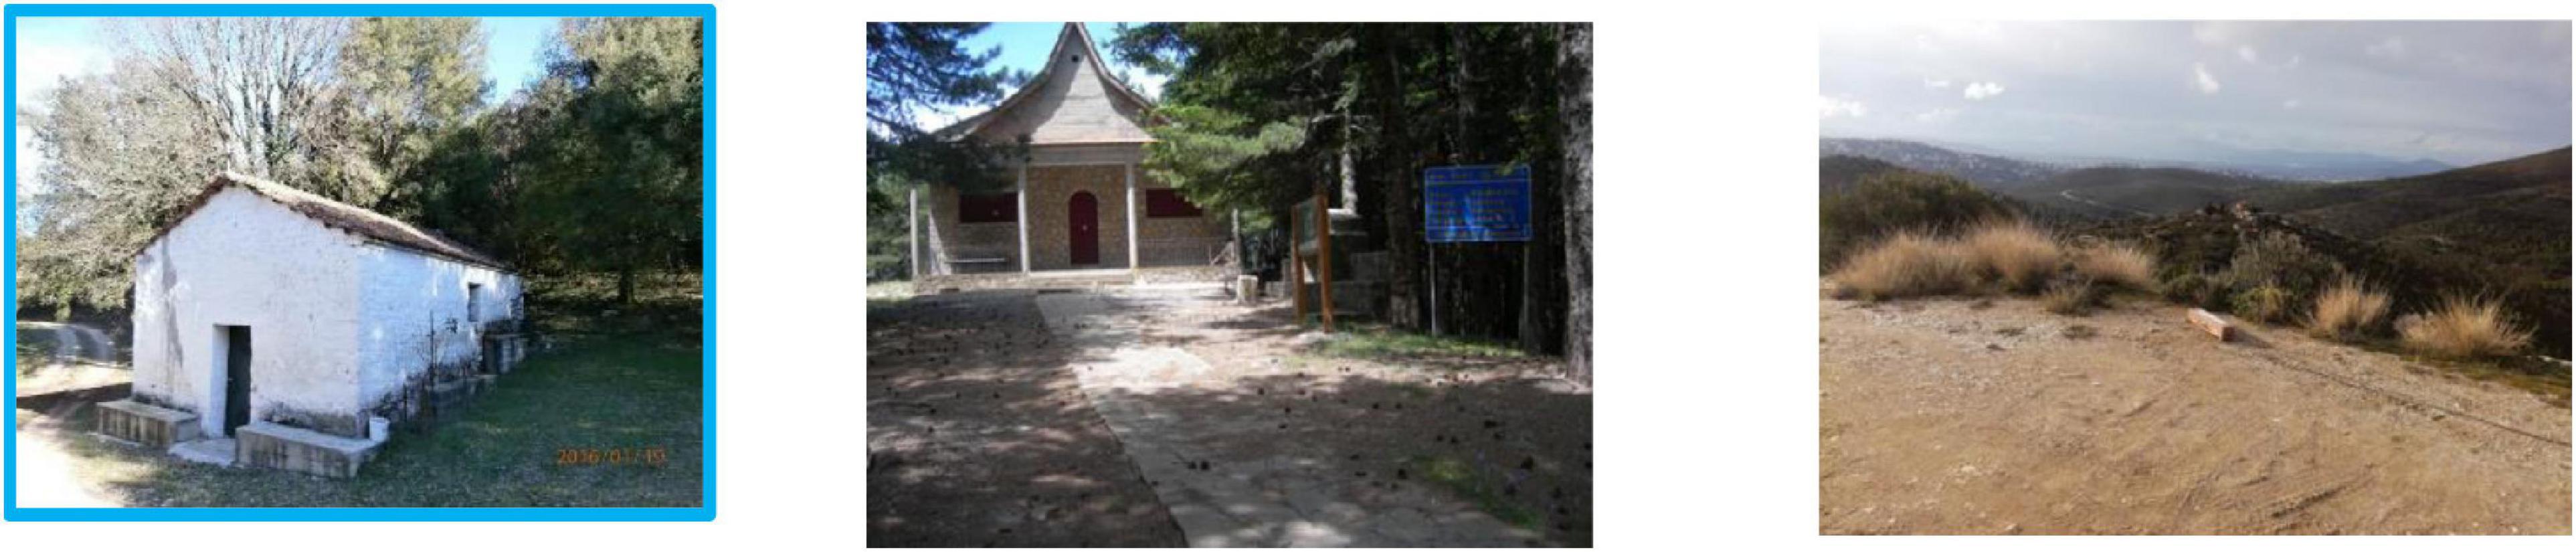
Figure 2. Photos of the North (left) and South (middle) SR installations. Also shown is the testing site on Mount Penteli near suburb of Athens Drafi (right).
The components that were used during the tests were a single 60-cm long coil with 80,000 turns of 0.24 mm copper wire and a logger for digitizing recordings and storing them in 10-min files on a simple SD card. In Figure 3, two 10-min files of measurements received under two quite different conditions are depicted. In the left panel, the observation was recorded in the SOS under ideal conditions in a pristine environment without electromagnetic interference (the closest electromagnetic source of disturbance is located 5 km away). The main four SR modes stand out very clearly, thus denoting a high-quality recording. The second observation (right panel) was recorded in a densely inhabited urban area where a very strong signal extending to the limits of the amplifier was received. The two measurements may be considered as reference observations denoting the quality extremes (best and worst) of SR measurements.
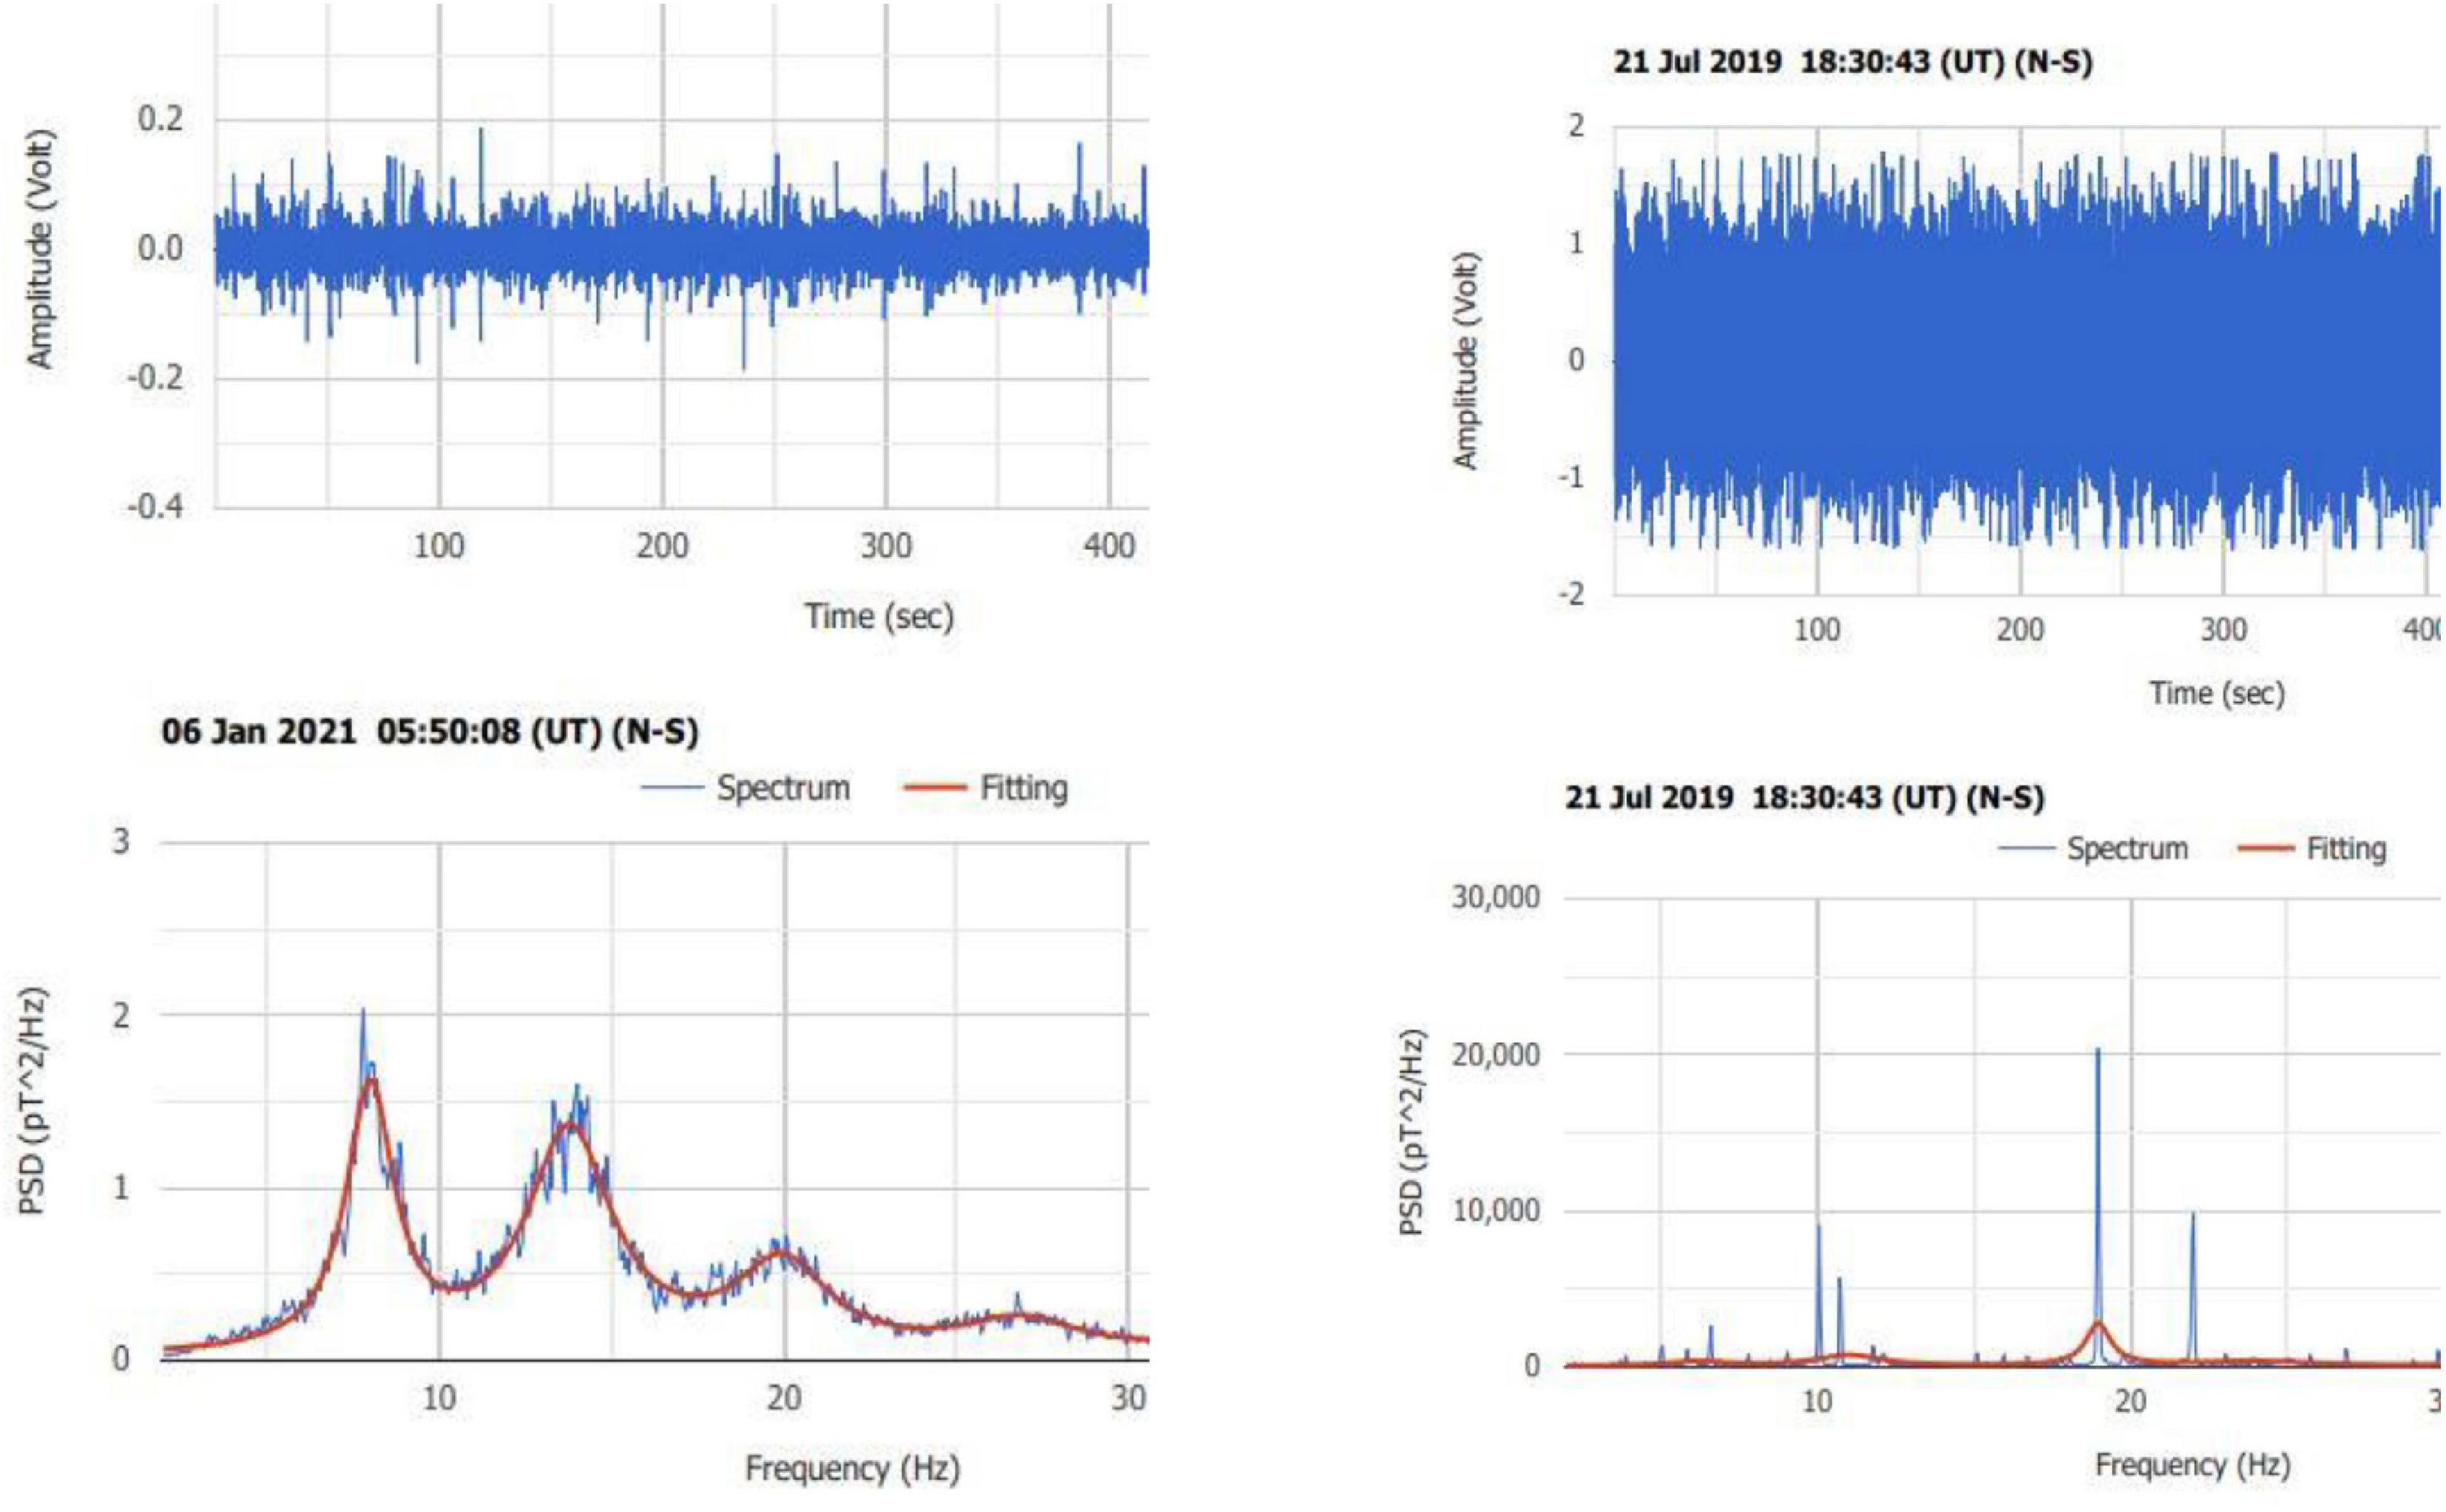
Figure 3. Measurements recorded under quite different conditions. A “clean” typical SR spectrum received under ideal conditions (left), and a spectrum received under improper conditions with strong electromagnetic interference in the ELF band (right).
Generation and Recording of Common Anthropogenic Noises
First Test in Drafi
The first systematic recording of various anthropogenic “noises” was performed on the 13th of March 2019 in an inhabited area of Mount Penteli near the suburb of Drafi outside Athens. The closest electric power line was 1 km away from the recording site. Descriptive samples of these recordings are shown below.
In Figure 4, we present two successive 10-min recordings of the effect of turning on and off a car engine shown in the right panel. The engine was running at high RPMs for several seconds. The left panel corresponds to a “peaceful” recording in which, however, the SR modes do not appear. The main feature of the right panel is a wide strip of a very intense signal that yields a spectrum concentrated in a sharp peak around the first SR mode (lower panel).
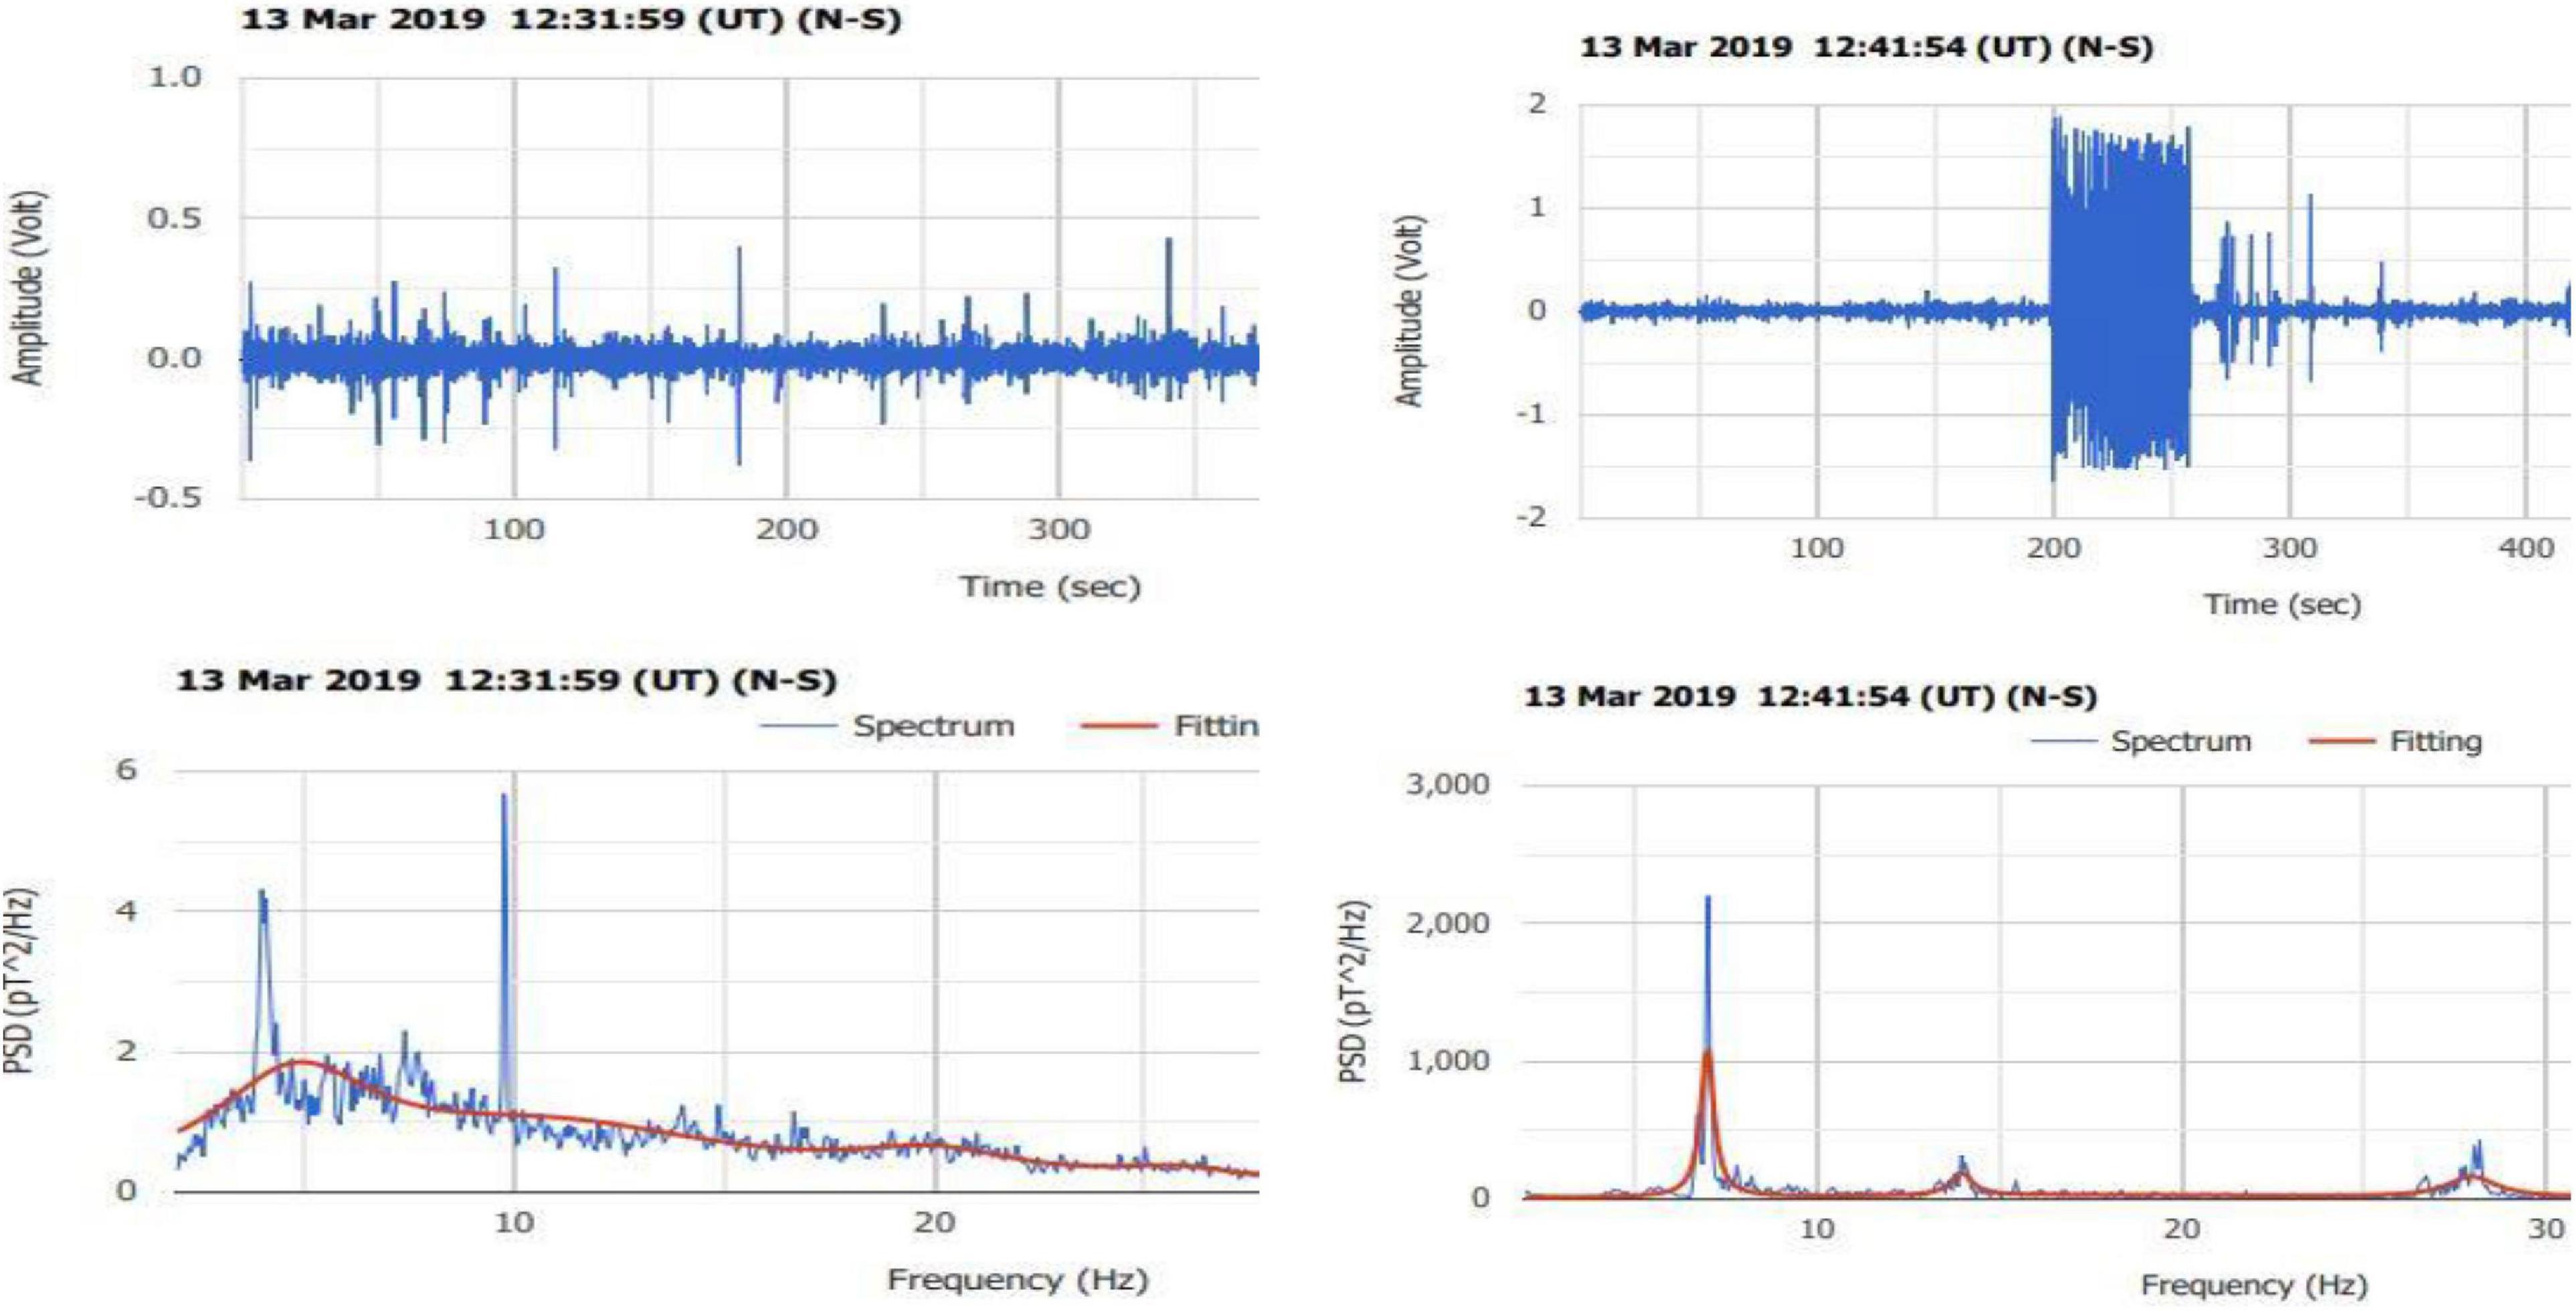
Figure 4. Car engine footprint on the raw data (right panel), and recording with the engine not running (left panel).
In Figure 5, we present the effect of the operation of a car radio on the SR recording. A spike in the left panel indicates the turning on/off the radio.
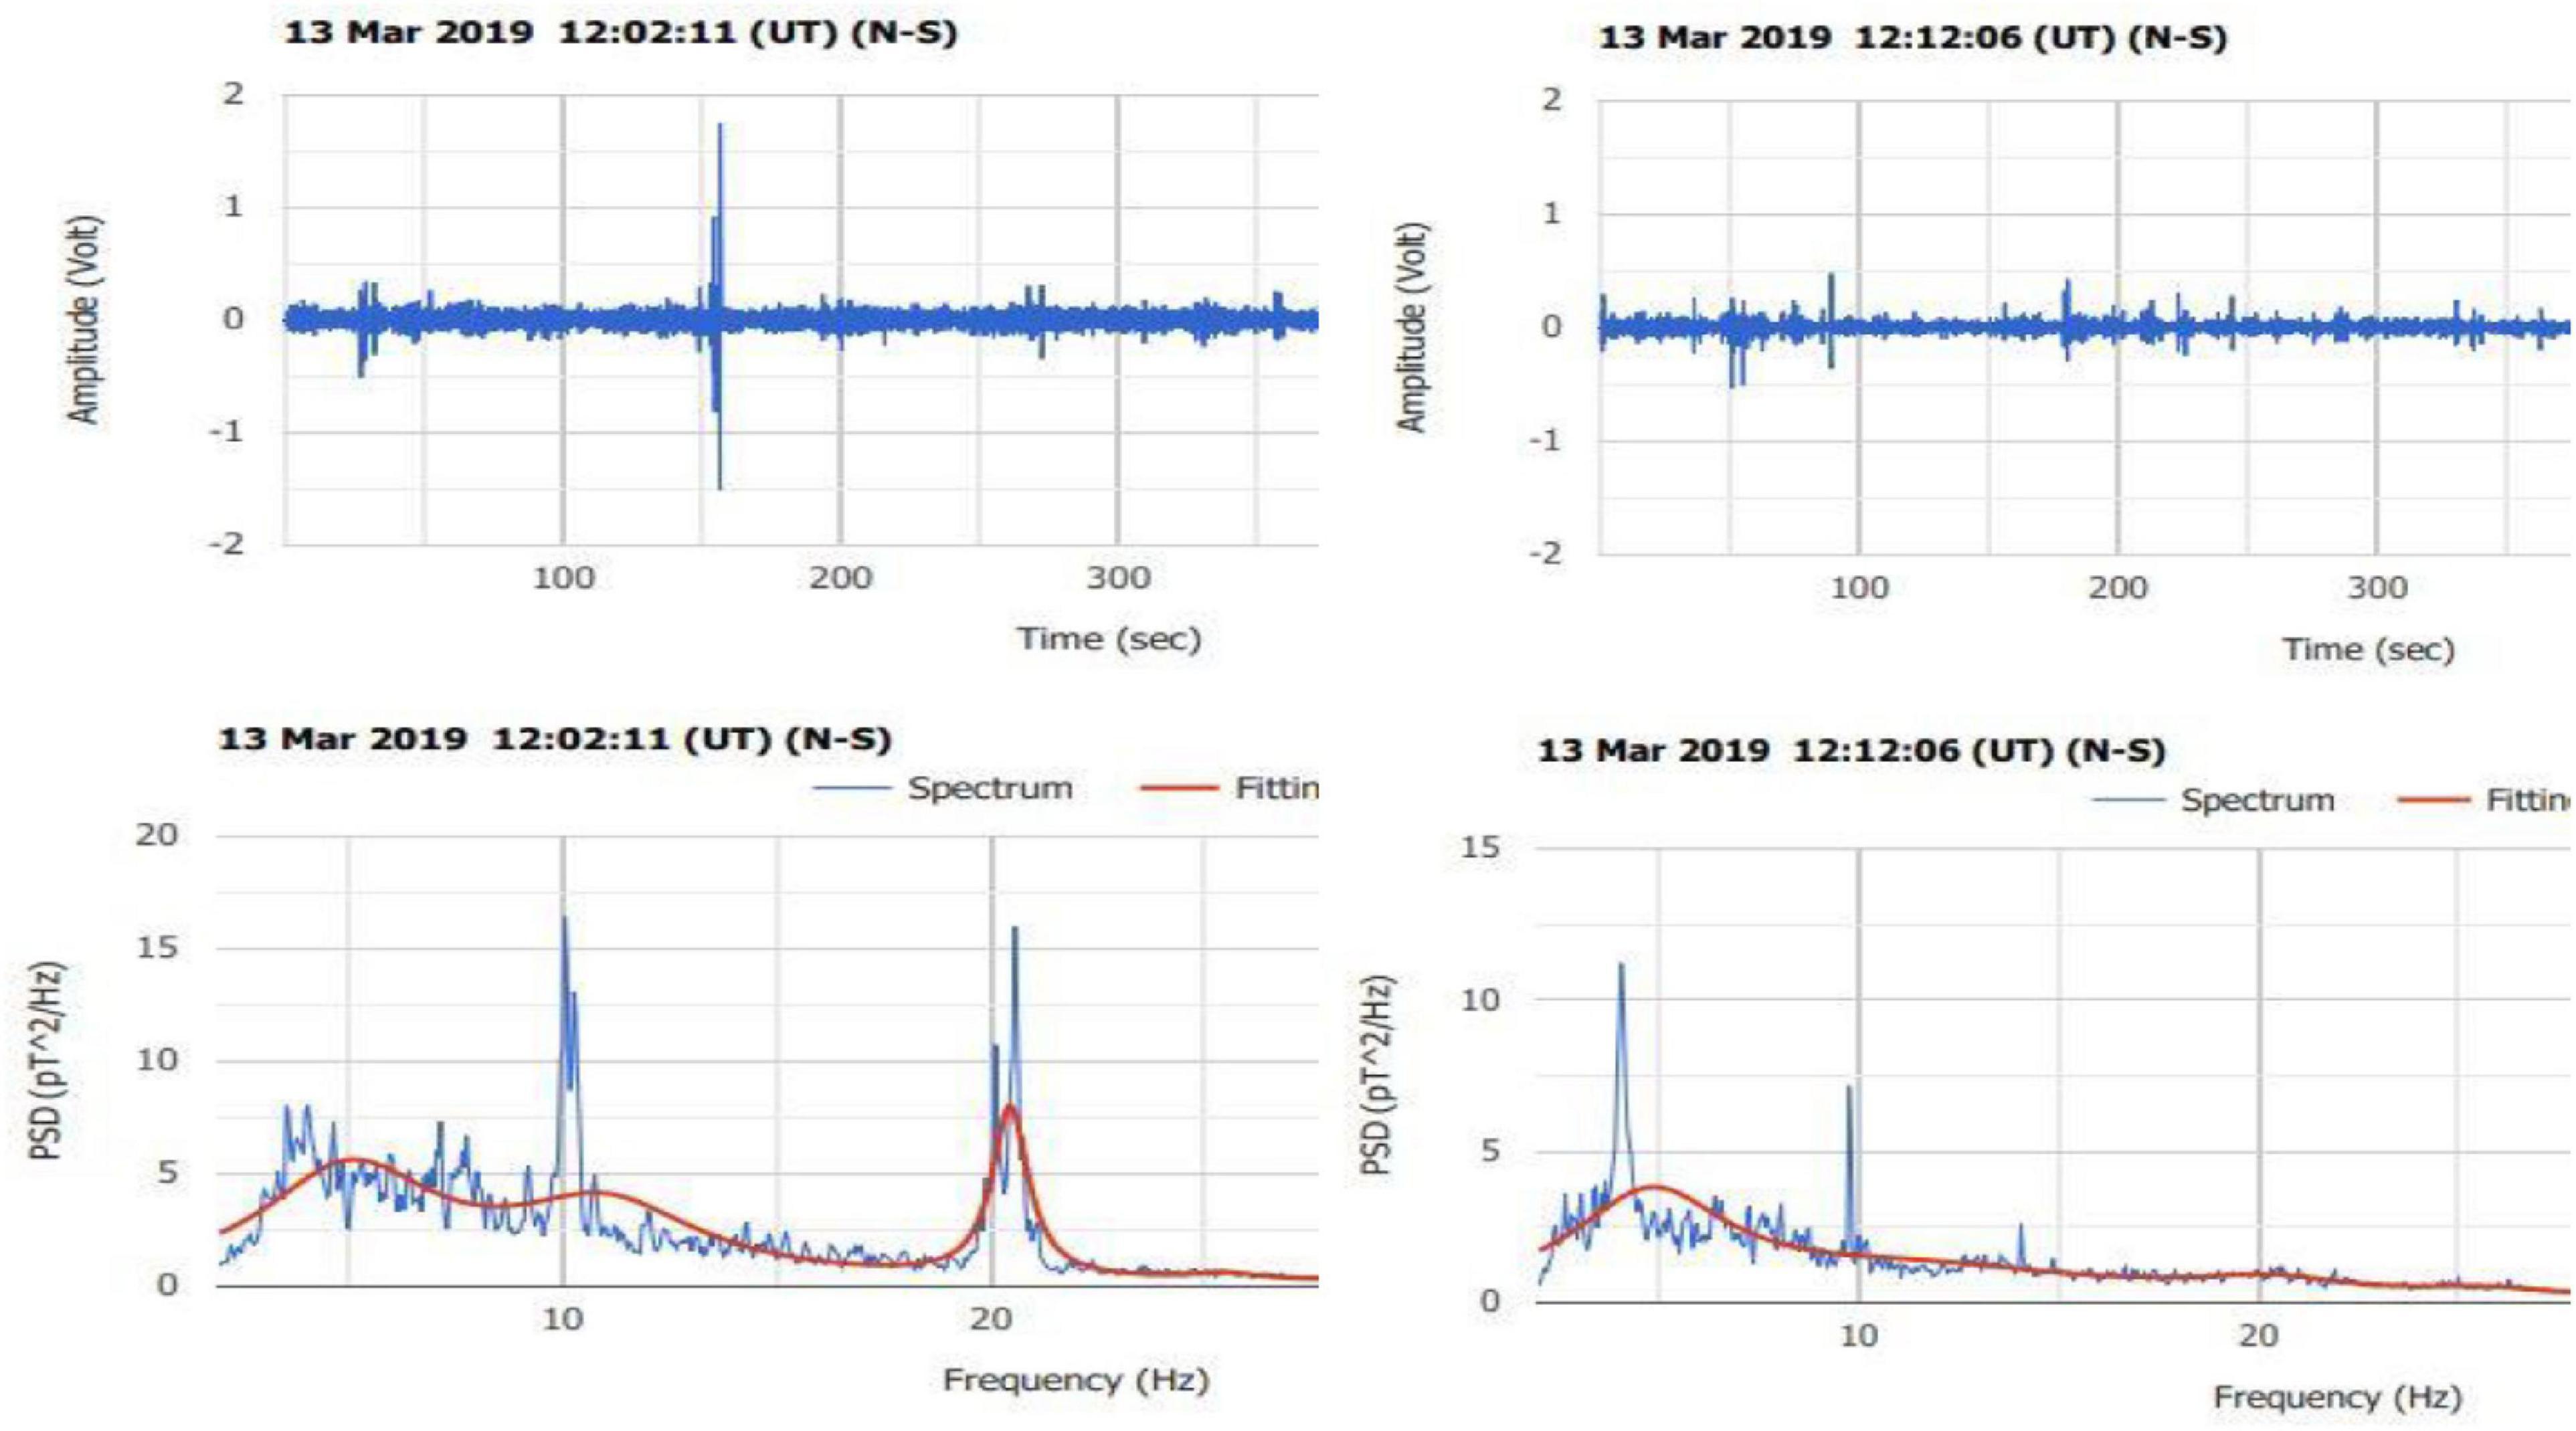
Figure 5. Radio on (left panel) and radio off (right panel).
In Figure 6, we show the effect of vibrating the coil by hand in two perpendicular directions, N-S and E-W (left panel) as well as in the clock and anti-clock direction (right panel). Two characteristic narrow stripes appear on the left panel, while stripes in the right panel are wider. These are very interesting recordings because similar stripes have been recorded before in relation to nearby seismic activity (see Figure 7). An important difference between Figures 6, 7 is that the stripes of Figure 6 do not correspond to a particular spectrum with enhancement in the frequency range of 20–30 Hz like in Figure 7. This is a very important detail which allows us to separate preseismic recordings from simple coil vibrations due to other reasons.
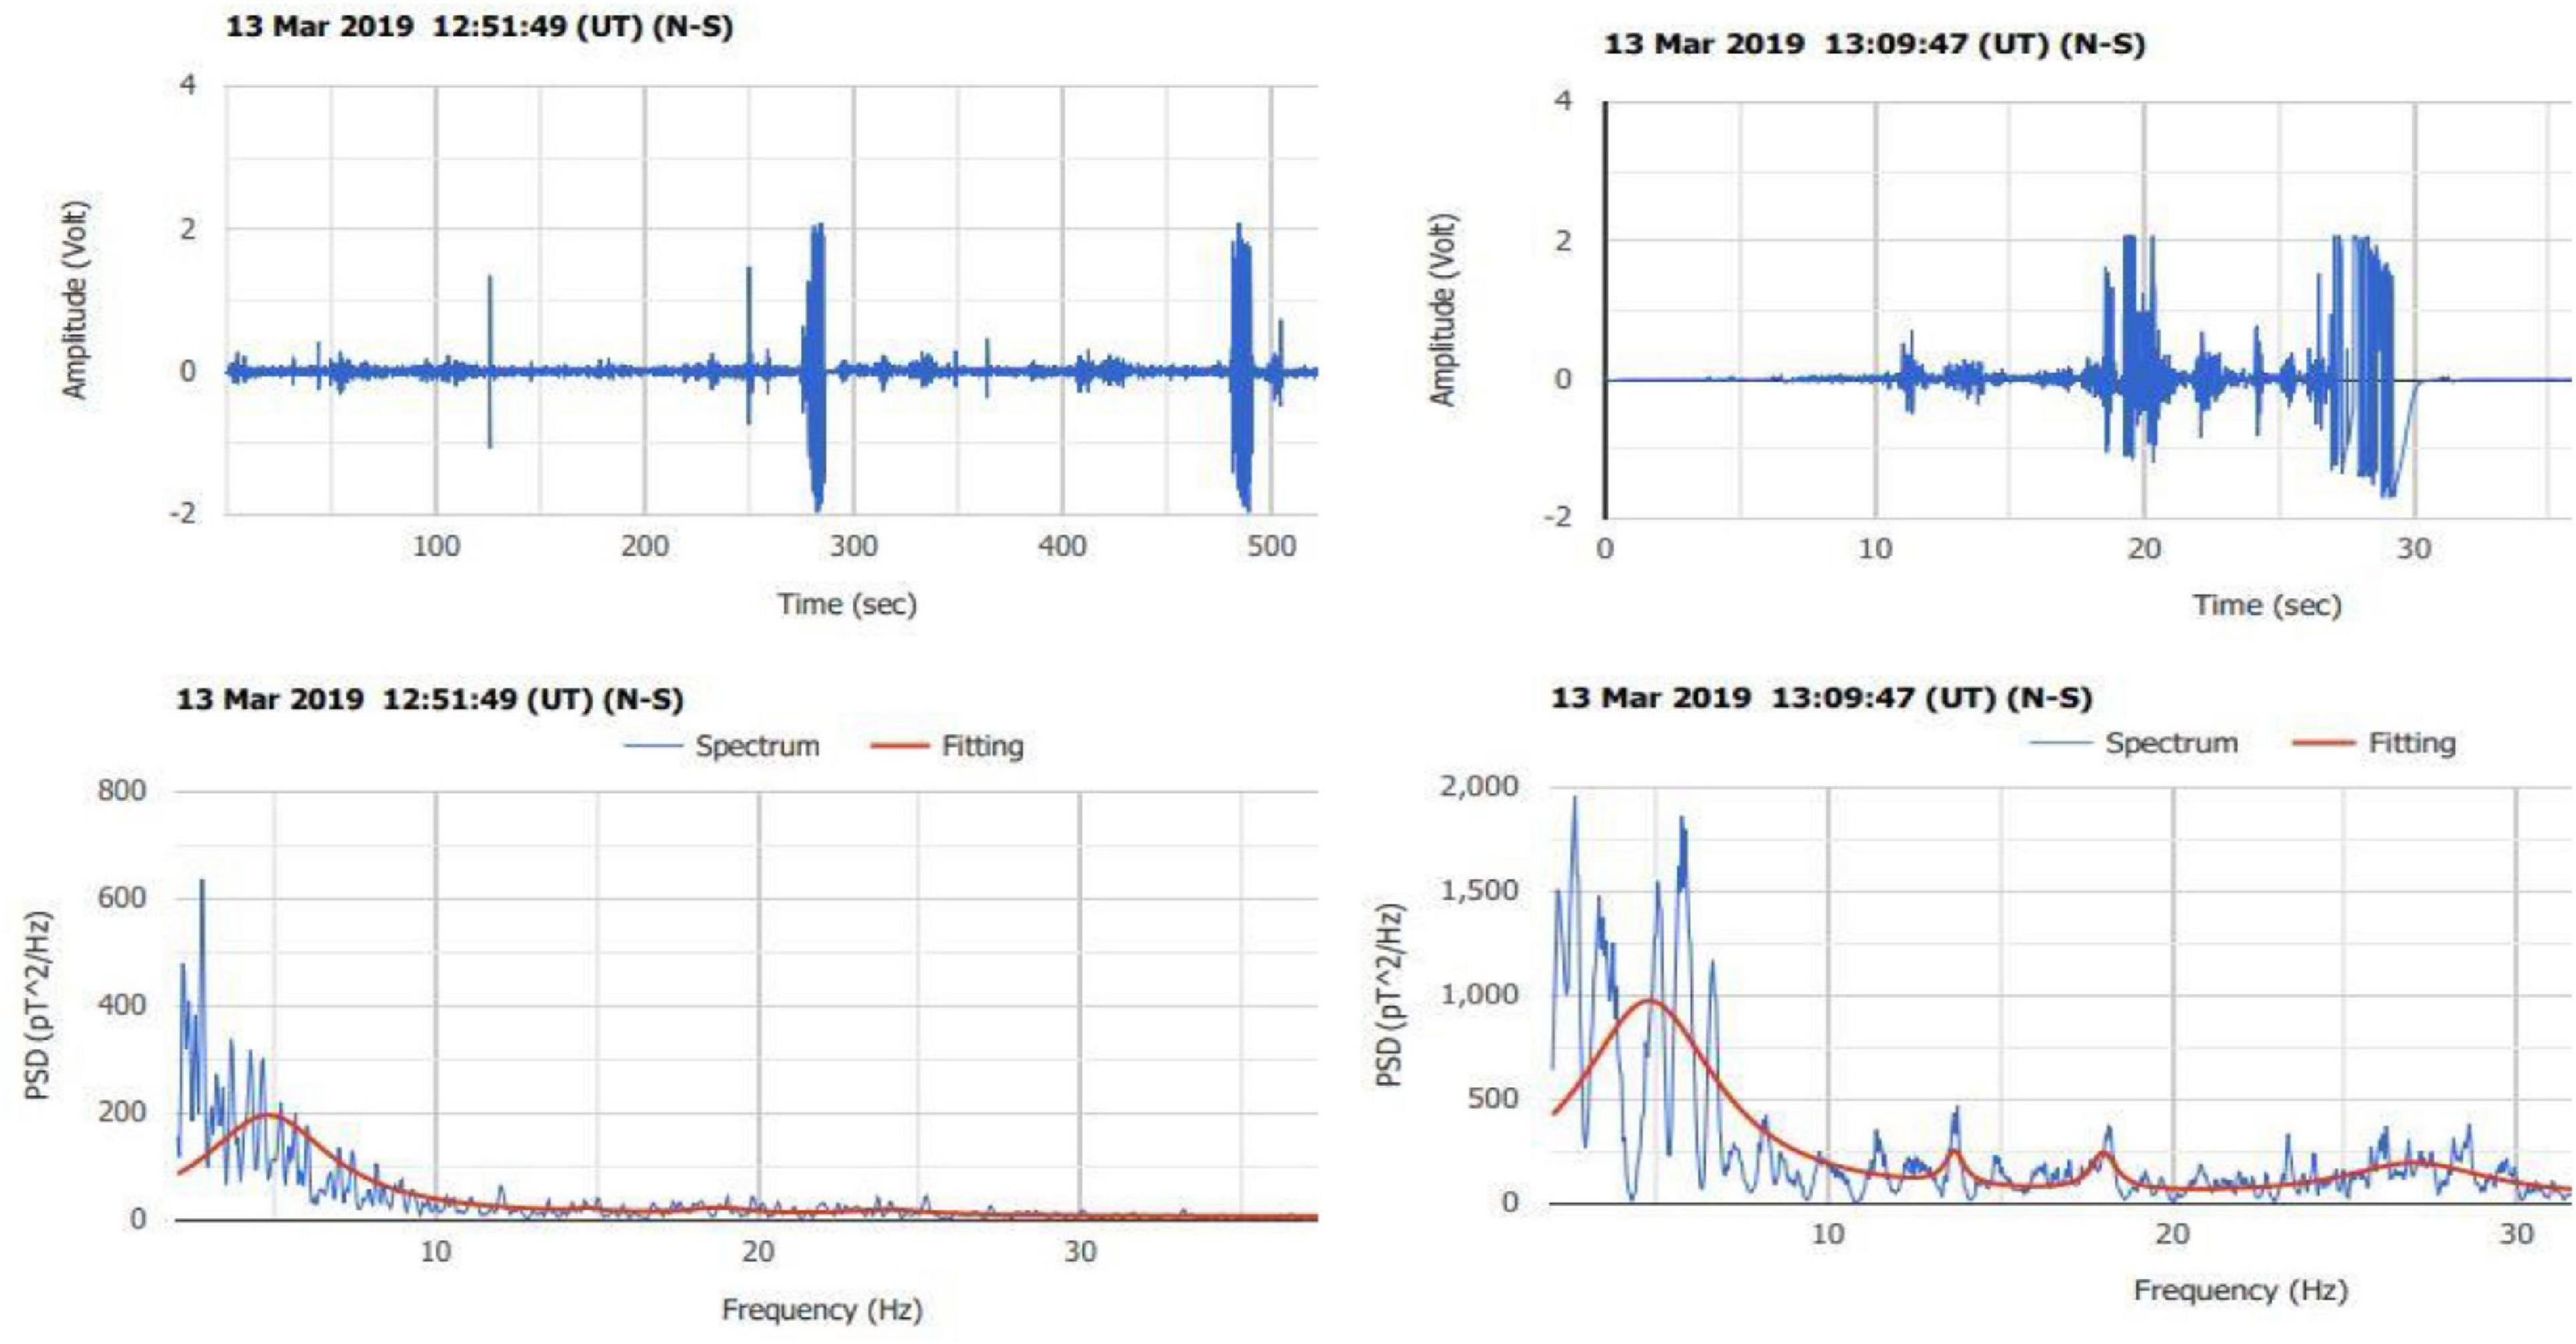
Figure 6. Left panel: two vibrations of the coil by hand in the N-S and E-W directions (narrow stripes). Right panel: two additional intensive vibrations in clock and anti-clock directions by hand made 20 min later.
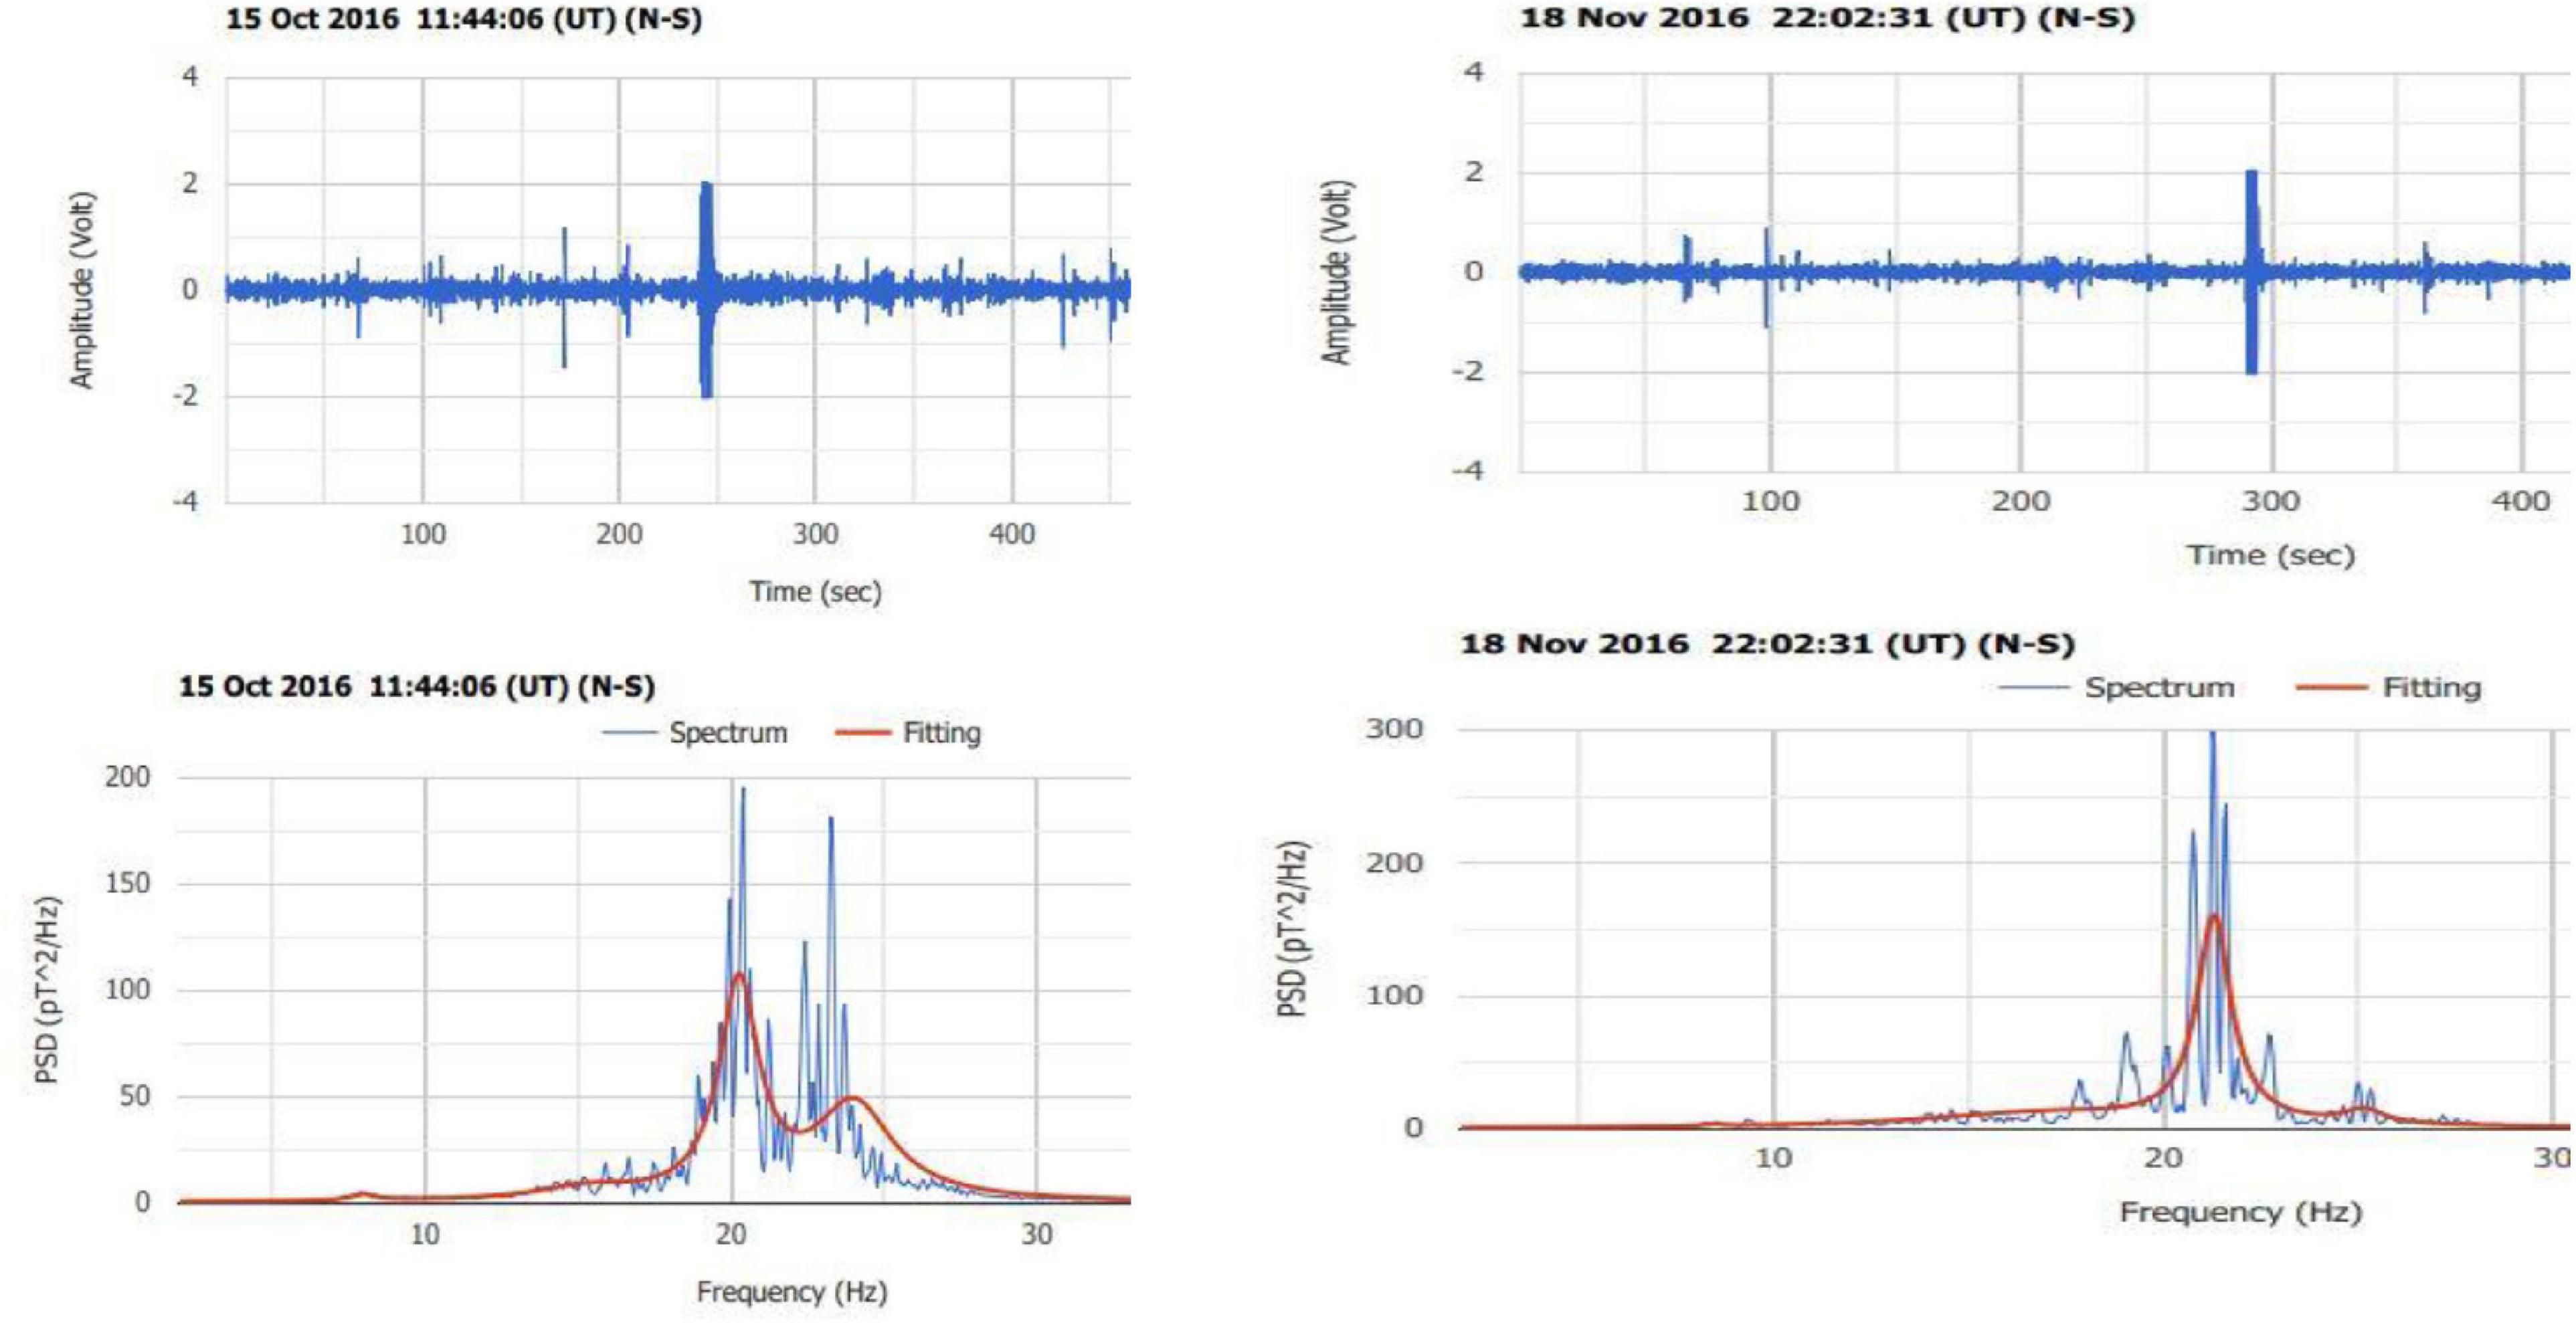
Figure 7. Possible preseismic signals received a few hours before a medium size earthquake at Kalpaki (very close to the NOS site; left panel) and Kilkis (about 200 km away; right panel).
A synthetic but very interesting signal is presented is Figure 8. In the left panel, we see a clear enhancement of the spectrum in the frequency area 20–25 Hz range similar to those in Figure 7. This is the typical form of a possible preseismic signal identified in several cases (Christofilakis et al., 2019; Florios et al., 2019, 2020).
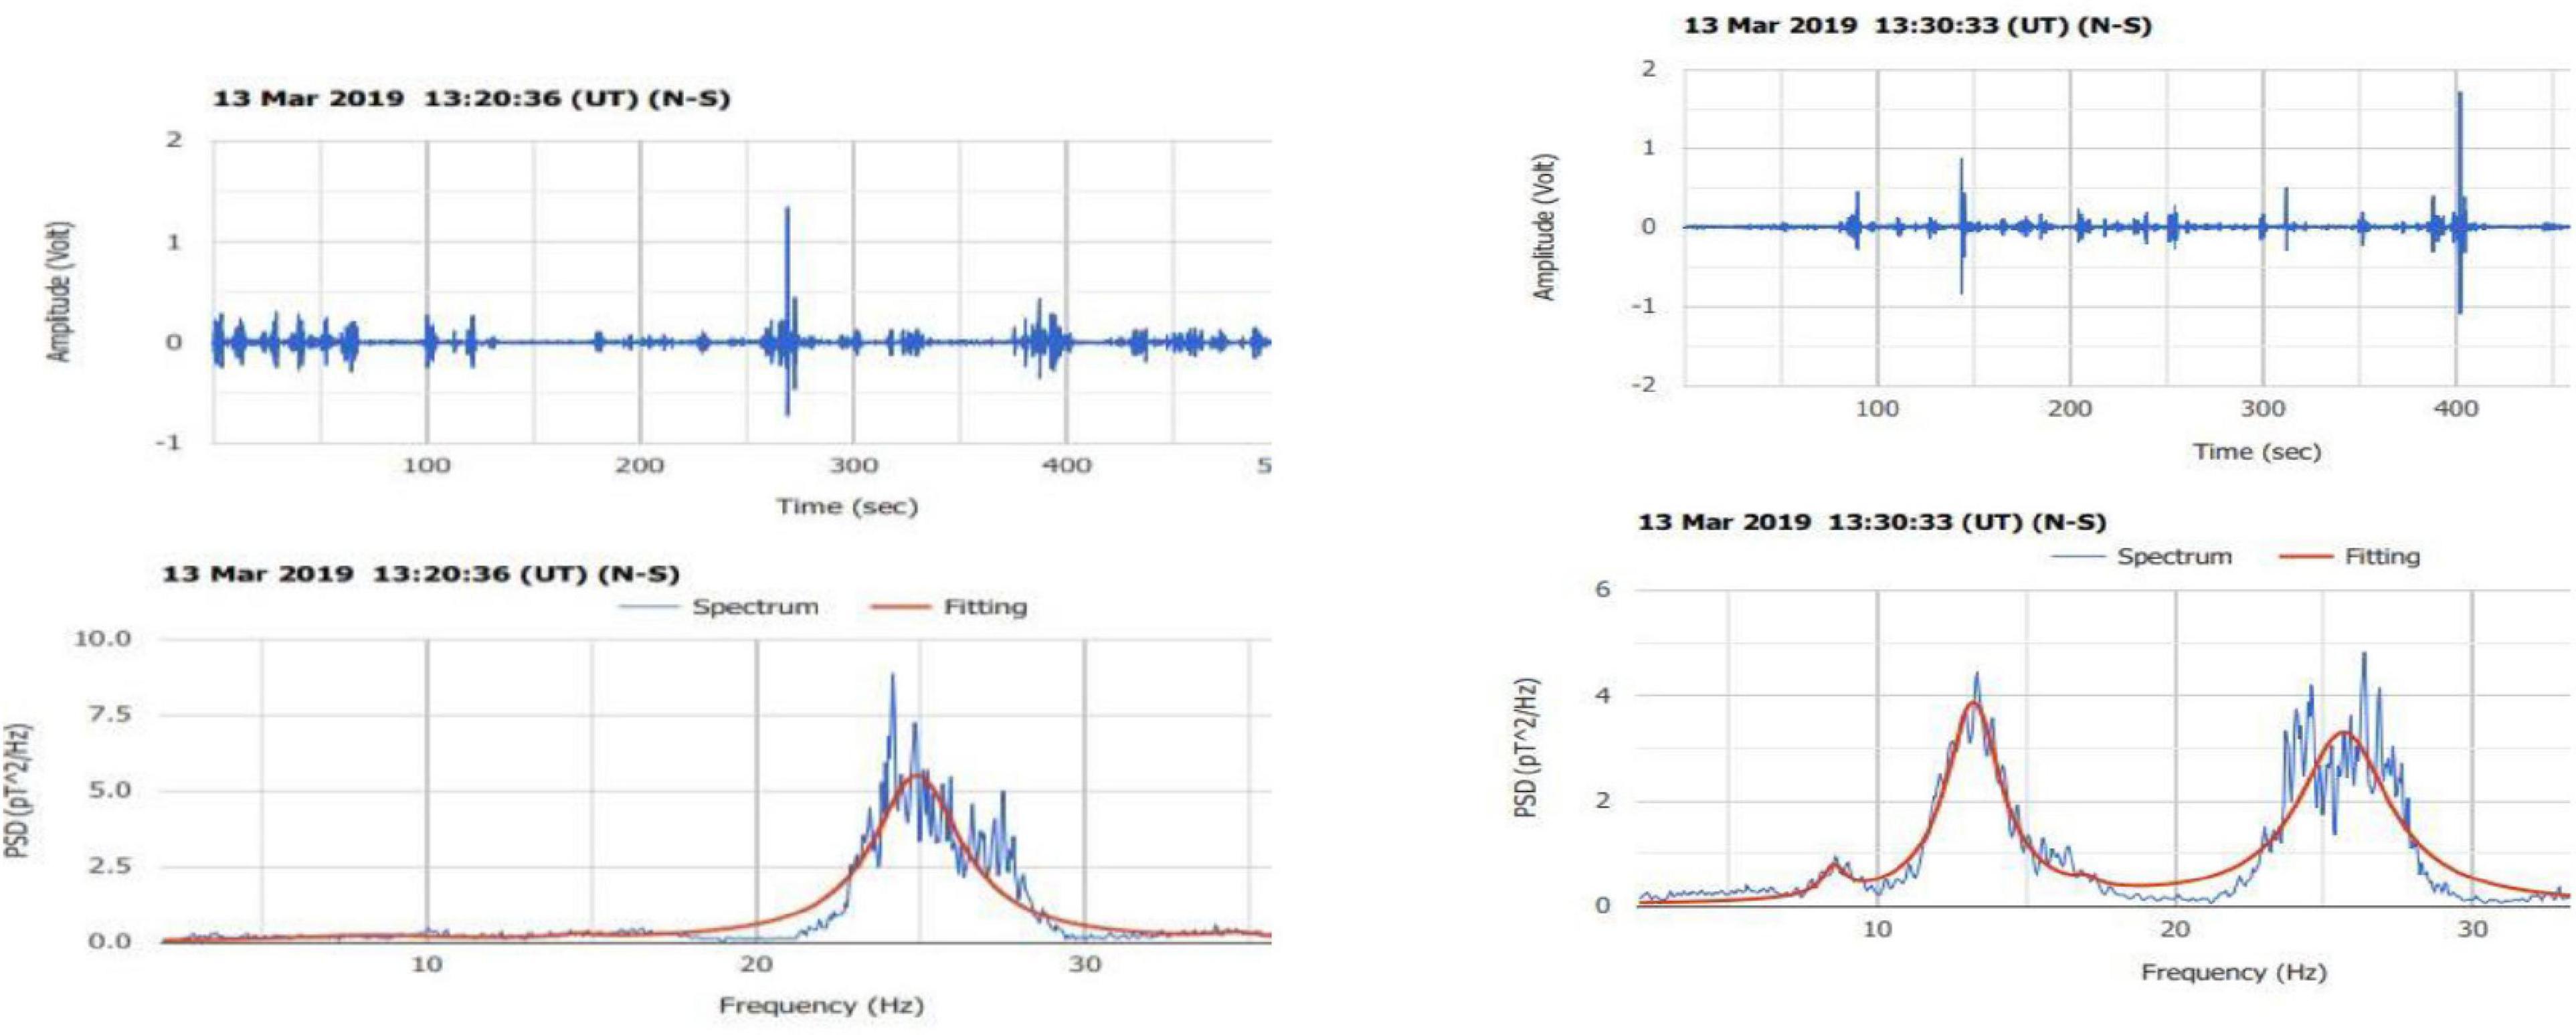
Figure 8. Possible preseismic signal (left) and signal due to shooting by a two-barrel hunting rifle (right).
During the next 10 min, we fired a two barrel hunting rifle, as is evident from another enhancement in the range 10–20 Hz. It is very interesting that the first enhancement in the range 20–30 Hz stayed almost unchanged after firing. Six days later, a weak earthquake of magnitude 2.7 in the Richter scale occurred 6 km away from the place of observations. This was a serious candidate of preseismic recording in the raw SR data during the measurements shown in Figure 8.
In closing this section, we would like to note that a distance of only 1 km is not sufficient to avoid interference from electric power lines. The typical SR modes that appeared during the test performed in Drafi were very weak. This is an indication that SR observations must be performed in more isolated areas.
Second Test in the South Greek Site (SOS)
A second test was performed on the 2nd of September 2020 near the top of Mount Parnon where the measurement conditions are ideal. No electromagnetic source is present within at least 5 km around the site. In Figure 9, we present two successive recordings that correspond to a car engine turning on and off. In the left panel, a normal SR recording with four main modes around 7.8, 14, 21, and 28 Hz is evident. In the right panel, which is the next 10-min recording, the measurement was severely disturbed by the running car engine. The turning on and running of the car engine are obvious in the upper picture of the right panel.
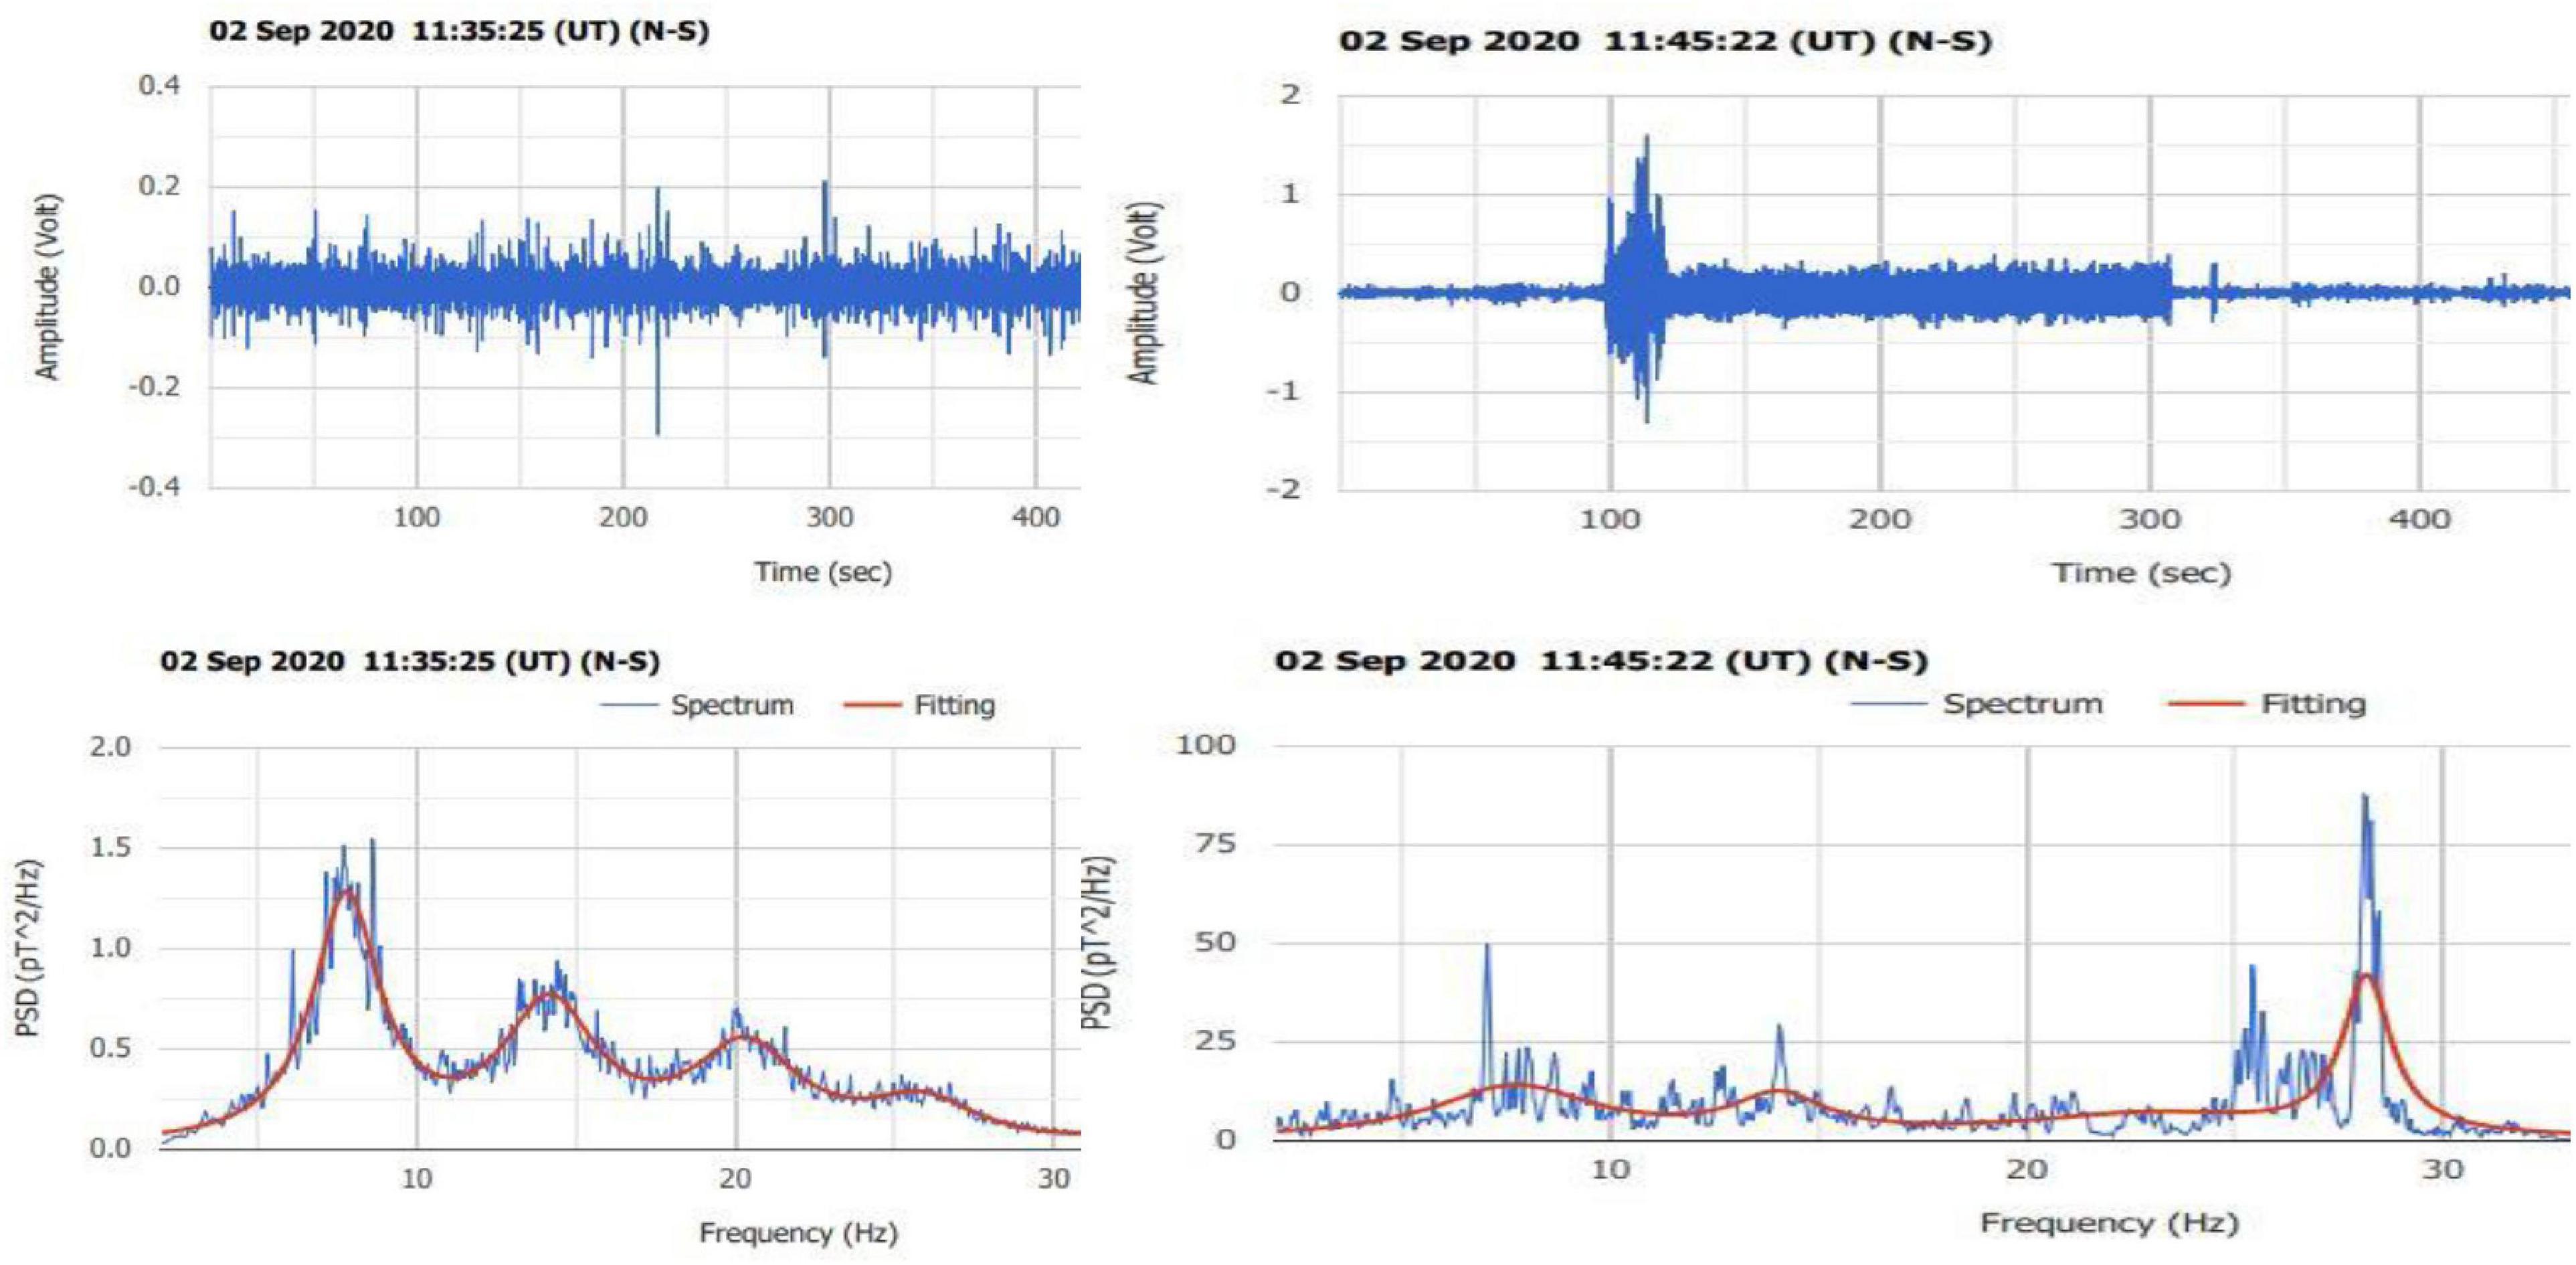
Figure 9. Right panel: the peculiar features are due to a running car engine. Left panel: undisturbed SR spectrum 10 min before the car engine ignition.
In Figure 10, we demonstrate the consequence of firing a two-barrel hunting gun near the SR coil. The left panel of Figure 10 is the undisturbed period immediately before the shooting. This is a normal recording where the four main modes are present. The next right panel is a disturbed recording after two successive shootings by the hunting gun. Figures 9, 10 represent very important tests because passing cars and hunters are very common around SR recording sites which are usually operating in isolated areas like forests and mountains.
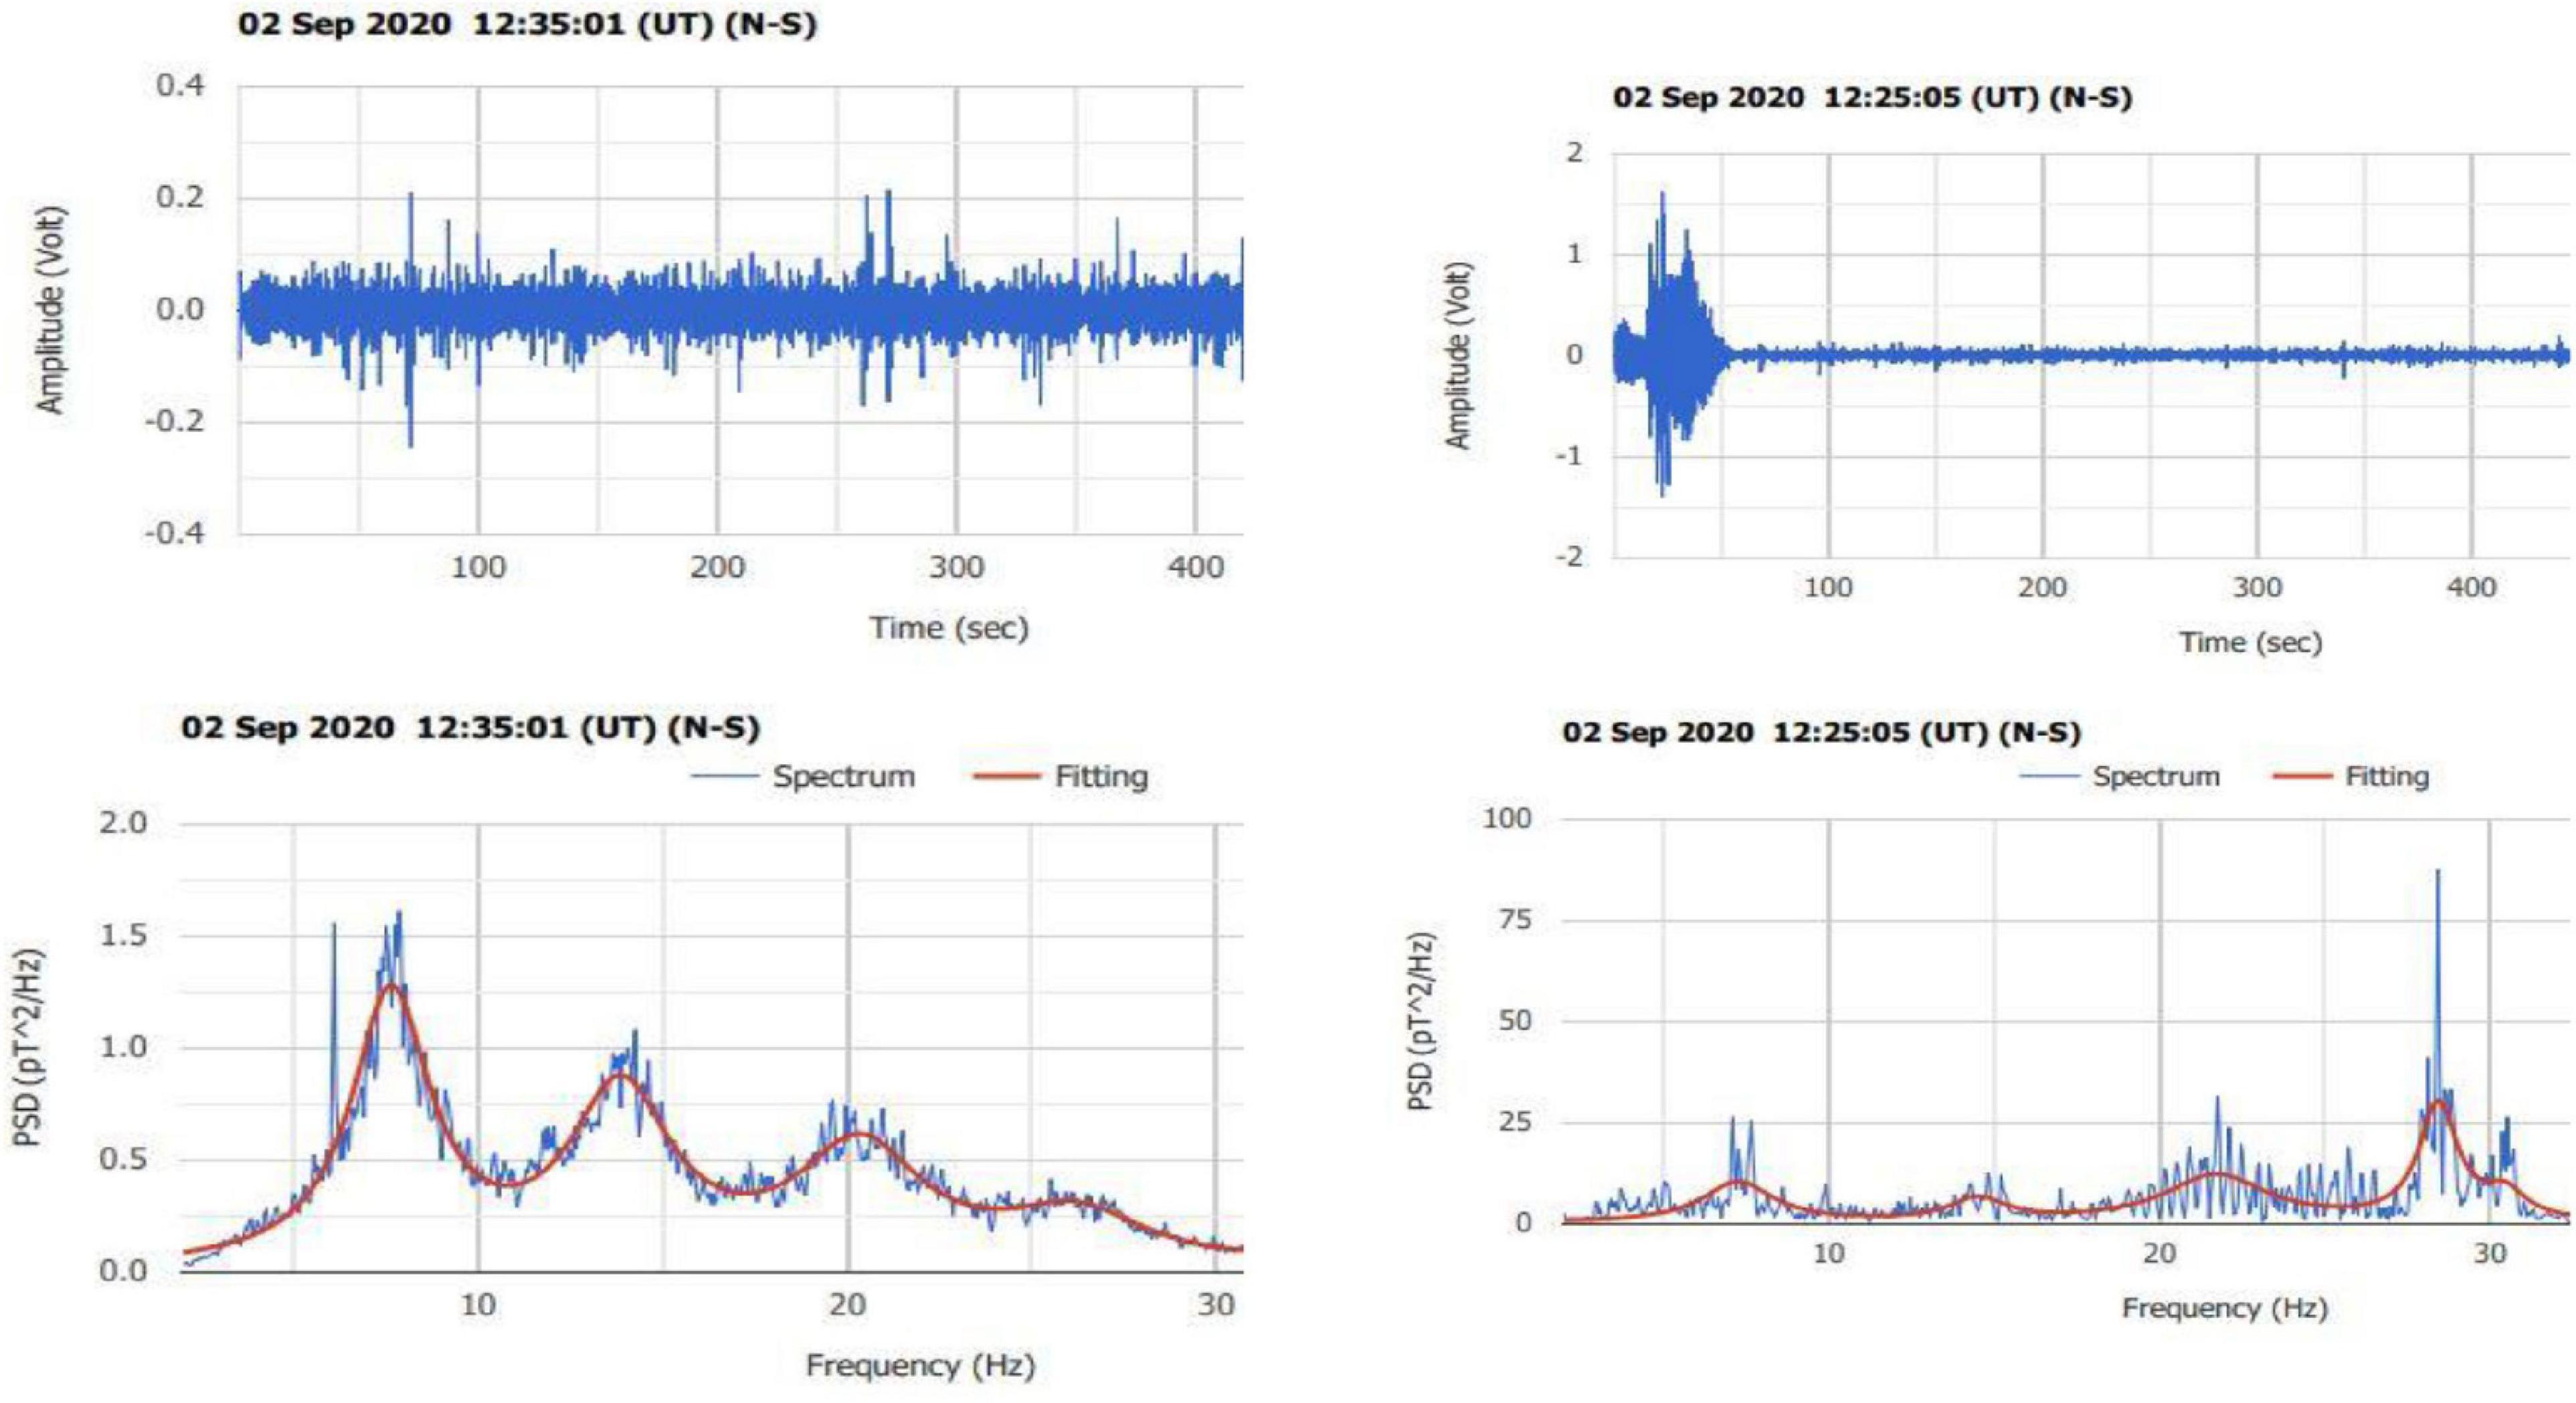
Figure 10. Right panel: the effect of shooting with a hunting rifle. Left panel: undisturbed spectrum 10 min after shooting.
In the left panel of Figure 11, we present a recording during which we hit the metal door and window of the observation site five times with the butt-end of our hunting gun. In the right panel, we present the successive undisturbed file recorded after knocking. We see the immediate recovery of the recording after the disturbance.
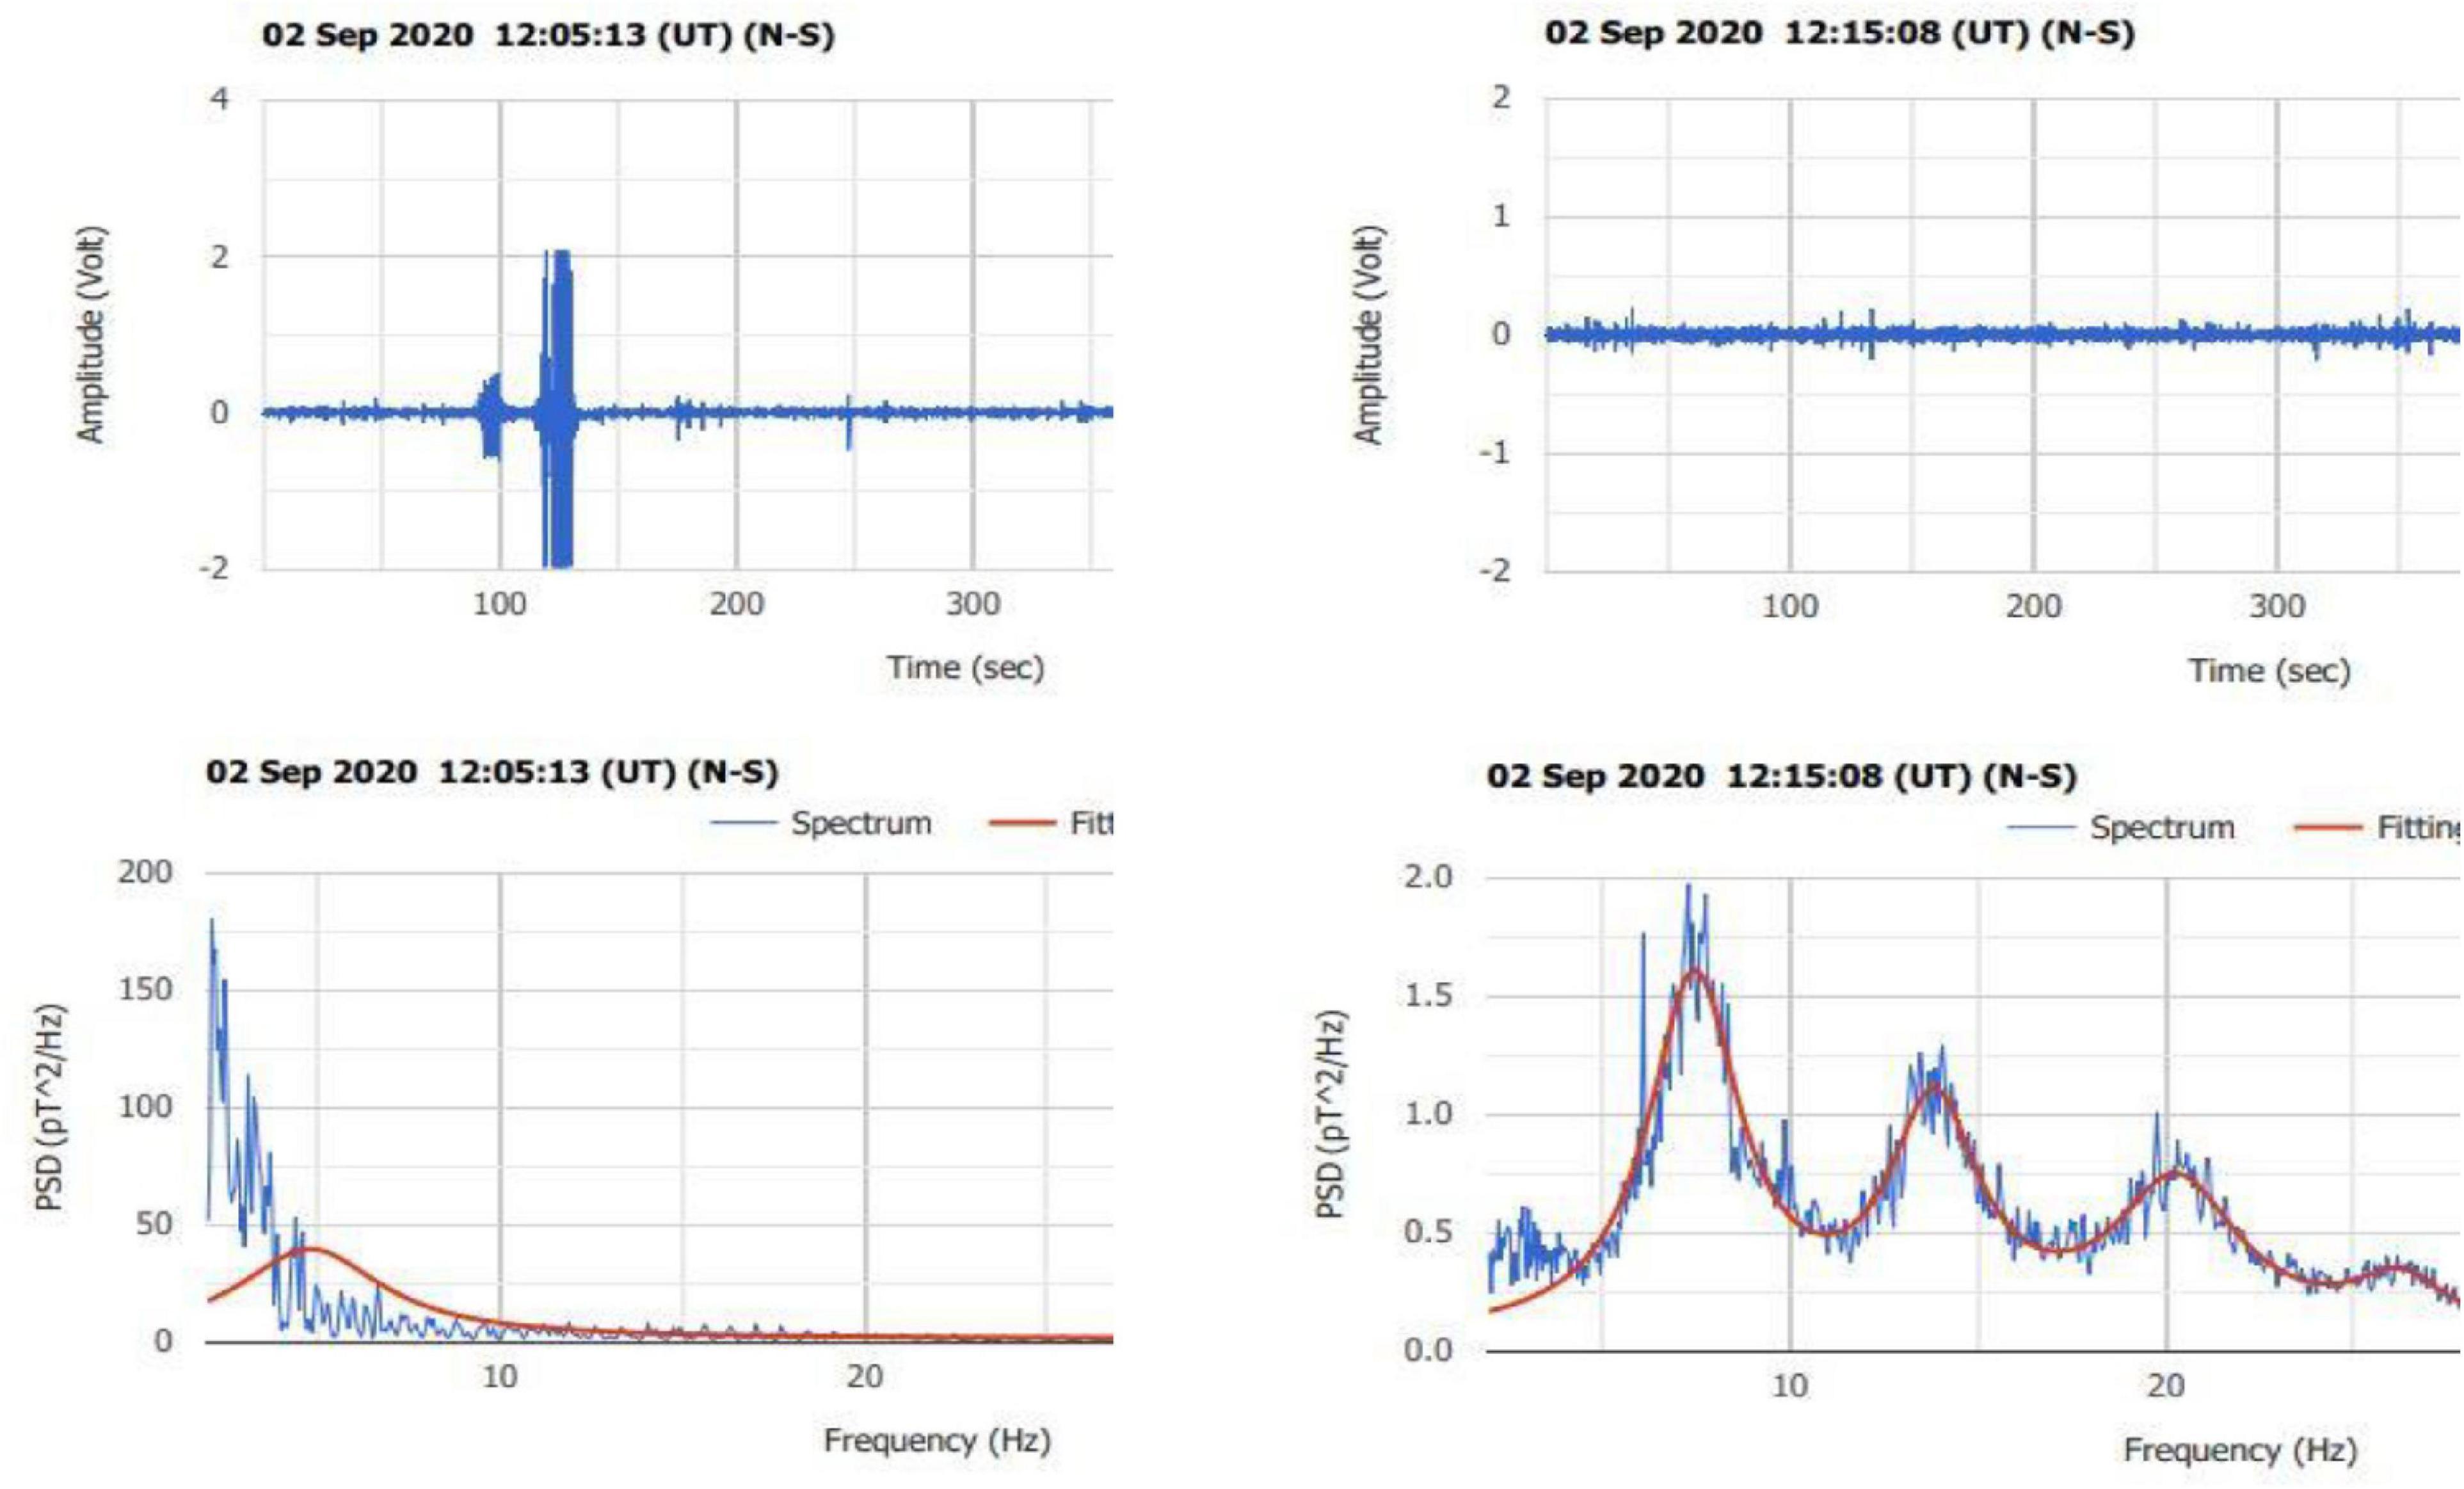
Figure 11. Left panel: peculiar features due to five strong knocks on the door and five more on the window of the building in the south site. Right panel: spectrum recovery 10 min later.
In Figure 12, we present very interesting details of Figure 11. This is a magnified snapshot of the left upper panel of Figure 11. It is very impressive how clearly all the action was recorded. At the beginning till the first 100 s, we see a set of five low intensity spikes. They represent the five knocks on the metallic door of the building from which the coil is located several meters away. Between 120 and 130 s, there is another set of five high intensity spikes which represent the five knocks on the metal window of the building exactly above the coil. The intensity difference in the two sets may be justified by the distance difference. The second set of knocks is bounded by short spikes that are due to our moving from one point to another around the site.
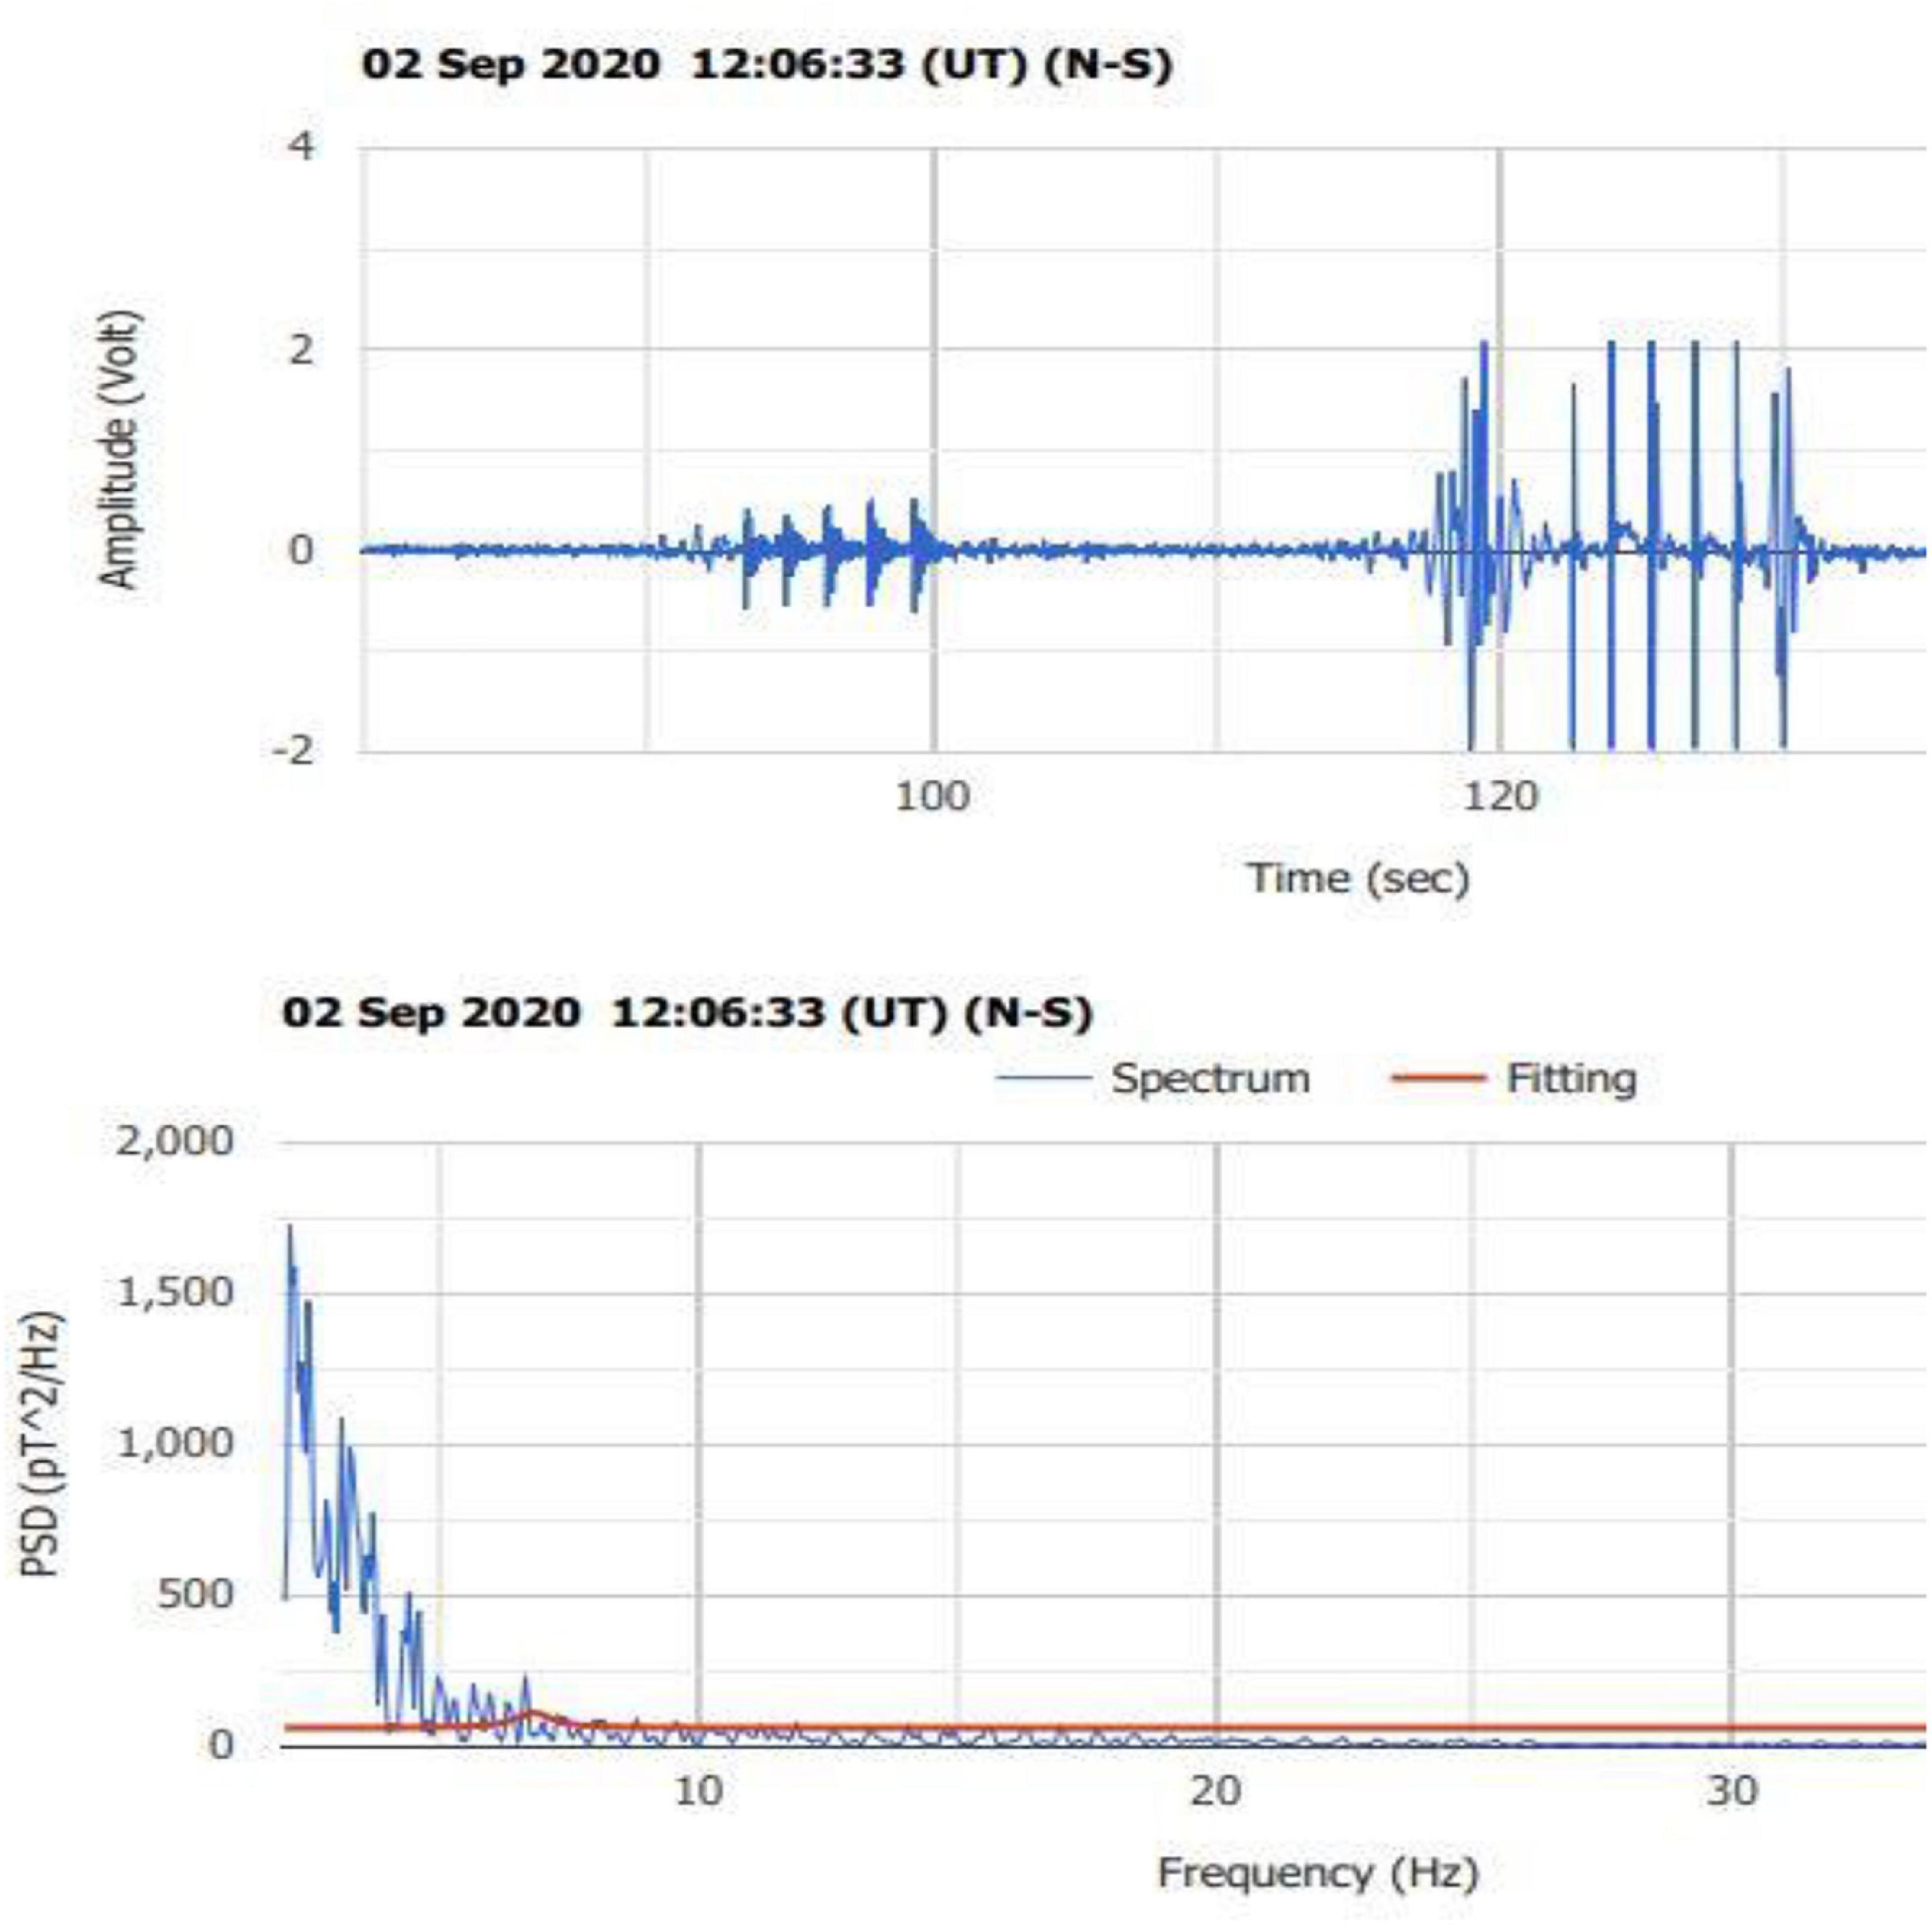
Figure 12. Magnified snapshot of Figure 11. The short five knocks on the door and the five strong knocks on the window are evident.
Interesting Signals Obtained in Extra Tests
Before closing the experimental part of this article, it is interesting to present two additional recordings that were obtained at times different from the two main tests described above. They represent an example of how easy it is to misinterpret the recorded signals.
In Figure 13, we present two recordings collected in different times at a different place. The initial interpretation was that the signal had something to do with nearby operating machinery (pump or something similar). However, after additional indications, we realized that it was due to the fading of the energy supply of the logger. The batteries were almost exhausted, and this made the logger to malfunction.
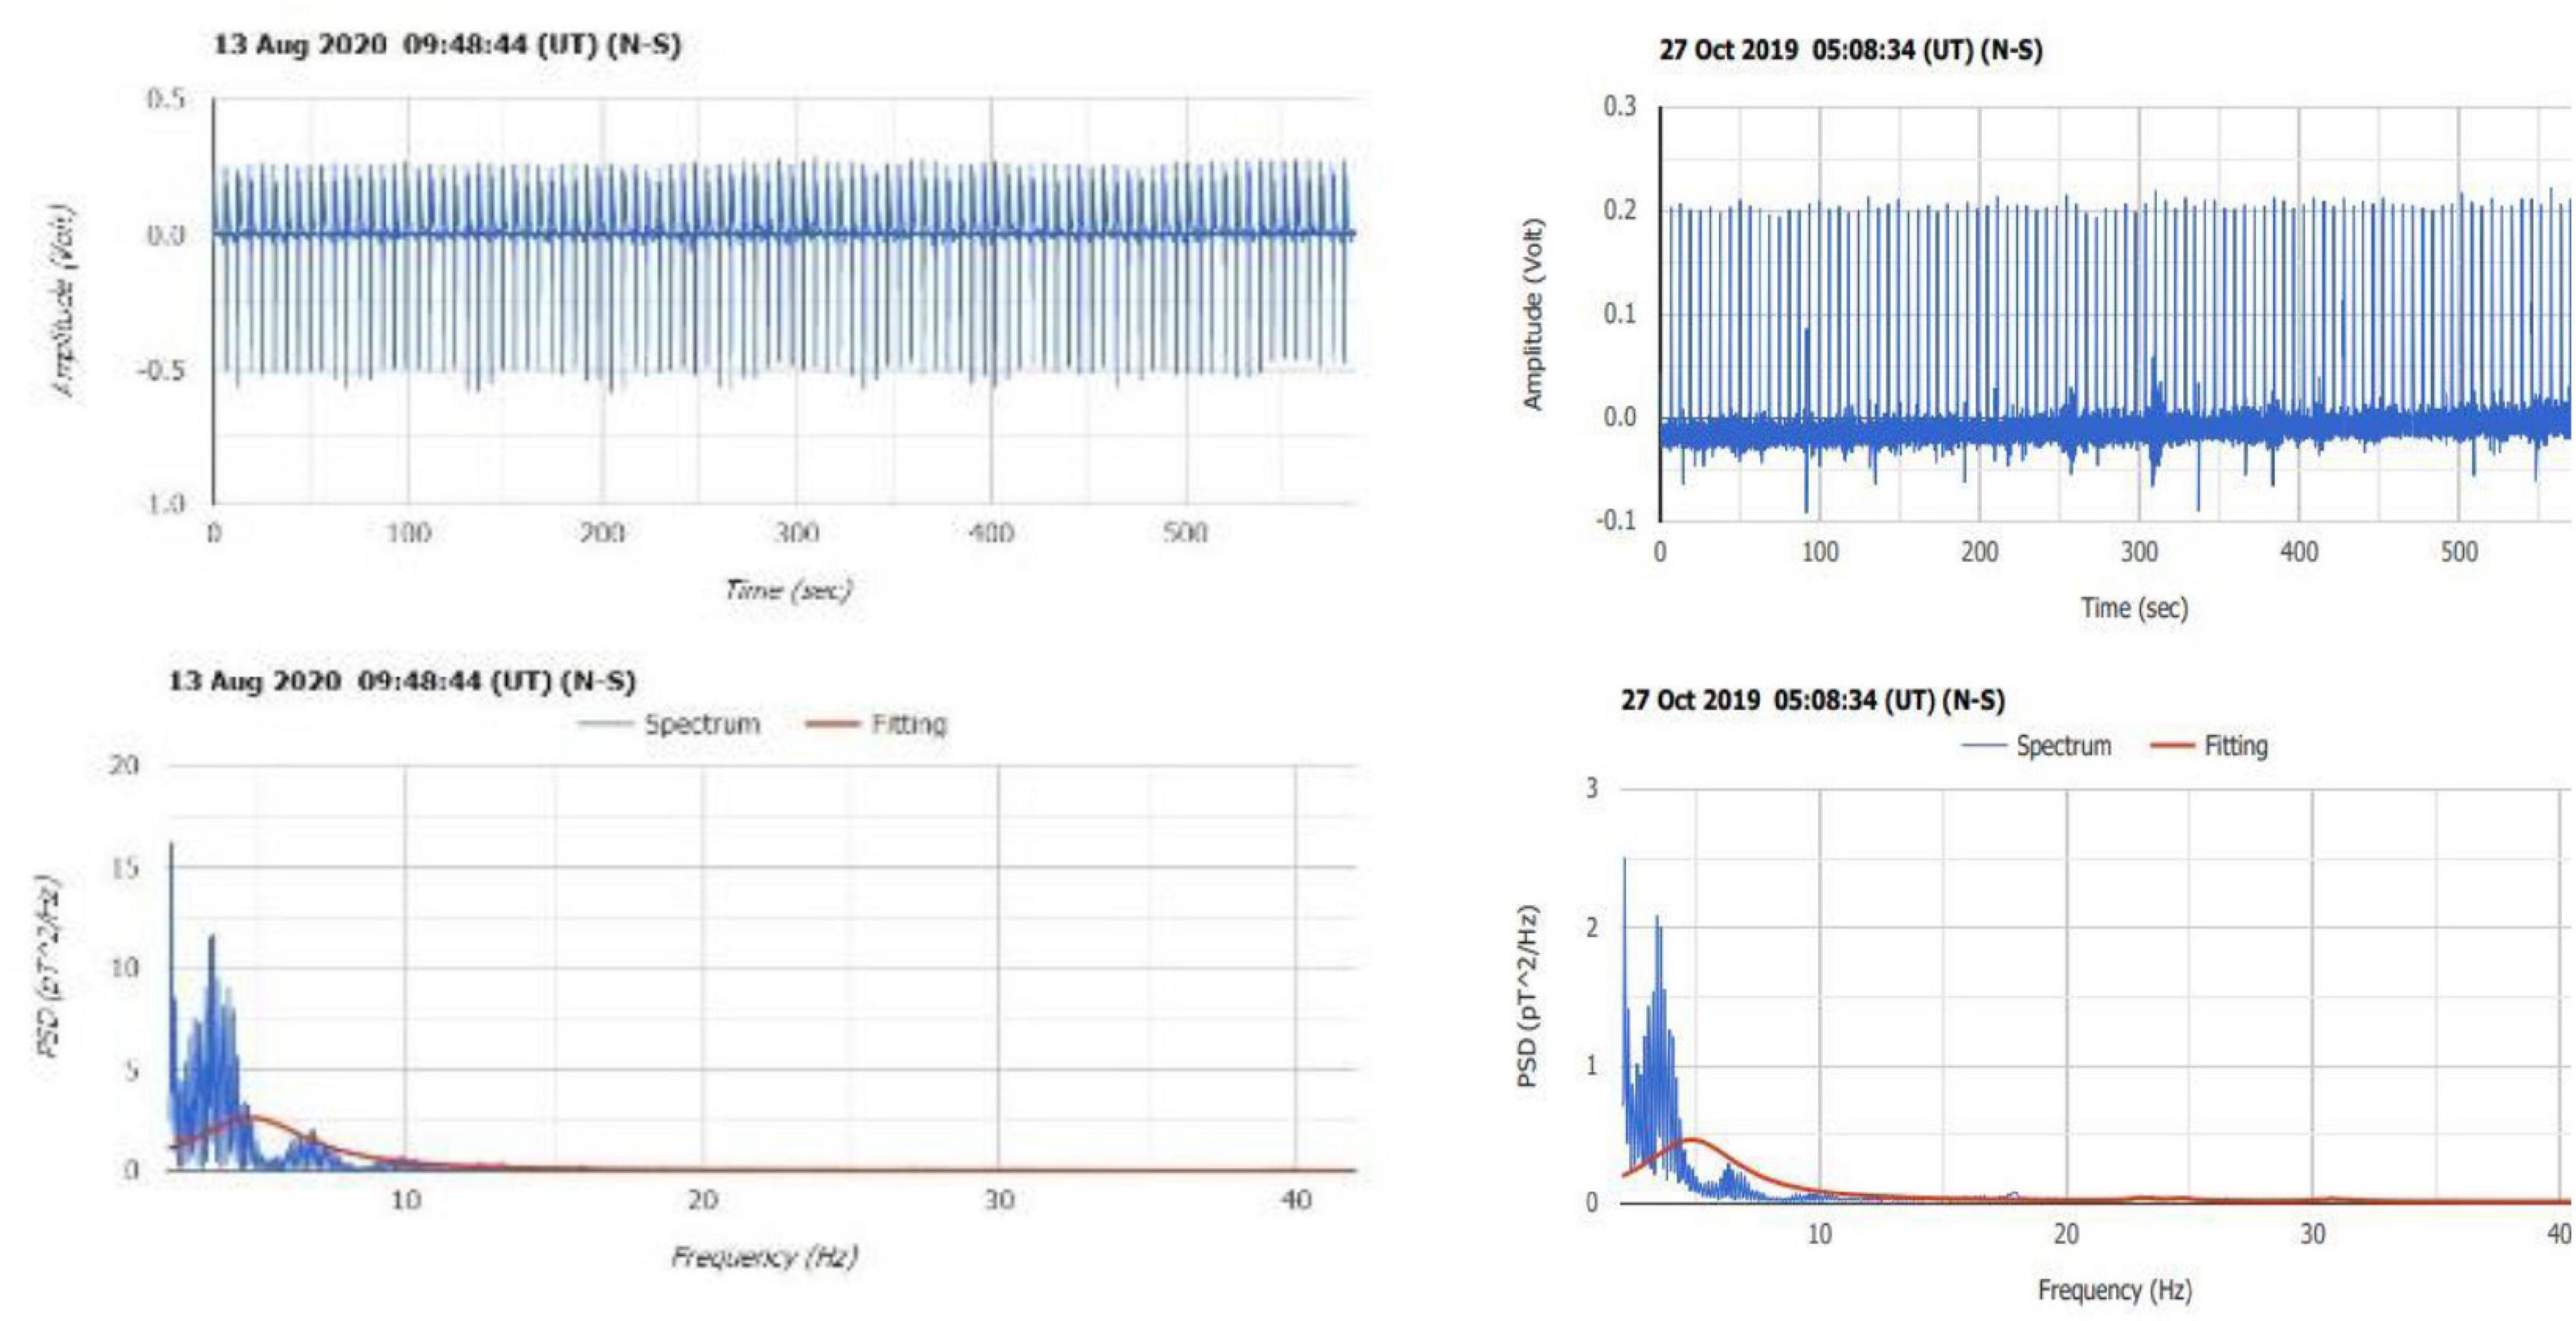
Figure 13. Characteristic recordings when the logger’s electrical supply is insufficient due to the exhaustion of batteries.
In Figure 14, we present an additional case of coil vibration by hand similar to Figure 6 because of the importance of these signals for the determination of preseismic activity. The lack of enhancements in the frequency range of 20–30 Hz is again evident.
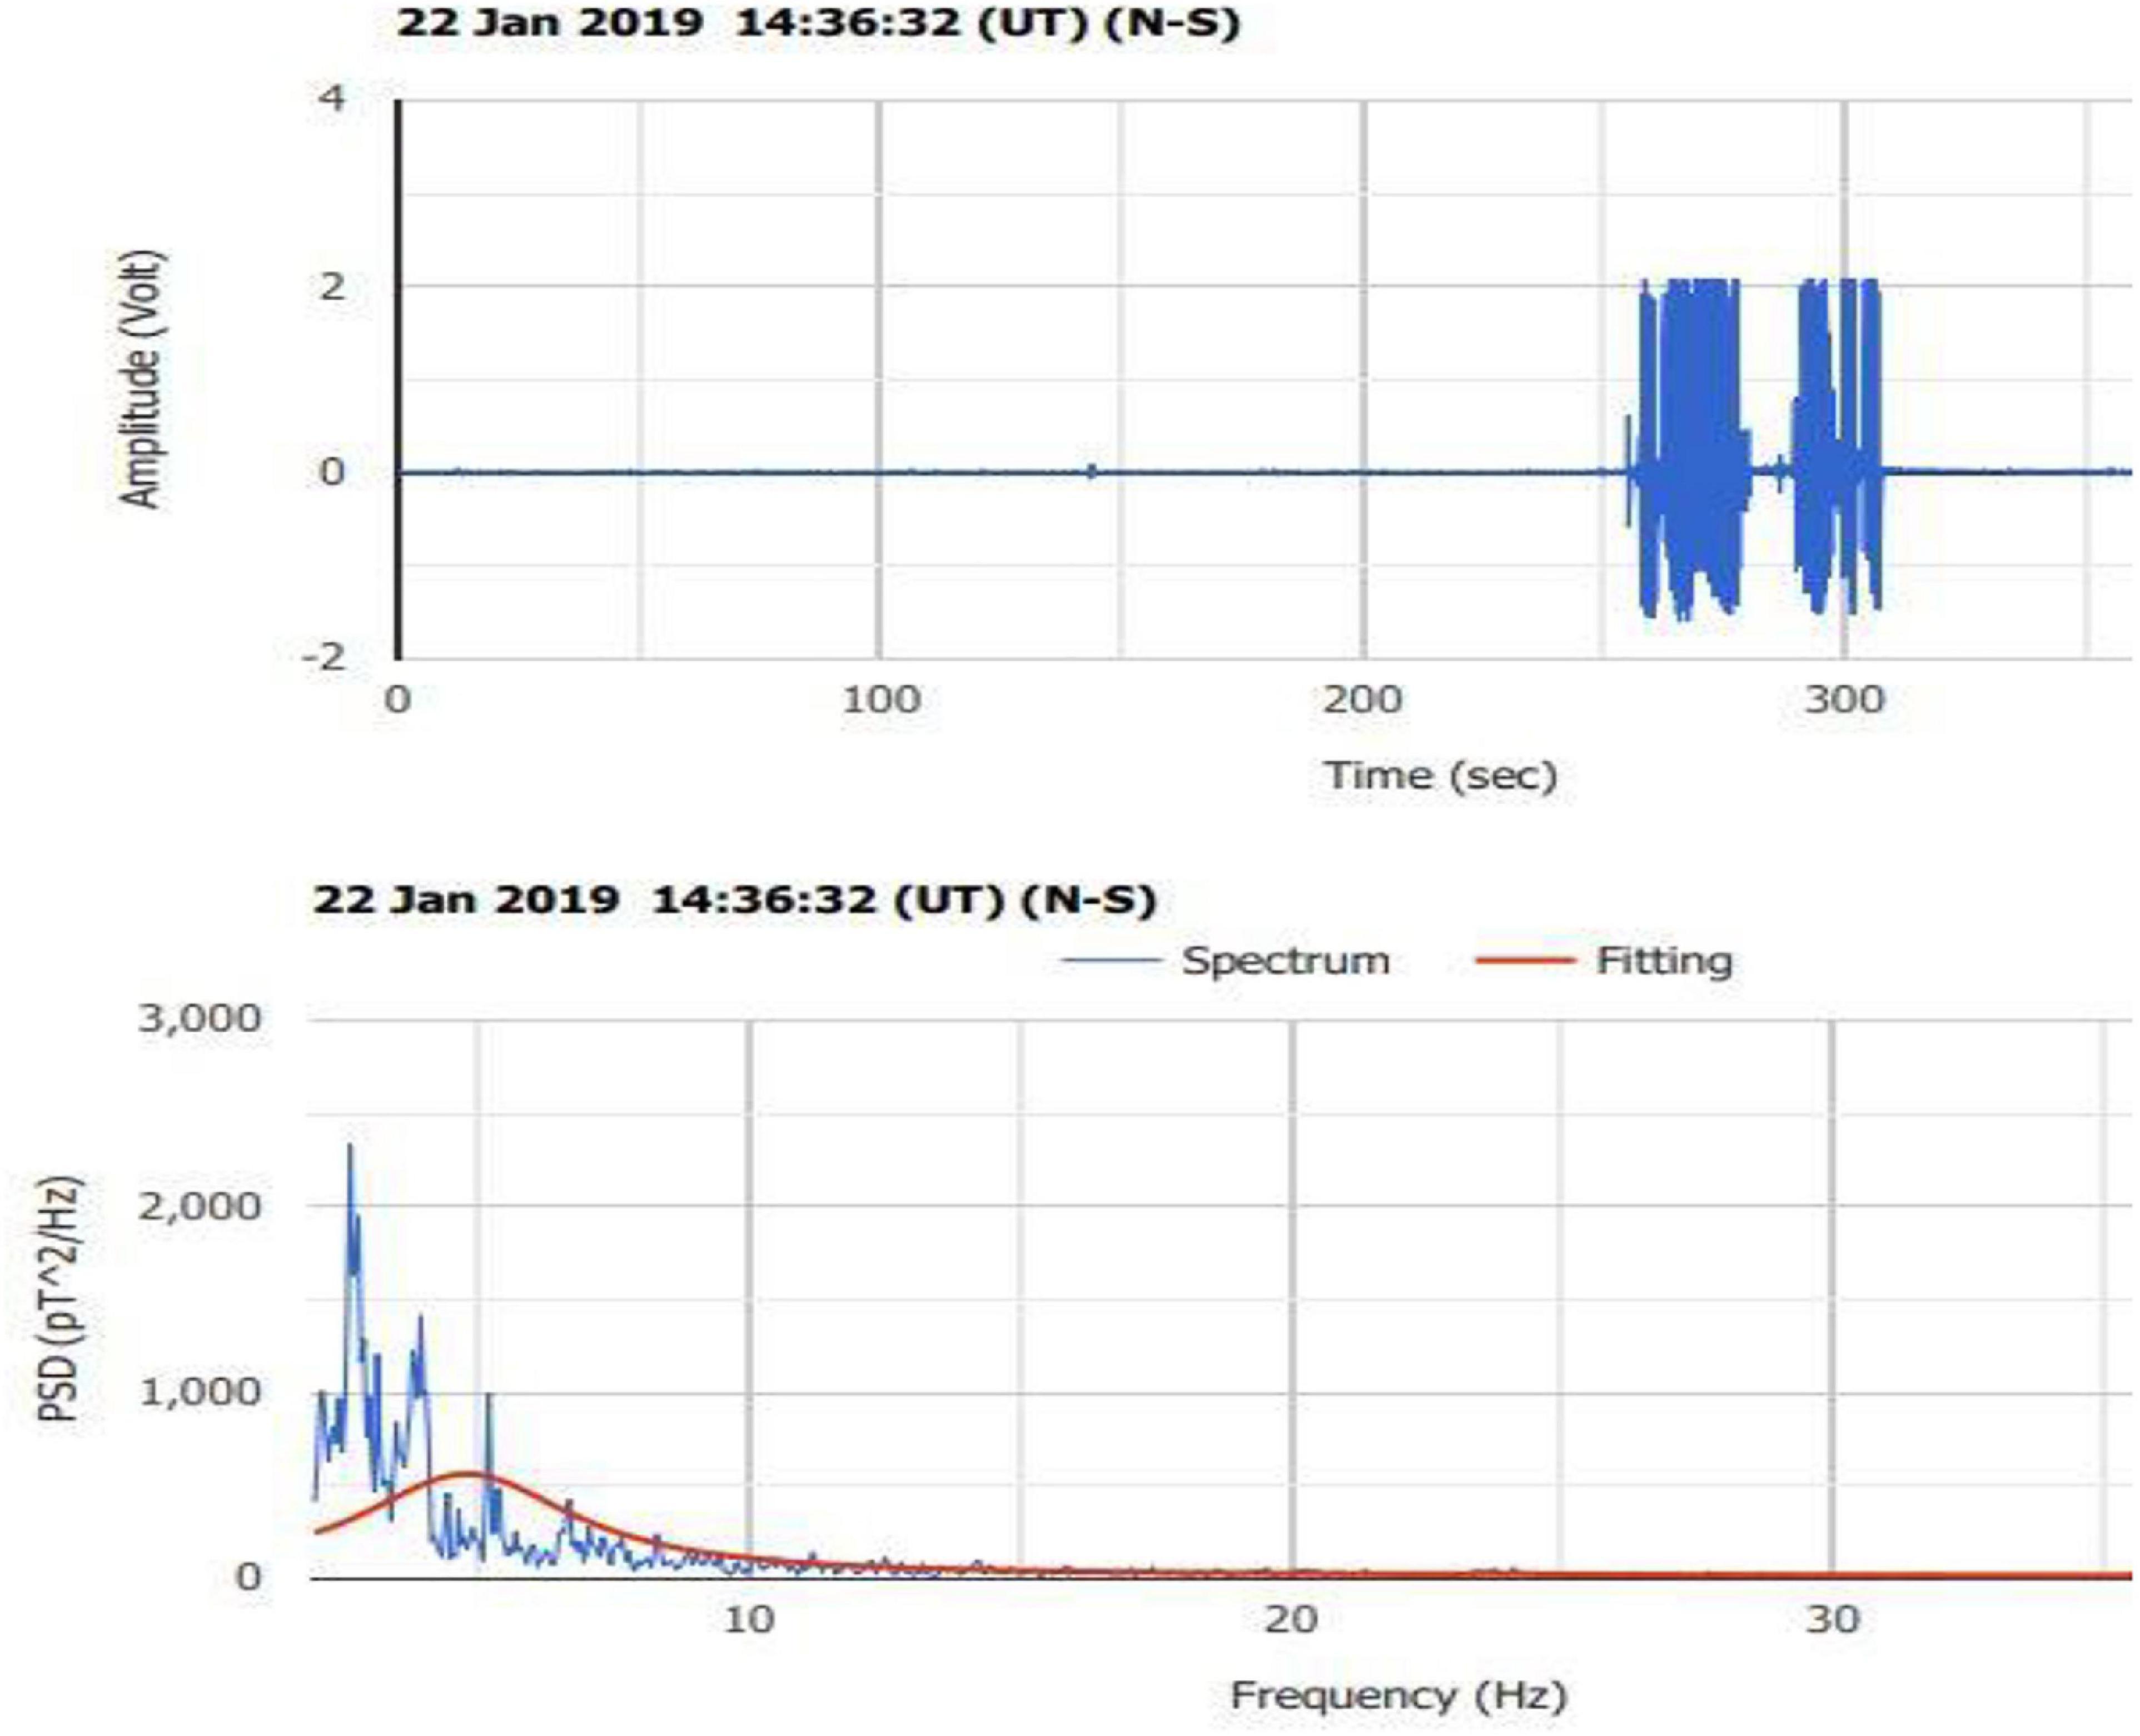
Figure 14. Additional vibration by hand.
Discussion
The main benefit gained from the above tests is that the most important and at the same time the most difficult action is to select the proper location for the establishment of an SR observation site. We confirmed something already known, namely, that SR observation sites closer than 1–2 km away from urban areas are inadequate for the recording of good-quality data. In contrast, isolated sites as far away as possible from electromagnetic sources can provide very good quality data. However, two conflicting requirements arise from the above confirmation, which are hard to satisfy simultaneously. The first is that the station must be in a very isolated location as far as possible from anthropogenic activities, urban areas, transportation, and any electromagnetic source like electric power lines, antennas for mobile communication, windmill generators, etc. The above tests showed how sensitive SR signals are to all kinds of electrical and mechanical “noises.” The second requirement is safety. A station in an inhabited area without continuous safekeeping is an easy victim to people looking for valuable things or just metals sold by the kilo. The above conflicting requirements of isolation and safety introduce a series of risks which must be considered. One difficulty related to the isolation requirement is ease of access. A station located in an isolated place under the above requirements has, in most cases, difficult access, requires driving for several hours on sometimes dangerous country roads on the sides of mountains, etc. Uninterrupted access to an SR station is necessary because the batteries that provide energy need replacement every 1–2 months, while data stored in memory cards must be collected. Unfortunately, wanton vandalism prohibits the installation of, e.g., exterior solar panels to recharge the batteries, or radio antennas to transmit data in real time. Even the most isolated stations are often accessible by farmers and their agriculture machinery, trucks, hunters, picnickers, pilgrims who visit a nearby country chapel, and other types of visitors and passers-by.
Consequently, it is very important for the data quality of a certain observational site to track down anthropogenic or other “noises” created by animals, strong winds, electric induction on metallic objects, etc.
Conclusion
The main conclusion from this work is that SR recordings are very sensitive to parasitic noise caused from anthropogenic activities. Experience on recognizing dummy signals is necessary to reject and remove them from the raw data time series. From this point of view, it is necessary, due to different local physical conditions among sites, to generate templates of common anthropogenic incidental “noises” in each observational site. Nowadays, there is an effort to construct coils with proper filters that would allow to obtain measurements close to urban areas. If successful, this would be a serious advantage that will remove the necessity of establishing isolated stations on mountains and other hard to access locations. For the moment, however, the further the site from anthropogenic activities, the better the quality of the recorded data. The comparison of measurements taken on top of Mount Parnon and in the suburbs of Athens makes clear how important distance from urban areas is for the quality of SR data recordings. A last but not least conclusion coming from the above tests is the confirmation that movements of the coils, by any reason, do not simulate preseismic signals like in Figure 8 or signals described in previous publications (Christofilakis et al., 2019; Florios et al., 2019, 2020).
Data Availability Statement
The raw data supporting the conclusions of this article will be made available by the authors, without undue reservation.
Author Contributions
VT and CR made field experiments and data collection. IC and CF made the evaluation of data. GT, VC, and GB made hardware and software. All authors contributed to the article and approved the submitted version.
Conflict of Interest
The authors declare that the research was conducted in the absence of any commercial or financial relationships that could be construed as a potential conflict of interest.
Acknowledgments
We would like to thank the forest service of the Lakonia prefecture, in the town of Sparta, especially the director G. Zakkas and the forest personnel, K. Petrakos, K. Samartzis, N. Sourlis, and K. Tsagaroulis for their valuable contribution in the establishment and the service of our South Observation Site near the village of Vamvakou. We would also like to thank the residents and the ecclesiastical committee of the little town of Doliana in Northern Greece for offering the necessary accommodation needed for the establishment of our North Observation Site. Finally, we would like to address a warm thank you to the Mariolopoulos–Kanaginis Foundation for Environmental Research for its unending support of our activities.
References
Balser, M., and Wagner, C. (1960). Observations of earth–ionosphere cavity resonances. Nature 188, 638–641. doi: 10.1038/188638a0
Balser, M., and Wagner, C. A. (1962). Diurnal power variations of the Earth-ionosphere cavity modes and their relationship to worldwide thunderstorm activity. J. Geophys. Res. 67, 619–625. doi: 10.1029/JZ067i002p00619
Christofilakis, V., Tatsis, G., Votis, G., Contopoulos, I., Repapis, C., and Tritakis, V. (2019). Significant ELF perturbations in the schumann resonance band before and during a shallow mid-magnitude seismic activity in the Greek area (Kalpaki). J. Atmospheric Solar-Terrestrial Phys. 182, 138–146. doi: 10.1016/j.jastp.2018.11.009
Florios, K., Contopoulos, I., Christofilakis, V., Tatsis, G., Chronopoulos, S., Repapis, C., et al. (2019). Pre-seismic electromagnetic perturbations in two earthquakes in northern greece. Pure Appl. Geophys. 177, 787–799. doi: 10.1007/s00024-019-02362-6
Florios, K., Contopoulos, I., Tatsis, G., Christofilakis, V., Chronopoulos, S., Repapis, C., et al. (2020). Possible earthquake forecasting in a narrow space-time-magnitude window. Earth Sci. Inform. 14, 349–364. doi: 10.1007/s12145-020-00535-9
Hayakawa, M., and Molchanov, O. A. (2007). eismo-Electromagnetics as a new field of Radiophysics: electromagnetic phenomena associated with earthquakes. U.R.S.I. Radio Sci. Bull. 320, 8–17.
Hayakawa, M., Nickolaenko, A. P., Sekiguchi, M., Yamashita, K., Ida, Y., and Yano, M. (2008). Anomalous ELF phenomena in the Schumann resonance band as observed at Moshiri (Japan) in possible association with an earthquake in Taiwan. Nat. Hazards Earth Syst. Sci. 8, 1309–1316. doi: 10.5194/nhess-8-1309-2008
Hayakawa, M., Ohta, K., Nickolaenko, A. P., and Ando, Y. (2005). Anomalous effect in Schumann resonance phenomena observed in Japan, possibly associated with the Chi-chi earthquake in Taiwan. Annales Geophys. 23, 1335–1346. doi: 10.5194/angeo-23-1335-2005
Nastos, P. T., Matsangouras, I. T., and Chronis, T. G. (2014). Spatio-temporal analysis of lightning activity over Greece — Preliminary results derived from the recent state precision lightning network. Atmospheric Res. 144, 207–217. doi: 10.1016/j.atmosres.2013.10.021
Ohta, K., Izutsu, J., and Hayakawa, M. (2009). Anomalous excitation of Schumann resonances and additional anomalous resonances before the 2004 Mid-Niigata prefecture earthquake and the 2007 Noto Hantou Earthquake. Phys. Chem. Earth Parts A/B/C 34, 441–448. doi: 10.1016/j.pce.2008.07.008
Petraki, E., Nikolopoulos, D., Nomicos, C., Stonham, J., Cantzos, D., Yannakopoulos, P., et al. (2015). Electromagnetic pre-earthquake precursors: mechanisms, data and models -a review. Earth Sci. Climate Change 6:1000250.
Proestakis, E., Kazadzis, S., Lagouvardos, K., Kotroni, V., and Kazantzidis, A. (2016). Lightning activity and aerosols in the Mediterranean region. Atmospheric Res. 170, 66–75. doi: 10.1016/j.atmosres.2015.11.010
Pulinets, S., and Ouzounov, D. (2016). “Earthquake precursors in atmosphere and ionosphere. A review and future prospects,” in Geophysical Research conference Abstracts, 18. 2016 EGU General Assembly. (Vienna: Chapman University).
Schumann, W. O. (1952). On the free oscillations of a conducting sphere which is surrounded by an air layer and an ionosphere shell. Z. Naturforschaftung 7A, 149–154.
Sekiguchi, M., Hayakawa, M., Nickolaenko, A. P., and Hobara, Y. (2006). Evidence on a link between the intensity of Schumann resonance and global surface temperature. Annales Geophys. 24, 1809–1817. doi: 10.5194/angeo-24-1809-2006
Tatsis, G., Christofilakis, V., Chronopoulos, S. K., Kostarakis, P., Nistazakis, H. E., Repapis, C., et al. (2020b). Design and implementation of a test fixture for elf schumann resonance magnetic antenna receiver and magnetic permeability measurements. Electronics 9:171. doi: 10.3390/electronics9010171
Tatsis, G., Christofilakis, V., Chronopoulos, S. K., Baldoumas, G., Sakkas, A., Paschalidou, A. K., et al. (2020a). Study of the variations in the Schumann resonances parameters measured in a Southern Mediterranean environment. Sci. Tot. Env. 715:136926. doi: 10.1016/j.scitotenv.2020.136926
Tatsis, G., Votis, C., Christofilakis, V., Kostarakis, P., Tritakis, V., and Repapis, C. (2015). A prototype data acquisition and processing system for Schumann resonance measurements. J. Atmospheric Solar-Terrestrial Phys. 135, 152–160. doi: 10.1016/j.jastp.2015.11.001
Tatsis, G., Votis, C., Christofilakis, V., Kostarakis, P., Tritakis, V., Repapis, C., et al. (2016). Preliminary measurements of Schumann’s Resonances (SR) in the Greek. J. Eng. Sci. Technol. Rev. 9, 61–64.
Votis, C. I., Tatsis, G., Christofilakis, V., Chronopoulos, S. K., Kostarakis, P., Tritakis, V., et al. (2018). A new portable ELF Schumann resonance receiver: design and detailed analysis of the antenna and the analog front-end. J. Wireless Com. Netw. 2018:155.
Williams, E. (1992). The schumann resonance: a global tropical thermometer. Science 256, 1184–1187. doi: 10.1126/science.256.5060.1184
Williams, E. (2005). Lightning, and climate: a review. Atmospheric Res. 76, 272–287. doi: 10.1016/j.atmosres.2004.11.014
Keywords: Schumann resonance, ELF, anthropogenic impacts, quality of data, track down of ELF noises
Citation: Tritakis V, Contopoulos I, Florios C, Tatsis G, Christofilakis V, Baldoumas G and Repapis C (2021) Anthropogenic Noise and Its Footprint on ELF Schumann Resonance Recordings. Front. Earth Sci. 9:646277. doi: 10.3389/feart.2021.646277
Received: 25 December 2020; Accepted: 24 February 2021;
Published: 10 June 2021.
Edited by:
Konstantinos Kourtidis, Democritus University of Thrace, GreeceReviewed by:
Tamás Bozóki, Geodetic and Geophysical Institute (MTA), HungaryJanusz Mlynarczyk, AGH University of Science and Technology, Poland
Copyright © 2021 Tritakis, Contopoulos, Florios, Tatsis, Christofilakis, Baldoumas and Repapis. This is an open-access article distributed under the terms of the Creative Commons Attribution License (CC BY). The use, distribution or reproduction in other forums is permitted, provided the original author(s) and the copyright owner(s) are credited and that the original publication in this journal is cited, in accordance with accepted academic practice. No use, distribution or reproduction is permitted which does not comply with these terms.
*Correspondence: V. Tritakis, dmFzc29zNDRAZ21haWwuY29t