 Jianbo Wang
 Huan Xu
 Lei Yang
 Qingjun Song5
- 1Jiangsu Key Laboratory of Marine Bioresources and Environment/Jiangsu Key Laboratory of Marine Biotechnology, Jiangsu Ocean University, Lianyungang, China
- 2School of Marine Technology and Geomatics/Ocean Remote Sensing Big Data Applications Center, Jiangsu Ocean University, Lianyungang, China
- 3Co-Innovation Center of Jiangsu Marine Bio-industry Technology, Jiangsu Ocean University, Lianyungang, China
- 4Marine Survey Research Center, First Institute of Oceanography, Ministry of Natural Resources, Qingdao, China
- 5National Satellite Ocean Application Service, Beijing, China
In 2018, the Haiyang-2B (HY-2B) satellite altimeter was sent to orbit as a follow-up mission of the HY-2A satellite altimeter. The performance of the HY-2B system over the global oceans is considered to be critical. However, its performance is not fully known at the present time. In the present study, the first global quality assessment of the HY-2B Geophysical Data Record (GDR) was presented using comparison and crossover analysis processes of the main parameters and sea level anomalies (SLAs) with Jason-3 GDR data. This study’s assessment results demonstrated that the editing proportion of unqualified data for the HY-2B was 2.67%, which was at a similar level as the Jason-3 (2.86%). In addition, this study’s assessment results of the HY-2B key parameters (mainly the backscatter coefficients, significant wave heights, sea state bias, wet troposphere delays, and ionosphere delays) showed good agreement with the Jason-3, and there were no abnormal trends observed. The mean and standard deviations (STDs) were determined to be (0.21 ± 6.70) cm and (−3.4 ± 6.25) cm for the SLA differences at the self-crossover points of the HY-2B and dual-crossover points between the HY-2B and Jason-3 satellites, respectively. In addition, the SLA crossover analysis results indicated that the accuracy of the sea surface heights for the HY-2B was close to that of the Jason-3 satellite. The spatial distributions of the SLA differences showed no significant errors in the geographic characteristics. The SLA measurements were assessed using a wavenumber spectra method. The obtained results suggested that the power spectrum of the SLAs of the HY-2B satellite followed the regular patterns of the traditional Jason-3 altimeter. Furthermore, based on the spectrum analysis results, it was revealed that the noise level of the HY-2B was lower than that of the Jason-3, indicating a good overall performance of the HY-2B.
Introduction
Satellite altimeters have been providing global sea surface height (SSH) measurements since the 1970s, which has greatly improved oceanography, geodesy, and polar scientific knowledge, as well as many other Earth sciences (Chelton et al., 2001; Yang et al., 2020; Yuan et al., 2020). In 2011, China launched the Haiyang-2A (HY-2A), which was the first satellite altimeter of the Chinese Marine Dynamic Environment Satellite series (Lin and Jiang, 2014; Mertikas et al., 2015b). The Haiyang-2B (HY-2B) satellite altimeter was launched in 2018 as a follow-up to the HY-2A. The HY-2A satellite altimeter was sent to nearly the same orbit as HY-2A in order to fulfill an oceanographic mission (Jiang C. F. et al., 2019). In the near future, more satellite altimeters will be launched by China as follow-ups to the HY-2A. As a result, given the satellite series-specific orbits and hardware designs, a satellite altimetric network will be formed, which will be a major contribution to the oceanic altimetry community (Lin and Jiang, 2014).
Calibration and validation (cal/val) activities are the key processes for detecting any biases and trends in satellite observations. The results ensure the long-term consistency and continuity of measurements obtained from different missions (Chelton et al., 2001; Fu and Haines, 2013). At the present time, there are two commonly used cal/val methods: absolute calibrations by dedicated sites and cross-calibrations between different satellite altimeters. The absolute calibrations of the SSHs are based on four principal long-running sites around the world (Christensen et al., 1995; Bonnefond et al., 2003; Watson et al., 2003; Mertikas et al., 2015a), as well as other auxiliary sites operated by academic institutes or universities (Crétaux et al., 2008; Babu et al., 2015; Yang et al., 2017). All of the calibration results of these sites provide valuable SSHs bias for the satellite altimeters. However, the maintenance of these dedicated sites requires continuous economic cost and logistic resources. In addition, the dedicated sites do not have the abilities to reveal the global statistic performance results of satellite altimetric measurements. Alternatively, the cross-calibration approaches based on crossover analysis methods have the potential to provide a global view of the system’s performances and offer important complementary resources for the absolute calibrations at individual sites (Ablain et al., 2010; Dettmering and Bosch, 2010; Dettmering et al., 2015; Prandi et al., 2015; Passaro et al., 2016; Yang et al., 2019). Following the release of the Chinese HY-2A data, the cross-calibrations with the Jason-2 satellite altimeter were successfully carried out. The performance of the HY-2A altimetry system was assessed (Bao et al., 2015; Yang et al., 2016), which improved the reprocessing of the HY-2A data and further enhanced the data quality. However, the cross-calibrations of the HY-2B GDR data have still not been reported since the data were released last year (2019). Therefore, although the knowledge of the performance level of the new Chinese satellite altimeter system over the global oceans is critical, it is not fully known at the present time.
The focus of this study was to provide the first exhaustive quality assessment of the HY-2B mission data. The assessment was performed using a global analysis of the HY-2B main parameters and SLAs at self-crossover points and the dual-crossover points with the Jason-3 satellite. This study’s layout is as follows: section “Introduction” includes this study’s introduction; section “Data and Methods” provides descriptions of the HY-2B and Jason-3 altimeter data and the methods used in this study; section “Missing and Edited Measurements” details the missing and edited measurements of the HY-2B and Jason-3 missions; section “Analysis of the Main Parameters” highlights the HY-2B satellite’s main parameter data and daily mean analysis results; section “SLA Analysis” provides the SLAs analysis results from the HY-2B satellite, including the analysis of the daily mean SLAs, analysis of SLA differences at the self-crossover and dual-crossover points with Jason-3 satellite, and the wave-number spectra analysis of the SLAs from both the HY-2B and Jason-3 satellites; section “Results and Discussion” is the study’s discussion; and this study’s conclusions are summarized in the section “Conclusions.”
Data and Methods
HY-2B Altimetric GDR Data
The HY-2B satellite was successfully launched in October 25, 2018 as the successor to the HY-2A satellite, which had shifted to a geodetic orbit in 2016, and ceased operation as of June 10, 2020. The HY-2B satellite carries three main microwave instruments on board, including a nadir-looking altimeter, scanning microwave radiometer, and the microwave scatter-o-meter. The HY-2B altimetric instrument is a dual-frequency (Ku- and C-bands) nadir-looking radar altimeter, which has the ability to provide the range data between the Earth’s surface and the satellite. The radiometer also provides wet tropospheric corrections for the range measurements. Since the microwave scatter-o-meter measures the ocean winds and wave fields and has no connection with the altimeter, it was not discussed in this study. The HY-2B satellite has adopted a sun synchronous orbit at a height of 970 km and an inclination of 99.34°, which enables observations over high latitude areas as far as 81° N/S. The repeat cycle for the HY-2B satellite is 14 days, with a theoretical 386 tracks per cycle. The HY-2B level 2 products include Interim Geophysical Data Records (IGDR), Sensor Geophysical Data Records (SGDR), and Geophysical Data Records (GDR). The data versions are of “T,” “c,” and “d,” respectively. In addition, the data of the GDR version “c” from April 1, 2019 to September 14, 2020 (533 days) were used to assess the HY-2B altimetric data quality and accuracy levels. The GDR product included the raw 20-Hz altimetry data and the 1-Hz geophysical corrections. The Ku-band data, which is considered to be more accurate than the C-bands, were utilized in this study.
Jason-3 Satellite Altimeter Data
The Jason-3 satellite is an international cooperative satellite altimetry mission satellite that was cooperatively launched by the National Aeronautics and Space Administration (NASA), National Oceanic and Atmospheric Administration (NOAA), European Organization for the Exploitation of Meteorological Satellites (EUMETSAT), and Center National d’Etudes Spatiales (CNES; Yang et al., 2019). Since the Jason-3 data have been widely validated and calibrated, it was adopted as the comparison data set for the new HY-2B data in the current research investigation. In order to carry out an accurate assessment between the two different satellite altimeters, the used Jason-3 GDR data (cycles 115–169) are from the same time span as the examined HY-2B data in this study.
Experimental Methods
This study’s global statistical assessment of the HY-2B satellite’s performance was conducted by monitoring the main parameters and SLAs through a detailed comparison with the Jason-3 satellite’s data. The main parameters examined in this study included the backscattering coefficients (Sigma0), significant wave heights (SWH), sea state bias (SSB), wet tropospheric corrections, and the ionospheric corrections. The parameter analysis mainly included data availability, accuracy, and stability. The accuracy of the SSHs, which is considered to be the most important measurements, was assessed using the crossover differences and the wavenumber spectra of the SLAs between the HY-2B and Jason-3 satellites. The SLA was computed using the following equations (Yang et al., 2019):
where HO represents the altitude of the satellite orbit; R is the altimeter ranging value; and ΣCorr is the sum of corrections, including the dry tropospheric corrections, wet tropospheric corrections, ionospheric corrections, SSB corrections, ocean tides, solid earth tides, polar tides, and adverse atmospheric pressure levels; HSSH is the sea surface height; and HMSS means mean sea surface height.
The availability of the altimeter’s main parameters was assessed through the analysis of the lost track numbers and a comparison of the main parameter editing proportions of the HY-2B and Jason-3 altimeters. Table 1 details this study’s comparison of the main correction standards, which were applied to the SSHs (SLAs) for the HY-2B and Jason-3 satellites. The majority of the geophysical corrections was found to be similar between the HY-2B and the Jason-3, with the exception of the dry tropospheric corrections and inverse barometer corrections, which had adopted different weather models. The editing criteria (Watson et al., 2003) for the HY-2B and Jason-3 satellites had been recommended by the National Ocean Satellite Application Service (NSOAS, China) and CNES (France) (Bao et al., 2015). The data that had not met the constraint criteria were filtered out, and the data editing proportions were calculated by counting the filtered data with respect to the total data. In other words, the lower the editing proportion was, the better the satellite’s mission performance would be.
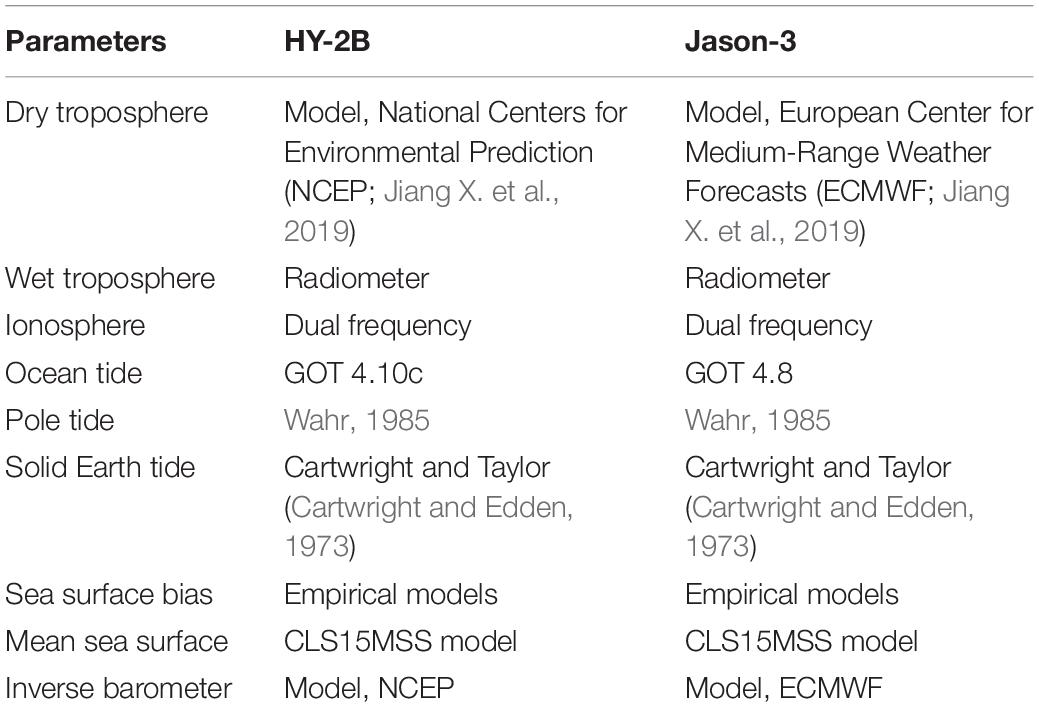
Table 1. Main geophysical correction standards applied to sea surface heights (SSHs) [sea level anomalies (SLAs)] for the HY-2B and Jason-3 satellite altimeters.
In addition, this study calculated the daily mean values of the main HY-2B altimeter parameters and the SLA differences at the self-crossover points of the intrinsic mono-mission of the HY-2B, as well as at the dual-crossover points between the HY-2B and Jason-3 mission, in order to assess the mission performance level. The self-crossover points were estimated using the ascending and descending tracks within the same cycle. The dual-crossovers between the HY-2B and Jason-3 satellites were calculated using tracks within the same time span. This study’s spatial distribution sketch map of the cross-points is shown in Figure 1. In order to reduce the impacts of the temporal variations in the marine environments in the crossover analysis, the altimetric data were compared with time differences less than 3 days. In addition, in order to obtain reliable results in the crossover analysis, the editing of the parameters using the established editing criteria (Bao et al., 2015) were conducted in the ocean areas between the latitude bounds of ±50° for all of the altimetry missions and in a bathymetry ≤−1,000 m in the ocean areas.
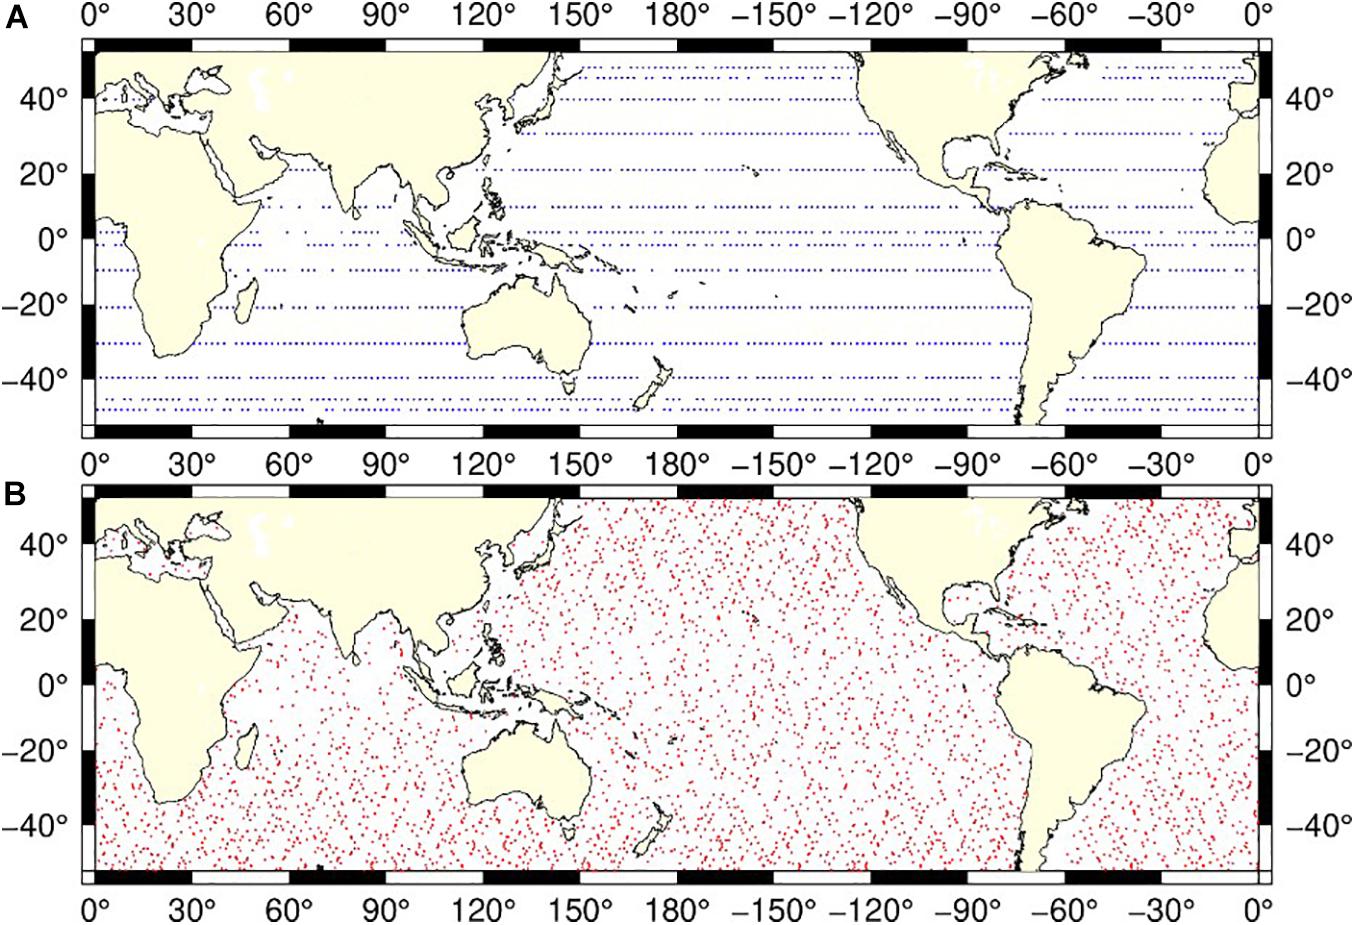
Figure 1. The spatial distribution sketch map of crossover points for (A) self-crossover points of HY-2B (blue) and (B) dual-crossover points between HY-2B and Jason-3 (red).
This study adopted a wavenumber spectrum for assessing the HY-2B system’s performance in regard to the SSH measurements. This wavenumber spectrum, presented as the power spectrum density in cycles per unit distance, was able to accurately reflect the internal structures of the oceans’ dynamic signals. Subsequently, using the aforementioned spectrum, the system noise of the altimeters could also be assessed. In this study, the wavenumber spectrum of the SLAs along the HY-2B and Jason-3 satellite tracks was determined using a Fast Fourier Transform (FFT) method.
Missing and Edited Measurements
In order to assess the data availability of the HY-2B satellite’s main parameters, this study first calculated the number of lost tracks per cycle, and then the average of the number of the 20 Hz range measurements, and the average of the root mean squares (RMS) of the 20-Hz range measurements (results shown in Figure 2). The integrity of the altimeter track data was considered to be one of the most important features of the data availability. The editing proportions of the main parameters were analyzed cycle by cycle. In addition, the main chosen parameters of the satellite altimeter data set were the range, SSB corrections, radiometer wet tropospheric corrections, dual-frequency ionospheric corrections, SWH, and the Sigma0. This was due to the fact that those parameters presented the primary parameters in the altimetry scientific community. The editing criteria proposed in the study conducted by Bao et al. (2015) were adopted in this study, and only the Ku-band parameters of the HY-2B and Jason-3 satellites were selected for examination.
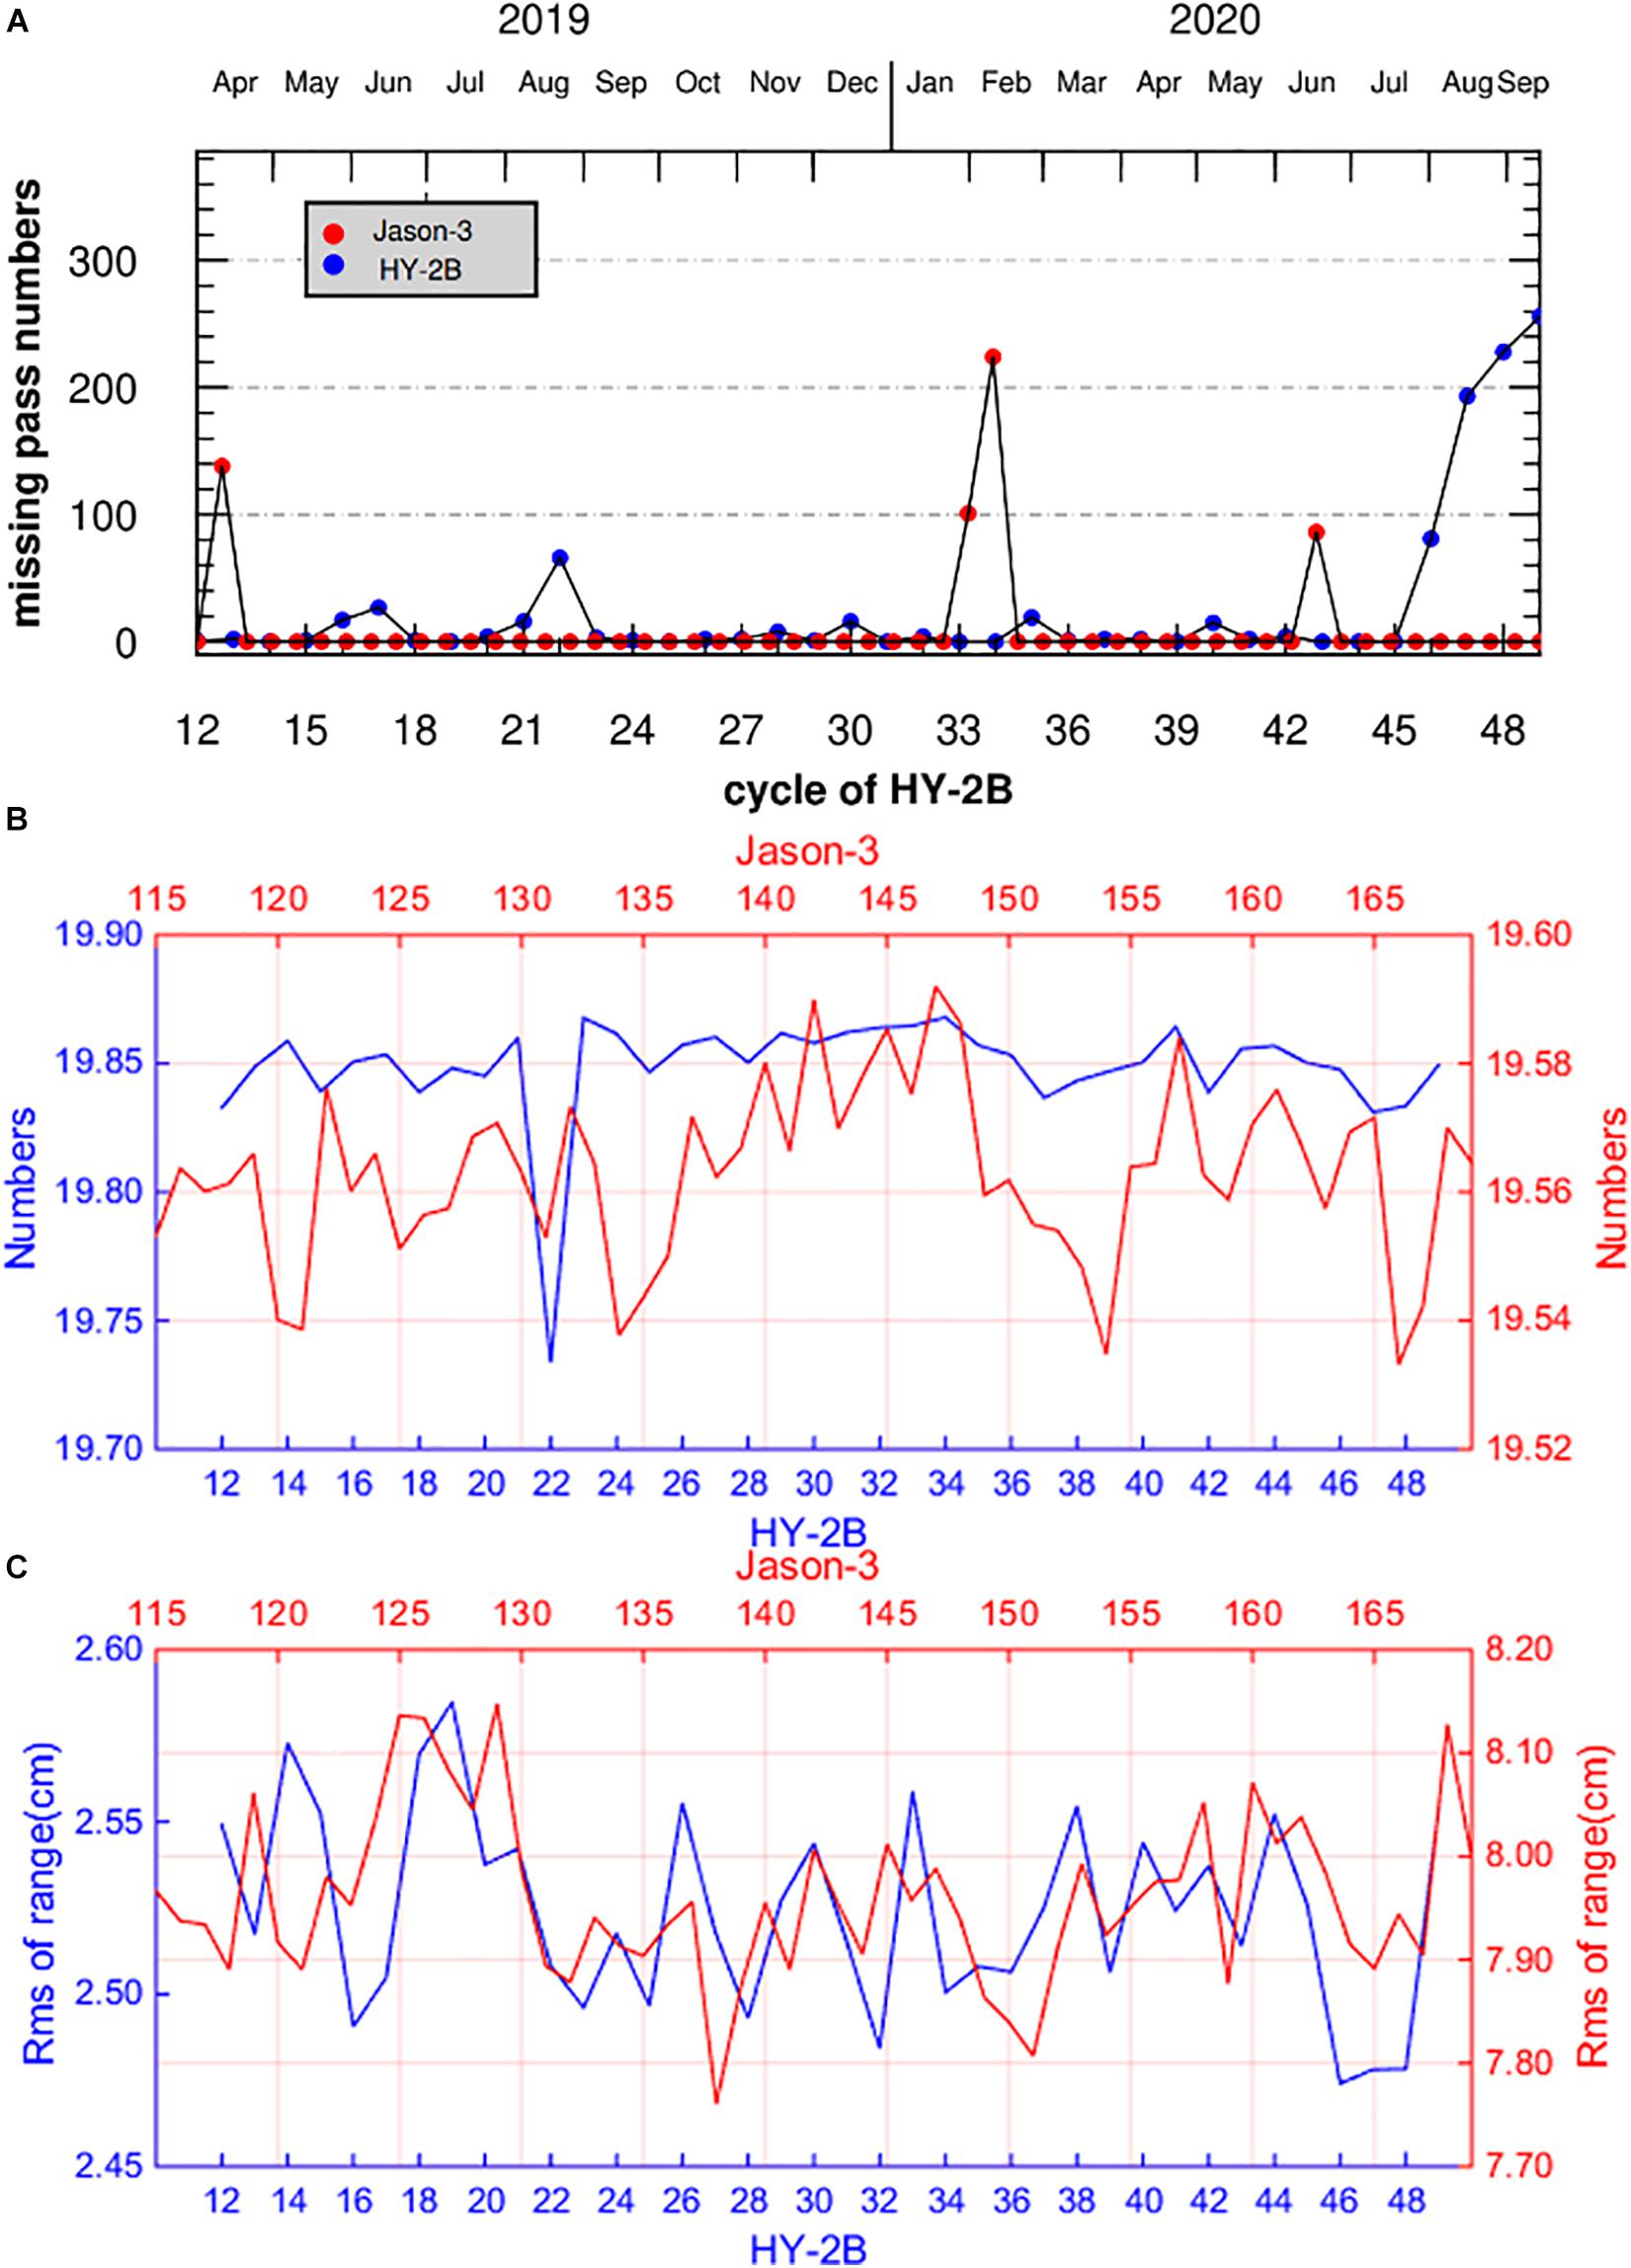
Figure 2. Missing and edited measurements for HY-2B mission (blue) from cycles 12 to 49 and Jason-3 mission (red) from cycles 115–169. Cycle by cycle of (A) the number of lost tracks, (B) the average of the qualified number, and (C) the average of root mean square (RMS) of 20 Hz range measurements.
Some of the satellite tracks may not be recorded due to such reasons as problems in the ground receiving stations or abnormal data transmissions (Zaouche et al., 2010) (especially during the processes of satellite mission mode adjustments). Figure 2A shows the lost passes for the HY-2B and Jason-3 missions. It can be seen in the figure that the HY-2B mission lost 17 passes during the 16th cycle, 27 tracks during the 17th cycle, 16 tracks during the 21st and 30th cycles, 66 tracks during the 22nd cycle, 19 tracks during the 35th cycle, 15 tracks during the 40th cycle, and 81, 193, 228, 256 tracks during 46th–49th cycles. However, major improvements were observed when compared to its predecessor HY-2A (Yang et al., 2016). With regard to the Jason-3 satellite, the tracks from pass 108 to pass 245 were found to be completely missing in the 116th cycle, which was attributed to changes in the safe hold mode (SHM) of the satellite (Michaud et al., 2019); due to SHM, there are only 153 passes in cycle 146, cycle 147 has only 31 passes, and 86 passes in cycle 160 are missing as detailed in Figure 2A.
The qualified number and RMS of the 20 Hz range measurements of the HY-2B satellite system was compared to those of the Jason-3 in order to analyze the performance of the high frequency range measurements. The statistical results for those two parameters are shown in Figures 2B,C. The numbers of the 20 Hz range measurements are indicators of the present data quality of the range measurements. The average of the qualified numbers of the 20-Hz range measurements were determined to range between 19.70 and 19.90 for the HY-2B mission and between 19.53 and 19.59 for the Jason-3 mission. These finding indicated that the high frequency data of the HY-2B and the Jason-3 were all of good quality. The RMS of the 20-Hz range measurements is a parameter that indicates the variability of the SSH over 20 points in 1 s. Since the 1-Hz SSH data were smoothed from the 20 Hz data, the lower the RMS of the 20-Hz data results was, the better the data quality for the 1-Hz data would be. The average of the RMS of 20 Hz range measurements was determined to be 2.52 cm in all of the cycles for the HY-2B, which was significantly smaller than that of the Jason-3 (7.96 cm).
As shown in Figure 3, based on the editing criteria in Bao et al. (2015), a time series of the editing proportions of the main parameters for HY-2B and Jason-3 was established. Figures 3A,B show the editing proportion of altimetry parameters over oceans for HY-2B and Jason-3; Figures 3C,D show the editing proportion of altimetry parameters in the ocean areas with water depths (≤−1,000 m) and latitude bounds (±50°) constraints for HY-2B and Jason-3. The statistical results are presented in Tables 2A,B. The results, shown in Figures 3A,B and Table 2A, demonstrated that the HY-2B satellite’s average editing proportions over oceans for the parameters of wet tropospheric corrections, ionospheric corrections, and SWH were stable and <0.4%. The largest HY-2B editing proportion was due to the SSB corrections, which were determined to be 3.18% on average. The Jason-3 editing proportions of the ionospheric corrections, SWH, and SSB corrections over oceans were determined to be <0.6%. The variations in the Jason-3 editing proportions for all of the parameters were observed to be <3%, with the exception of the wet tropospheric corrections (4.52%). However, it was found that from this study’s comparison results that the editing proportions of the wet tropospheric corrections were significantly smaller for the HY-2B (2.98 × 10⁻²%) when compared with the Jason-3 (2.36%). This suggested that the performance of the HY-2B satellite’s radiometer may have displayed a superior performance in that regard. To be more specific, the ocean depths and latitudes were constrained in order to obtain better data quality. This was due to the fact that satellite altimeters tend to have high data editing proportions in shallow water and high-latitude areas as a result of the influences of ocean dynamic environments near the shore and over the high latitude seas. Figures 3C,D and Table 2B show that the editing proportions of the HY-2B and Jason-3 satellites had decreased significantly when the constrained data over the deep ocean areas (bathymetry ≤−1,000 m) and between the latitude bounds of ±50° were the focus.
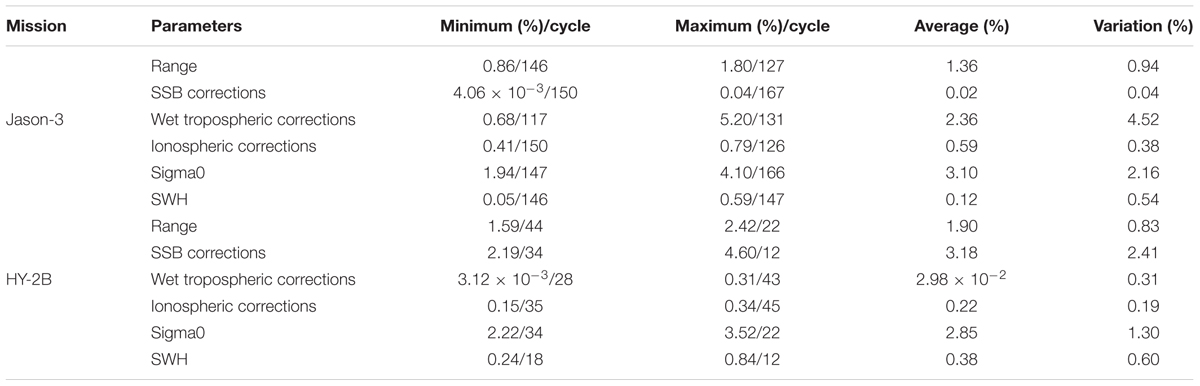
Table 2A. Statistics of the editing proportions of the altimetry parameters for the HY-2B and Jason-3 satellite altimeters over the global oceans.
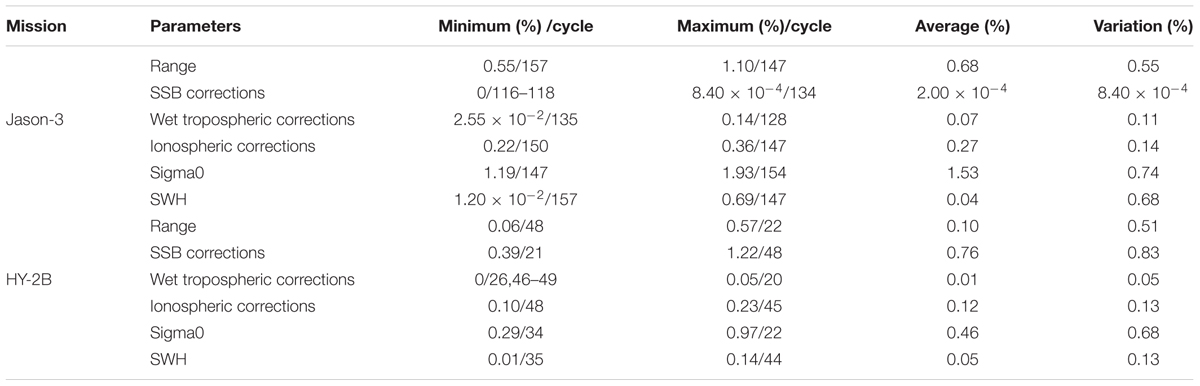
Table 2B. Statistics of the editing proportions of the altimetry parameters for the HY-2B and Jason-3 satellite altimeters with water depths (≤−1,000 m) and latitude bounds (±50°) constraints.
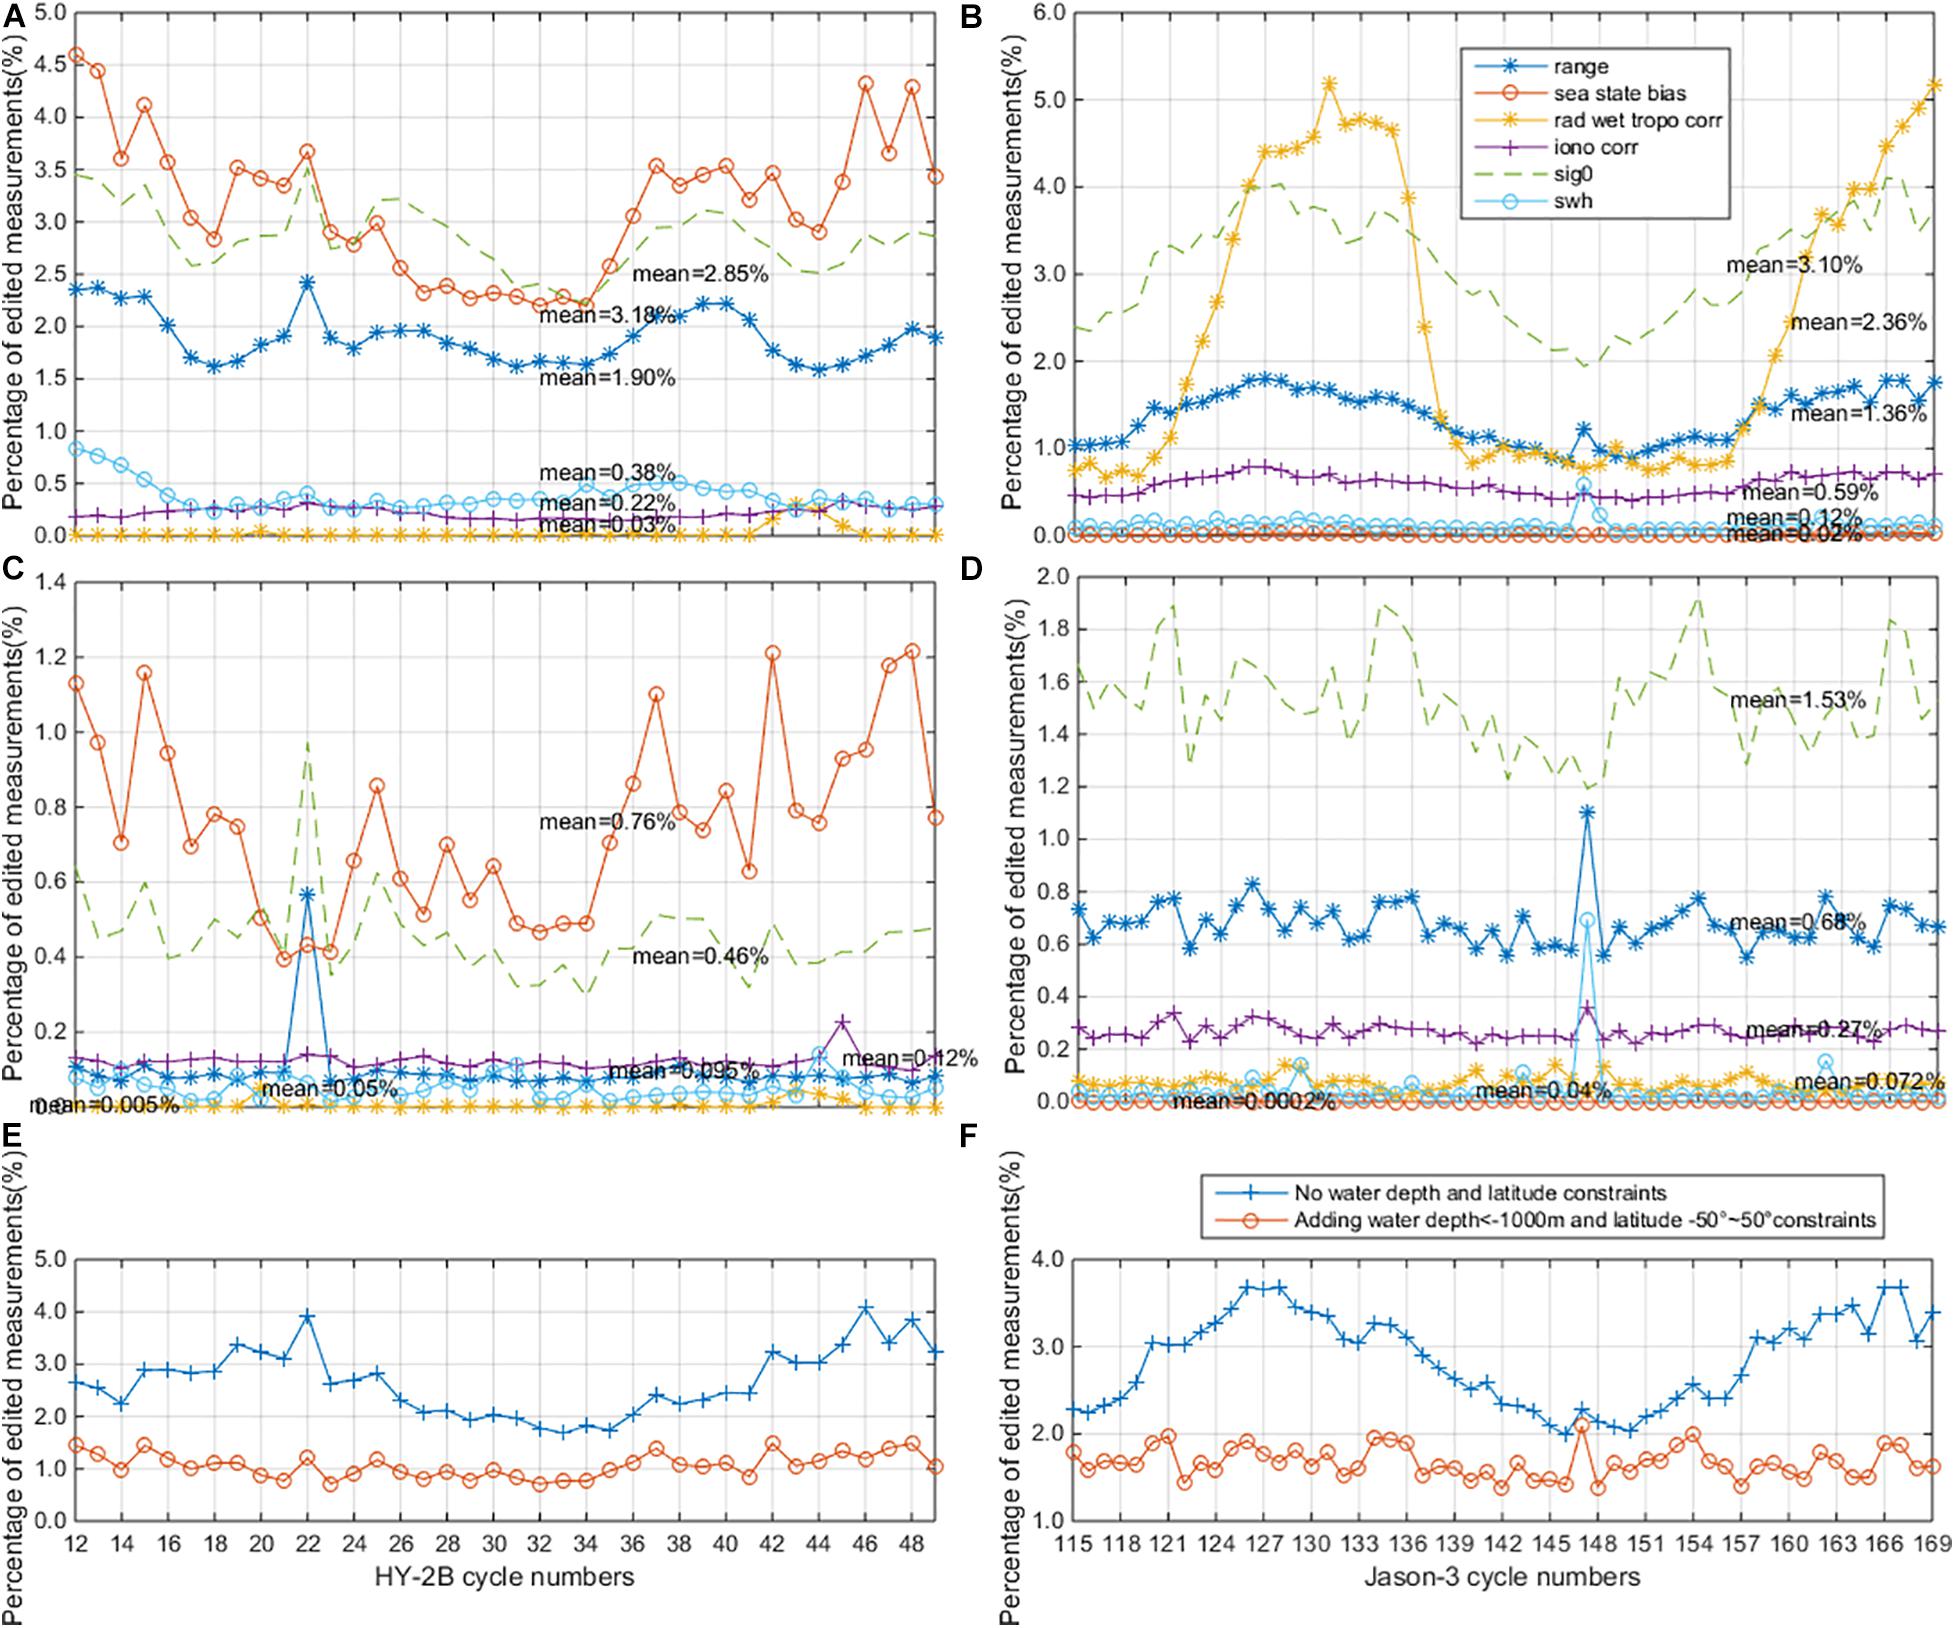
Figure 3. Panels (A,B) are the editing proportion of altimetry parameters over oceans, in which Panel (A) is HY-2B and Panel (B) is Jason-3; Panels (C,D) are the editing proportion of altimetry parameters with water depths (≤−1,000 m) and latitude bounds (±50°) constraints, in which Panel (C) is HY-2B and Panel (D) is Jason-3; Panels (E,F) are the editing proportion of altimetry data constraints by the editing criteria of total parameters in Bao et al. (2015), in which Panel (E) is HY-2B and Panel (F) is Jason-3.
Generally speaking, altimetric data editing is performed through a combination of all the key parameters. Therefore, this study estimated the editing proportions by considering all of the parameters, as well as taking the impacts of the ocean depths and latitudes into consideration, and the results are shown in Table 3 and Figures 3E,F. The results indicated that the editing proportions of the HY-2B and Jason-3 satellites had decreased significantly when the constrained data over the deep ocean areas (bathymetry ≤−1,000 m) and between the latitude bounds of ±50° were the focus. The average editing proportions for all the cycles were determined to be 2.86 and 1.67% for the Jason-3 mission and 2.67 and 1.07% for the HY-2B mission, with respect to no water depths and latitude constraints and water depths and between the latitude bounds of ±50° constraints. The data availability analysis results demonstrated that the HY-2B satellite mission had achieved a good performance levels similar to that of the Jason-3 satellite.
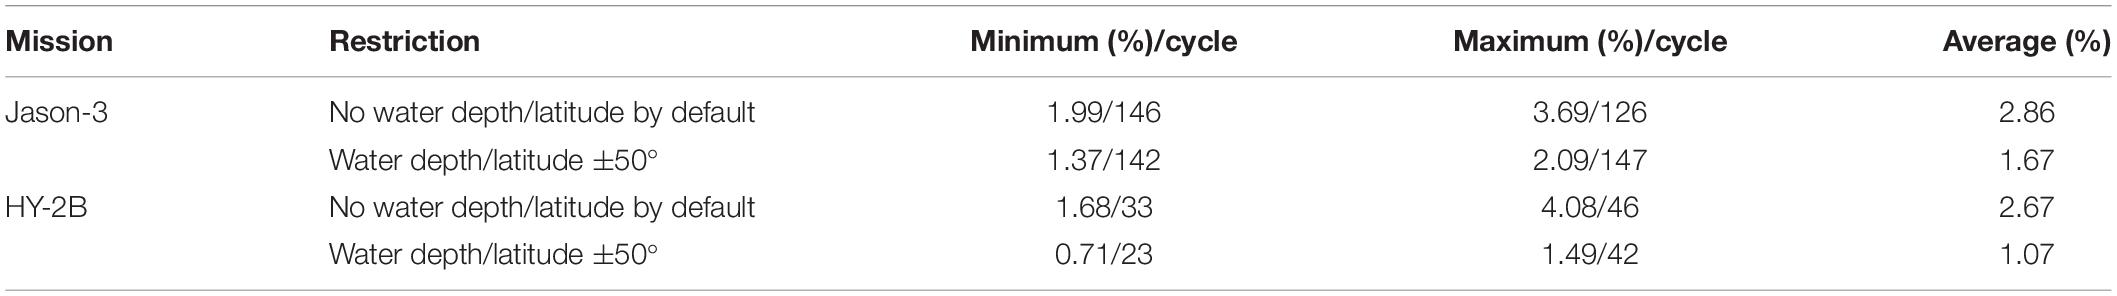
Table 3. Statistics of the editing proportions using the criteria of the total parameter constraints for the HY-2B and Jason-3 satellite altimeters.
Analysis of the Main Parameters
The daily mean values of the main altimeter parameters for the HY-2B and Jason-3 mission were calculated and compared in this study. The statistics of the correlation coefficients and the differences in the daily mean main altimeter parameters data series between the HY-2B and Jason-3 satellites are shown in Table 4. Figure 4 shows the results of the comparison of the daily mean of Sigma0, SWH, and SSB for the HY-2B and Jason-3 missions.
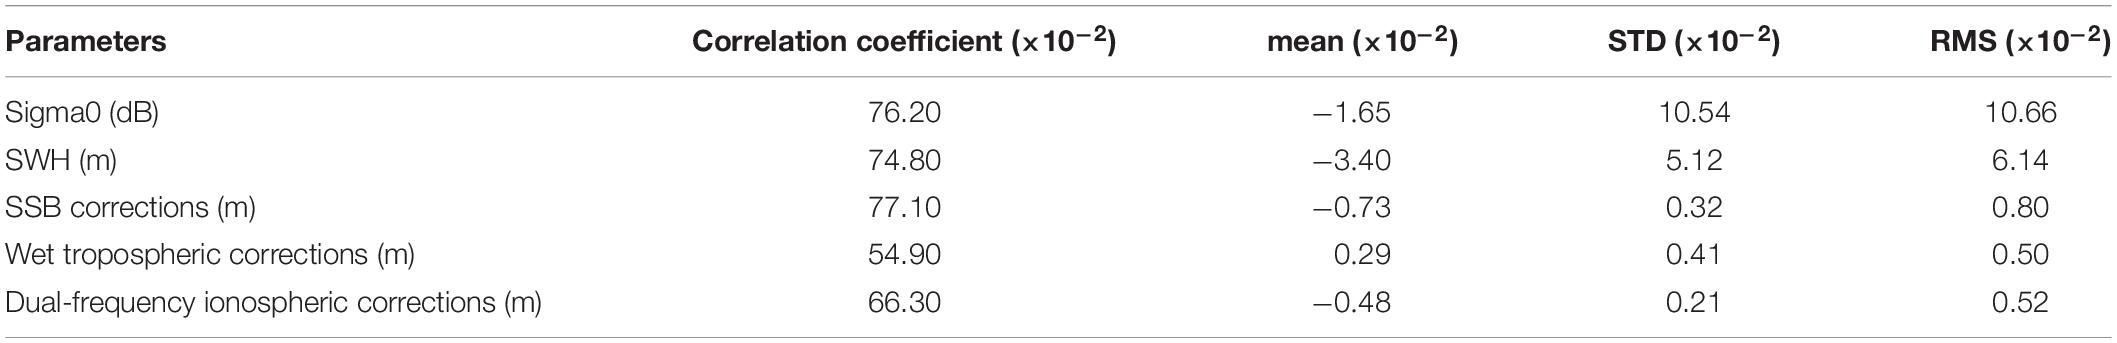
Table 4. Correlation coefficient (Pearson) and difference statistics between the daily mean data series of the main parameters of the HY-2B and Jason-3 satellite altimeters.
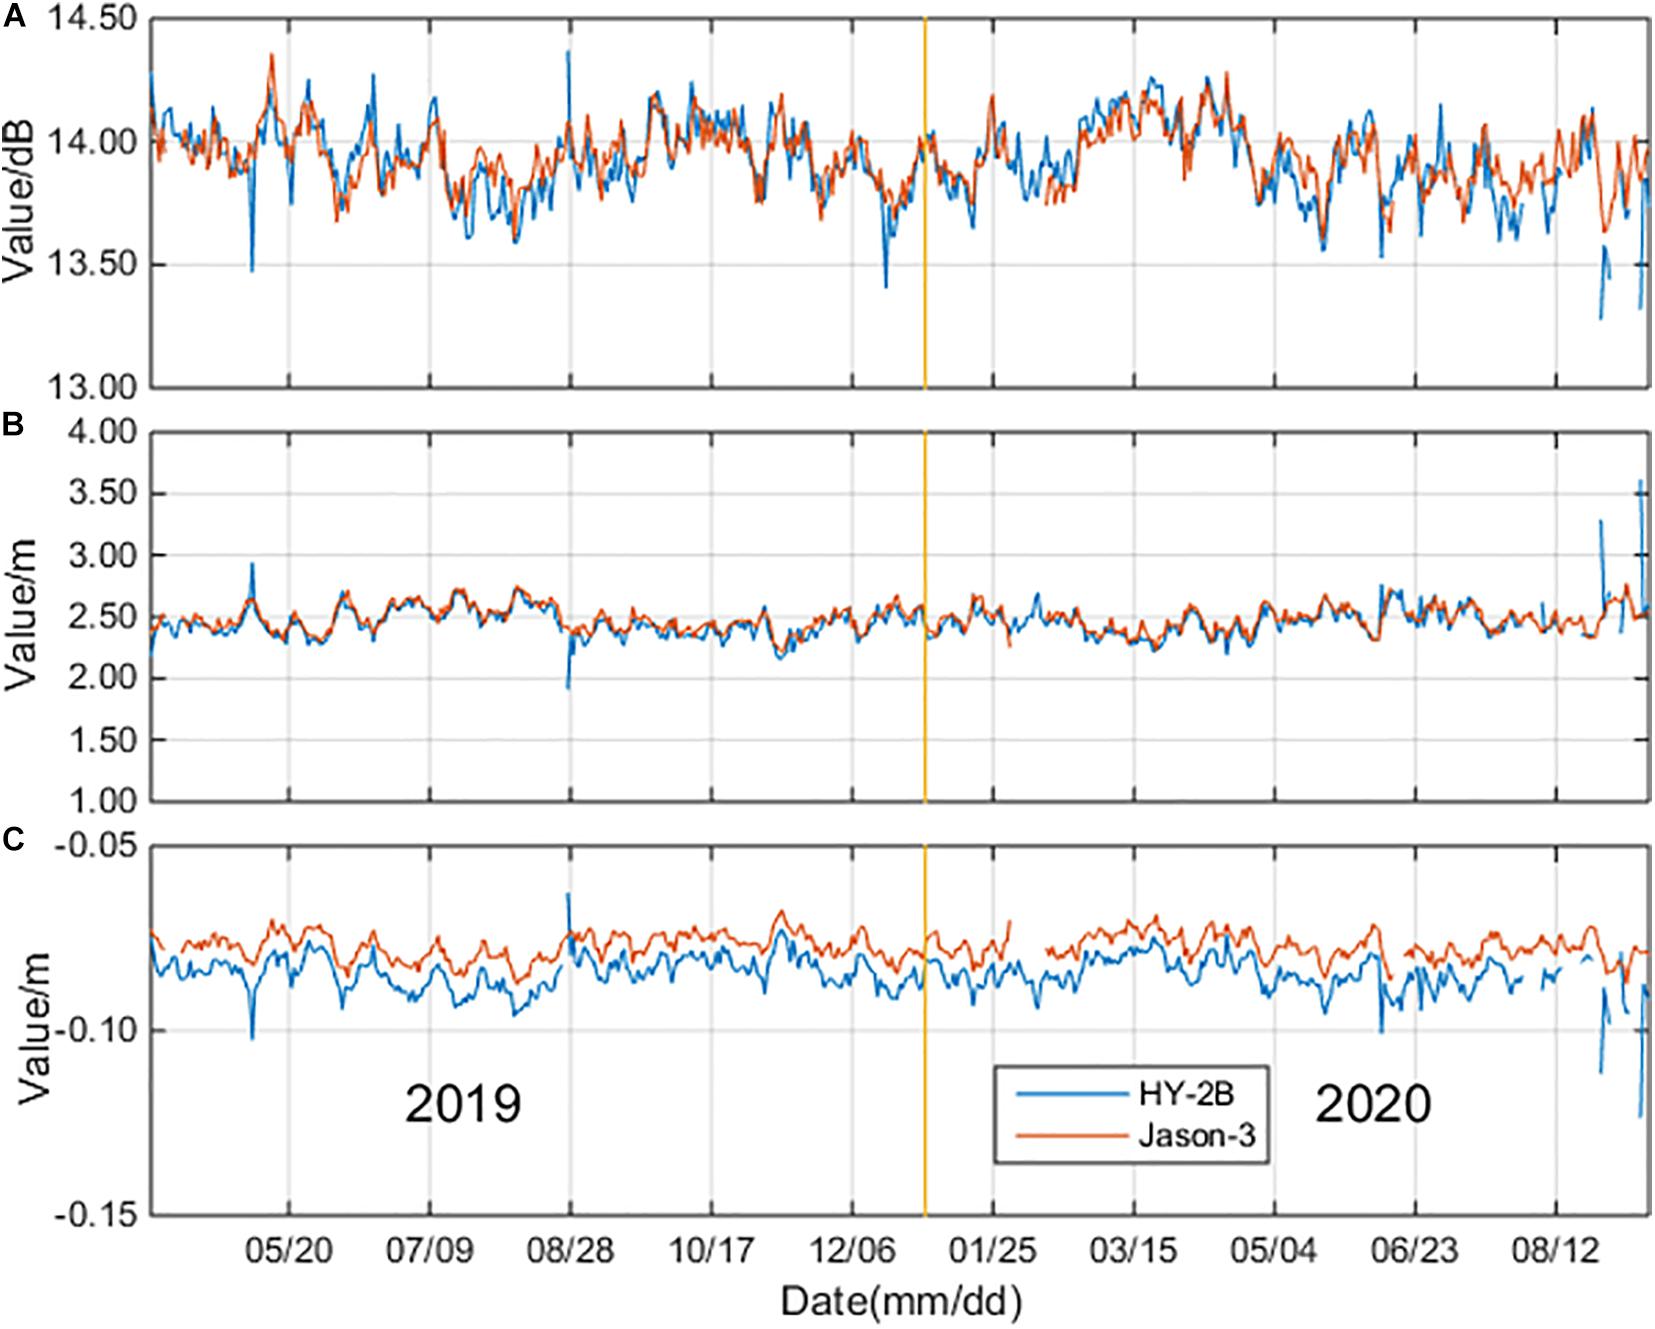
Figure 4. Comparison of the daily mean of (A) Sigma0, (B) SWH, and (C) SSB for HY-2B and Jason-3.
Backscattering Coefficients
The backscattering coefficients are acquired using the amplitudes of the radar altimeter echo signals with respect to the maximum emission amplitude of the radar echo wave energy. The backscatter coefficients are related to the wind speeds and the sea states. The daily means of Sigma0 for the HY-2B and Jason-3 missions were compared, and the results are detailed in Figure 4A. It can be seen in the figure that the backscattering coefficients had displayed no obvious trends. The averages of the daily mean series of Sigma0 for the HY-2B and Jason-3 satellites, in Figure 4A, were 13.9243 and 13.9415 dB, respectively, with only a very small difference observed (−0.0172 dB). The maximum absolute value of the difference between the daily mean series of the parameter Sigma0 from the HY-2B and Jason-3 satellites was determined to be 0.517 dB, which occurred on September 11, 2020. The average and standard deviation of the differences between the daily mean series of the parameter Sigma0 from the HY-2B and Jason-3 data was determined (−0.0165 ± 0.1054) dB. The correlation coefficient of the Sigma0 between the HY-2B and Jason-3 satellites was 0.762, and these results had confirmed that the backscattering coefficients of the HY-2B and Jason-3 satellites were very consistent.
Significant Wave Heights
The SWH are calculated from the slopes of the altimeter echo waveforms. SWHs are approximately equal to one-third of the height of the highest wave within a period of time over a certain sea area. In addition, SWHs are related to the wind speeds, sea surface backscattering coefficients, and the SSB. Figure 4B shows the daily mean series of the SWHs for the HY-2B and Jason-3 satellites. The statistics of the correlation coefficients and the differences between the daily mean SWH data series from the HY-2B and Jason-3 satellites are detailed in Table 4. The statistical analysis results showed that the correlation coefficient between the daily mean series of the SWHs from the HY-2B and Jason-3 satellites was 0.748, which indicated that the variations in the daily means of the SWHs for the HY-2B and Jason-3 satellites were consistent. The average and standard deviation of the differences between the daily mean series of SWHs from the HY-2B and Jason-3 satellites was determined to be (−3.40 ± 5.12) cm. The results demonstrated the high accuracy of the SWHs, which had been calculated by the HY-2B satellite system.
Sea State Bias Corrections
The SSB is one of the main errors that tend to result in the deterioration of SSHs in altimetric measurements (Tran et al., 2010). The SSB is aroused due to the waves (Liu, 2014). The differences in the SSB corrections between the HY-2B and Jason-3 satellites were considered to have direct impacts on the accuracy of the height measurements. Figure 4C shows the daily mean series of the SSB corrections for the HY-2B and Jason-3 satellite systems. The statistics of the correlation coefficient and the differences between daily mean data series of the SSB corrections from the HY-2B and Jason-3 satellites are shown in Table 4. The correlation coefficient between the daily mean series of the SWH from the HY-2B and Jason-3 satellites was determined to be 0.771. The maximum absolute value of the difference between the SSB corrections from the HY-2B and Jason-3 satellites was 4.46 cm. The average and standard deviation of the difference between the SSB corrections from the HY-2B and Jason-3 satellites was (−7.30 ± 3.20) mm. The comparison results indicated that the accuracy of the SSB corrections of the HY-2B satellite system was very high.
Wet Tropospheric Corrections
Wet tropospheric path delays are caused by the water vapor and cloud liquid water in the atmosphere, which tends to change significantly with the weather conditions. Wet tropospheric corrections are usually conducted using atmospheric models (such as ECMWF) or by using the brightness temperatures observed by satellite-borne microwave radiometers. The atmospheric model corrections can be utilized, while the radiometer observation data are invalid (or null values) in special circumstances. Wet tropospheric corrections are analyzed by the proportions of the null values and the comparison of the daily mean time series between HY-2B and Jason-3 missions, and the results are shown in Figure 5. The proportions of the null values of the wet tropospheric corrections of the HY-2B observation data were analyzed by daily time frames and cycle passes, and the results are shown in Figure 5A. It can be seen in the figure that the proportions of the null data from the radiometers were small during the majority of the examined days, with the exception of December 21, 2019, June 24, 2020, and July 14, 2020. In was observed that the proportions of the null wet tropospheric correction data were 1.61, 3.17, and 4.67% on December 21, 2019, June 24, 2020, and July 14, 2020, respectively. The statistics of the null wet tropospheric corrections by pass showed that there were three passes (cycle 30, pass 330; cycle 44, pass 047; and cycle 45, pass 216) with high null wet tropospheric corrections proportions (they are 24.7, 99.8, and 100%, respectively), which caused large proportions of null wet tropospheric corrections during the three aforementioned days.
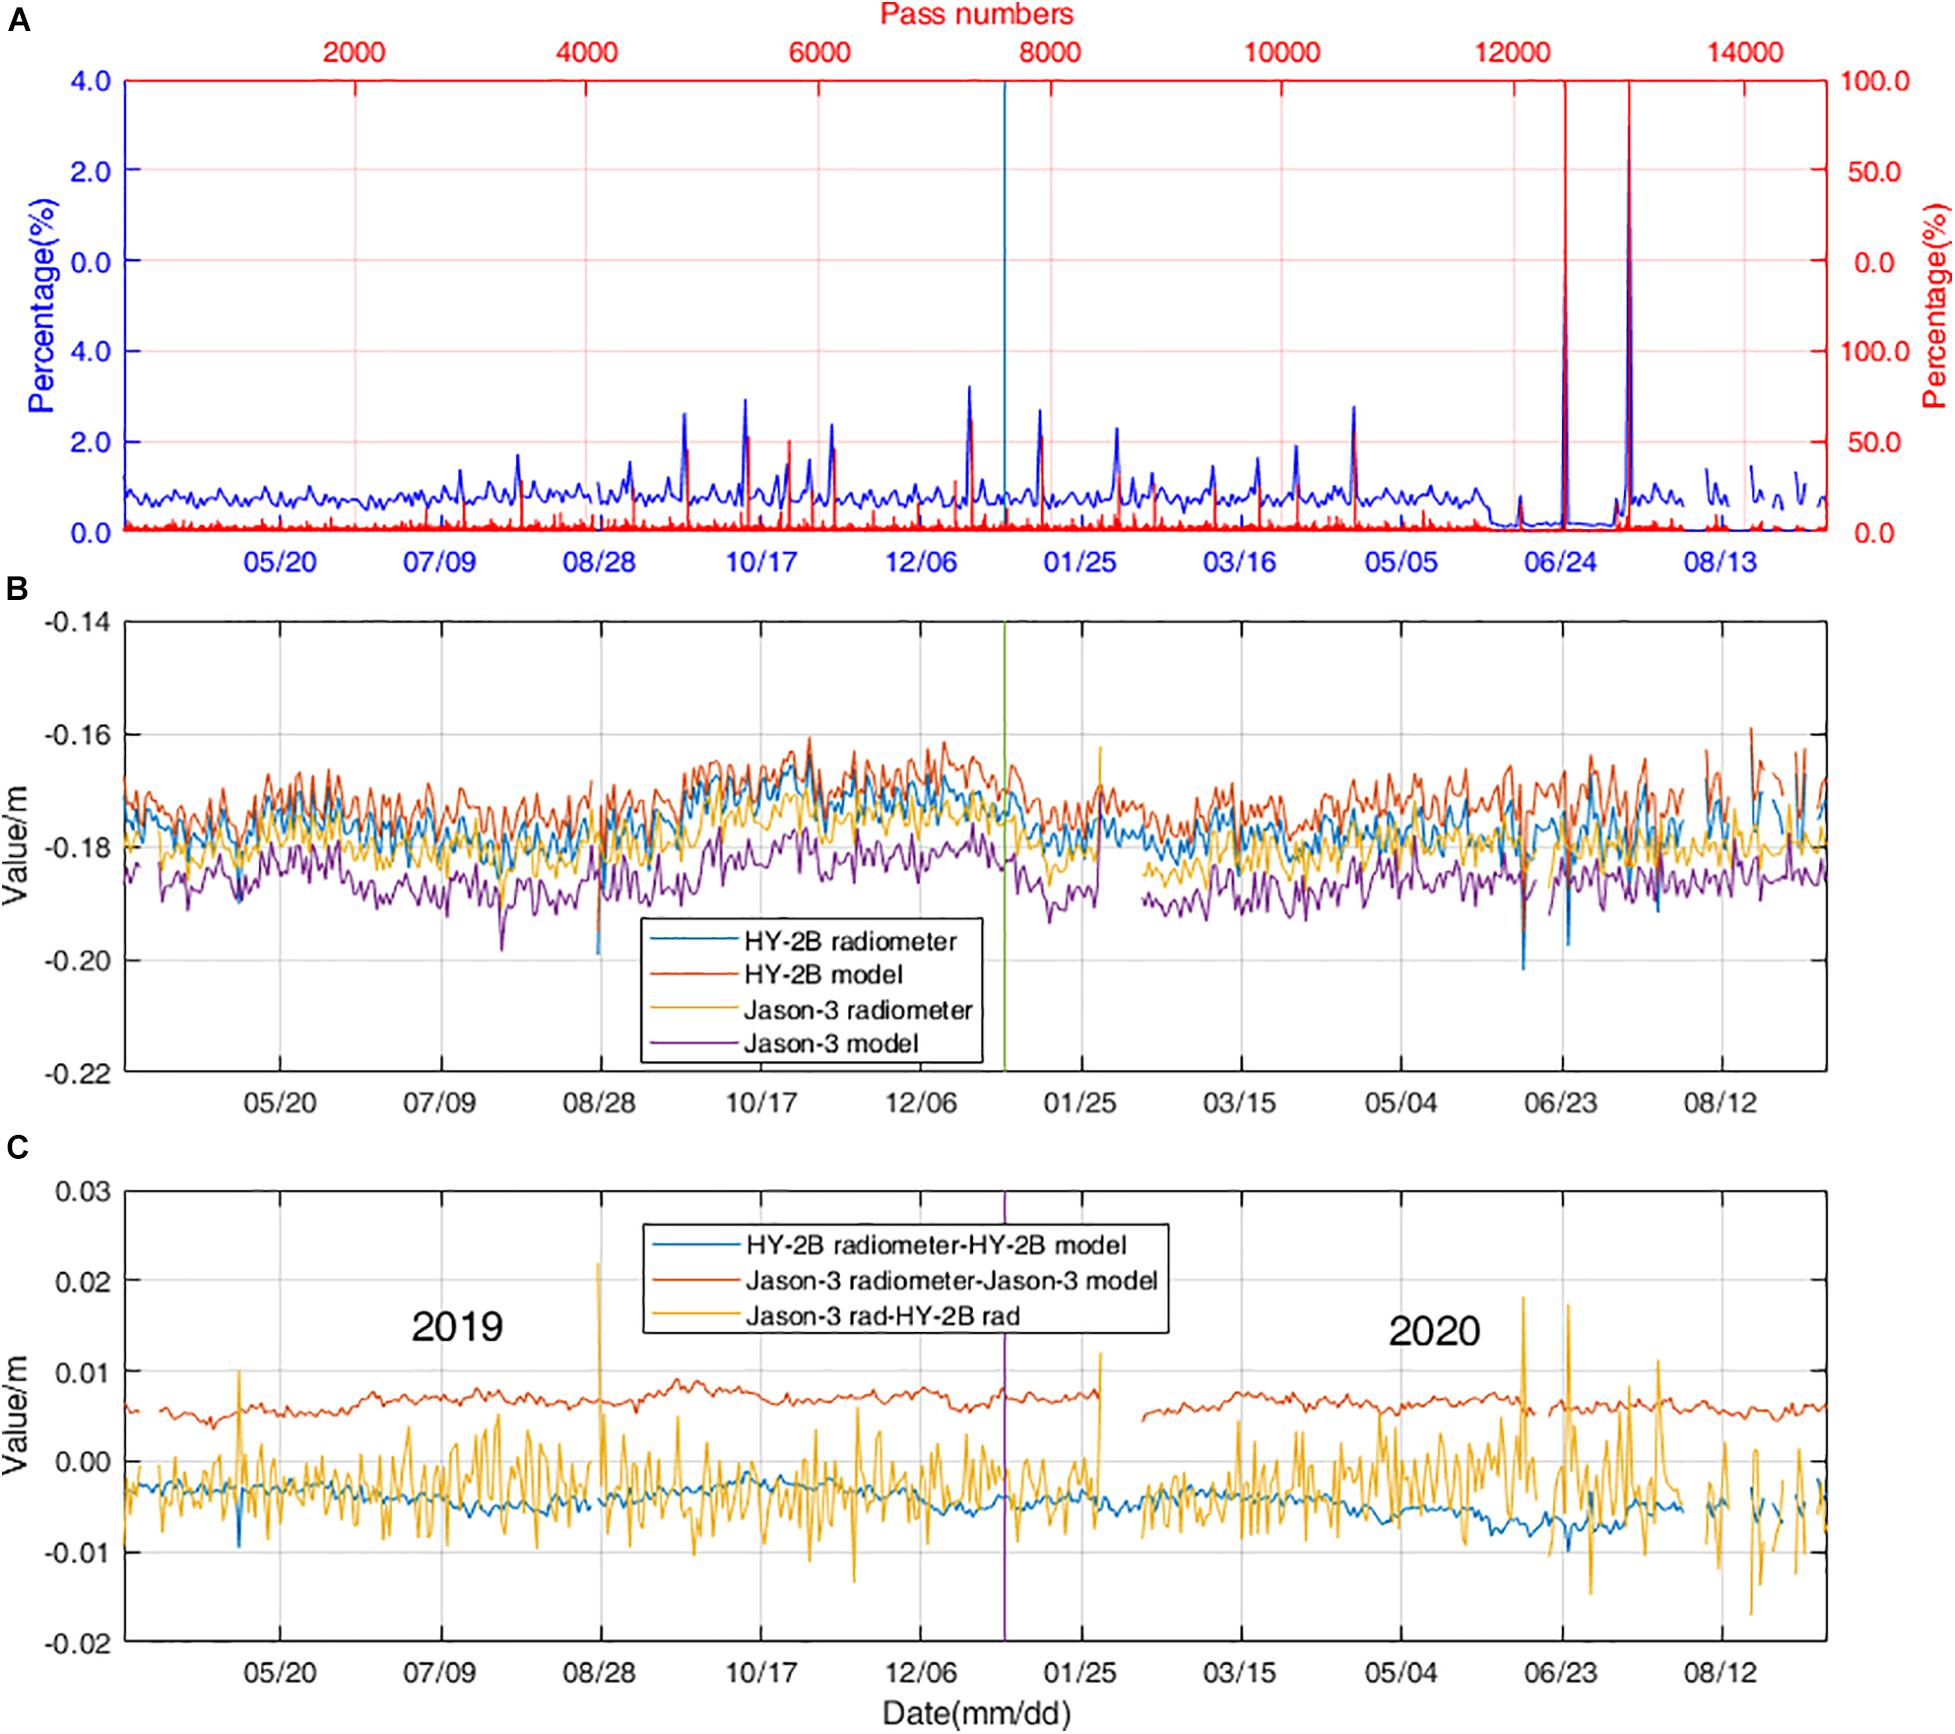
Figure 5. Wet tropospheric corrections for Panel (A) is the proportion of null value of HY-2B collected by pass (red) and by day (blue); Panel (B) is the daily mean of wet tropospheric corrections time series of radiometer values and model values of HY-2B and Jason-3; Panel (C) is the differences between radiometer wet tropospheric corrections from HY-2B and Jason-3 and the differences between wet tropospheric corrections from radiometer and model for HY-2B and Jason-3, respectively.
The daily mean time series of wet tropospheric corrections of the HY-2B and Jason-3 missions are shown in Figures 5B,C. Figure 5B shows the wet tropospheric corrections estimated from the model and from the HY-2B and Jason-3 radiometers. Figure 5C details the differences between the wet tropospheric corrections from the model and the radiometers of both the HY-2B and Jason-3 satellites. In addition, the differences between radiometer wet tropospheric corrections from the HY-2B and Jason-3 satellites are clearly shown. The statistics of the correlation coefficient and the differences between the daily mean data series of the radiometer corrections from the HY-2B and Jason-3 satellites are shown in Table 4. The statistics revealed that the correlation coefficient of the wet tropospheric corrections between the radiometer corrections and the model corrections for the HY-2B and Jason-3 satellites were 0.953 and 0.974, respectively. The mean value and STD of the differences between the corrections from radiometers and the model for the HY-2B and Jason-3 satellites were (−4.40 ± 1.40) mm and (6.40 ± 1.40) mm, respectively. The results demonstrated that there were only small differences between model values and radiometer corrections for the HY-2B satellite. The bias between the model values and radiometer corrections were observed to be small for HY-2B when compared with those of the Jason-3 satellite. The mean value and STD of the differences between the wet tropospheric corrections from Jason-3 and HY-2B was determined to be (2.90 ± 4.10) mm. The daily mean analysis of the wet tropospheric corrections showed no obvious trends or drifts within the examined period. Therefore, it was indicated that the HY-2B radiometer had displayed good stability and accuracy in its performance.
Ionospheric Corrections
The ionospheric corrections were estimated using a dual-frequency observation method of the Ku- and C-bands for the HY-2B and Jason-3 satellites. The global ionosphere maps (GIM) model values of the ionospheric corrections were also provided in the GDR dataset. Figure 6A shows this study’s comparison of the daily mean series of the ionospheric corrections; Figure 6B details the differences between the daily mean series of the dual-frequency ionospheric corrections from the HY-2B and Jason-3 satellites and the differences between daily mean series of the ionospheric corrections retrieved from the dual-frequency corrections and model corrections for the HY-2B and Jason-3, respectively. The statistics of correlation coefficient and the differences between the daily mean series of the dual-frequency ionospheric corrections from the HY-2B and Jason-3 satellites are shown in Table 4. The statistical analysis results revealed that the correlation coefficient between the ionospheric corrections from the dual-frequency and GIM model values were 0.968 and 0.991 for the HY-2B and Jason-3 satellites, respectively. The mean and standard deviation of the difference between dual-frequency corrections and GIM model corrections for the HY-2B and Jason-3 satellites were (1.50 ± 0.85) mm and (7.40 ± 0.76) mm, respectively, which indicated good performance results for the ionospheric corrections of the HY-2B satellite. The mean and standard deviation of the difference between the dual-frequency corrections from the Jason-3 and HY-2B satellites was (4.80 ± 2.10) mm. These results demonstrated a systematic bias of 4.80 mm, and there were no obvious trends or drifts observed in the ionospheric corrections of the HY-2B system.
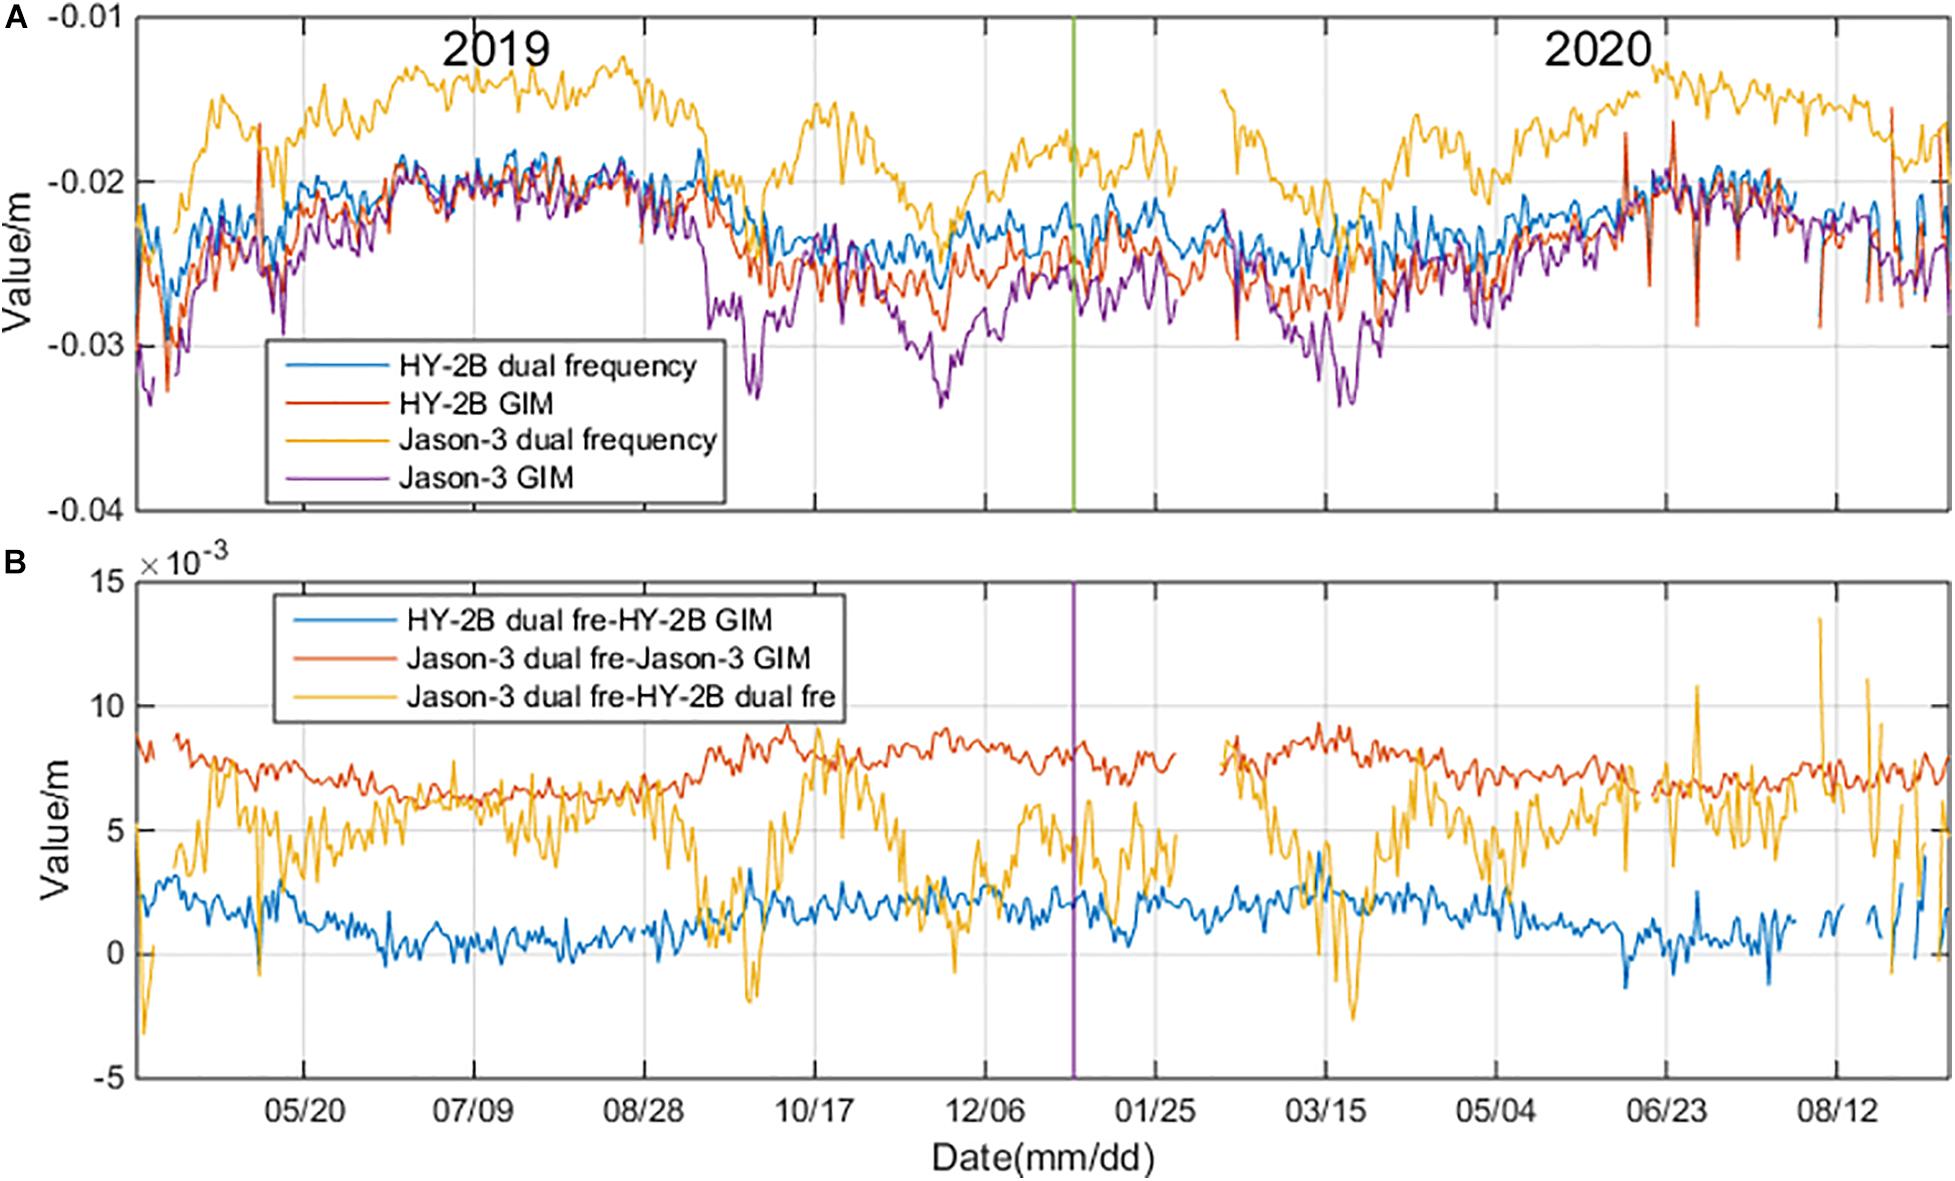
Figure 6. The daily mean of ionospheric corrections time series of (A) dual-frequency corrections and GIM model corrections for HY-2B and Jason-3; (B) the difference between ionospheric corrections from dual-frequency corrections and GIM corrections for HY-2B and Jason-3 respectively, and the difference between dual-frequency ionospheric corrections from Jason-3 and HY-2B.
SLA Analysis
The sea level anomalies, which can be estimated using Eqs 1 and 2, are generally used to study the variations in the SSHs and to monitor the long-term performance of an altimeter. SLAs were computed by the restrictions of the deep ocean areas (bathymetry ≤−1,000 m) and latitude bounds of ±50°. The accuracy of the daily mean SLAs derived from the HY-2B system was assessed in this study using by comparing them with those derived from the Jason-3 system. The crossover analysis results of the SLAs were adopted to provide a global view of the system performance of the HY-2B satellite. The SLA differences were analyzed at the self-crossover points of the HY-2B mono-mission and at dual-crossover points between the HY-2B and Jason-3 satellites. In addition, in order to reduce the impacts of the temporal variations of the marine environments, the SLAs computed at the crossover points were compared within a measurement time difference of <3 days. It was assumed that the SLAs at the crossover points with measurement differences of <3 days should be consistent. The editing criteria in Bao et al. (2015) was used in this study.
SLAs Daily Mean Analysis
The statistical analysis results showed that three times of the standard deviation of the daily mean of the SLAs are no more than 2 m. Therefore, the daily mean SLAs over 2 m were assumed as gross errors and were excluded from the results. The averages of the daily mean SLAs for the HY-2B and Jason-3 satellites were 0.75 and 4.02 cm, respectively. The average and STD of the difference between the daily mean of the SLAs from the HY-2B and Jason-3 satellites was confirmed to be (−3.24 ± 1.07) cm. As can be seen in Figure 7, the SLAs of the HY-2B and Jason-3 satellites both had displayed slight descending trends, which was 0.37 mm/a for the Jason-3 satellite and 5.90 mm/a for the HY-2B satellite.
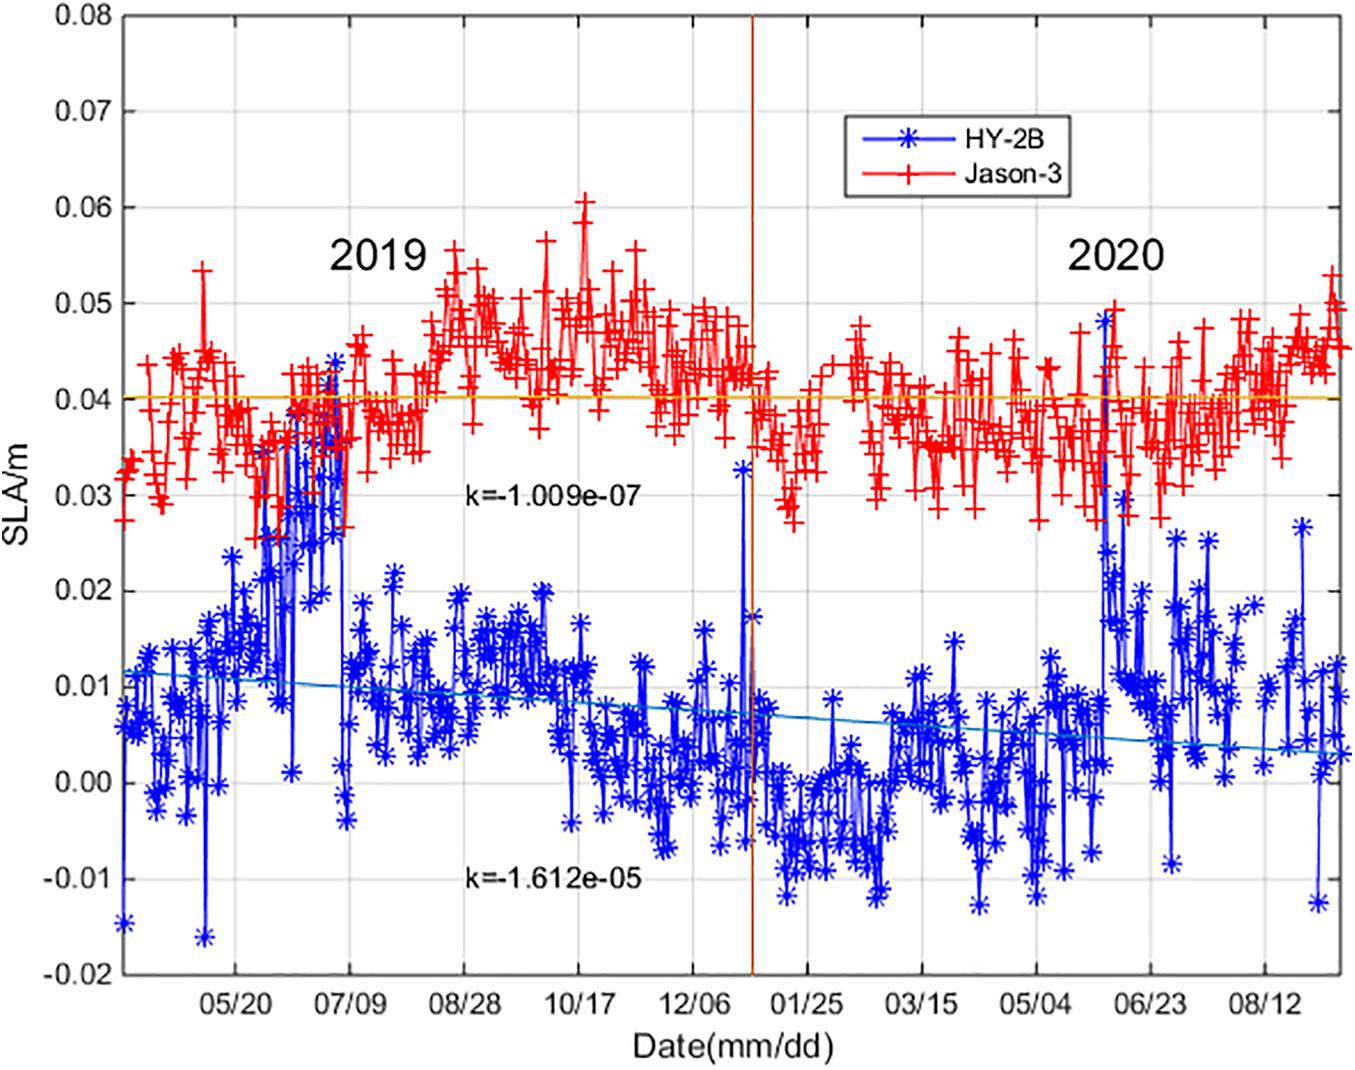
Figure 7. The daily mean SLAs of HY-2B and Jason-3.
SLAs Crossover Analysis
A cross-calibration method (Cheng and Andersen, 2014; Peng, 2015) was used in this study to verify the accuracy and performance of the HY-2B satellite system. During this study’s examinations, differences over 1 m at the self-crossover points were excluded from the results. The results of SLA difference at self-crossover points of the intrinsic mono-mission of the HY-2B are shown in Figure 8. The series of differences between the SLAs of the HY-2B satellite at self-crossover points are shown in Figure 8A. As can be seen in Figure 8A, with the exception of a few large individual errors in the SLAs, the majority of SLA differences at the self-crossover points were relatively stable and had fluctuated within a small range of scope. The mean and STD of the differences between SLAs at the self-crossover points of the HY-2B satellite was (0.19 ± 8.48) cm. The main scope range for the differences in the SLAs was between -0.06 and 0.06 m. Figures 8B,C shows the mean and STD of differences between the SLAs of the HY-2B satellite at self-crossover points as computed cycle by cycle. In cycles 15–18, 31, and 32, the standard deviation of the differences between the SLAs at self-crossover points were observed to be relatively larger. The SLA differences greater than three times the standard deviation of SLA differences at the crossovers were assumed to be gross errors and were removed from the SLAs series. Then, the mean and standard deviation of the differences between SLAs was determined to be (0.21 ± 6.70) cm. The statistical analysis results indicated that the data quality was relatively stable. The percentage of excluded data for the differences of the SLAs was 1.81%. Figure 8D details the differences in SLAs at crossovers, which were found to have a normal distribution after filtering at three times the standard deviation. This had clearly demonstrated the characteristics of a normal distribution. Then, the spatial distribution of the SLA differences of the HY-2B satellite at the self-crossovers were further analyzed. Figure 8E shows cycle 28 as an example of the distribution of the SSH differences at the crossovers, which were found to be relatively uniform and not affected by the marine environments.
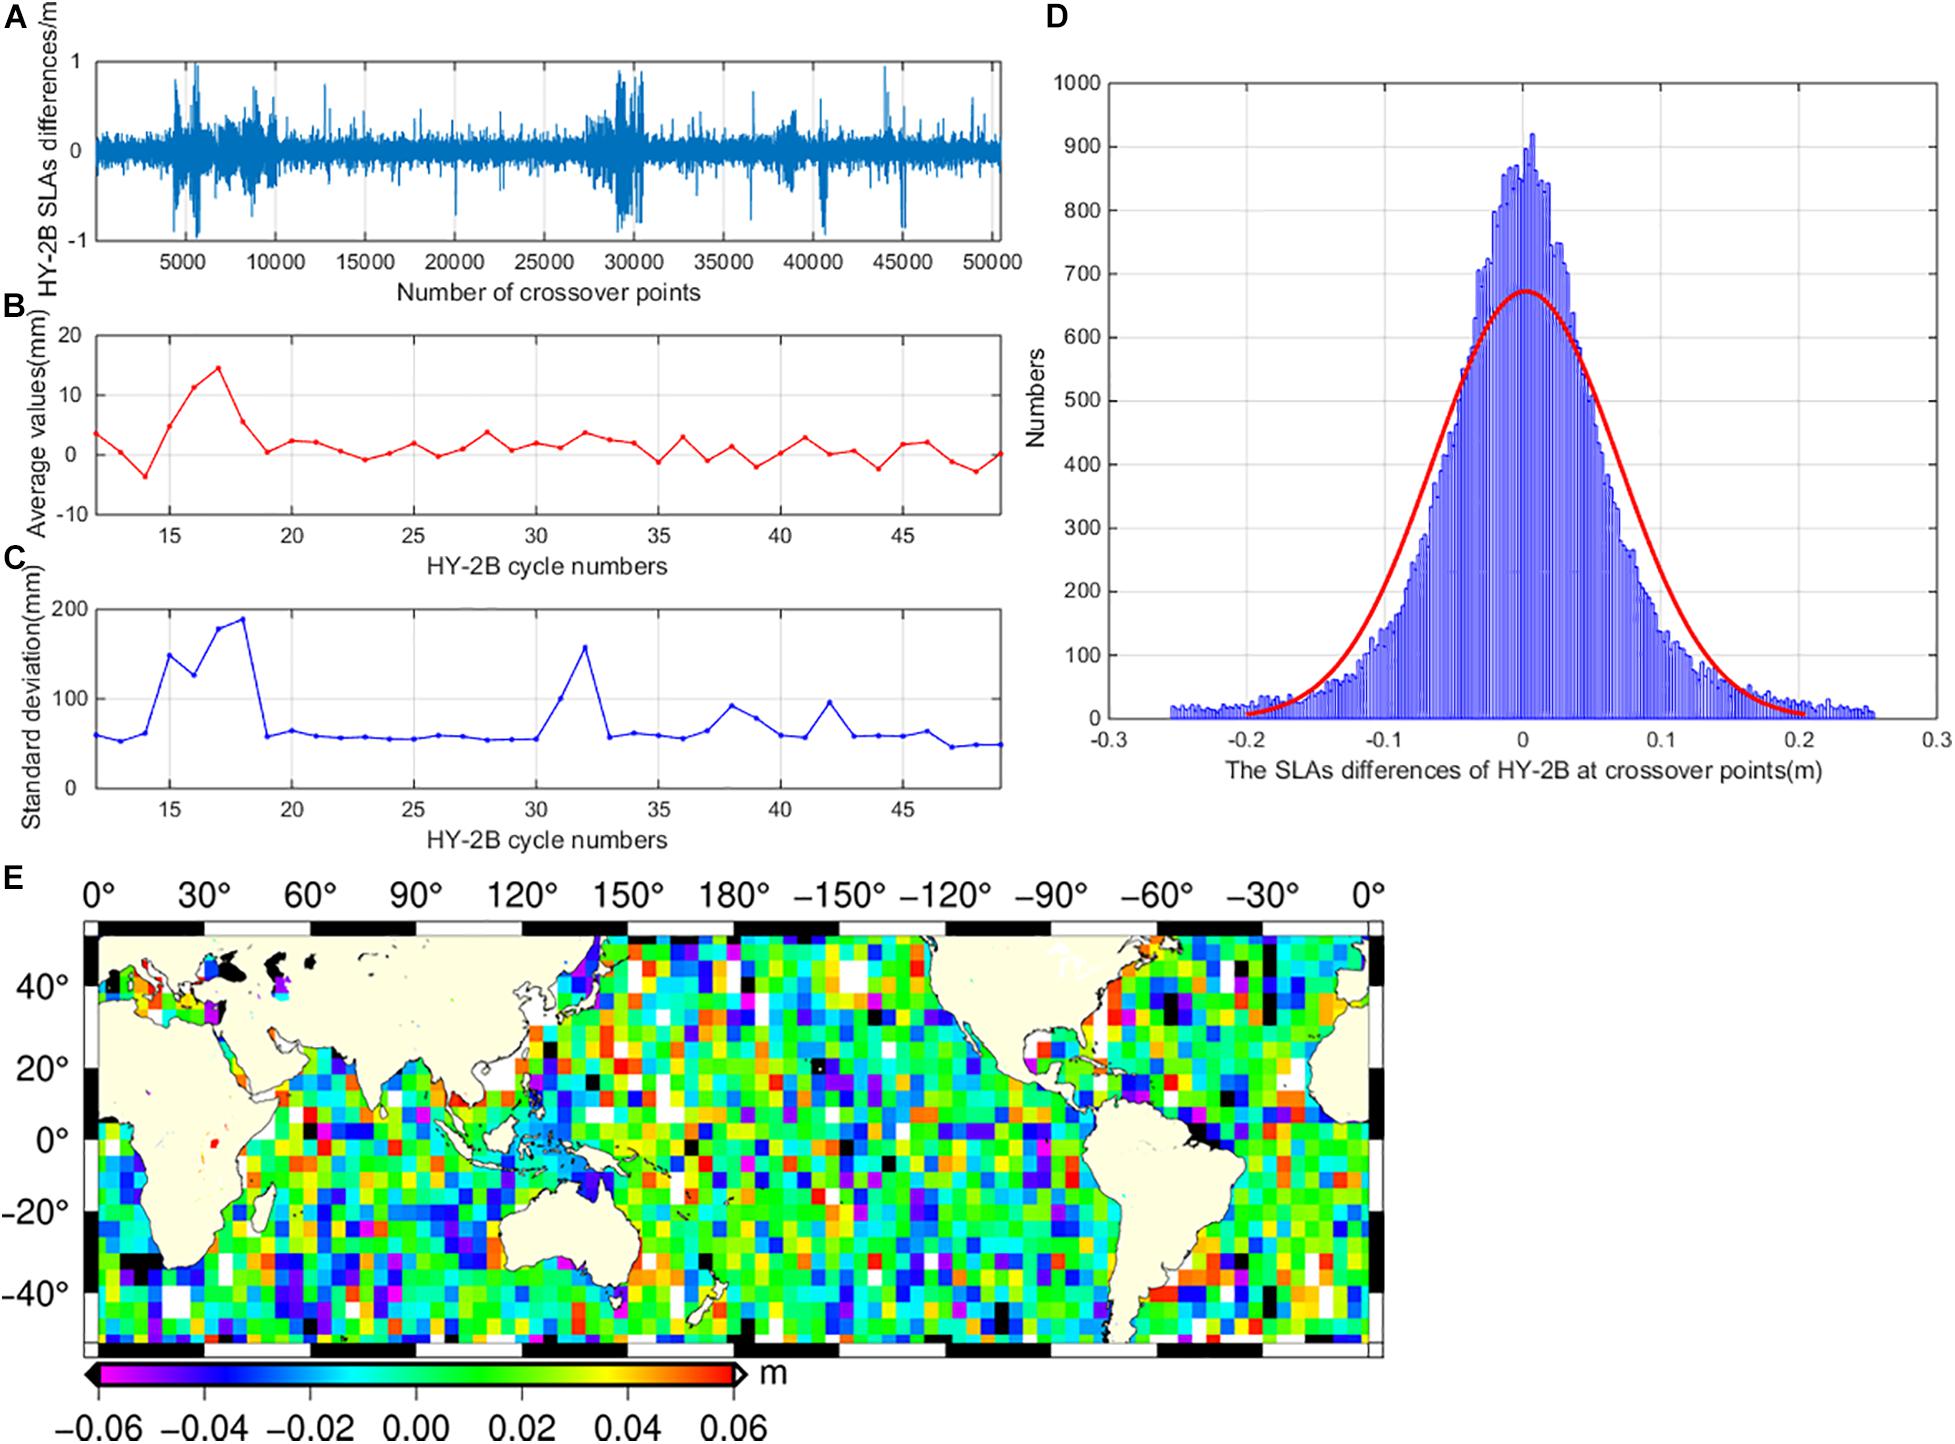
Figure 8. The results of SLAs difference at self-crossover points of the intrinsic mono-mission of the HY-2B: Panel (A) is the differences series of HY-2B SLAs at self-crossover points (time differences larger than 3 days were removed); Panels (B,C) are cycle by cycle average and standard deviation of SLAs differences at self-crossover points, respectively; Panel (D) is the histogram of the differences between SLAs at self-crossover points of HY-2B (differences greater than three times of standard deviation were removed); Panel (E) is the spatial distribution of the differences between SSHs at self-crossover points of HY-2B with a grid of 4° × 4° in cycle 28.
The SLA differences at the dual-crossover points between the HY-2B and Jason-3 satellites were also calculated in this study. The crossover differences with values greater than three times of the STD were assumed to be gross error and removed, which accounted for approximately 0.87%. Then, the mean and STD of the differences of the SLAs at the dual-crossover points was determined to be (−3.40 ± 6.25) cm. Figure 9 shows this study’s comparison of the SLAs and the histogram of the differences between the SLAs at the dual-crossover points of the HY-2B and Jason-3 satellites. It can be seen in the figure that the SLA difference followed the normal distribution perfectly, and the slope of the linear regression of the parameters was almost equal to 1. These results confirmed the consistency of the SLAs between the HY-2B and Jason-3 satellites.
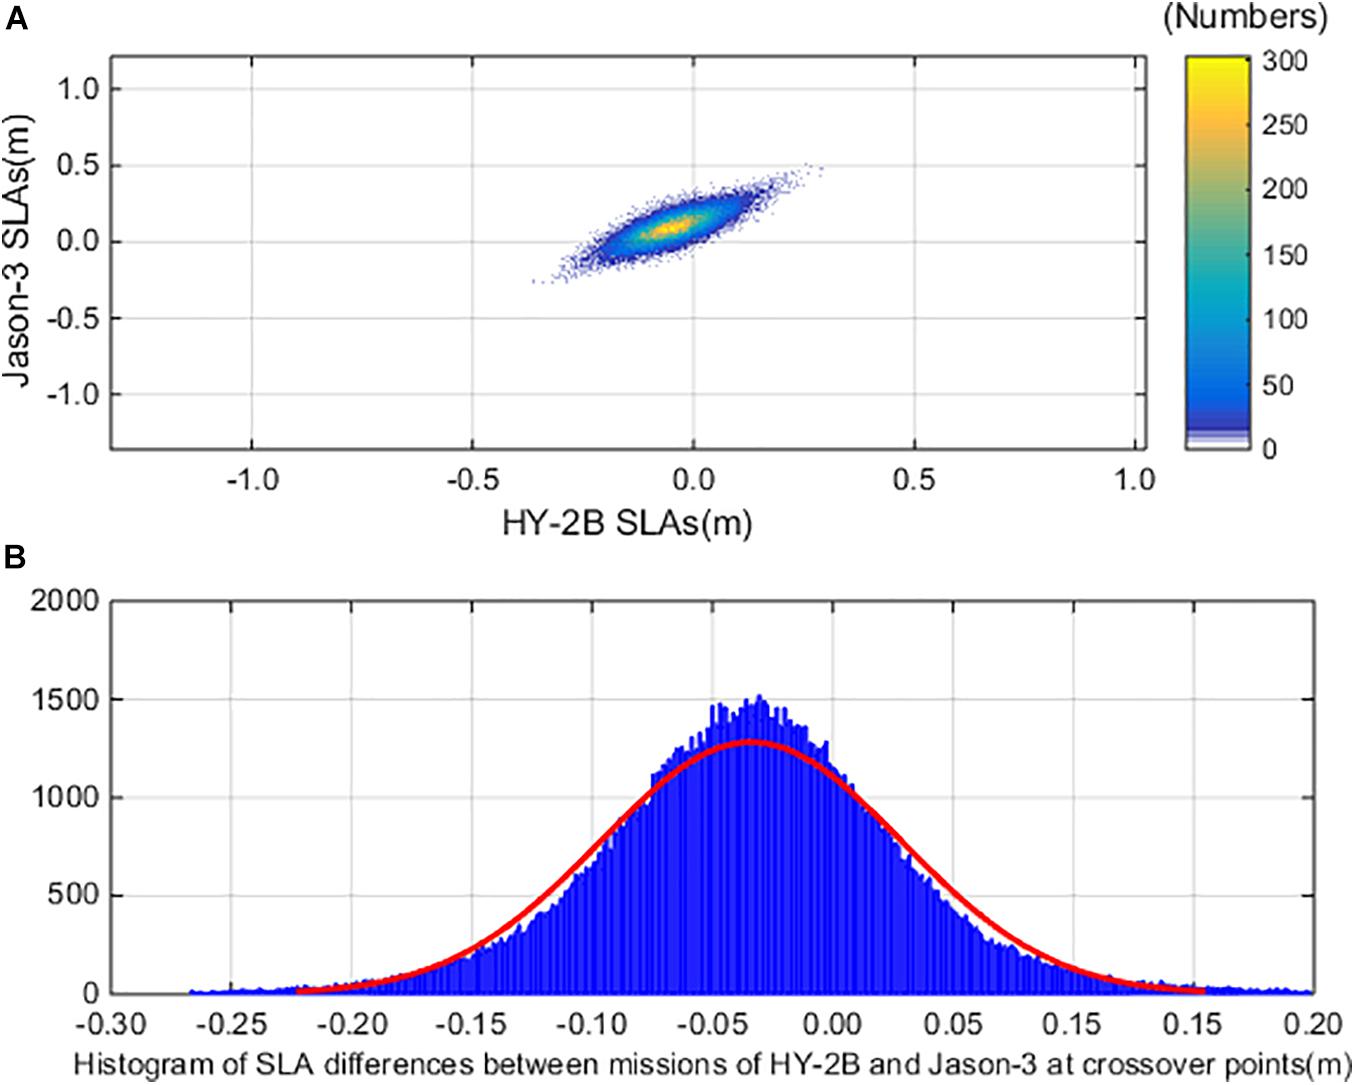
Figure 9. SLA series for Panel (A) is the comparison between SLAs from HY-2B and Jason-3, and for Panel (B) is the histogram of the differences between SLAs at dual-crossover points of HY-2B and Jason-3 (differences greater than three times of standard deviation were removed).
Wavenumber Spectra Analysis of the SLAs
The wavenumber spectra of the SLAs of the HY-2B satellite were computed and compared with that of the Jason-3 satellite. Then, the SLAs of the global oceans were used for this study’s wavenumber spectra analysis in order to detect the noise levels of the satellite altimeters. The global SLA power spectra over the Jason-3 satellite (cycle 115) and the HY-2B satellite (cycle 12) are shown in Figure 10. In the coverage of the wavelengths larger than 100 km, the overall wavenumber spectra of the SLAs from the HY-2B satellite were found to almost be the same as that of the Jason-3, in which both followed specific power low between k–3 to k–4, which meant that the signals were dominated by large scales (Bao et al., 2015). For the wavelengths smaller than 100 km, the signals of noise for both altimeters turned gradually toward dominance and the slopes became flatter, which was slightly lower for the HY-2B satellite when compared to the Jason-3. These results indicated that the HY-2B measured SLAs were as accurate as those obtained by the Jason-3 satellite over the wavelengths >100 km and were slightly better than the Jason-3 results over the wavelengths <100 km.
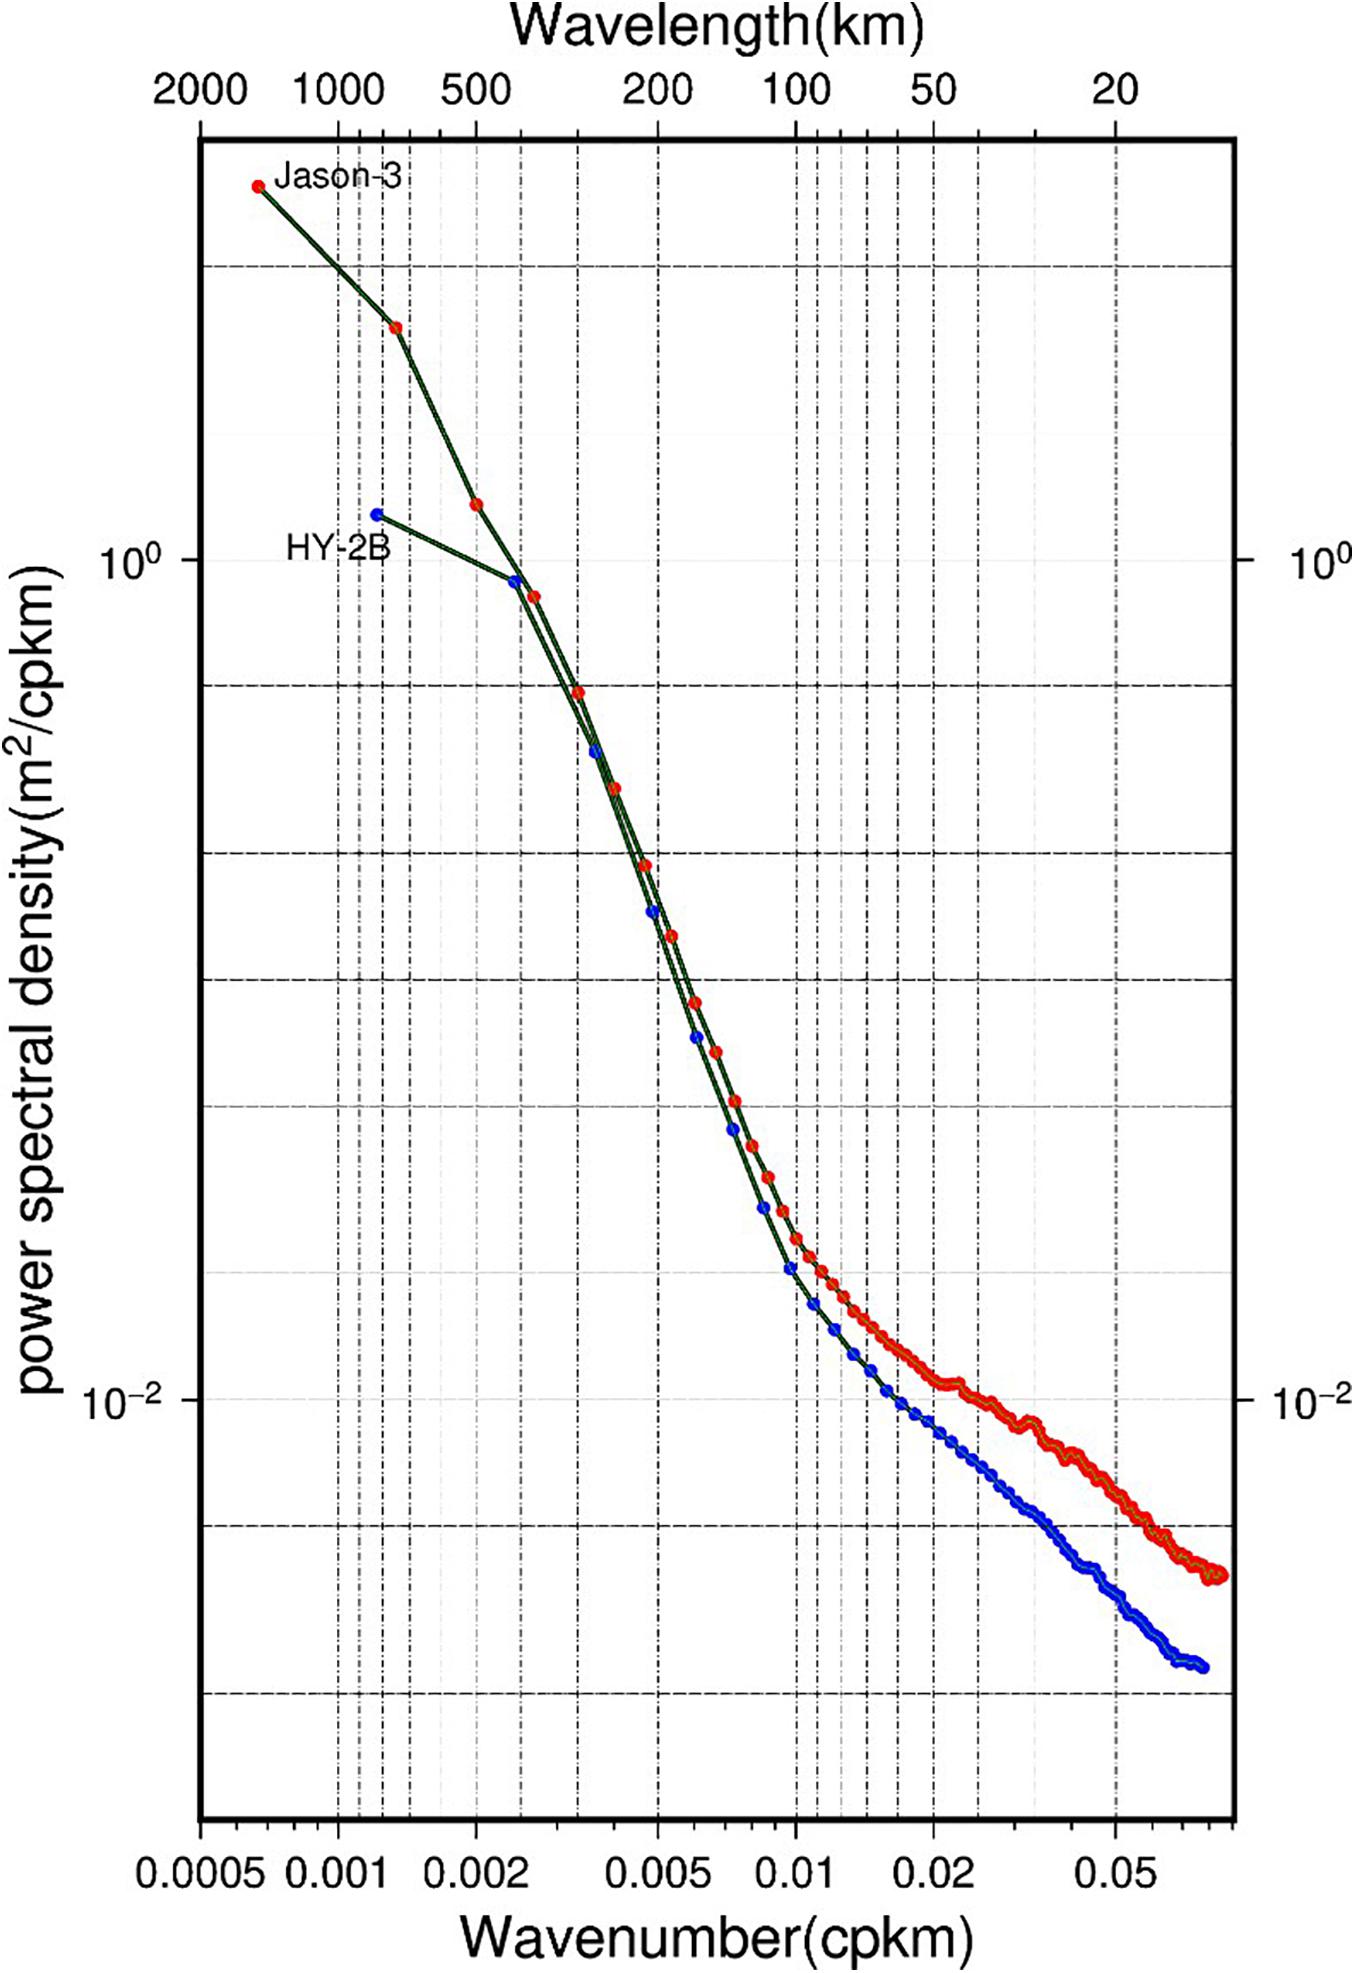
Figure 10. Wavenumber spectra of SLAs computed using Jason-3 cycle 115 and HY-2B cycle 12 over global ocean.
Results and Discussion
In the present study, the main altimetry parameters and SLAs of the HY-2B satellite were analyzed and compared with the data obtained from the Jason-3 satellite mission in order to reveal the HY-2B satellites performance accuracy and consistency achievements. The statistical results confirmed the high quality and reliability of the HY-2B satellite’s data. The main satellite altimetric parameters showed that the total editing proportion was 2.67% on average for the HY-2B satellite, which was slightly better than that achieved by the Jason-3 satellite (2.86%). It was found that while the data were constrained over the deep water and low altitude ocean areas, the total editing proportion had decreased to under 2% (1.07%) for the HY-2B satellite, which was slightly better than that of the Jason-3 satellite (1.67%). Five key parameters (Sigma0, SWH, SSB, wet troposphere delays, and ionospheric delays) of the HY-2B satellite were analyzed through a comparison with the Jason-3 satellite. The results showed that the Sigma0, SWH, and SSB had strong correlation coefficients between the HY-2B and Jason-3 satellites with correlation coefficients of 0.762, 0.748, and 0.771, respectively. In regard to the other two parameters, the correlation coefficient performances were slightly lower but still remained higher than 0.5. The system biases for the main parameters between the HY-2B and Jason-3 satellites were also calculated in this study. The mean and STD of differences between the daily mean series of parameters Sigma0, SWH, and SSB from the HY-2B and Jason-3 satellites were determined to be (−0.0165 ± 0.1054) dB, (−3.40 ± 5.12) cm, and (−7.30 ± 3.20) mm, respectively. In addition, for the radiometer wet tropospheric corrections and the dual-frequency ionospheric corrections, the system biases between the Jason-3 and HY-2B satellites were (2.90 ± 4.10) mm and (4.80 ± 2.10) mm, respectively. These results confirmed that the radiometer and the dual-frequency altimeter of the HY-2B had performed well and had achieved accuracy levels similar to the Jason-3 satellite. The analysis results of the time series of the wet tropospheric delays showed no system drifts within the study period, which indicated that good stability and accurate performances had been achieved by the HY-2B radiometer.
The SLAs and SSHs of the HY-2B system were calculated and compared with the Jason-3 satellite. The daily mean of the SLA time series showed similar trends for both of the satellites, which may have been related to the seasonal sea level changes. The accuracy of the SLAs for the HY-2B satellite was up to the subcentimeter level when compared to the Jason-3 mission results. The SLA differences at the crossover points between the HY-2B and Jason-3 satellites were determined to be (−3.40 ± 6.25) cm, which indicated that the system bias was small. This study also estimated that the SLA difference at the HY-2B self-crossover points was (0.21 ± 6.70) cm. The distribution of the SSH differences at the HY-2B self-crossover points were observed to be relatively uniform, indicating that no geographically correlated errors had occurred. The mean value of the HY-2B SLA differences was close to 0 cm, which demonstrated that the HY-2B satellite’s internal agreement was excellent. The STD of the SLA differences was determined to be approximately 6 cm, which confirmed that the accuracy of the SSH measurements of HY-2B system had satisfied the requirements of the design.
Through this study’s SLA wavenumber analysis process, it was found that the HY-2B and Jason-3 satellites were in good agreement in wavelengths >100 km. Furthermore, it was observed that for the wavelengths <100 km, the instrumental noise levels of the HY-2B satellite were slightly lower than those of the Jason-3 satellite.
Conclusion
The HY-2B satellite has been operating in its orbit for more than 2 years. However, few studies have focused on the data quality and system performance of the HY-2B mission to date. Therefore, this research study focused on providing the first exhaustive statistical evaluation and quality assessment of the HY-2B altimetric GDR data set. A continuous 38 cycles of the mission, along with the widely validated and calibrated data sets of the Jason-3 satellite during the same time span, were used to perform a comprehensive quality assessment of the HY-2B system’s performance. The conclusions reached in this study were as follows:
(1) When compared with HY-2A satellite system, the parameter of editing proportions of the HY-2B satellite were found to be significantly improved. It was found that the editing proportions were at a level similar to those of the Jason-3 satellite, indicating that the data availability was high for the HY-2B system.
(2) The correlation coefficient between the daily mean series of the five main examined parameters (Sigma0, SSB corrections, SWH, ionospheric corrections, and wet tropospheric corrections) from the HY-2B and Jason-3 missions were all determined to be larger than 0.5. This was particularly true in regard to the parameters of Sigma, SWH, and SSB corrections, which were all larger than 0.7. The daily mean analysis results of the five main parameters revealed that there were no obvious trends or systematic bias (drifts), which further confirmed that the HY-2B satellite had achieved consistency and accuracy levels similar to the Jason-3 satellite.
(3) The mean and standard deviation of the differences of the daily mean of the SLAs from the HY-2B and Jason-3 satellites was determined to be (−3.24 ± 1.07) cm. The standard deviations of the difference between SLAs at the self-crossover points of the HY-2B satellite and at the dual-crossover points of the HY-2B and Jason-3 satellites were determined to be 6.70 and 6.25 cm, respectively, after the points with time differences larger than 3 days were removed. These results further demonstrated the high stability and reliability of the HY-2B mission and that the accuracy of SLAs for the HY-2B had achieved a subcentimeter level.
(4) The wavenumber spectra of the SLAs estimated by the HY-2B and Jason-3 satellite systems over the global oceans indicated that the HY-2B satellite’s SLA measurements were as accurate as those of the Jason-3 satellite over the wavelengths >100 km and slightly better than the Jason-3 system for the wavelengths <100 km.
In summary, the results obtained in this study showed that the HY-2B satellite system had achieved very good performance and data accuracy levels. However, the radar altimeters of HY-2B and Jason-3 satellites are typical traditional radar altimeters, altimeters’ noise level are limited to a spatial resolution of 100 km or more, and the spatial resolution of individual satellites still does not allow for submesoscale observations. Combining observations from different families of on-orbit altimeter satellites (e.g., the recently launched Sentinel-6 MF and HY-2C, which launched in November 2020 and in September 2020, respectively) can improve the resolution problem. In addition, the upcoming interferometric radar altimeters [such as surface water and ocean topography (SWOT)] will also contribute significantly to the spatial resolution. Since the time span in this study were just 1.5 years, the long-term bias or drift could not be detected in this investigation. Therefore, further data validation and calibration research will be carried out for the long-term monitoring of parameters and SLAs in order to determine the long-term bias. In addition, absolute calibrations with tidal gauge observations will still be required in order to investigate the HY-2B satellite’s total accuracy performance. Combined with absolute calibrations, HY-2B data can be used for the inspections and calibrations of other altimeter satellites.
Data Availability Statement
The original contributions presented in the study are included in the article/supplementary material, further inquiries can be directed to the corresponding author/s.
Author Contributions
JW: methodology, formal analysis, writing – original draft, writing – editing, and funding acquisition. LY: methodology, review and editing, formal analysis, and validation. HX: formal analysis, software, and validation. CM: data curation and resource. QS: conceptualization, investigation, and methodology. All authors have read and agreed to the published version of the manuscript.
Funding
This project was funded by the Priority Academic Program Development of Jiangsu Higher Education Institutions (PAPD), the National Natural Science Foundation of China (Grant Nos. 41776029 and 41806214), and the Key Research and Development Program of Jiangsu Province under Contract No. BE2018676.
Conflict of Interest
The authors declare that the research was conducted in the absence of any commercial or financial relationships that could be construed as a potential conflict of interest.
Acknowledgments
We thank the National Satellite Ocean Application Service for providing the HY-2B geophysical data records (GDRs) products. We also thank the Archiving, Validation, and Interpretation of Satellite Oceanographic Data (AVISO) for providing Jason-3 geophysical data records (GDR) products. The GDR data of HY-2B now is freely available to the public through the Ocean Satellite Data Distribution System (https://osdds.nsoas.org.cn). We thank Nicholas Angiers from transwings, transwings Group China (www.gbtranswins.com), for editing the English text of a draft of this manuscript.
References
Ablain, M., Philipps, S., Picot, N., and Bronner, E. (2010). Jason-2 global statistical assessment and cross-calibration with jason-1. Mar. Geod. 33 (Supp. 1), 162–185. doi: 10.1080/01490419.2010.487805
Babu, K. N., Shukla, A. K., Suchandra, A. B., Kumar, S. V. V. A., Bonnefond, P., Testut, L., et al. (2015). Absolute calibration of SARAL/AltiKa in kavaratti during its initial calibration-validation phase. Mar. Geod. 38(Suppl. 1), 156–170. doi: 10.1080/01490419.2015.1045639
Bao, L. F., Gao, P., Peng, H. L., Jia, Y., Shum, C. K., Lin, M. S., et al. (2015). First accuracy assessment of the HY-2A altimeter sea surface height observations: cross-calibration results. Adv. Space Res. 55, 90–105. doi: 10.1016/j.asr.2014.09.034
Bonnefond, P., Exertier, P., Laurain, O., Ménard, Y., Orsoni, A., Jan, G., et al. (2003). Absolute calibration of jason-1 and TOPEX/poseidon altimeters in corsica special issue: jason-1 calibration/validation. Mar. Geod. 26, 261–284. doi: 10.1080/714044521
Cartwright, D. E., and Edden, A. C. (1973). Corrected tables of tidal harmonics. Geophys. J. Int. 33, 253–264. doi: 10.1111/j.1365-246X.1973.tb03420.x
Chelton, D., Ries, J., Haines, B., Fu, L., and Callahan, P. (2001). Satellite Altimetry and Earth Sciences: A Handbook of Techniques and Applications, Vol. 69, eds Fu L-L and A. Cazenave (California, CA: Academic Press).
Cheng, Y. C., and Andersen, O. B. (2014). “HY-2A satellite altimetric data evaluation in the arctic ocean,” in Proceedings of the 2014 IEEE Geoscience and Remote Sensing Symposium, (Quebec City, QC: IEEE).
Christensen, E. J., Haines, B. J., Keihm, S. J., Morris, C. S., Norman, R. A., Purcell, G. H., et al. (1995). Calibration of TOPEX/POSEIDON at Platform Harvest. J. Geophys. Re. Oceans 99, 24465–24485. doi: 10.1029/94JC01641
Crétaux, J. F., Calmant, S., Romanovski, V., Shabunin, A., Lyard, F., Bergé-Nguyen, M., et al. (2008). An absolute calibration site for radar altimeters in the continental domain: lake issykkul in Central Asia. J. Geod. 83, 723–735. doi: 10.1007/s00190-008-0289-7
Dettmering, D., and Bosch, W. (2010). Global calibration of jason-2 by multi-mission crossover analysis. Mar. Geod. 33(Suppl. 1), 150–161. doi: 10.1080/01490419.2010.487779
Dettmering, D., Schwatke, C., and Bosch, W. (2015). Global calibration of SARAL/AltiKa using multi-mission sea surface height crossovers. Mar. Geod. 38(Suppl. 1), 206–218. doi: 10.1080/01490419.2014.988832
Fu, L. L., and Haines, B. J. (2013). The challenges in long-term altimetry calibration for addressing the problem of global sea level change. Adv. Space Res. 51, 1284–1300. doi: 10.1016/j.asr.2012.06.005
Jiang, C. F., Lin, M. S., and Wei, H. (2019). A study of the technology used to distinguish sea ice and seawater on the haiyang-2A/B (HY-2A/B) altimeter data. Remote Sens. 11:1490. doi: 10.3390/rs11121490
Jiang, X., Jia, Y., and Zhang, Y. (2019). Measurement analyses and evaluations of sea-level heights using the HY-2A satellite’s radar altimeter. Acta Oceanol. Sin. 38, 134–139. doi: 10.1007/s13131-019-1503-6
Lin, M. S., and Jiang, X. W. (2014). “HY-2 ocean dynamic environment mission and payloads,” in Proceedings of the 2014 IEEE Geoscience and Remote Sensing Symposium, (Quebec City, QC: IEEE), 5167–5170.
Liu, Y. Y. (2014). Calibration Technology for HY-2 Radar Altimeter Sea Surface Height. Master’s thesis (in Chinese). Qingdao: Ocean University of China.
Mertikas, S. P., Daskalakis, A., Tziavos, I. N., Vergos, G., Fratzis, X., and Tripolitsiotis, A. (2015a). First calibration results for the SARAL/AltiKa altimetric mission using the gavdos permanent facilities. Mar. Geod. 1, 249–259. doi: 10.1080/01490419.2015.1030052
Mertikas, S. P., Zhou, X. H., Qiao, F. L., Daskalakis, A., Lin, M. S., Peng, H. L., et al. (2015b). First preliminary results for the absolute calibration of the chinese HY-2 altimetric mission using the CRS1 calibration facilities in west crete, Greece. Adv. Space Res. 57, 78–95. doi: 10.1016/j.asr.2015.10.016
Michaud, L., Roinard, H., Labroue, S., and Piras, F. (2019). Jason-3 GDR Quality Assessment Report Cycle 116. SALP-RP-JALT3-EX-23103-CLS116 (Edition 01.0). Available online at: ftp://avisoftp.cnes.fr/Niveau0/AVISO/pub/jason-3/gdr_d_validation_report (accessed December 29, 2020).
Passaro, M., Dinardo, S., Quartly, G. D., Snaith, H. M., Benveniste, J., Cipollini, P., et al. (2016). Cross-calibrating ALES envisat and CryoSat-2 delay-doppler: a coastal altimetry study in the indonesian seas. Adv. Space Res. 58, 289–303. doi: 10.1016/j.asr.2016.04.011
Peng, H. L. (2015). Research on Key Technology of HY-2A Satellite Radar Calibration. Master’s thesis (in Chinese). Qingdao: Ocean University of China.
Prandi, P., Philipps, S., Pignot, V., and Picot, N. (2015). SARAL/AltiKa global statistical assessment and cross-calibration with jason-2. Mar. Geod. 38(Suppl. 1), 297–312. doi: 10.1080/01490419.2014.995840
Tran, N., Labroue, S., Philipps, S., Bronner, E., and Picot, N. (2010). Overview and update of the sea state bias corrections for the jason-2, Jason-1 and TOPEX missions. Mar. Geod. 33(Suppl. 1), 348–362. doi: 10.1080/01490419.2010.487788
Wahr, J. M. (1985). Deformation induced by polar motion. J. Geophys. Res. Solid Earth 90, 9363–9368. doi: 10.1029/JB090iB11p09363
Watson, C., Coleman, R., White, N., Church, J., and Govind, R. (2003). Absolute calibration of topex/poseidon and jason-1 using GPS buoys in bass strait. australia special issue: jason-1 calibration/validation. Mar. Geod. 26, 285–304. doi: 10.1080/714044522
Yang, J. G., Zhang, J., and Wang, C. Y. (2019). Sentinel-3A SRAL global statistical assessment and cross-calibration with jason-3. Rem. Sens. 11:1573. doi: 10.3390/rs11131573
Yang, L., Xu, Y. S., Zhou, X. H., Zhu, L., Jiang, Q. F., Sun, H. W., et al. (2020). Calibration of an airborne interferometric radar altimeter over the qingdao Coast Sea, China. Rem. Sens. 12:1651. doi: 10.3390/rs12101651
Yang, L., Zhou, X. H., Lin, M. S., Lei, N., Mu, B., and Zhu, L. (2016). Global Statistical assessment of HY-2A altimeter IGDR data. Progr. Geophys (in Chinese) 31, 0629–0636. doi: 10.6038/pg20160216
Yang, L., Zhou, X. H., Mertikas, S. P., Lin, Z., Long, Y., and Ning, L. (2017). First Calibration results of jason-2 and Saral/AltiKa Satellite altimeters from the qianliyan permanent facilities. Adv. Space Res. 59, 2831–2842. doi: 10.1016/j.asr.2017.02.044
Yuan, J. J., Guo, J. Y., Liu, X., Zhu, C. C., Niu, Y. P., Li, Z., et al. (2020). Mean Sea surface model over china seas and its adjacent ocean established with the 19-year moving average method from multi-satellite altimeter data. Contin. Shelf Res. 192:104009. doi: 10.1016/j.csr.2019.104009
Keywords: GDR quality assessment, main HY-2B altimeter parameters, daily mean analysis, crossover analysis, wavenumber spectra of the SLA
Citation: Wang J, Xu H, Yang L, Song Q and Ma C (2021) Cross-Calibrations of the HY-2B Altimeter Using Jason-3 Satellite During the Period of April 2019–September 2020. Front. Earth Sci. 9:647583. doi: 10.3389/feart.2021.647583
Received: 30 December 2020; Accepted: 10 March 2021;
Published: 21 April 2021.
Edited by:
Cheinway Hwang, National Chiao Tung University, TaiwanReviewed by:
Tianhai Cheng, Institute of Remote Sensing and Digital Earth (CAS), ChinaMukesh Gupta, Catholic University of Louvain, Belgium
Copyright © 2021 Wang, Xu, Yang, Song and Ma. This is an open-access article distributed under the terms of the Creative Commons Attribution License (CC BY). The use, distribution or reproduction in other forums is permitted, provided the original author(s) and the copyright owner(s) are credited and that the original publication in this journal is cited, in accordance with accepted academic practice. No use, distribution or reproduction is permitted which does not comply with these terms.
*Correspondence: Lei Yang, bGVpeWFuZ0BmaW8ub3JnLmNu