 Qingzhi Zhu1*
 J. Kirk Cochran1*
 Christina Heilbrun1
 Hang Yin1
 Huan Feng2
 Joseph J. Tamborski3†
 Patrick Fitzgerald1
 Wen Cong1
- 1School of Marine and Atmospheric Sciences, Stony Brook University, Stony Brook, NY, United States
- 2Department of Earth and Environmental Studies, Montclair State University, Montclair, NJ, United States
- 3Department of Geosciences, Stony Brook University, Stony Brook, NY, United States
Loss of tidal wetlands is a world-wide phenomenon. Many factors may contribute to such loss, but among them are geochemical stressors such as exposure of the marsh plants to elevated levels on hydrogen sulfide in the pore water of the marsh peat. Here we report the results of a study of the geochemistry of iron and sulfide at different seasons in unrestored (JoCo) and partially restored (Big Egg) salt marshes in Jamaica Bay, a highly urbanized estuary in New York City where the loss of salt marsh area has accelerated in recent years. The spatial and temporal 2-dimensional distribution patterns of dissolved Fe2+ and H2S in salt marshes were in situ mapped with high resolution planar sensors for the first time. The vertical profiles of Fe2+ and hydrogen sulfide, as well as related solutes and redox potentials in marsh were also evaluated by sampling the pore water at discrete depths. Sediment cores were collected at various seasons and the solid phase Fe, S, N, C, and chromium reducible sulfide in marsh peat at discrete depths were further investigated in order to study Fe and S cycles, and their relationship to the organic matter cycling at different seasons. Our results revealed that the redox sensitive elements Fe2+ and S2– showed significantly heterogeneous and complex three dimensional distribution patterns in salt marsh, over mm to cm scales, directly associated with the plant roots due to the oxygen leakage from roots and redox diagenetic reactions. We hypothesize that the oxic layers with low/undetected H2S and Fe2+ formed around roots help marsh plants to survive in the high levels of H2S by reducing sulfide absorption. The overall concentrations of Fe2+ and H2S and distribution patterns also seasonally varied with temperature change. H2S level in JoCo sampling site could change from <0.02 mM in spring to >5 mM in fall season, reflecting significantly seasonal variation in the rates of bacterial oxidation of organic matter at this marsh site. Solid phase Fe and S showed that very high fractions of the diagenetically reactive iron at JoCo and Big Egg were associated with pyrite that can persist for long periods in anoxic sediments. This implies that there is insufficient diagenetically reactive iron to buffer the pore water hydrogen sulfide through formation of iron sulfides at JoCo and Big Egg.
Introduction
The worldwide loss of salt marsh wetlands has been linked to many factors, including sea level rise, coastal development, coastal eutrophication and geochemical stressors. Salt marshes need to accrete to keep pace as sea level rises. Marsh accretion is affected by growth of the plants, accumulation of organic matter and lithogenic particles and formation of authigenic phases (e.g., Fe2S) in marsh peat. Cycling of iron compounds, hydrogen sulfide (H2S) and nutrients N and P could provide stress on salt marsh plants. Hydrogen sulfide is known as a toxin to marsh plants (Kolker, 2005; Lamers et al., 2013; Alldred et al., 2020), and addition of nutrients and organic matter to marshes may enhance hydrogen sulfide production (Kolker, 2005). The input of iron particles on marsh may increase marsh accretion by reducing dissolved H2S and forming the mineral pyrite in the marsh. But previous results also imply that the marsh biomass could be degraded if iron in marsh is too high and causes removal of the nutrient phosphorus (Cochran et al., 2018). Therefore, understanding the distribution patterns and seasonal variations of iron and sulfide in salt marshes, as well as possible geochemical constraints on salt marsh loss, is critical for the study of marsh health and resiliency.
Iron (Fe) and sulfur (S) are two important redox-sensitive elements in salt marshes, their distribution patterns with depth reflect multiple biogeochemical reactions and processes in the deposits, for example, organic matter decomposition, sulfate reduction/sulfide oxidation, availability of reactive Fe, and accumulation rate of authigenic pyrite minerals (Berner, 1984; Canfield et al., 1992; Goldhaber, 2003; Jørgensen and Nelson, 2004; Jørgensen and Kasten, 2006; Aller et al., 2010; Luther et al., 2011). All these biogeochemical processes are closely coupled to the environment and ecosystem of salt marshes, including marsh peat degradation, accretion, biomass growth/decline, and species diversities (Luther and Church, 1988; Kostka and Luther, 1995; Sundby et al., 2003; Luo et al., 2017).
Particulate Fe is typically input to coastal marshes through wind-blown dust, river run-off, and tidal flooding. The oxidized Fe-containing mineral particles directly deposit on the marsh surface, and subsequently become involved in early diagenetic reactions in marsh peat. One important pathway for Fe cycling in marsh is microbial iron reduction, a common pathway of Fe3+-oxides reduction to Fe2+ by organic matters mediated by Fe3+-reducing microorganisms (Weiss et al., 2005; Luo et al., 2015, 2016, 2017). In sulfidic zones, Fe3+-oxide minerals can also abiotically react with sulfide to produce dissolved Fe2+, which subsequently react with sulfide, generating the authigenic minerals FeS and pyrite (FeS2) (Berner, 1970; Canfield, 1989; Kostka and Luther, 1995). Hydrogen sulfide in marsh pore water is generally produced from the reduction of sulfate by bacteria as organic matter is oxidized. Because of the large amount of labile organic matter in marshes (e.g., from marsh plants or combined sewer overflows), the active electron acceptors O2, nitrate/nitrite, Mn/Fe-oxide could be completely consumed by organic matter within a very thin surficial layer of the marsh peat, resulting in an anoxic sulfidic environment in most salt marshes. Under anoxic conditions, sulfate-reducing bacteria use SO42– as an electron acceptor for organic matter remineralization, generating H2S as one of the end products (Goldhaber, 2003; Jørgensen and Nelson, 2004). This anaerobic respiration process often dominates in organic matter-rich salt marshes, resulting in high concentrations of dissolved sulfide at millimolar (mM) levels (Bagarinao, 1992). H2S, one specie of the total dissolved sulfide (ΣH2S = [H2S] + [HS–] + [S2–]), is harmful to marsh plants such as Spartina alterniflora. Long-term exposures to levels greater than ∼4 mM H2S in marsh pore water can cause plant die-off, and subsequent peat degradation and subsidence (Kolker, 2005; Cochran et al., 2013; Lamers et al., 2013).
Typically, the intense redox reactions and precipitation/dissolution reactions in the surficial marsh peat generate sharp gradients of Fe2+ and H2S in marsh pore water. The H2S concentrations can increase from 0 to several mM over depths of millimeters to centimeters, with the concentrations of Fe2+ changing by several hundred micromolar (μM). The compositional changes with depth in deposits are usually assumed steady and to occur in an overall average vertical progression. However, the growth of marsh plants and the activities of dwelling fauna can generate significant heterogeneity and complex three dimensional reaction patterns of Fe and S over millimeter to meter scales due to plant rhizosphere development, oxygen transport through roots, burrow construction, and bioirrigation (Aller, 1982, 2001; Sundby et al., 2003; Weiss et al., 2005). The seasonal cycling of Fe and S in salt marsh sediments have been reported (Luther et al., 1986; Kostka and Luther, 1995; Luo et al., 2017), and 2-D distributions of dissolved Fe2+ and H2S in coastal marine sediments have also been discussed elsewhere (Zhu and Aller, 2012, 2013; Yin et al., 2017). However, the small scale 2-D distribution patterns of dissolved Fe2+ and H2S associated with the plant rhizosphere in salt marshes have not been investigated so far. In situ measurements of real-time, high-resolution 2-D distributions of H2S and Fe2+ around plant roots may provide insight into the nature of interactions between the oxygen, iron, and sulfur cycles in marsh plant rhizosphere.
Jamaica Bay, New York has suffered considerable loss of salt marsh acreage over the past ∼50 years. A large unrestored marsh island JoCo and a partially restored marsh island Big Egg were selected as study sites in this work. We noted that the H2S levels at JoCo marsh could be elevated to >6 mM in summer and fall, but marsh plants grow well and it’s still considered as a “healthy” marsh. On the other hand, marsh in the unrestored part of Big Egg seems to be worse, even the H2S level is lower than JoCo. We hypothesize: (1) a complicated and time-dependent 3-D distribution pattern of low level dissolved H2S and Fe2+ (cold-spots) around individual plant roots can be generated by oxygen transport/leakage from roots, and (2) the cold-spots/oxic layers formed around roots help marsh plants to survive in the high levels of H2S by reducing sulfide absorption. Accordingly, we collected pore water samples with “sippers”– short tubes that are emplaced to various depths in the peat and through which pore water is drawn into an evacuated syringe, complemented this approach with chemical sensors that provide in situ high-resolution mapping linking the structure of marsh peat with spatial and temporal patterns of H2S and Fe2+ concentrations, and collected marsh peat cores to study the distributions of Fe, S, N, C, and chromium reducible sulfur (CRS) in marsh peat solid phase. Our goal is to characterize the significant geochemical heterogeneities of Fe and S in marsh pore water and peat, seasonal variation and the interactions of these solutes in marsh pore water, the characterization of elevated pore water levels of the phytotoxin H2S, and the effects of the redox cycles of Fe and S on the solid phase reservoirs of these elements.
Materials and Methods
Sample Sites
Jamaica Bay is a heavily urbanized estuary (∼80 km2) located primarily between the New York City boroughs of Brooklyn and Queens, with a connection to the Atlantic Ocean through Rockaway Inlet (Figure 1). The Bay, consisting of over a dozen isolated marsh islands and a labyrinth of waterways, has been characterized as a eutrophic estuary with water salinity in the range of 20–26 PSU, temperature 1–26°C, and pH 6.8–9, respectively [USFWS (U.S. Fish and Wildlife Service), 1997]. Some of the marsh islands are natural, but many of them have been restored through engineering efforts. The dominant plant species in the low salt marsh is saltmarsh cordgrass, S. alterniflora, and in the high salt marsh is salt meadow cordgrass, Spartina patens. These salt marshes provide critical ecological services, including habitat and food sources for wildlife, shoreline erosion control, and water column filtration, as well as serve as a buffer against storm tides and waves (New York City Department of Environmental Protection, 2007a, b; Marsooli et al., 2017). However, Jamaica Bay’s salt marsh losses have been severe; about 60% of the Bay’s salt marsh has converted into mudflats since 1951, with smaller islands losing up to 78% of their vegetation cover, due to a combination of factors including sediment load reduction, dredging, boat traffic, sea level rise, nutrient enrichment and H2S concentration increase (Rafferty et al., 2010; Campbell et al., 2017). The nutrient load of the Bay from sewage treatment plant effluent and combined sewer overflows is thought to be an important factor that may contribute to this high rate of marsh loss in recent years (Deegan et al., 2012).
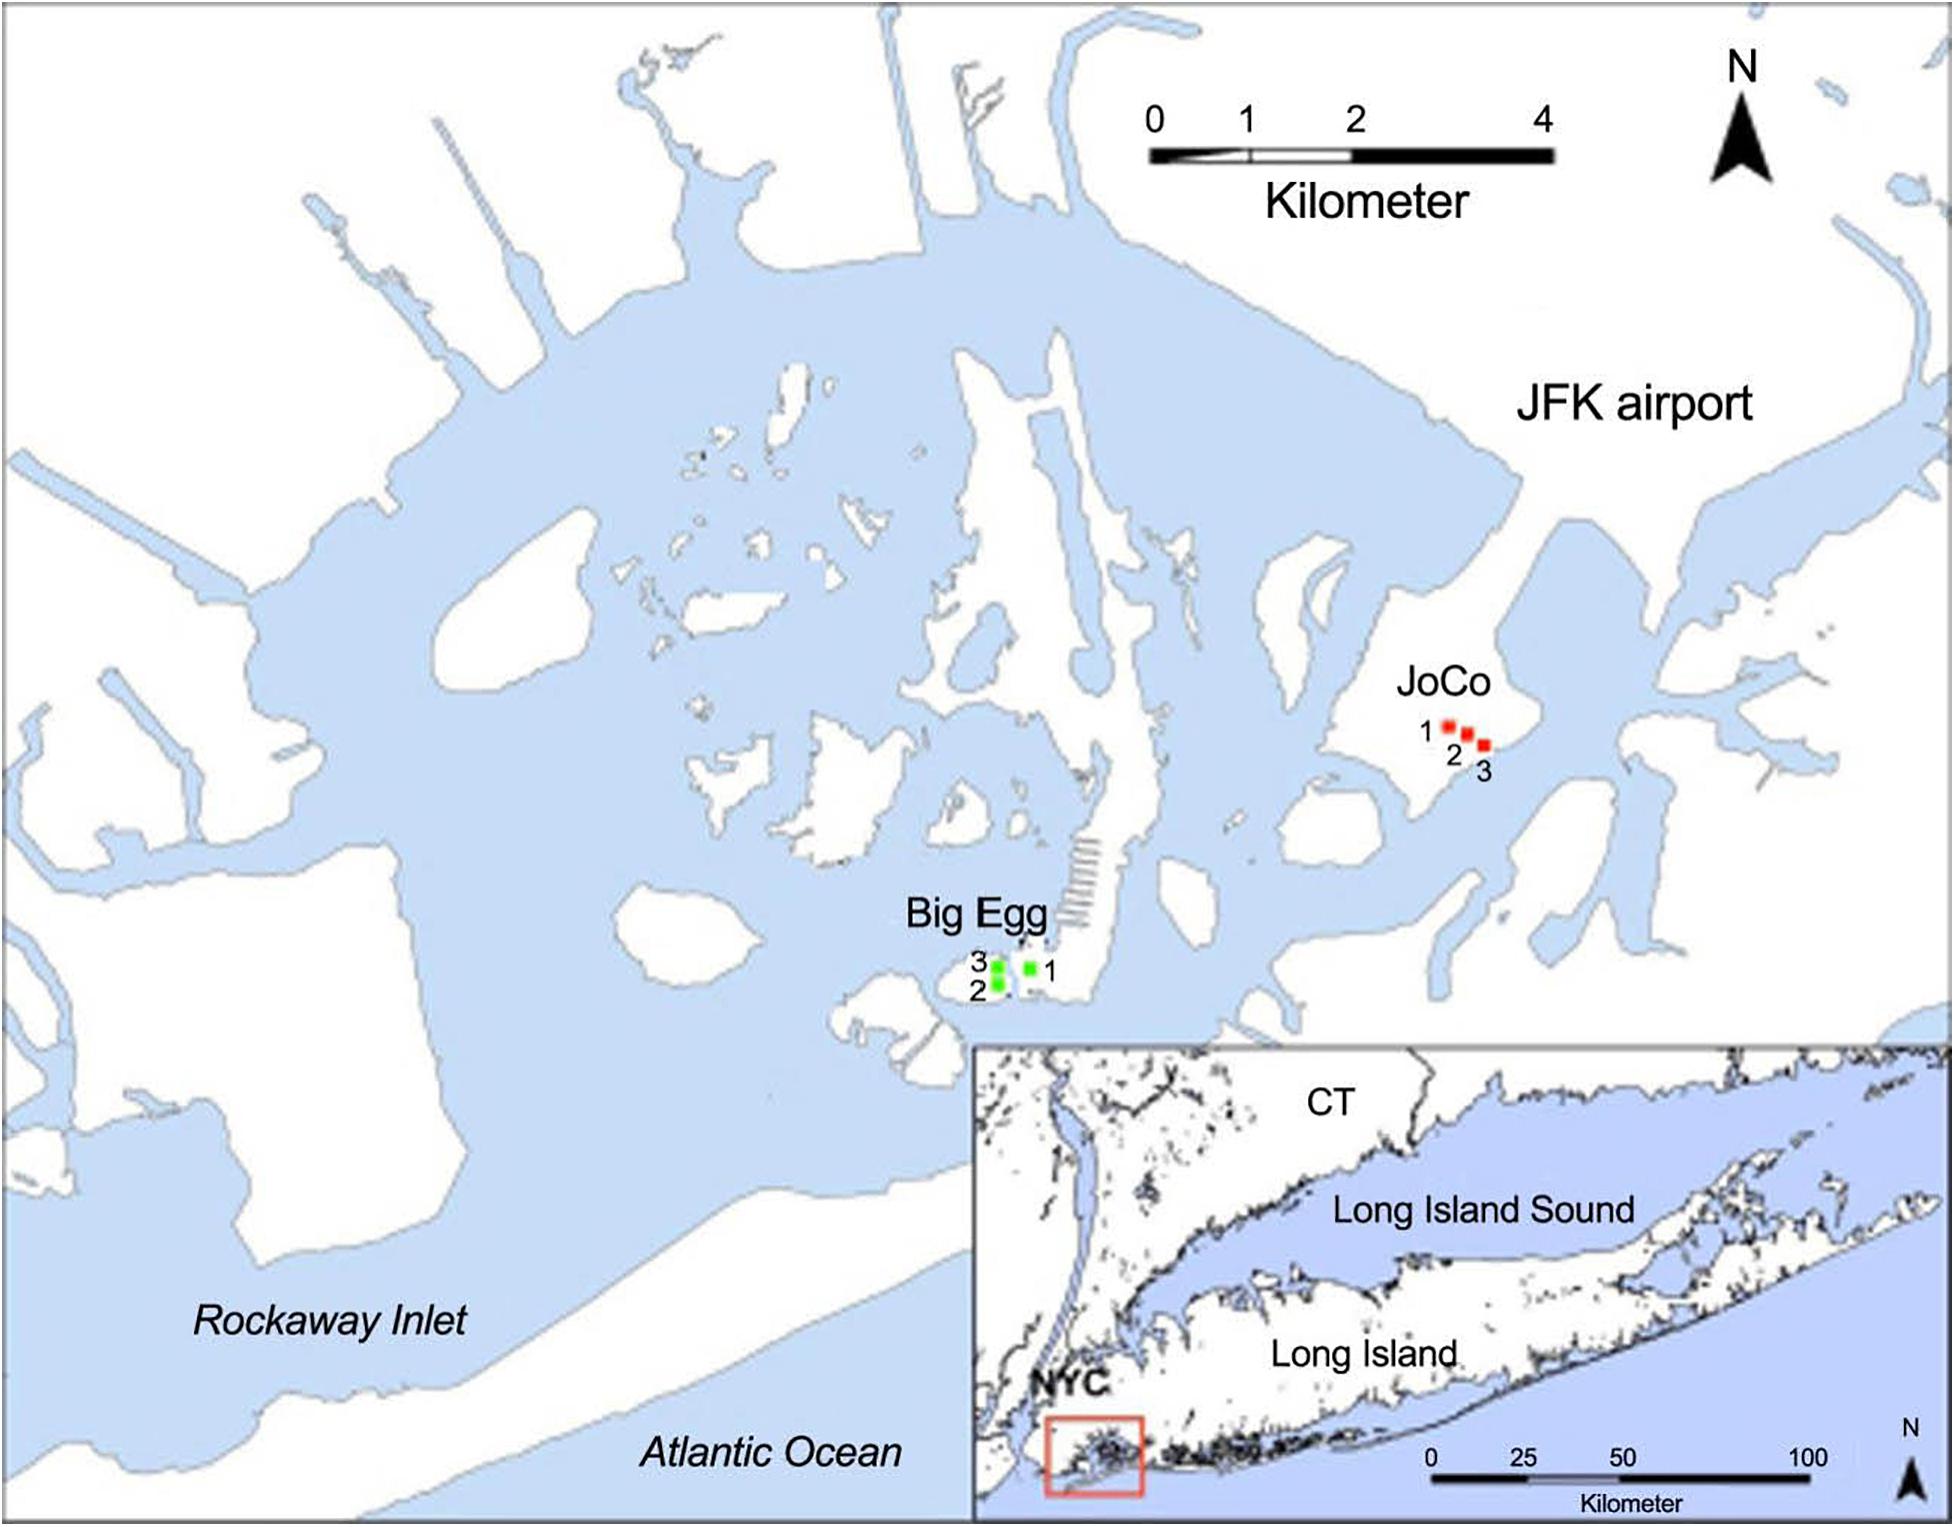
Figure 1. Location of Jamaica Bay and the sampling sites at Big Egg (BE) and JoCo (JC). The GPS coordinates of sampling sites are BE1 (40.59604N, 73.82637W; restored in 2003), BE2 (40.59586N, 40.59586W), BE3 (40.59607N, 73.82812W), JC1 (40.61241N, 73.78779W), JC2 (40.61212N, 73.78724W), and JC3 (40.61173N, 73.78591W), respectively. Modified from Tamborski et al. (2017). Service Layer Credits: Source: Esri, DigitalGlobe, GeoEye, Earthstar Geographics, CNES/Airbus DS, USDA, USGS, AeroGRID, IGN, and the GIS User Community.
Jamaica Bay has a mean semi-diurnal tidal range of approximately 1.5 m, the investigated marsh sites are all inundated during high tide. Two marsh sites were studied in the present work: one is a natural salt marsh, JoCo (JC), which is considered a “healthy” marsh, and the other is a partially restored salt marsh, Big Egg (BE). Three sampling sites were established in each marsh. One of the three sites at Big Egg (BE1) was previously restored by spraying sandy sediment from the adjacent channel onto the marsh surface as part of a restoration effort in 2003 (Frame et al., 2006), but the remaining two sites (BE2 and BE3) have not yet been restored. The two marshes are dominated by S. alterniflora, while JoCo has a mixture of marsh grasses that includes Spartina patens, a high marsh species. JoCo experienced a marsh loss of approximately 7% between 1974 and 1999, while losses at Big Egg were up to 38% (NYSDEC, 2006).
Pore water samples, solid marsh cores, and sensor deployment in JoCo were taken on October 10, 2014, May 1, 2015 and September 9, 2015 and April 22, 2016, respectively. In Big Egg sites, they were taken on October 8, 2014, April 13, 2015, September 25, 2015, and April 15, 2016, respectively.
Discrete Pore Water Sampling and Measurements
Discrete pore water samples were taken using pore water “sippers” at depths of 5, 10, 15, and 25 cm in the marsh peat. The sippers are hollow acrylic rods that end in a small opening. Each sipper is connected to Tygon tubing which can be connected to a 50 ml plastic syringe. A valve connected to the Tygon tubing between the syringe and the sipper facilitates purging of the syringe. Pore water samples of ∼50 ml were slowly drawn into the syringe through the sipper, and immediately filtered in the field through 0.45 μm filters. Aliquots for dissolved sulfide, nutrients, and trace elements were collected. The sulfide aliquots were fixed in the field by adding 0.5 ml of 0.05 M Zn(C2H3O2)2.2H2O to each sample, the Fe2+ aliquots were stabilized by acidification. The concentrations of dissolved sulfide, nutrients (NH4+ and HPO42–) and dissolved Fe2+ in these discrete pore water samples were subsequently measured in lab.
Total dissolved sulfide (as ΣH2S = [H2S] + [HS–] + [S2–]) and ammonium were measured using techniques described by Kolker (2005) and Cochran et al. (2013). Briefly, total sulfide was measured by spectrometric method (Cline, 1969; Reese et al., 2011) with relative standard deviation (RSD) < 5%. Ammonium and phosphate were measured using a Lachat Nutrient Autoanalyzer with RSD ± 5%, and dissolved Fe2+ was determined by spectrometric method described by Stookey (1970). Pore water pH and Eh (ORP; Oxidation-Reduction Potential) were measured in the field with a YSI 1009-1 09C multi-parameter probe that measured pH on the total H+ scale and used a Pt electrode for Eh. Salinity values were determined in the laboratory through measurement of chloride or with a refractometer.
In situ Measurements of 2-D Pore Water H2S and Fe2+ Using Optical Planar Sensors
2-D distributions of dissolved Fe2+ in pore water were measured in situ by deploying optical planar Fe2+ sensors in salt marsh. The irreversible planar sensor of dissolved Fe2+ was fabricated with ferrizone as the optical indicator that was immobilized in polyurethane hydrogel (D4) membrane, modified from our previous publication (Zhu and Aller, 2012). The blank Fe2+ sensor film was colorless and transparent, and it rapidly converted to a violet-red color with maximum absorption wavelength at 562 nm after the sensor film was exposed to dissolved Fe2+ solution. The sensor response range depends on the sensor deployment time in Fe2+ solution, and the sensor showed a good linear response in the range of 0–200 μmol/L of Fe2+ with the limit of detection of 5 μmol/L when a 10 min deployment time was applied. A short sensor deployment time was used when Fe2+ concentration was higher than 200 μmol/L, and the sensor could respond to dissolved Fe2+ as high as 1 mmol/L when it was deployed in the sample for 1 min. In this work, 1–10 min Fe2+ sensor deployment time in salt marsh was used, depending on the Fe2+ concentration in the marsh pore water.
The sensor film sheet (14 cm × 20 cm) was cut into five sensor film stripes with dimension of 2.8 cm × 20 cm, four strips were used for in situ deployment and one for calibration. The sensor film strip was mounted on a 5 cm × 40 cm × 1 cm (width × length × thickness) polycarbonate plastic sheet with a beveled end. In situ measurements were performed at low tide by inserting/punching the plastic sheet with attached sensor strip vertically into the salt marsh peat (Figure 2) and allowing it to react with dissolved Fe2+ in pore water for 1–10 min. After the reaction, the sensor film was pulled out of the marsh and rinsed with seawater. The color-developed Fe2+ sensing film was then wrapped with a paper towel and brought back to the laboratory for imaging. In situ measurements were duplicated at each marsh sample site. After return to the laboratory, the sensor films were calibrated with identical response time by using Fe2+ standards prepared in seawater which was collected from the same sample site. The colored Fe2+ sensor strips were imaged by a flat scanner (Canon), and all color images were analyzed with Maxim DL image processing software version 2.0X (Diffraction Limited) and Image-Pro plus version 4.1 for Windows (Media Cybernetics). The isolated green bands of the color images were used to calculate the absorbance within individual pixels. In situ measurements of 2-D Fe2+ distributions in pore water were conducted at October 2014, April 2015, and September 2015.
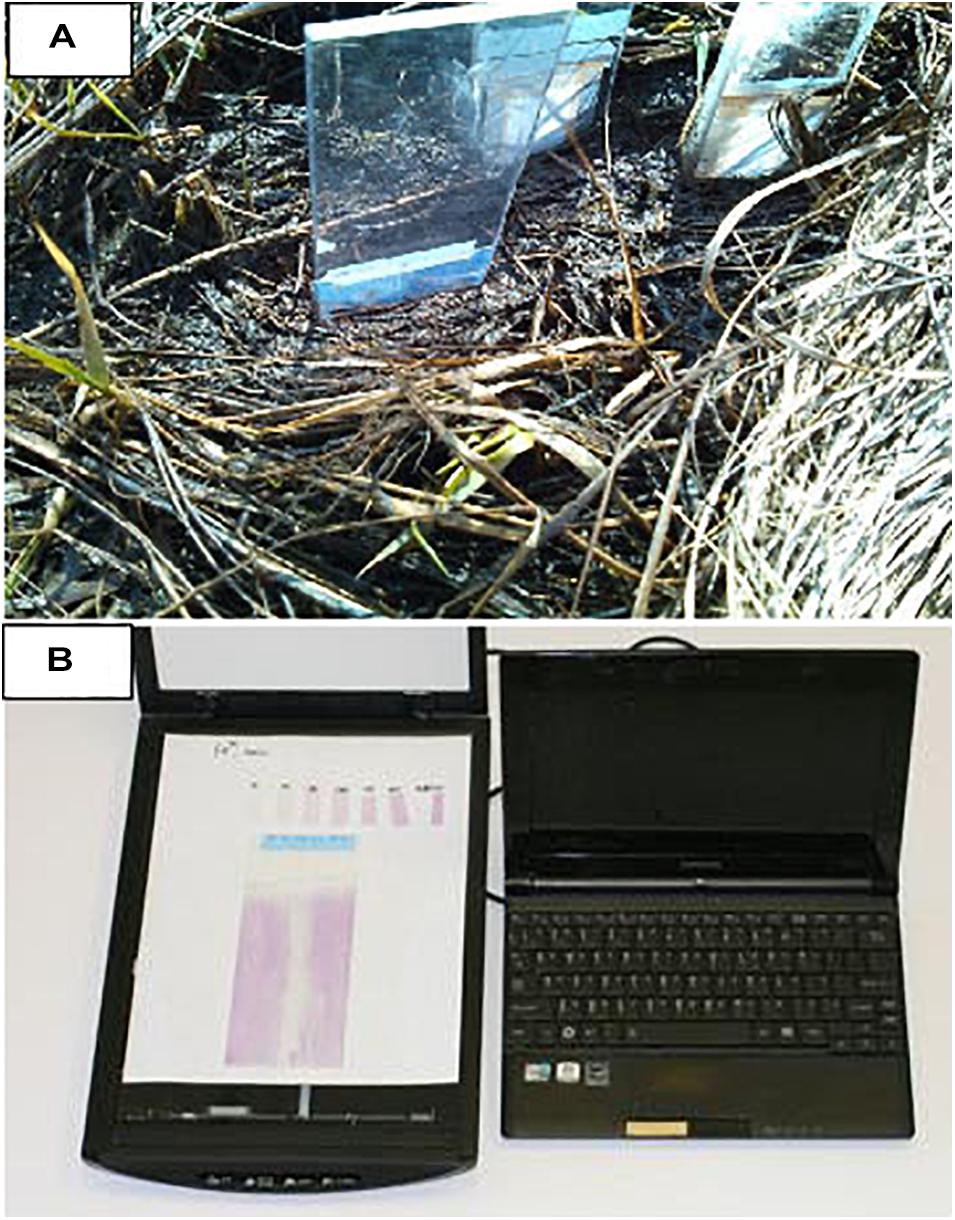
Figure 2. (A) In situ deployment of planar optical sensors of Fe2+ and H2S in salt marshes. The sensor sheet strip was mounted on a polycarbonate plastic sheet with a beveled end and inserted into the marsh for a certain time. (B) The 2-dimensional sensing image associated with calibration strips was recorded with a flat scanner (Canon). Reprinted from Encyclopedia of Ocean Sciences, 3rd edition, vol. 4. Zhu Q., In situ Planar Optical Sensors for Sediment Diagenesis Study, pp. 147–156, Copyright 2019, with permission from Elsevier.
2-D distributions of dissolved H2S in salt marshes were measured by two different optical planar H2S sensors. The 2-D H2S distributions in the October 2014 samples were measured by a fluorescence planar sensor in box cores which were collected from each site and incubated/re-equilibrated with seawater (collected from the same site) in the laboratory for 24 h at room temperature (22°C) with constant aeration of overlying water. The fluorescence H2S planar sensor sheet was prepared by non-covalently immobilizing H2S fluorescence indicator pyronin in an ethyl cellulose polymer membrane on a transparent polyester sheet, and coating with a layer of gas permeable silicone (Zhu and Aller, 2013). The fluorescence sensor responded well to dissolved H2S in the range of non-detectable to 3.15 mmol/L with detection limit 40 μmol/L dissolved H2S. The sensor response time was about 60 s, and it was very suitable for H2S quantification in highly sulfidic salt marshes. However, it was only a moderately reversible fluorescence sensor, losing its response after 5–6 measurement cycles (Zhu and Aller, 2013). The sensor film was cut into the strips of 3 cm × 15 cm for the following 2-D measurement: an H2S sensor strip was installed on the inside of the front face of the box corer and sensing membrane contacted to the marsh sediment. The bottom of the box core was tightly sealed. After 24 h incubation, the fluorescence image of the H2S sensor strip was taken at 577 nm (±10 nm) with excitation wavelength at 554 nm by using our home-made imaging system (Zhu and Aller, 2013). Image analysis and data calculations were performed with Maxim DL image processing software version 2.0X (Diffraction Limited) and Image-Pro plus version 4.1 for Windows (Media Cybernetics). Images were split into blue, green and red bands and the red band was used to calculate the intensities of individual pixels.
2-D H2S distributions in other seasons, April 2015 (spring) and September 2015 (late summer), were obtained by in situ deployments using an irreversible H2S colorimetric planar sensor that was prepared from diphenylcarbazone-Zn2+ complex in polyurethane hydrogel (D4) on a transparent polyester sheet, covered by a gas permeable silicone membrane to eliminate possible interfering hydrated ions. The blank sensor film showed a dark purple color with a maximum absorbance at 530 nm, and the sensor absorbance was inversely correlated with dissolved H2S concentration in the range of 5–4,000 μmol/L (Yin et al., 2017). A 3.5 cm × 20 cm H2S sensor film was mounted on one side of a 5 cm × 40 cm × 1 cm (width × length × thickness) polycarbonate plastic sheet with a beveled end, and the deployment method was the same as 2-D Fe2+ in situ measurement as described above. Response time of the H2S sensor in marsh was 1–10 min (depend on the H2S concentration in the marsh). After the reaction, the sensor film was pulled out of the sediment and rinsed with seawater. The color-changed sensing film was scanned within 20 min in the field by using a flat scanner (Canon). After return to the lab, the H2S sensor responses were calibrated for identical response times by using H2S standard solutions prepared from sodium sulfide in pH < 4 solutions. All color images, including sample sensing images, were analyzed with Maxim DL image processing software version 2.0X (Diffraction Limited) and Image-Pro plus version 4.1 for Windows (Media Cybernetics). The isolated green bands of the color images were used to calculate the absorbance within individual pixels.
Solid Phase Geochemistry
Cores for solid phase geochemistry (sulfur and iron) were taken by carefully inserting an aluminum tube (i.d., 7 cm) into the marsh peat. After the tube was positioned on the marsh surface, vertical cuts were made around the perimeter to minimize compaction as the core was inserted. Immediately after return to the laboratory, the cores were frozen. They were later defrosted only enough to permit the sediment to be extruded and then were sectioned into 1–2 cm intervals. The JoCo sediment cores had more peat and roots whereas the Big Egg sediment cores had fewer large roots and more mud. Small aliquots of sediment were removed from each section for solid phase geochemistry and the remainder was weighed, dried, weighed again to determine water content and then ground to a powder. Solid phase reactive iron was measured by leaching ∼50 mg of dried sediment in 1 N HCl for 24 h at room temperature. Total Fe in the leach solution was measured colorimetrically using the ferrozine method (Stookey, 1970). Sulfur was measured in two pools—chromium reducible sulfides (CRS, dominantly pyrite, and FeS2) and total sulfur, as described in Kolker (2005) and Cochran et al. (2013).
Results
The high resolution 2-D Fe2+ and 2-D H2S distribution patterns revealed by optical sensors in the six sampling sites in Big Egg (BE) and JoCo (JC) are shown in Figures 3–8. Vertical profiles of dissolved H2S and Fe2+ at each site were calculated by averaging the data across each horizontal pixel layer.
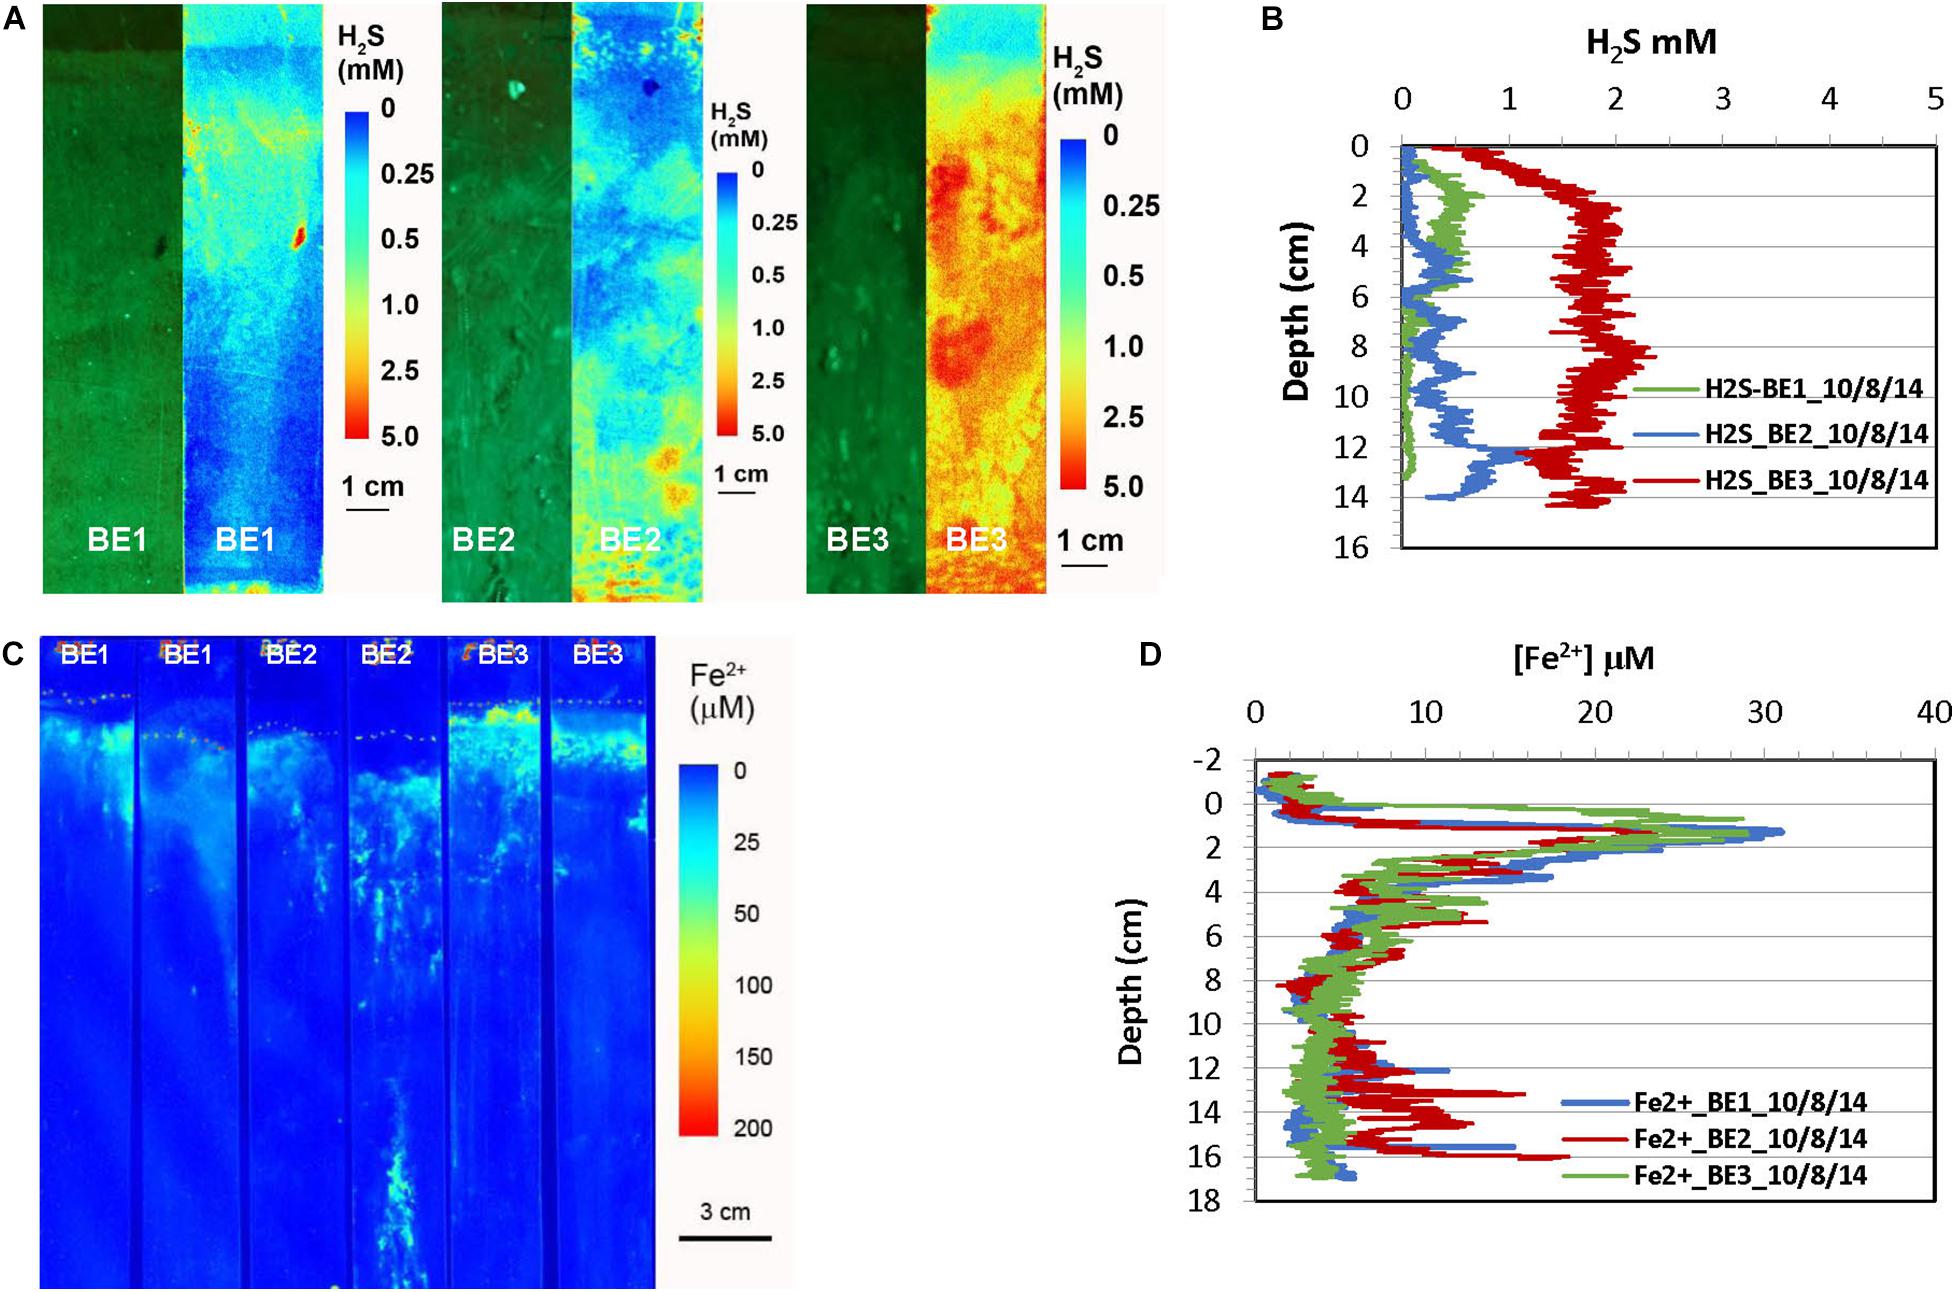
Figure 3. H2S and dissolved Fe2+ distribution patterns in the pore water of Big Egg (BE) marsh peats in fall 2014. (A) 2-D H2S distribution patterns in the sediments, which were incubated 1 day in lab before H2S imaging. The green panels are physical image of sediments and the color panels (pseudo color) are corresponding 2-D H2S distributions. (B) Vertical H2S profiles averaged from each 2-D H2S distribution in panel (A). (C) 2-D Fe2+ distribution patterns which were obtained by in situ deployments; dotted line marks the peat surface. (D) Vertical Fe2+ profiles averaged from each 2-D Fe2+ distributions in panel (C).
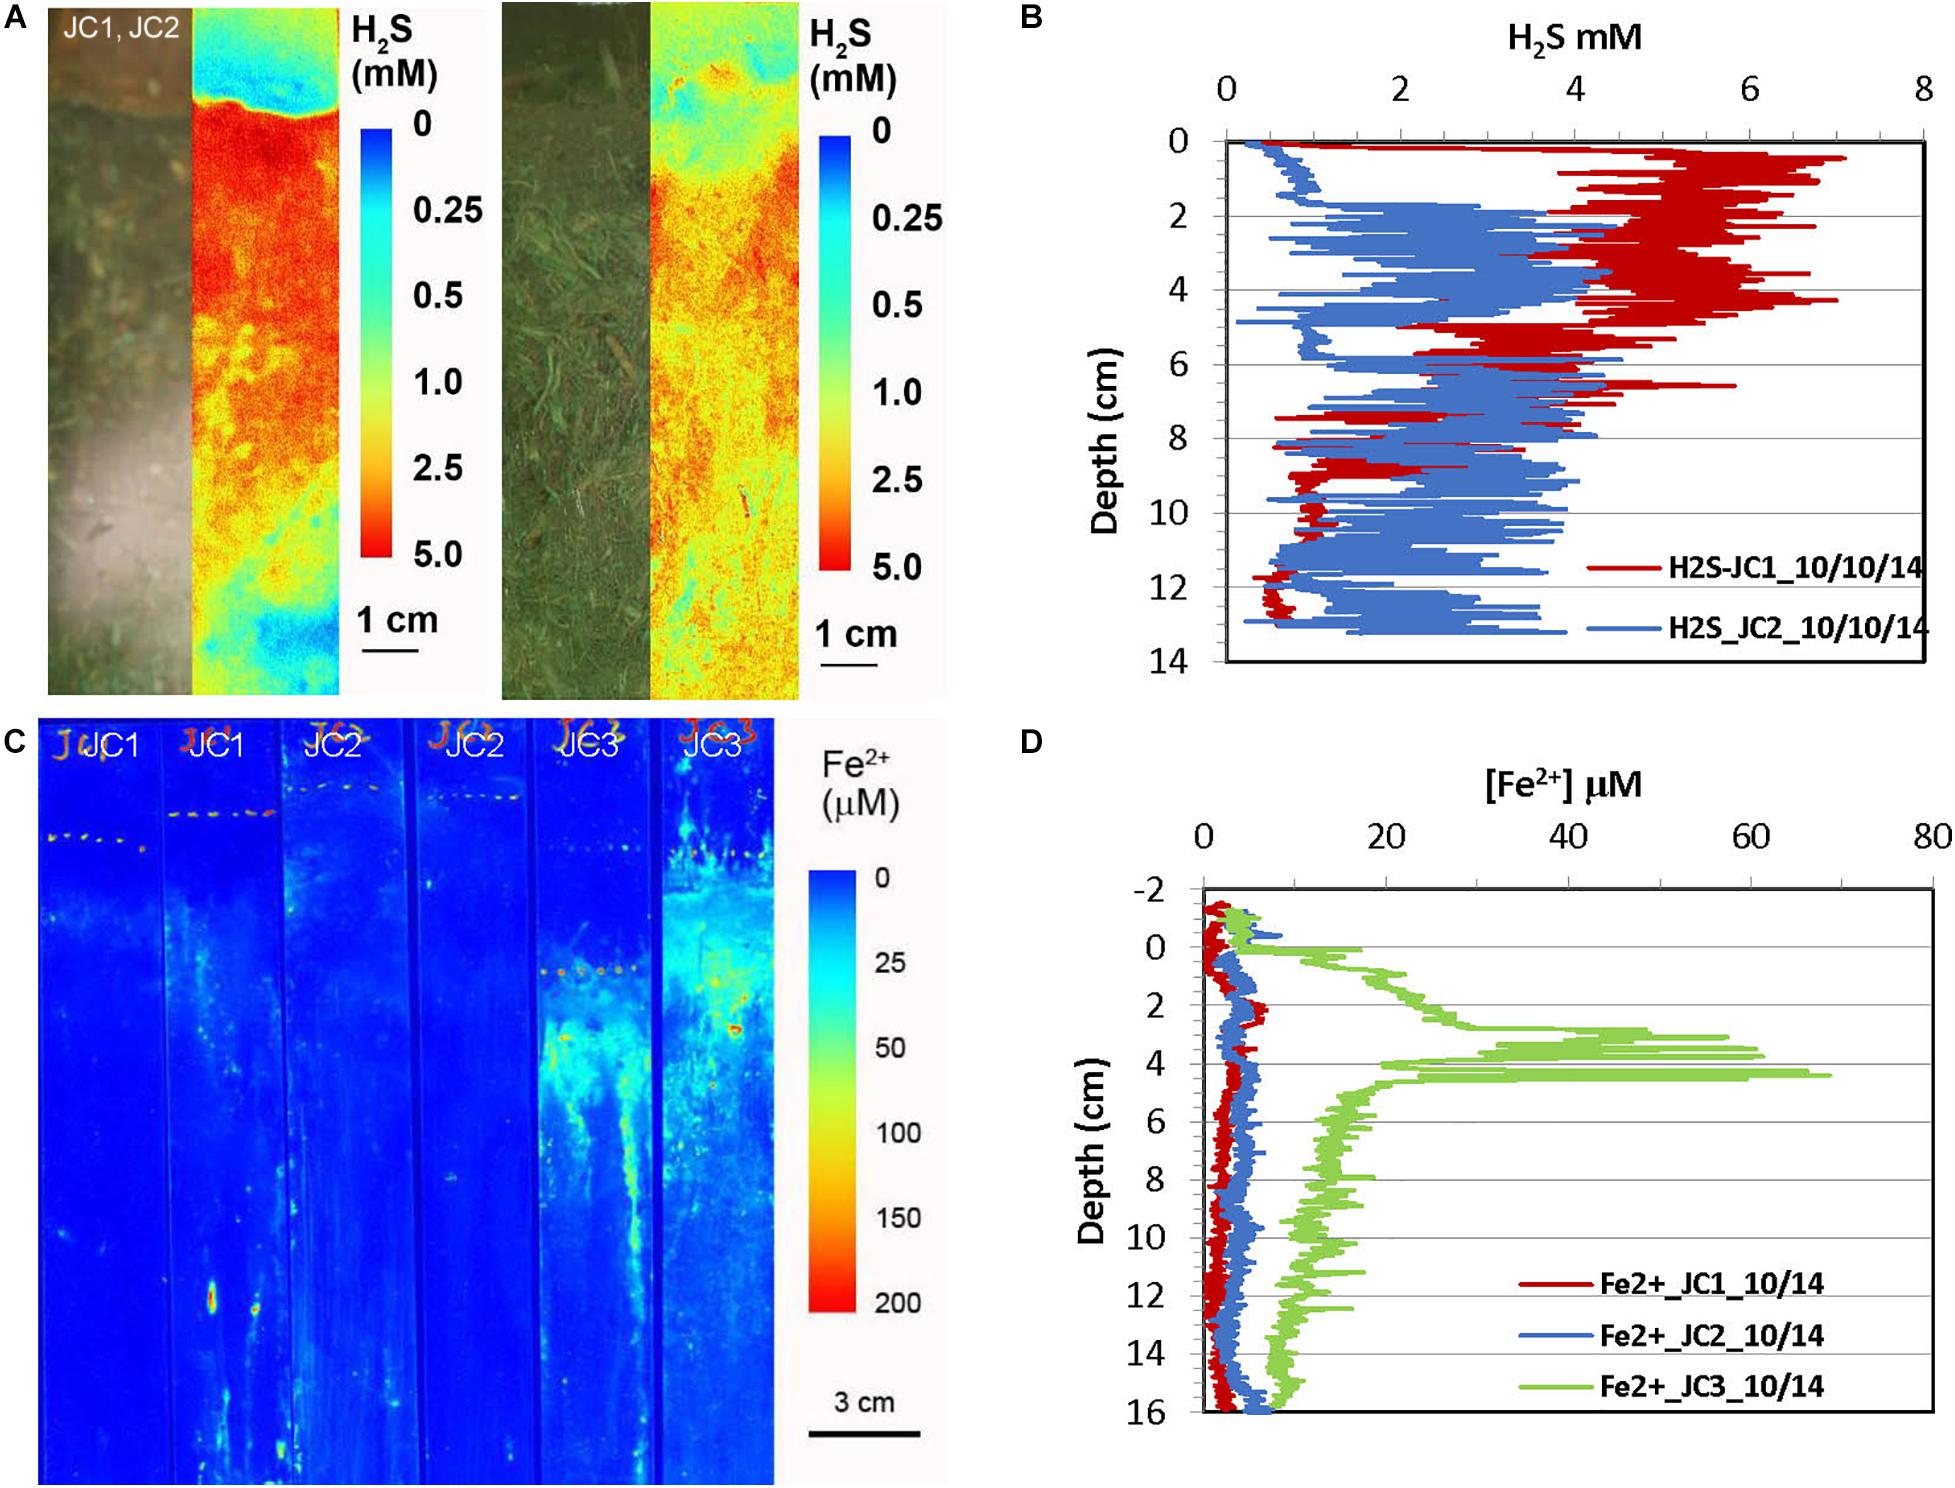
Figure 4. H2S and dissolved Fe2+ distribution patterns in the pore water of JoCo (JC) marsh peats in fall 2014. (A) 2-D H2S distribution patterns in the sediments which were incubated for 24 h in lab before H2S imaging. The green panels are physical image of sediments and the color panels (pseudo color) are corresponding 2-D H2S distributions. (B) Vertical H2S profiles averaged from each 2-D H2S distribution in panel (A). (C) In situ 2-D Fe2+ distribution patterns which were obtained by in situ deployments; white line marks the peat surface. (D) Vertical Fe2+ profiles averaged from each 2-D Fe2+ distributions in panel (C).
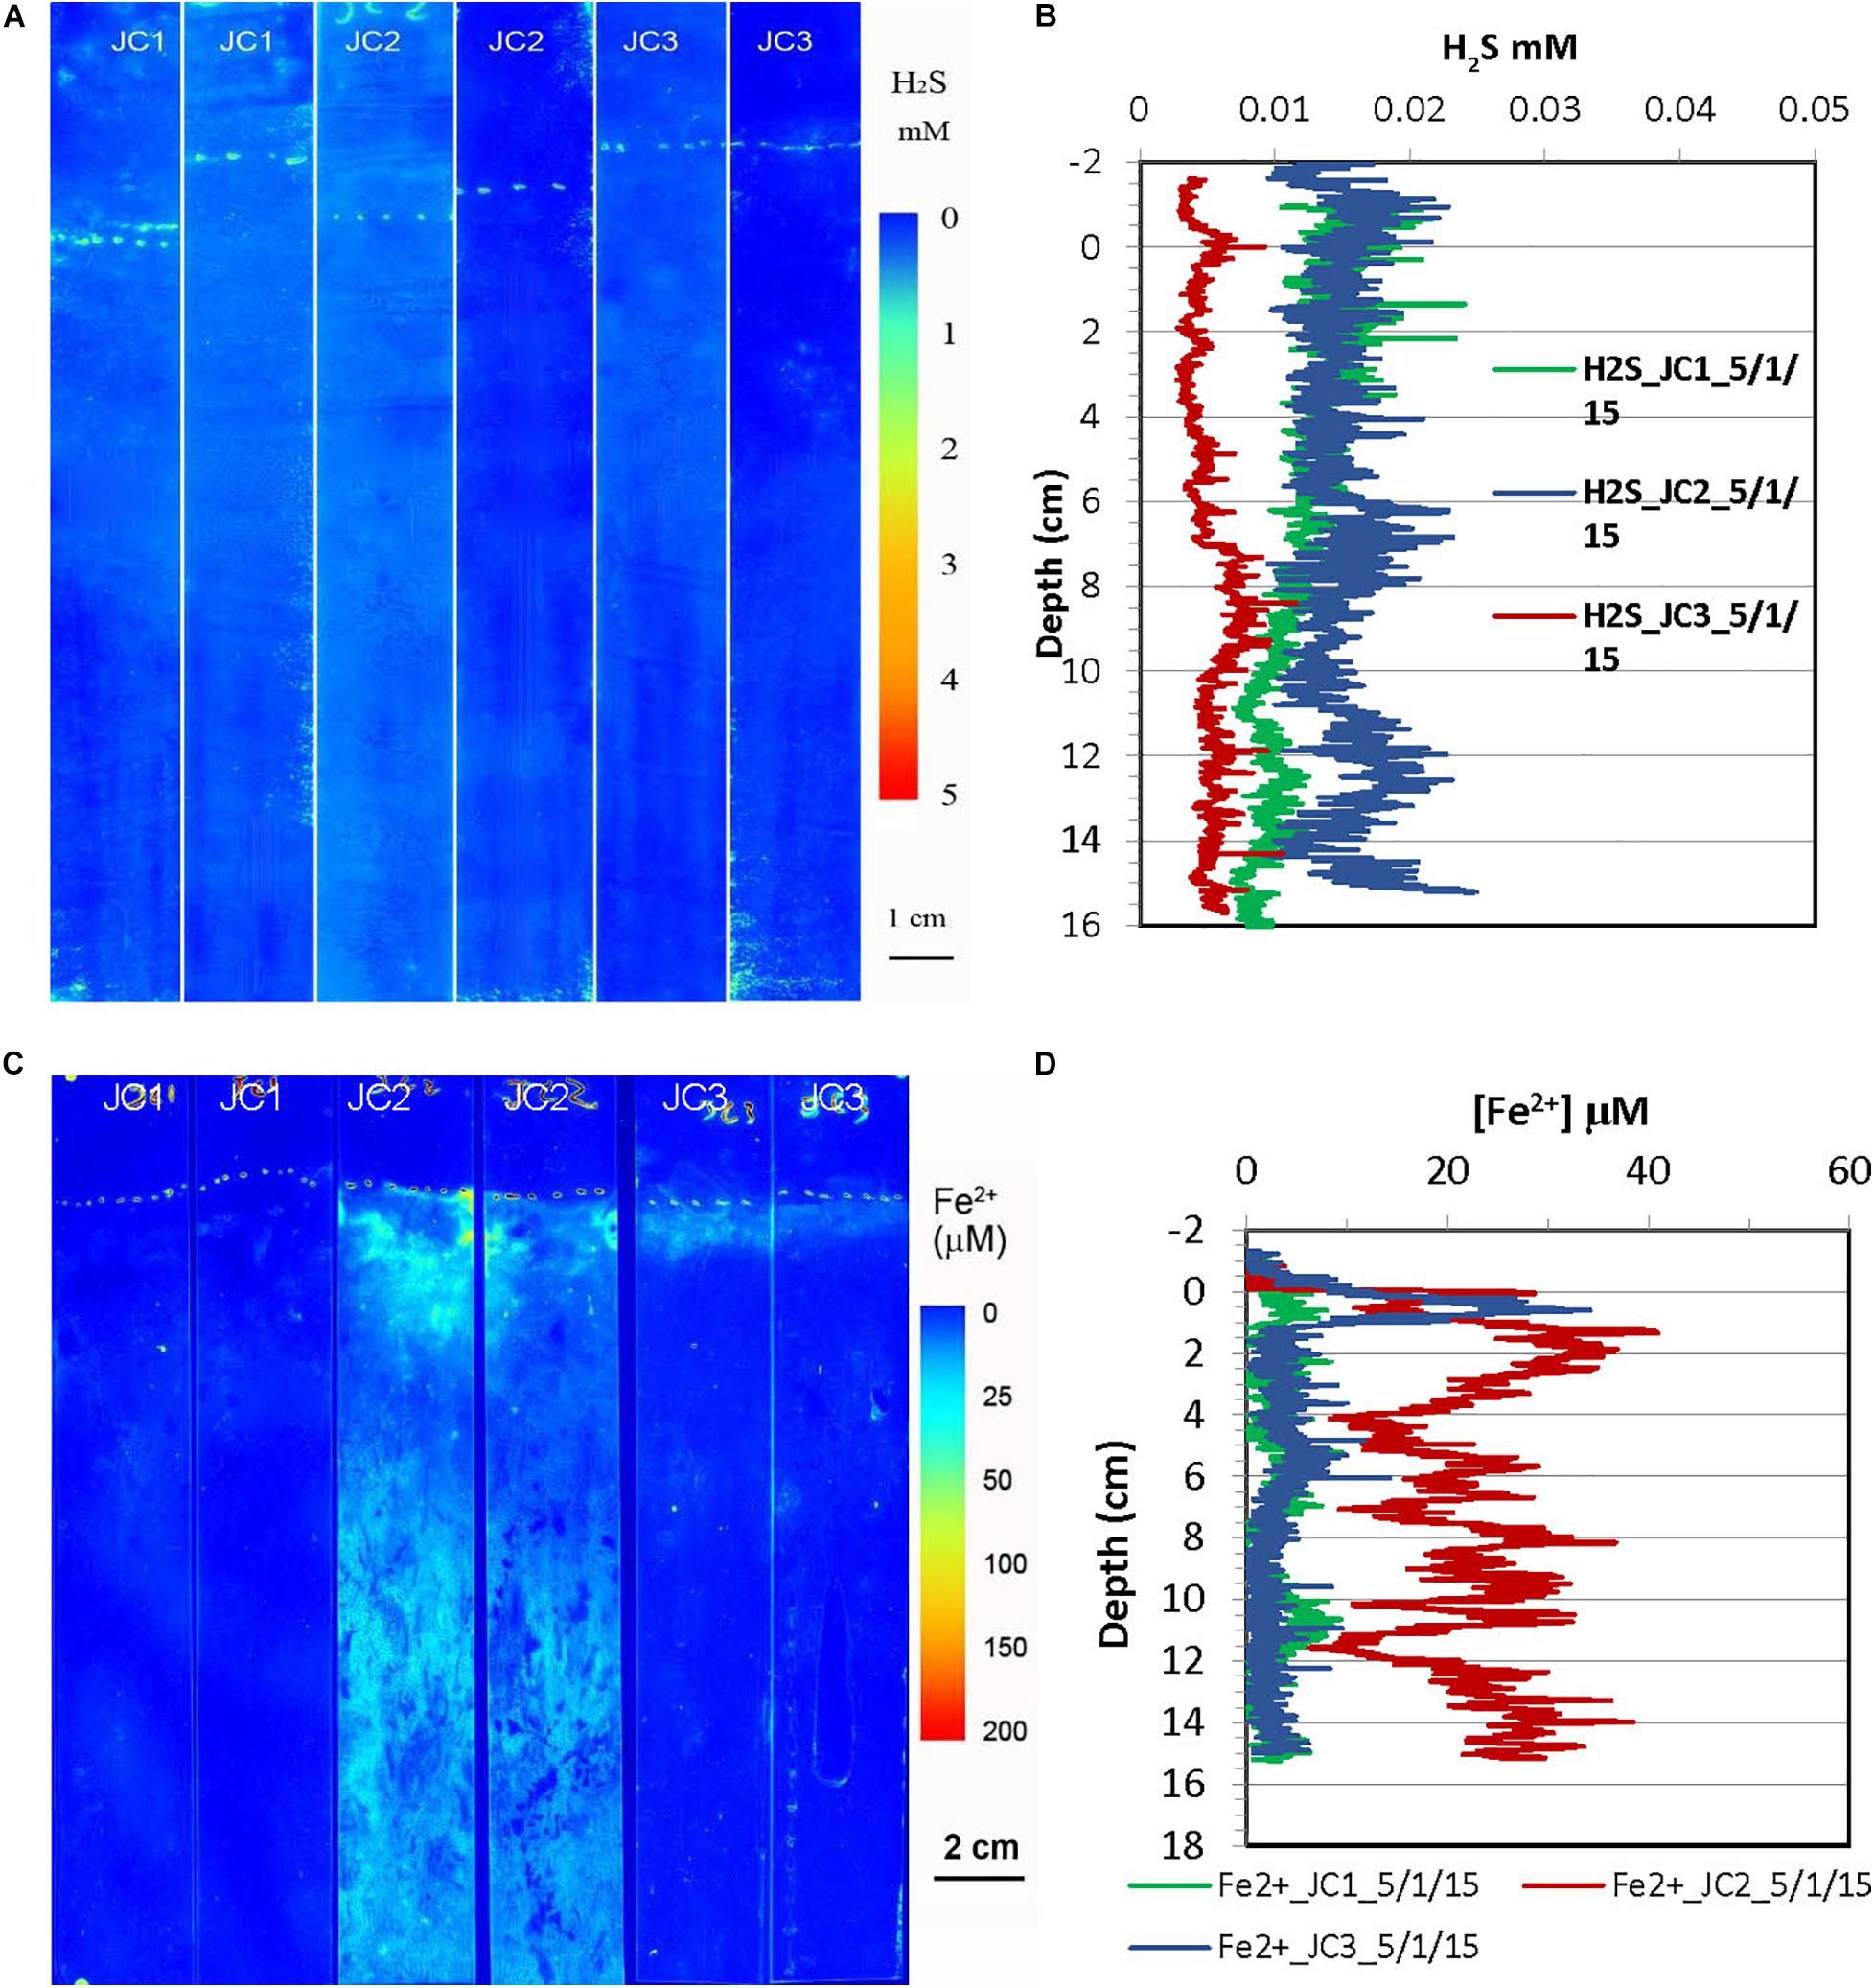
Figure 5. H2S and dissolved Fe2+ distribution patterns in the pore water of JoCo (JC) marsh peats in spring 2015. (A) 2-D H2S distribution patterns (pseudo color) obtained by in situ measurements in sediments; white line marks the peat surface. (B) Vertical H2S profiles averaged from each 2-D H2S distribution in the panel (A). (C) 2-D Fe2+ distribution patterns obtained by in situ deployments; white line marks the peat surface. (D) Vertical Fe2+ profiles averaged from each 2-D Fe2+ distributions in the panel (C).
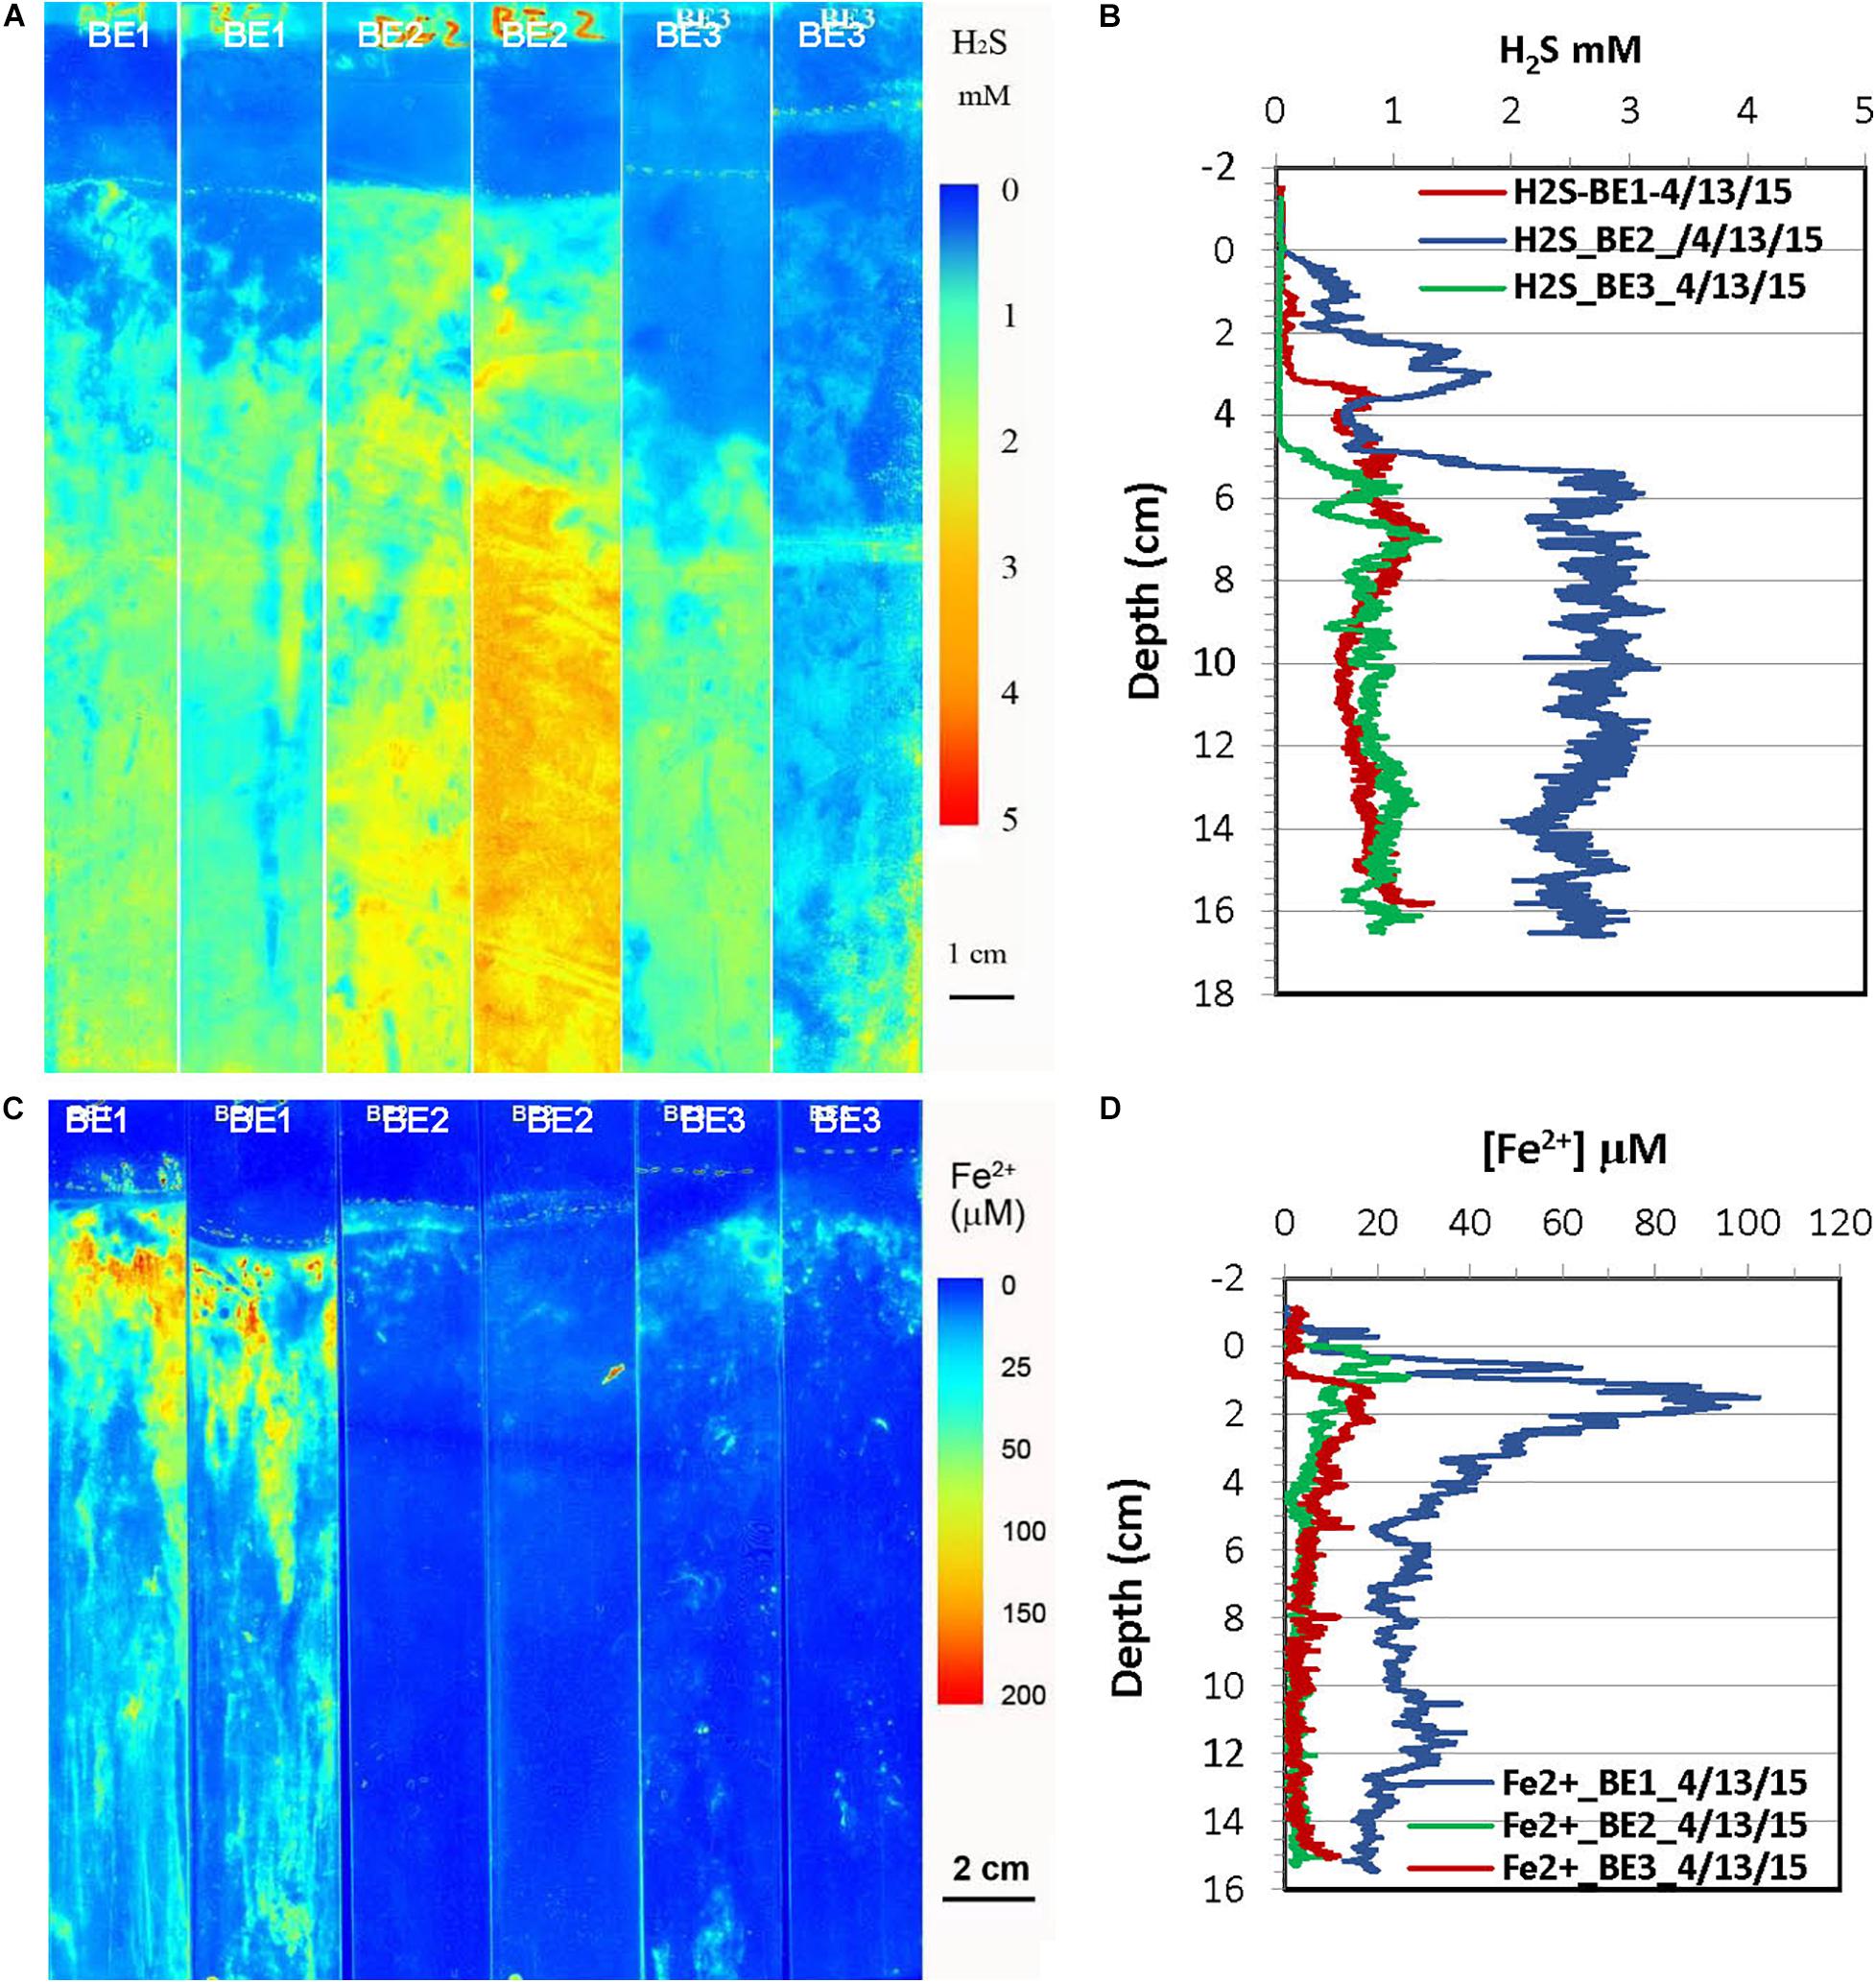
Figure 6. H2S and dissolved Fe2+ distribution patterns in the pore water of Big Egg (BE) marsh peats in spring 2015. (A) 2-D H2S distribution patterns (pseudo color) obtained by in situ measurements in sediments; white line marks the peat surface. (B) Vertical H2S profiles averaged from each 2-D H2S distribution in the panel (A). (C) 2-D Fe2+ distribution patterns obtained by in situ deployments, white line marks the peat surface. (D) Vertical Fe2+ profiles averaged from each 2-D Fe2+ distributions in the panel (C).
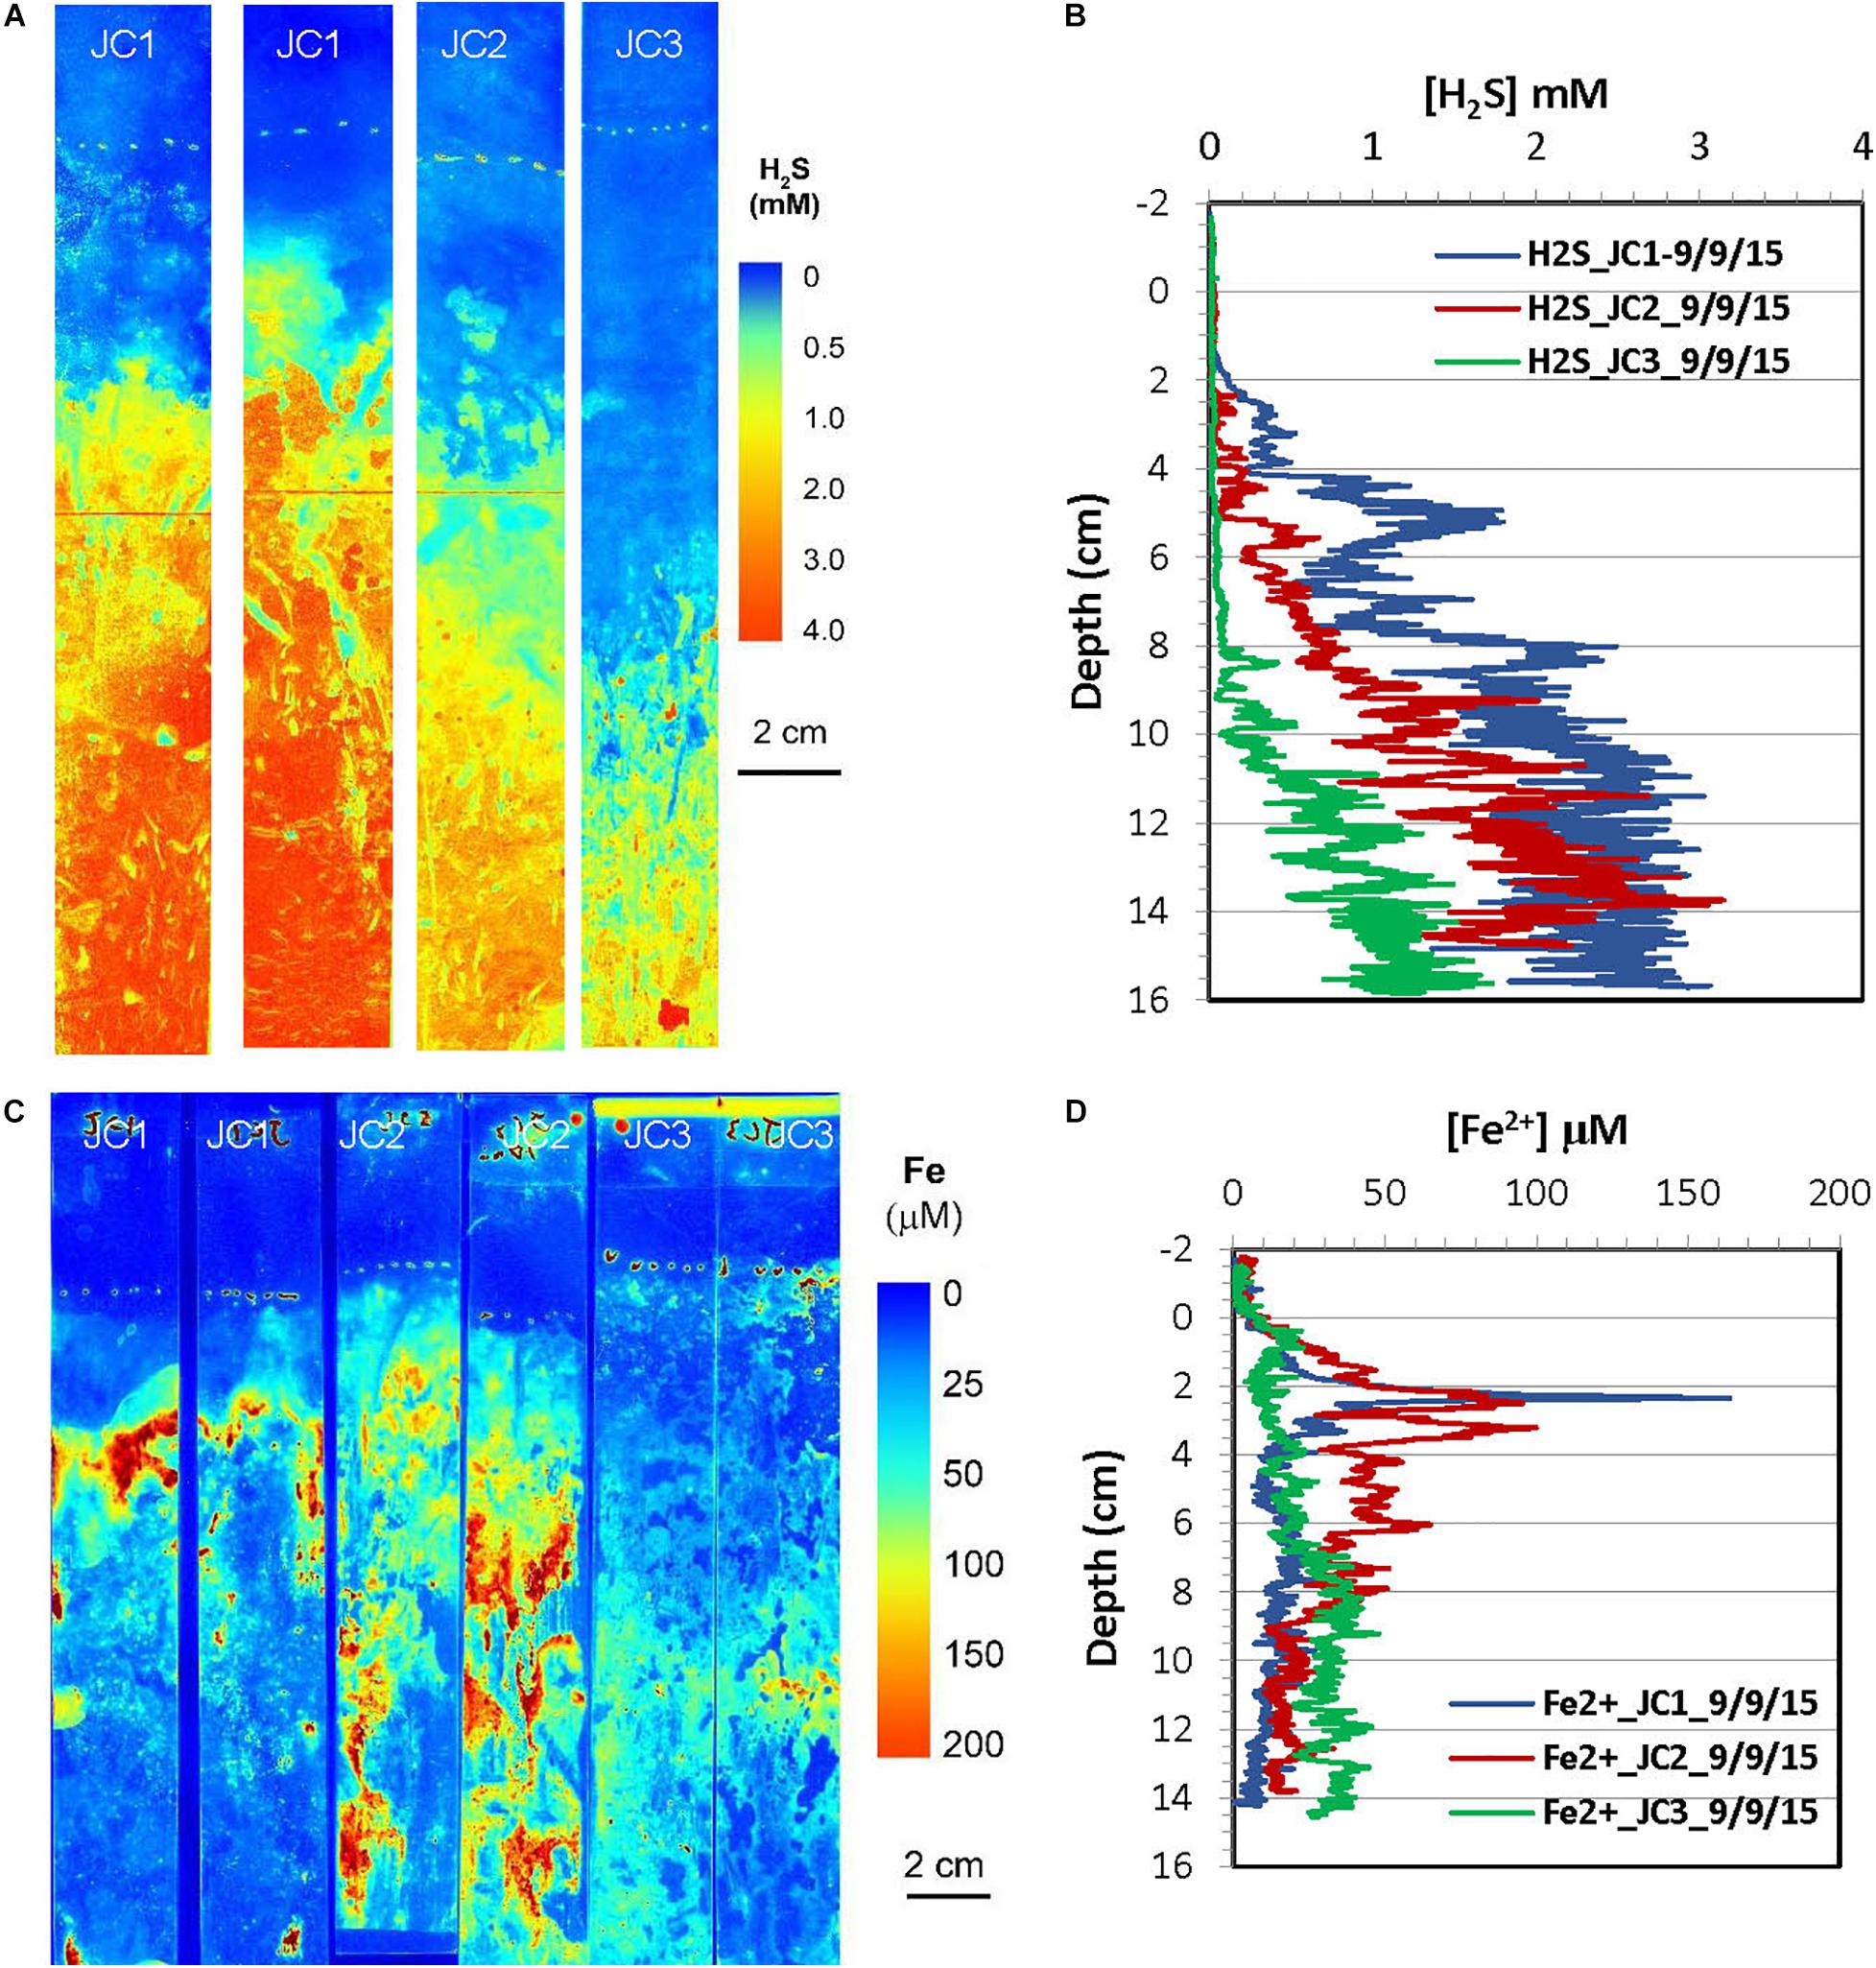
Figure 7. H2S and dissolved Fe2+ distribution patterns in the pore water of JoCo (JC) marsh peats in summer 2015. (A) 2-D H2S distribution patterns (pseudo color) obtained by in situ measurements in sediments; white line marks the peat surface. (B) Vertical H2S profiles averaged from each 2-D H2S distribution in the panel (A). (C) 2-D Fe2+ distribution patterns obtained by in situ deployments; white line marks the peat surface. (D) Vertical Fe2+ profiles averaged from each 2-D Fe2+ distributions in the panel (C).
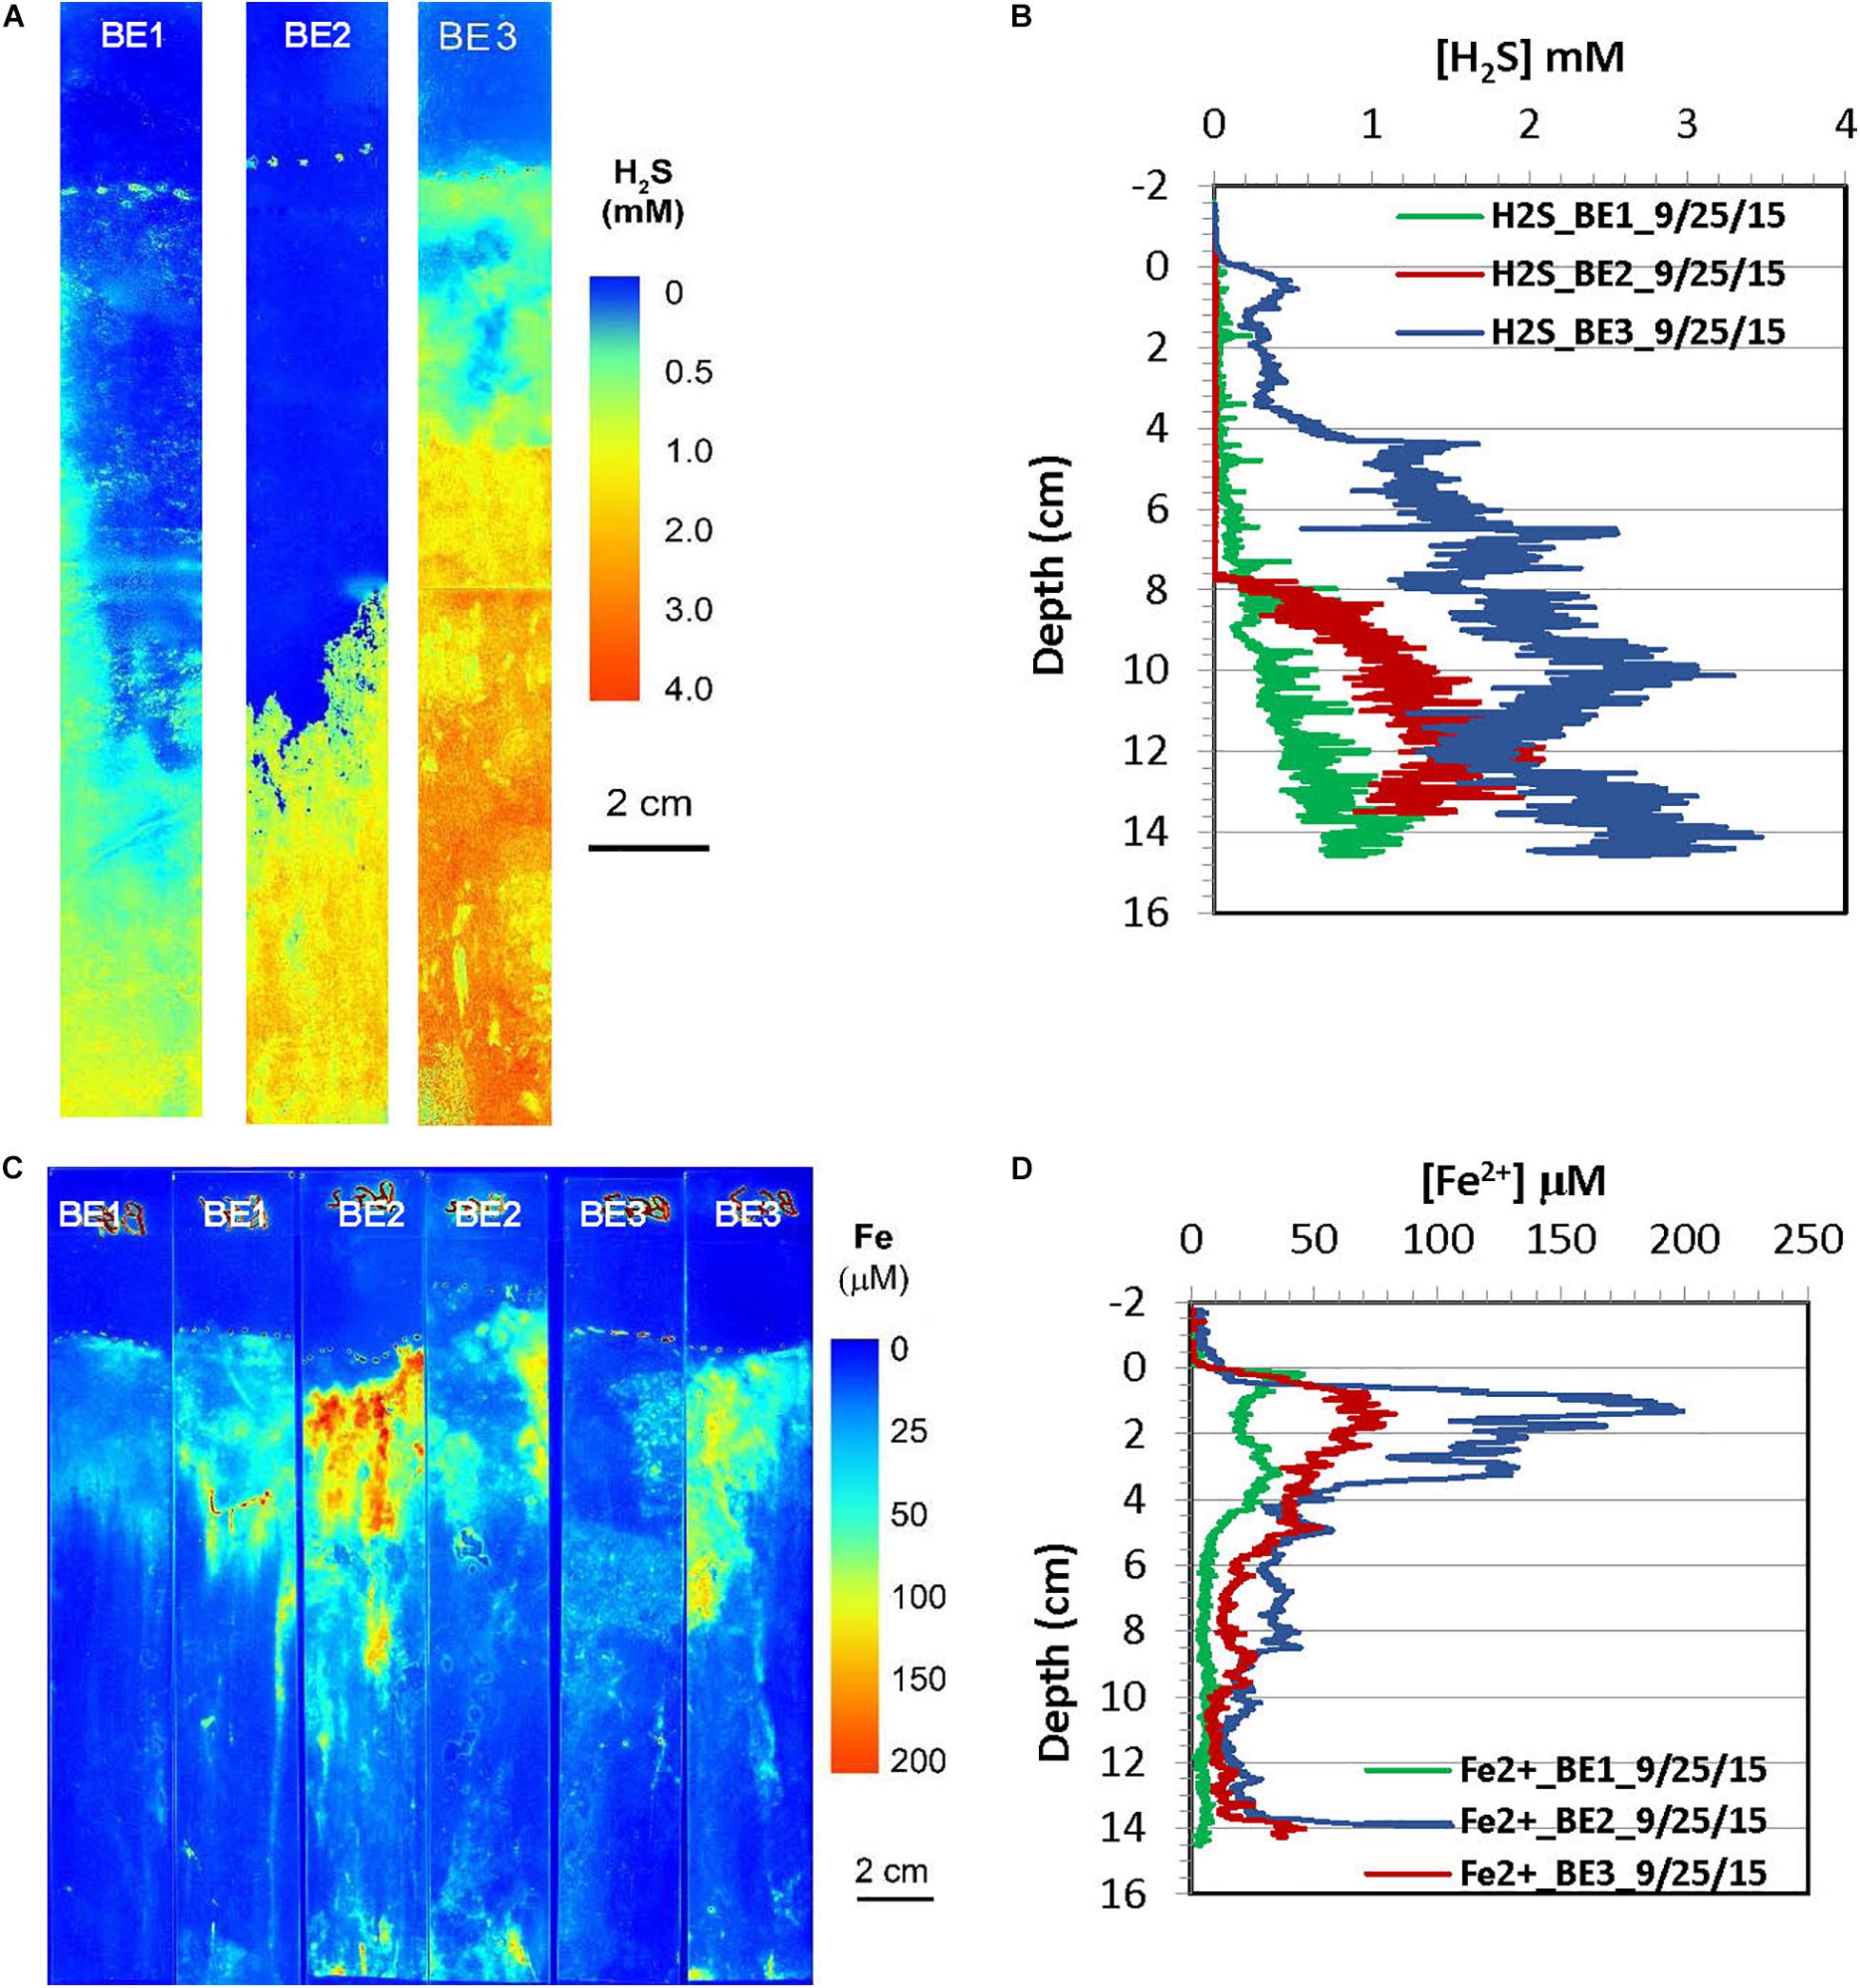
Figure 8. H2S and dissolved Fe2+ distribution patterns in the pore water of Big Egg (BE) marsh peats in summer 2015. (A) 2-D H2S distribution patterns (pseudo color) obtained by in situ measurements in sediments; white line marks the peat surface. (B) Vertical H2S profiles averaged from each 2-D H2S distribution in the panel (A). (C) 2-D Fe2+ distribution patterns obtained by in situ deployments; white line marks the peat surface. (D) Vertical Fe2+ profiles averaged from each 2-D Fe2+ distributions in the panel (C).
The results of H2S and Fe2+ distributions in the early fall sampling (October 2014) obtained by optical sensors are given in Figures 3, 4. The green panels in Figures 3A, 4A are visible images of the side views of marsh cores from Big Egg and JoCo, respectively. The root interweaving patterns can be clearly seen and are directly associated with the 2-D H2S distribution patterns. The H2S in all sampling sites showed a gradient in the top 10 cm depth. H2S level in the surficial sediment of BE1 increased with depth and formed a maximum concentration band from 2 to 5 cm depth, with H2S 0.5 mM, then sharply decreased to almost 0 below 6 cm. H2S in BE2 also increased with depth but reached a maximum concentration ∼1 mM H2S below 12 cm. Higher H2S concentration was observed in BE3 where H2S sharply increase from 0 to 2 mM in top 2 cm marsh and then reached maximum H2S concentration below this depth. The 2-D H2S distribution patterns in the BE sites showed significant lateral and vertical heterogeneities even though site BE2 was very close to BE3. Many “hot spots” of H2S in the marsh were also elevated. However, the dissolved Fe2+ in the three sites BE1-3 showed a similar distribution pattern (Figures 3C,D). Fe2+ concentration sharply increased just below the water-sediment interface and reached Fe2+ maximum zone at 1–2 cm deep and then quickly dropped to non-detectable level. The maximum Fe2+ concretions in all BE sites were between comparable, with values of 20–30 μM Fe2+ in pore water (Figure 3D).
Figure 4 shows the H2S and Fe2+ distributions in JoCo in the early fall season. Compared with their distributions in Big Egg, H2S concentrations in JoCo, 3–6 mM, are much higher than those in Big Egg. H2S concentration in JC1 immediately reached a maximum of 6 mM just below the sediment surface and gradually decreased to 1 mM at 12 cm (Figures 4A,B). Accordingly, no Fe2+ was found in JC1 and JC2 sites except some Fe2+ hot spots due to the high and constant level of H2S. The 2-D Fe2+ distribution pattern in JC3 is similar to that in the BE sites, but reached the maximum zone at 4 cm with Fe2+ concentration around 40 μM. It should be emphasized that the 2-D H2S distributions in the fall 2014 season were measured in the laboratory with a box core incubation for 24 h at room temperature, using a fluorescence H2S sensor (see section “Materials and Methods,” Zhu and Aller, 2013). 2-D H2S distributions in all other seasons were measured in situ with optical sensor sheets, as done for the 2-D Fe2+ distribution patterns.
2-D H2S and Fe2+ distributions in the spring season at the site of JoCo and Big Egg were measured in situ on 05/01/2015 and 04/13/2015 (Figures 5, 6), respectively. The concentrations of H2S were generally <20 μM or non-detectable in the top 15 cm of marsh in JoCo (Figure 5), however, higher levels of H2S (1–3 mM) were found at the sites of BE1-3 associated with root distribution patterns (Figure 6). Dissolved Fe2+ concentrations were non-detectable at JC1 in the top 15 cm, meanwhile dissolved Fe2+ was high (20–30 μM) in a very thin 0.5–2 cm layer at JC2, BE2, and BE3. Relatively higher Fe2+ levels were observed at JC2 and BE1, particularly at BE1, where dissolved Fe2+ was present from the sediment surface to 15 cm deep (Fe2+ was not measured deeper than 15 cm in any sampling) with a maximum concentration of 100 μM at 2 cm. The results showed that both dissolved H2S and Fe2+ concentrations in Big Egg site were higher than those at JoCo in the spring season.
2-D distribution patterns of H2S and Fe2+ in marsh pore water were mapped in a late summer sampling in September 2015, and the results from are summarized in Figures 7, 8, respectively. H2S concentrations were almost non-detectable in the top 2 cm of marsh but started to significantly increase below this depth and reached maximum concentrations of 2–3 mM at about 10 cm at the JC1 and JC2 sites. H2S concentrations at sites of JC3, BE1, and BE2 were in the range of 1–1.5 mM below 8 cm which was smaller than that in JC1 and JC2, and no H2S was observed in the top 8 cm. At BE3, H2S was immediately elevated under marsh surface and increased to >2 mM H2S below 4 cm depth. Similarly to the 2-D H2S distributions obtained in the lab (Figures 3A, 4A), complicated and heterogeneous H2S distributions in the marsh can be seen associated with rhizospheres structures (Figures 7A, 8A). 2-D Fe2+ vertical distributions in all JoCo sites in summer showed very large variations and many “hot spots” and “cold spots” from the marsh surface down to 14 cm depth. Fe2+ concentrations at the hot spots may have reached as high as >200 μM (Figure 7C), but may have sharply dropped to non-detectable levels in cold spots. In general, the average Fe2+ concentrations in JoCo were smaller than those at the Big Egg sites, where Fe2+ showed a maximum zone from 0 to 4 cm, with concentrations of 50–200 μM, and sharp decreases to <50 μM or non-detectable below 4 cm (Figure 8C).
The pH, redox potentials (Eh) and salinity of the discrete pore water samples collected at 5, 10, 15, and 25 cm depth at the marsh sites during different seasons are summarized in Table 1. The pH values of all sites and seasons were mostly <7, and the vertical pH data showed slight increases with depth below 5 cm. No obvious pH seasonal variation was observed at all depths. However, the pH at JoCo was likely lower than pH of Big Egg at the same depth in the same season.
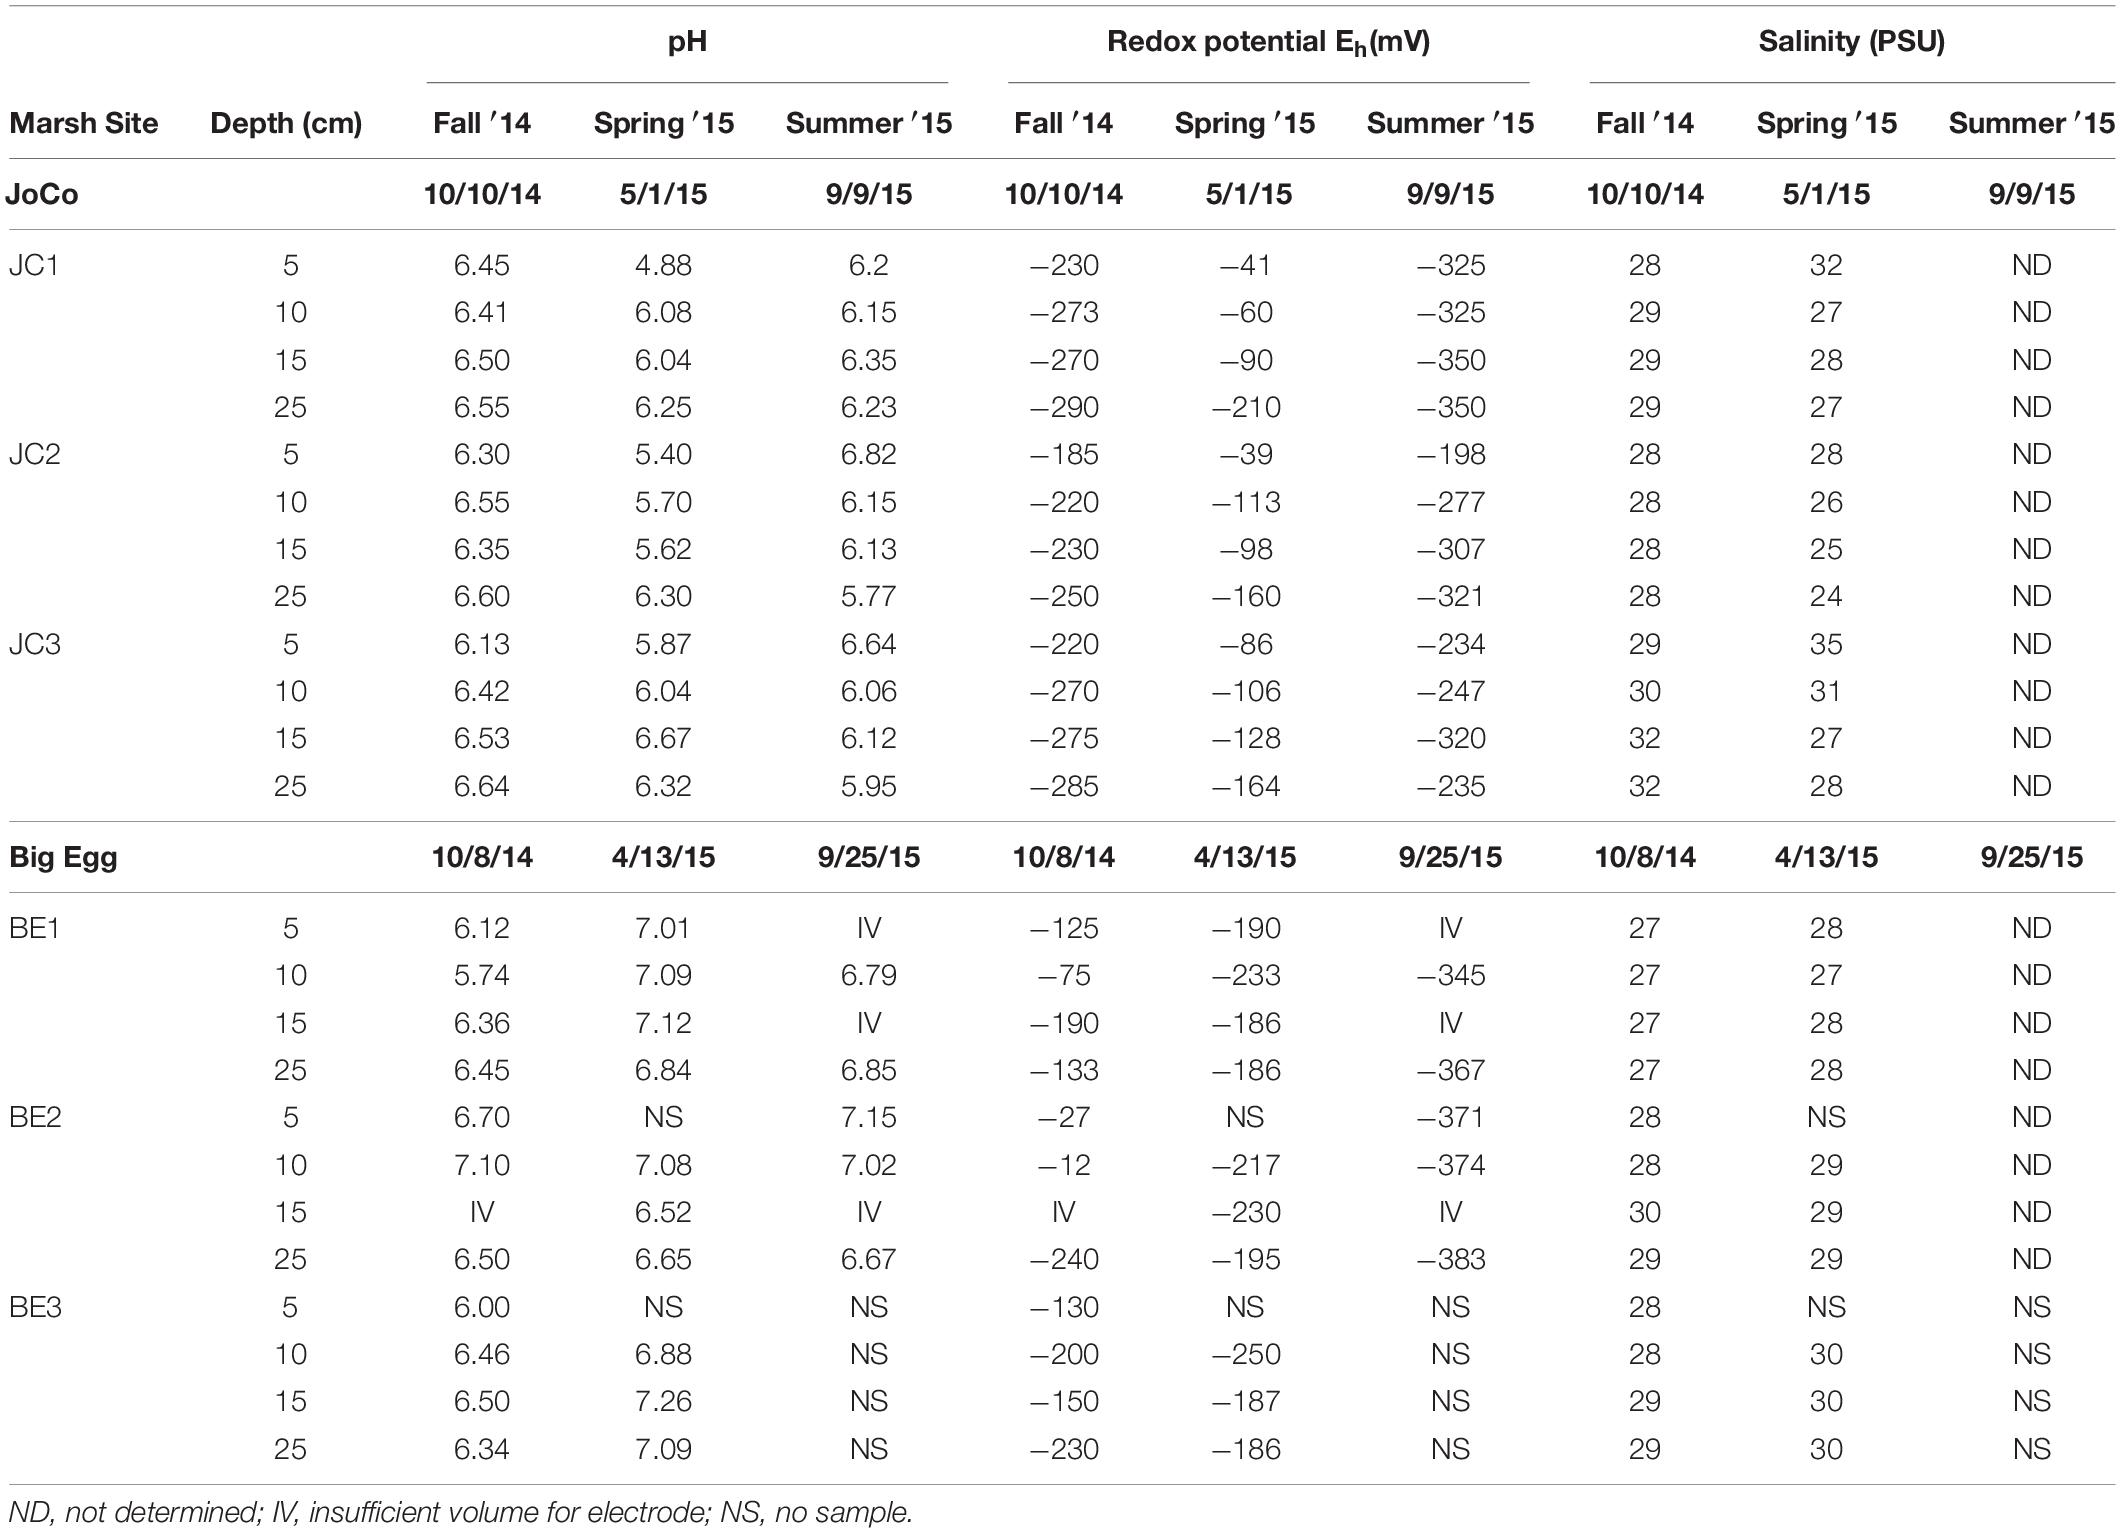
Table 1. Pore water pH, redox potential and salinity data obtained in situ in Big Egg and JoCo marshes, Jamaica Bay, NY.
Redox potential (Eh) obtained from each marsh site below 5 cm was negative. It decreased with depth at most sites and also showed a significant seasonal and spatial variation for both Big Egg and JoCo marsh sites. At JoCo, the Eh of summer and fall ranged from ∼−200 to ∼−350 mV, and it increased to −40 ∼−170 mV in spring. The Eh values at Big Egg were in the range of −12 to about −380 mV in summer and fall, but showed high spatial and temporal variance. In the spring season, the Eh values of Big Egg were in the range of −200 ∼−250 mV at all depth, but this was consistent with the high H2S values found in spring in this marsh (Figures 6A,B). The salinities of all sampling sites did not show obvious changes either with depth or season, ranging from 27 to 30.
The concentrations of Fe2+, total hydrogen sulfide (ΣH2S), phosphate and ammonium in pore water were also determined by traditional methods via “sipper” sample collection method at discrete depths of 5, 10, 15, and 25 cm. The results are summarized in Table 2. Fe2+ in pore water of JoCo and Big Egg were generally very low (<10 μM) and no obvious changes with depth except the spring data of JC2 which increased from 77 to 141 μM from 5 to 16 cm. The relative high Fe2+ concentration of JC2 in spring was also observed by the optical sensor (Figure 5C), but no spatial and seasonal variances of Fe2+ concentrations were observed by the traditional lab methods. ΣH2S measured in the fall and summer seasons was typically higher than in the spring season, and the average ΣH2S concentrations at the JoCo sites were higher than those at Big Egg. However, the BE sites showed much higher ΣH2S than JC in the spring season, which was consistent with the dissolved H2S level obtained by in situ sensing (Figures 5A, 6A). Ammonium concentrations also varied with season and location in Jamaica Bay. The NH4+ concentrations at sites in BE were as high as 100–900 μM in spring and summer, but decreased to <158 μM in fall. The NH4+ concentrations of JC in spring and summer were much lower than those of BE, but they were higher than BE in fall. Similar to ammonium, phosphate also showed relative higher concentrations at the site of BE, and the phosphate concentration sequence at different seasons were summer > spring > fall in both BE and JC sites.
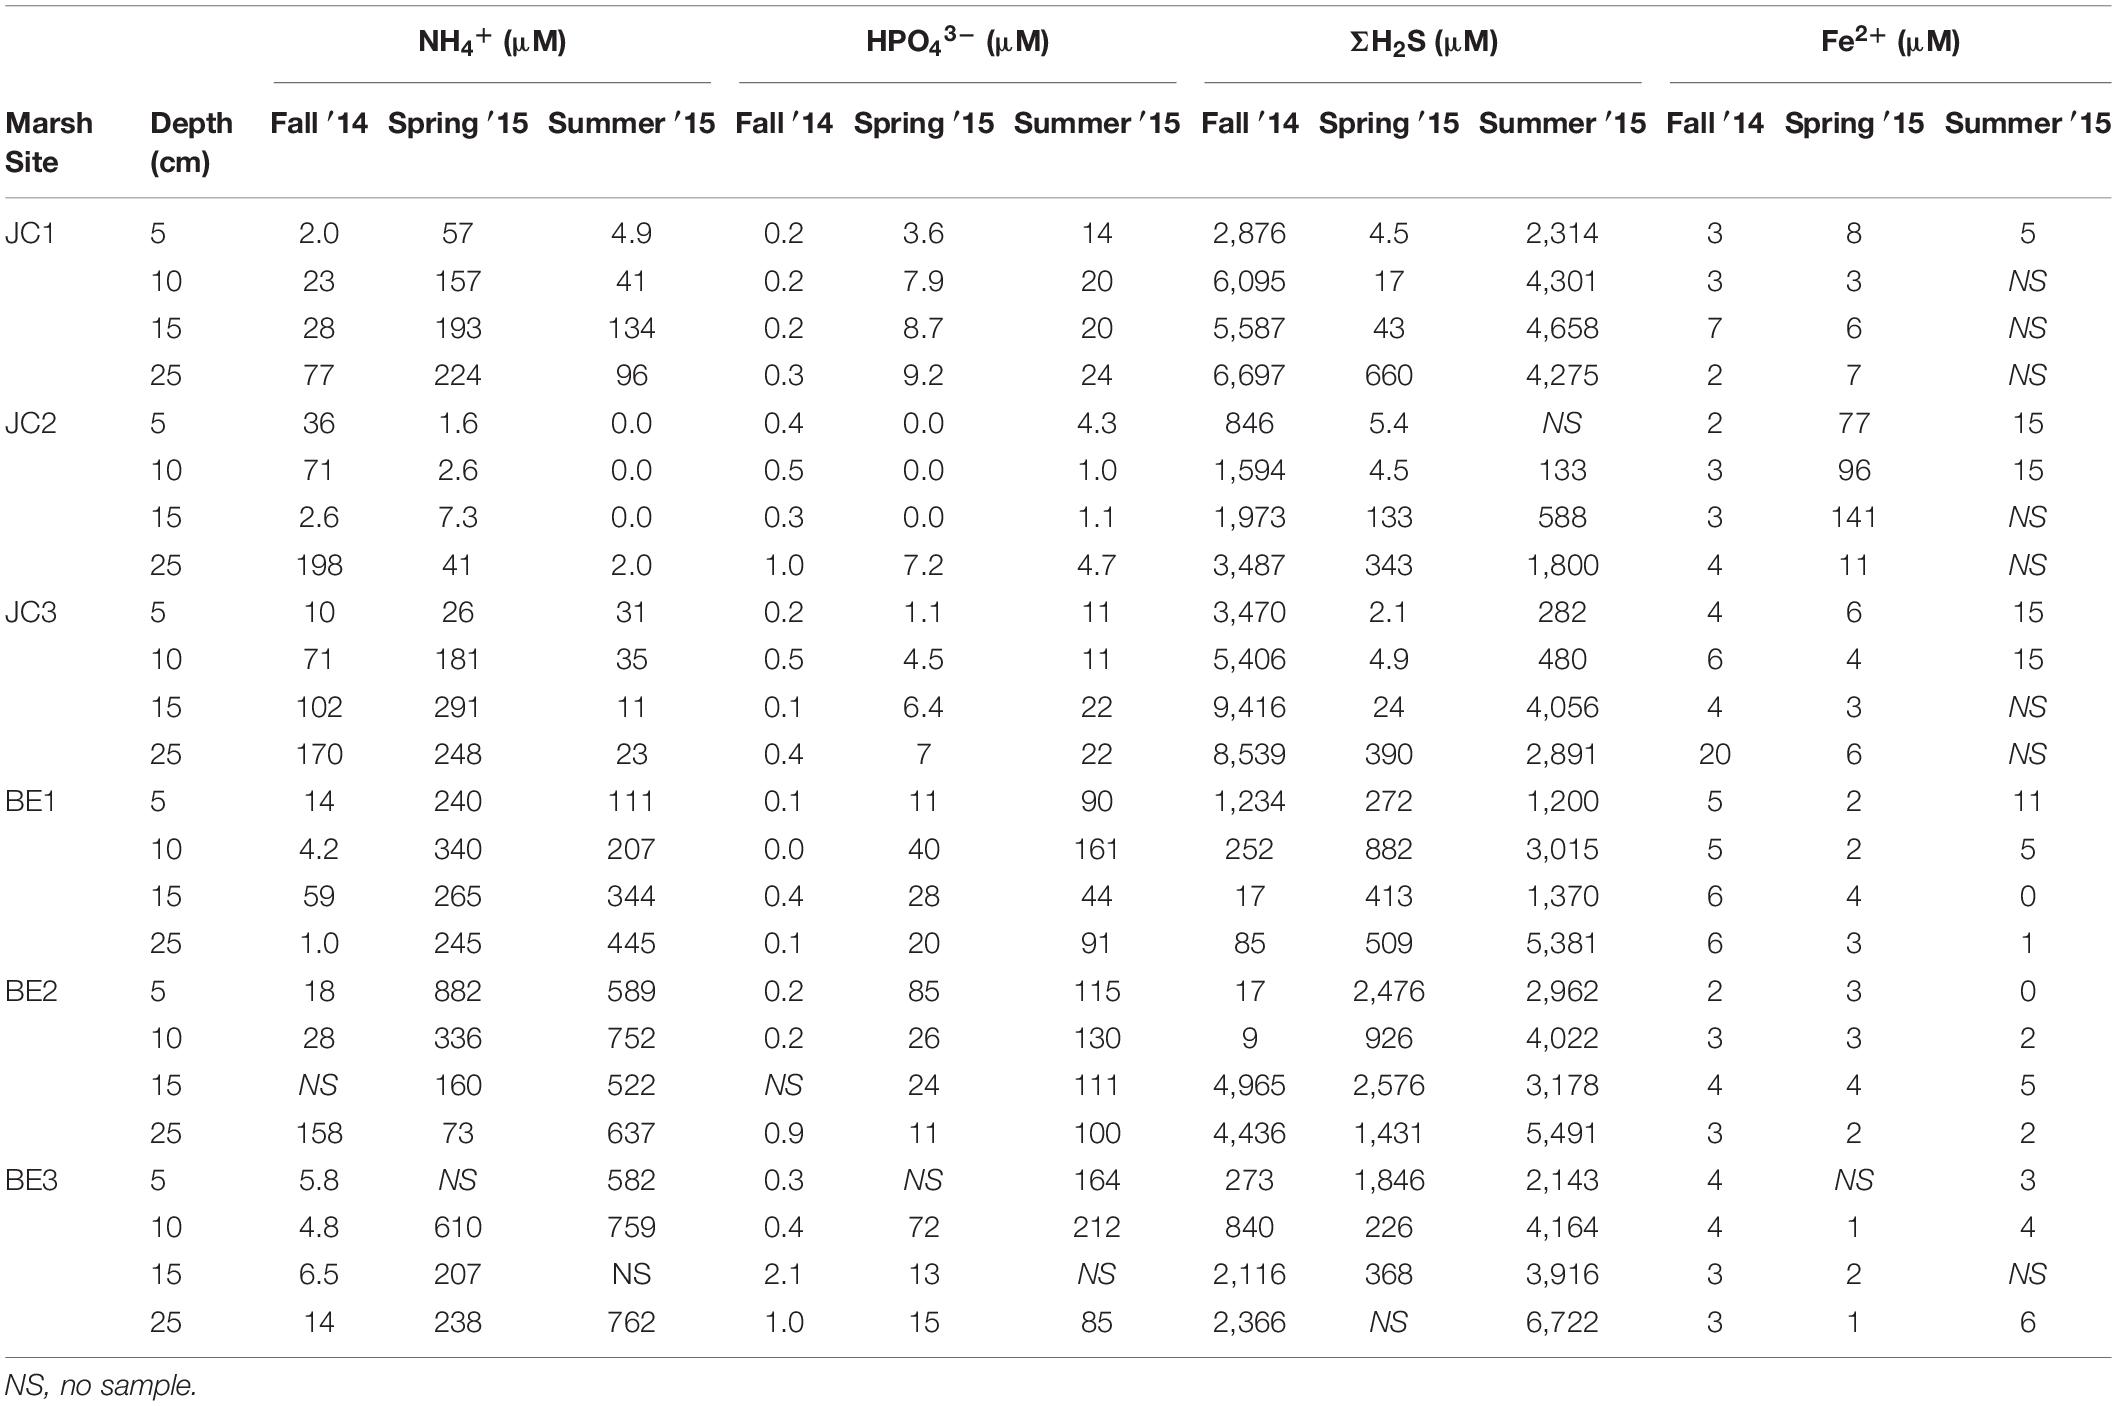
Table 2. Pore water solute data obtained from Big Egg and JoCo marshes, Jamaica Bay, NY.
The solid phase organic carbon, total sulfur (S), CRS acid leaching Fe and degree of pyritization (DOP) at different sites and seasons are summarized in Table 3. Total sulfur concentrations in JC were slightly higher in fall season, but its distribution at BE2 was different from other sites and higher sulfur was observed in spring at BE2. CRS showed higher concentrations at each depth in the spring than that in summer. It was typically increased with depth but a decreasing pattern was found at site BE2. The distribution patterns of acid-leachable iron in JC and BE were also different– all three JoCo sites showed higher solid phase Fe in summer than in spring, but in contrast, Big Egg marsh had much higher solid phase Fe in spring than summer. CRS and acid leachable Fe in the fall season were not analyzed.
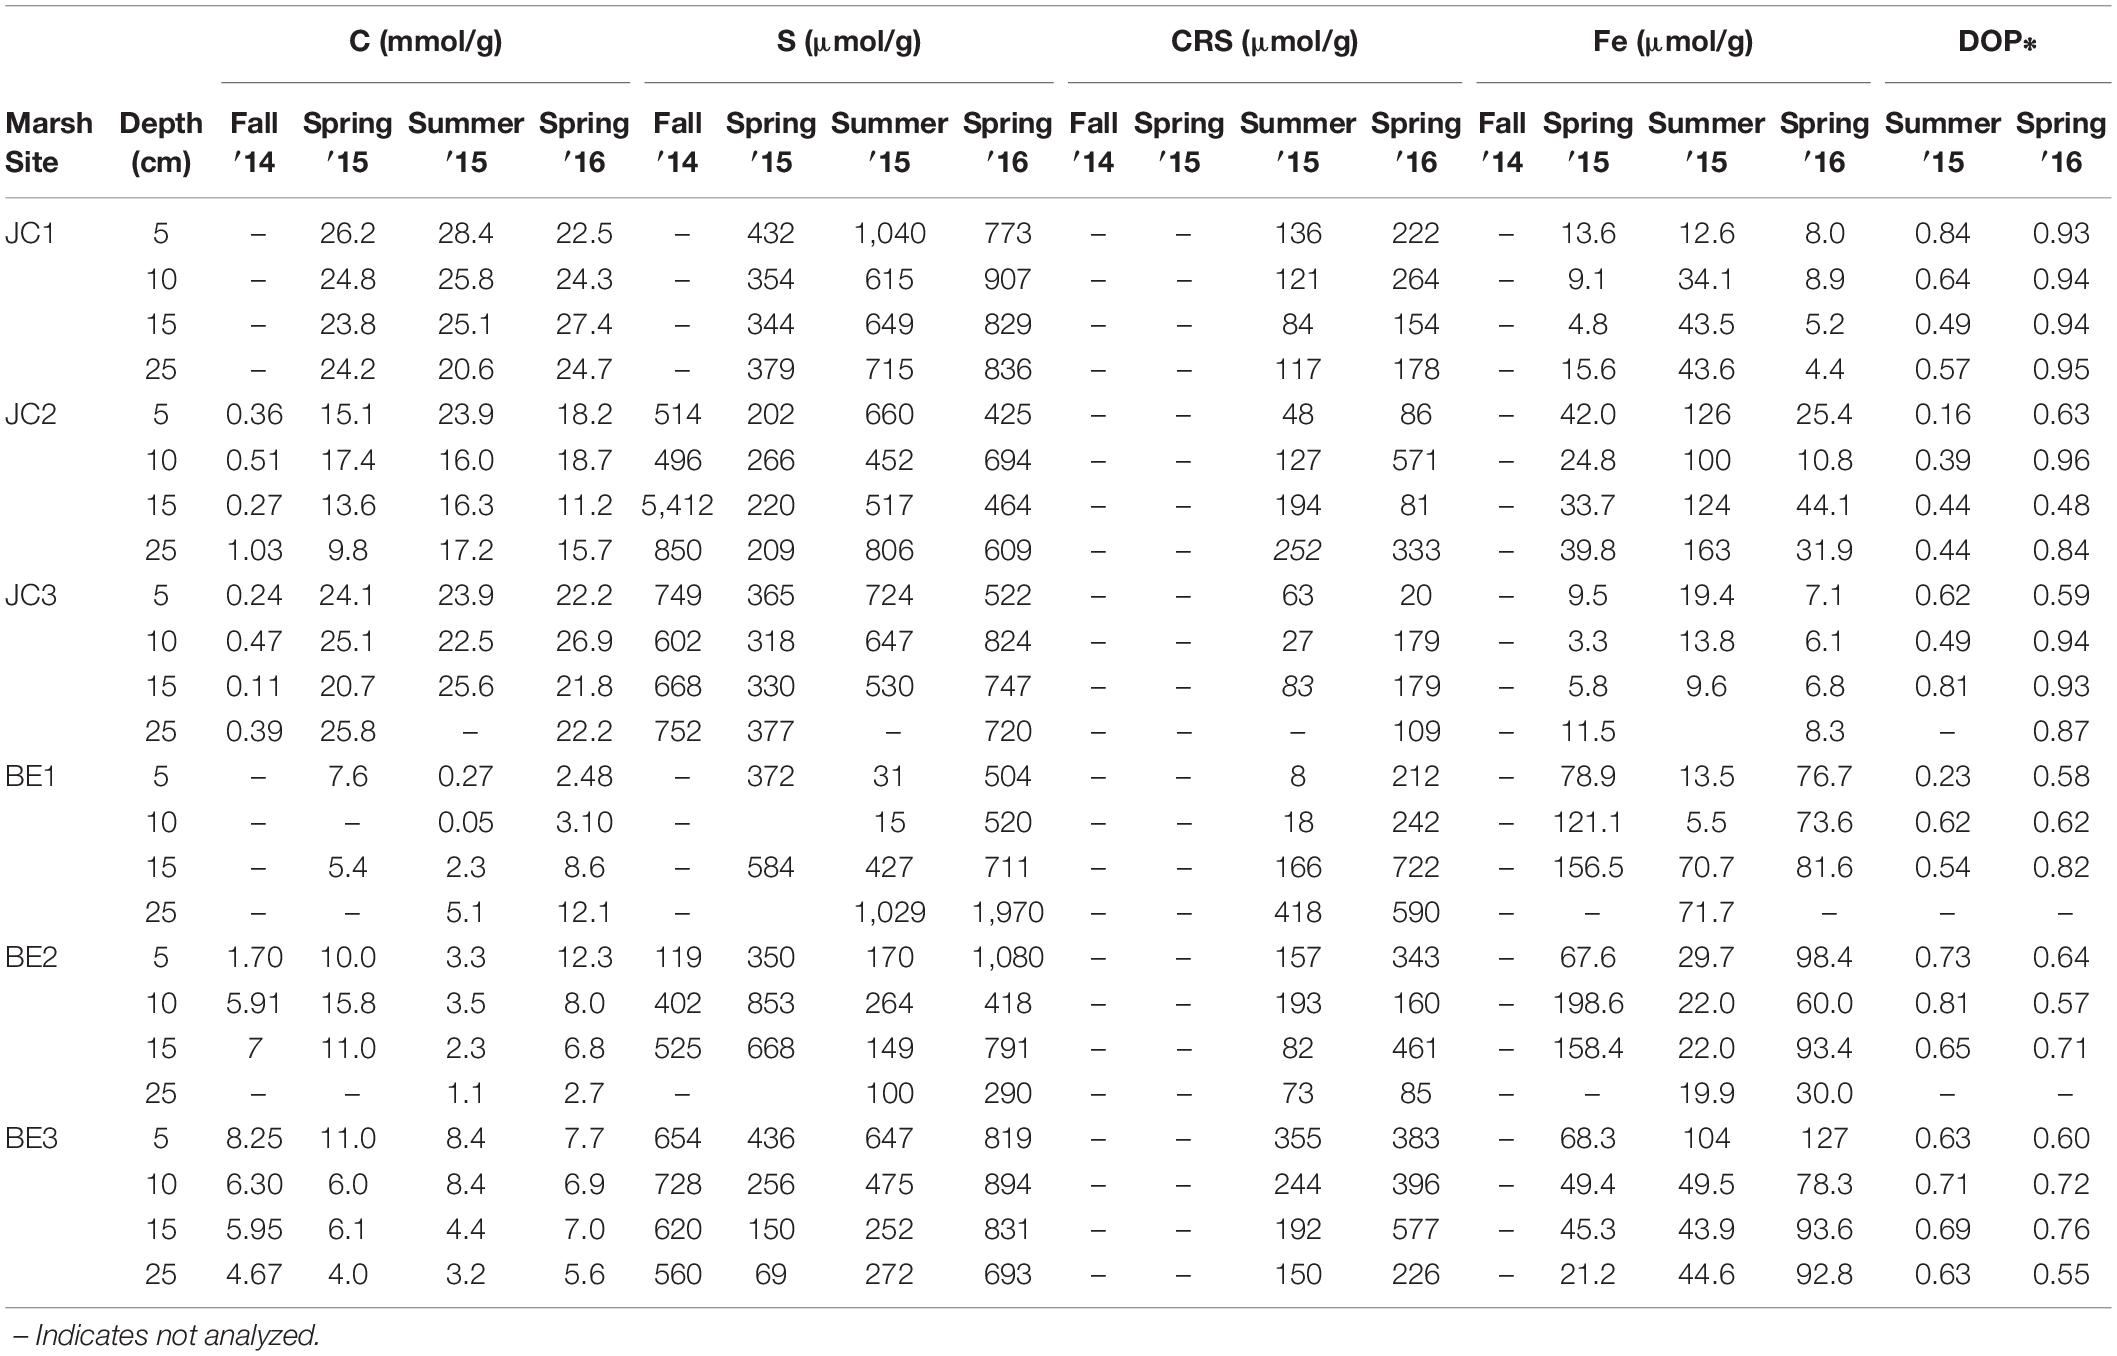
Table 3. Solid phase organic carbon, total sulfur, chromium reducible sulfide (CRS), acid leachable iron and degree of pyritization (DOP) in the marsh sediments of JoCo and Big Egg, Jamaica Bay, NY.
Discussion
Heterogeneities of Fe2+ and H2S Distributions in Salt Marsh Pore Water
Salt marshes are sites of intense biogeochemical reactions involving anoxic organic matter remineralization, which typically result in dramatic changes in the concentration of H+, Fe2+, H2S, and other pore water species in the upper layer of marsh sediments (Morse et al., 1987; Canfield et al., 1992; Brendel and Luther, 1995; Bull and Taillefert, 2001; Zhu and Aller, 2013; Yin et al., 2017; Koop-Jakobsen et al., 2018). Compositional changes of Fe2+ and H2S with depth in sediment pore water are usually assumed to occur in an overall average vertical progression. Significant heterogeneity and complex three dimensional reaction patterns over mm to cm scales can result, however, from bioturbation activity (Zhu and Aller, 2013; Yin et al., 2017). In salt marshes, the growth of wetland plants and oxygen transport through the aerenchyma lacunae of plants from aboveground sources to rhizosphere can also create a complicated thin layer of aerobic environment around roots through the radial oxygen loss (ROL) from roots (Armstrong, 1979; Howes and Teal, 1994; Colmer, 2003; Han et al., 2016; Koop-Jakobsen et al., 2018). Most of the selected study sites in Jamaica Bay are dominated by saltmarsh cordgrass S. alterniflora, in which the roots extensively intergrow into a dense network over at least the top 30 cm of the peat. Thus, it is expected that the 2-D distribution patterns of Fe2+ and H2S in marsh peat are influenced by the plant root growth patterns. We hypothesize that the oxygen transport through plant rhizosphere and the radial oxygen loss can generate a time-dependent 3-D distribution pattern of low level dissolved H2S and Fe2+ (cold-spots) associated with individual plant roots in marsh peat.
In order to test this hypothesis and study Fe2+ and H2S distributions and the associated biogeochemical processes in marsh peat with a high density of living plants, box cores made of clear acrylic plastic were collected from each site in October 2014 and the H2S sensor deployments were conducted in the laboratory so that the plant root features and sensor foil deployment position can be directly seen from side of the core. The 2-D H2S distribution measured by a reversible H2S fluorescence planar sensor was compared to the visible image of peat core (side view). The green color of the visual images (Figures 3A, 4A) was from the visual light source (white is not available in the image system used). The corresponding 2-D H2S images in Figures 3A, 4A (shown as pseudo-color, reflecting concentrations) revealed that the concentration distribution patterns were directly associated with the plant root structures in marsh peat. The H2S concentrations around the roots were <1 mM which was five times less than in the surrounding peat. The results in Figures 3A, 4A were measured in the laboratory in incubated box cores with aeration of overlying seawater for 24 h at room temperature without drainage, the changes of environmental conditions could alter oxygen transport and radial oxygen loss in marsh (Howes and Teal, 1994; Colmer, 2003), as well as H2S and Fe2+ distributions around the roots. In order to avoid these possible artifacts, the real-time 2-D H2S and Fe2+ distribution patterns in salt marshes were studied by deploying the irreversible H2S (Yin et al., 2017) and dissolved Fe2+ (Zhu and Aller, 2012) colorimetric planar sensors in situ at different seasons. The real-time data in Figures 5–8A,C showed that the distribution patterns of H2S and Fe2+ in sulfidic marsh pore water were significantly complicated by belowground radial oxygen loss from roots into the surrounding marsh peat. The oxygen leaked from the roots formed a thin oxic layer in which the dissolved H2S and Fe2+ were oxidized to sulfate and Fe-oxide (e.g., iron plaque), resulting in a thin zone of low levels of H2S and Fe2+ surrounding the roots in the sulfidic peat. Furthermore, oxygen and/or nitrate, rather than sulfate, served as the electron acceptors for organic matter remineralization in the thin oxic layers. Such an interface of oxic-anoxic sediment around the roots can be seen in both visible peat images and 2-D H2S images, indicating heterogeneous remineralization patterns. The low and/or undetectable spots/tracks (cold spots) of H2S and Fe2+ associated with root structures in Figures 3–8A,C was a direct evidence for our hypothesis, and the cold spots of H2S and Fe2+ surrounding individual roots became more pronounced (Figures 7, 8) when more oxygen transport and high oxygen leakage occurred in the summer season (Colmer, 2003; Soana and Bartoli, 2013).
H2S is a phytotoxin to marsh plants, with a the threshold that can be harmful to S. alterniflora of about 2 mM [see Kolker (2005) and references therein]. Long-term exposure of the marsh plants to high levels of H2S can cause plant die-off and marsh peat collapse. We noted that the average H2S levels at JoCo marsh could be >4 mM just below the marsh surface (Figures 4A,B) or in deep peat (Figure 7A, JC1) in the fall and summer seasons, but JoCo is considered as a “healthy” marsh and plants grow well. We hypothesize that the oxic layers formed around roots of S. alterniflora help the plants survive in the high levels of H2S by reducing sulfide absorption. We tested this hypothesis at the National Synchrotron Light Source-II (Brookhaven National Laboratory; Feng et al., 2018). We used the Hard X-ray Nanoprobe Beamline to obtain nanometer-scale measurements of trace elements in S. alterniflora root tissue. The results showed that when iron concentrations in pore water and root epidermis were high, the root epidermis showed lower concentrations of S and P even though sulfide and phosphate in the pore water were high in late summer (Feng et al., 2018). At the same time, pore water Fe was lower than in the spring sampling, but Fe in the root epidermis was high. This pattern is consistent with the roots producing an oxic microenvironment with oxygen transported into the peat through the roots, such that Fe2+ in the pore water is oxidized, producing iron “plaque” (i.e. FeOOH) on the root epidermis. This plaque prevents sulfide from entering the root tissue. Phosphate may also be excluded via adsorption onto the FeOOH or formation of an iron phosphate phase.
There are also many “hot spots” on the 2-D Fe2+ and H2S images, reflecting the heterogeneous distributions of labile organic matter and the microniches of exoenzymes and microbes on sediment particles (Cao et al., 2013). We also noted that large variation of H2S and/or Fe2+ distributions may occur in same site in duplicate in situ measurements over distances of <1 m between two deployed sensor sheets.
In addition to the microscale heterogeneities of Fe2+ and H2S distributions around plant roots, the 2-D H2S and Fe2+ images also showed clear vertically and laterally heterogeneous distribution patterns. Note that no infaunal burrows were found in the measurements, suggesting that bioturbation is not a factor in these sediments. H2S concentrations near the surface of the Big Egg sediment were relatively low but sharply increased below the water-sediment interface and reached maxima at ∼2 cm in the fall sampling at BE1 and BE3. The H2S levels at JoCo marsh were elevated to 4–6 mM just below the marsh surface (Figures 4A,B). It should be pointed out that the 2-D H2S distributions in the fall 2014 season (Figures 3A, 4A) were incubated and measured in laboratory with the box core incubation without water drainage, but in all other sampling seasons, the H2S measurements were performed in situ in the field. The real-time 2-D H2S distributions (Figures 5A, 6A, 7A, 8A) showed that H2S levels in top 4 cm were low even in the summer season, and gradually increased to higher concentrations at depth. The high H2S levels elevated just below the water-peat interface in Figure 3A (BE3) and Figure 4A (JC) were not found in the 2-D in situ measurements in the field. This phenomenon is likely caused by the pore water drainage in the marshes. The marshes of Jamaica Bay are periodically (tidally) submerged by seawater. An important pathway by which this water drains from marsh islands such as Big Egg and JoCo is vertically, and the two sites have distinctly different drainage velocities of 7.9 and 25.9 cm/d, respectively, as determined by Ra isotopes (Tamborski et al., 2017). Thus the concentrations of H2S (and other solutes) in marsh peat pore water result from a balance between the rates of biogeochemical processes that produce or consume them and drainage. In summer and fall seasons, higher H2S concentrations in JC marsh were produced due to the high sulfate-reduction bacteria activities and the relative high organic carbon concentration in this site (Table 3), but the more rapid drainage there produced high flow-through fluxes of H2S through the marsh peat (Tamborski et al., 2017). As well, the effects of roots on the 2-D H2S distribution patterns, are especially evident at JC in the summer, a time when marsh plant growth is dense and bacterial activity is high (Figure 7A).
2-D Fe2+ distributions were measured only by in situ sensor deployments, so visible images of the sensing marsh peat were not available. The spatially heterogeneous 2-D Fe2+ distributions also showed sharp vertical gradients that were closely correlated to the H2S vertical distributions, especially in the low drainage BE marsh peats. Fe2+ concentration sharply increased just below the water-sediment interface and reached Fe2+ maximum zone at 1–2 cm deep. At depths below which the reactive particulate Fe-oxide had been depleted, sulfate reduction dominated the metabolism, producing dissolved sulfide species (H2S, HS–, and S2–), and an increase of H2S with depth in pore water below the Fe2+ maximum zone (Bull and Taillefert, 2001; Jørgensen and Kasten, 2006; Johnston, 2011). The free sulfide subsequently scavenged the dissolved Fe2+ to form the reactive solid phase FeS, resulting in a Fe2+ maximum above the H2S maximum zone in pore water (Bull and Taillefert, 2001). FeS is unstable and converts to the more stable form pyrite (FeS2) by a variety of pathways (Howarth, 1979; Berner, 1984).
The in situ zonations of 2-D Fe2+ and H2S distributions in Figures 3–8 clearly showed this sequence: the maximum zones of Fe2+ were generally produced at 2–4 cm, and the H2S levels increased to maxima below 4 cm. The in situ heterogeneous 2-D Fe2+ and H2S distributions are useful for determining redox zonation and understanding the dominant biogeochemical processes occurring within the marsh peat. Both dissolved Fe2+ and H2S can be efficiently removed by FeS2 precipitation from pore water. When millimolar levels of H2S occurred in marsh pore water, the dissolved Fe2+ concentrations were generally <20 μM at the same depths. On the other hand, the high pore water concentrations of Fe2+ were linked to low H2S levels in all seasons. There were some Fe2+ “cold spots” co-distributed with low levels of H2S, as seen in Figures 7A,C. As noted above, these cold spots are likely produced in the oxic and suboxic layers around roots and caused by O2 transport down to the deep sediment through the rhizosphere. Unfortunately, H2S and Fe2+ concentrations could not be simultaneously measured by optical sensor in the present study. Fe2+ concentrations at JC and BE were in the range of 10–100 μM, which is typical of coastal marsh pore water. High levels of Fe2+ in pore water may be harmful to plants because it may co-precipitate or adsorb the nutrients ammonium and phosphate in the marsh, preventing their uptake by the roots.
Seasonal Variation of H2S and Fe2+ Distributions in Marsh Pore Water
H2S distributions in marsh pore water at all sites varied seasonally, generally with higher H2S levels in summer and fall, and lower or undetectable levels in spring (Table 2 and Figures 3–8). At the JoCo marsh sites, dissolved H2S in pore water was <0.02 mM found by sensors in the spring sensor deployments but it was elevated to as high as 3–6 mM in summer and fall at the same sampling sites. Thus was likely due to loadings of labile organic matter on the marshes produced in the summer in the eutrophic Bay, coupled with the temperature-dependent variation of the rate of microbial decomposition of organic matter. The discrete pore water samples showed the redox potential at JoCo from 5 to 15 cm was in the range of −41 to −200 mV in spring while it was lower, −180 to −350 mV, in summer and fall seasons, indicating less “reducing” environments in the marsh peat in the spring (Table 1). Our previous study showed that the exoenzymes and microbes in marine sediments have high activities in the summer and fall, but very low in winter and early spring (Cao et al., 2013). Thus, the temperature dependence of H2S distributions was a direct reflection of the change in sulfate-reduction microbial activity with temperature. However, data in Table 1 also showed a clear spatial heterogeneity of the redox potential at different marsh sites in the spring season. Relative lower redox potentials were found at Big Egg marsh sites in the spring compared to fall, the reason for this unusual phenomenon was not clear, but the stronger “reducing” conditions at BE resulted in high H2S levels in the late spring (April-May) (Figure 6A), and as a consequence, likely caused more plant die-off and marsh loss. H2S distributions at BE sites in winter and early spring were not measured.
Typically, the high concentration of H2S (or ΣH2S) in anaerobic salt marshes comes from the reduction of sulfate during organic matter decomposition, generating a decreasing redox potential with depth (Hambrick III, DeLaune and Patrick, 1980), and a complicated 3-D pattern associated with the roots of plants due to oxygen transport and radial oxygen loss through roots. The redox potential can be used as an indicator of the degree of oxidation of marsh peat. The results in Table 1 showed that the redox potentials of all sites generally decreased from 5 to 25 cm depth, but exhibited a clear seasonal variation. The redox potential in spring was much higher than that in summer and fall in JC, indicating the lower organic matter oxidation rate by sulfate in spring. The pH values of all sites and depths in summer and fall seasons are in the range of pH 6–7 with vague seasonal variations, implying that the intense oxidation of organic matter by various electron acceptors at warm temperature tend to buffer sediment pore water close to 6–7. Interestingly, the pH values of pore water at JC in spring are in the range of 5–6.5 which are lower than the pH values in other seasons. By integrating other geochemical parameters found at this site in spring, for example the high redox potentials (Table 1), extreme low total sulfide (Table 2) and non-detectable (<0.02 mM) dissolved H2S (Figure 5A), we conclude that the rate of organic matter decomposition in JC in late spring (April–May) is still high, but oxidants with high redox potentials (such as O2, nitrate, and Mn/Fe-oxides), rather than sulfate, dominate the redox reactions with organic matter at JC. This might be attributed to the healthy and high-density biomass of S. alterniflora and fast pore water drainage velocity in JC. The intertidal nature and fast drainage of the JC salt marsh could result in surface gas exchange playing a more important role in the sediment oxygen transports than in low drainage marshes like BE, resulting in a relatively higher redox potential in JC than BE in the spring season.
Fe2+ concentrations in marsh pore water also show seasonal changes (Table 2 and Figures 3C–8C), but the seasonal changes are not very significant compared to the H2S distribution variations, partially due to the low Fe2+ concentrations in the marsh pore water. But, the distribution patterns of Fe2+ are closely associated with H2S distribution patterns in marsh pore water, as discussed above. It seems that Fe2+ concentrations in pore water at most sites of JoCo and Big Egg were relatively high in summer than in spring and fall.
The seasonal variation of H2S and Fe2+ in marsh pore water should also be tightly linked to the plant life cycle. The previous studies have shown that the temporal changes in belowground biogeochemical processes, such as oxygen leakages from roots, sulfate reduction, sulfide oxidation, Fe2+ oxidation and precipitation etc., were well correlated with the changes in plant physiology (Hines et al., 1989; Soana and Bartoli, 2013; LaFond-Hudson et al., 2018). We did not measure directly the oxygen leakage from roots in this study, but the microscale “cold spots” of H2S and Fe2+ in the 2-D distribution patterns associated with individual roots (Figures 3–8A,C) clearly indicated radial oxygen loss from roots. In the spring season, low temperatures decreased oxygen consumption in plant rhizosphere by slowing respiration in roots (Armstrong, 1979), resulting in more “excess” oxygen leakage into surrounding marsh peat and the increase of redox potential in sediment. This could be another possible explanation as to why the redox potential in JC marsh is higher in spring than other seasons (Table 1). In the summer season, dissolved organic matter could be released from the roots during active growth of S. alterniflora and rapidly enhance the sulfate reduction rate (Hines et al., 1989). We believe that any additional dissolved organic matter released from roots would also fuel the rate of Fe-oxide reduction, resulting in a relative high dissolved Fe2+ in marsh pore water (Figures 7C, 8C). As a consequence, more active FeS was formed and accumulated in summer season in JC (Table 3).
Interaction of H2S and Fe2+ as Seen in the Solid Phase: Degree of Pyritization
The precipitation of the solid phases FeS and FeS2 (pyrite) as a result of elevated concentrations of H2S and Fe2+ in the pore water effectively removes H2S from solution, and is thus a geochemical means of controlling H2S concentrations (Howarth, 1979; Berner, 1984). The pore water data described in sections “Heterogeneities of Fe2+ and H2S Distributions in Salt Marsh Pore Water” and “Seasonal Variation of H2S and Fe2+ Distributions in Marsh Pore Water” are essentially snapshots of conditions at the time of sampling. The composition of the solid phase can integrate the redox reactions occurring in the sediments over longer periods. We measured fractions of the solid phase S and Fe pools in the peat at all the sites (Table 3). For sulfur, the important pools include Acid Volatile Sulfide (AVS), CRS, and Total Sulfur. AVS is a measure of FeS-associated sulfur, CRS of the pyrite-associated sulfur and total S of the AVS, CRS, and all other forms, including organosulfur compounds. For iron, we measured a fraction termed “reactive” Fe, i.e. that obtained by a 1 N HCl cold leach of the dried sediment. This procedure extracts the portion of Fe that is diagenetically mobile and readily able to react with sulfide to produce the iron sulfide phases. Our prior experience in JoCo (Cochran et al., 2013) suggests that AVS < CRS ≤ Total S. The AVS pool is labile and converts to pyrite, which is a longer term sink for Fe and especially S in the marsh peat. In effect, the formation of pyrite removes dissolved sulfide from the pore water and stores it, lowering the exposure of the plants to this phytotoxin. The solid phase measurements enable calculation of a parameter termed the “Degree of Pyritization” (DOP), that is, the degree to which reactive Fe in the solid phase is associated with pyrite and is thus unable to further remove dissolved sulfide from pore water. DOP is defined as:
where Fepyrite is calculated as CRS/2 (i.e. one mole of Fe per two moles of S in FeS2), and Fereactive is the acid leachable Fe. Table 3 gives the solid phase DOP results.
The results in Table 3 show that the total sulfur at JoCo is generally higher than that at Big Egg, but the CRS-sulfur concentrations are comparable at these two sites and the fraction of CRS in the total sulfur pool is much smaller in JoCo. To the extent that total sulfur includes diagenetically produced organosulfur compounds and sulfur associated with the marsh plants, this difference can be explainable by the higher organic content of the marsh sediments at JoCo. Both total sulfur and CRS-sulfur show vertical variations at different depths from surface to deep marsh peat, but the pattern at each site is not consistent even in the same season, implying significant heterogeneities of both organosulfur and pyrite-associated sulfur in the solid marsh peat, probably caused by the plant growth. Similar to dissolved H2S and Fe2+ in pore water, the total sulfur, CRS-sulfur and acid leachable Fe in the peat also show seasonal differences between the summer 2015 and spring 2016 samplings. These reflect the redox cycling of the various pools of Fe and S over the year.
The DOP at JoCo is higher than that at Big Egg. Indeed, the DOP values at JoCo can approach 1, indicating that 100% of the reactive iron is associated with pyrite. These high values suggest that the biogeochemical control of pore water H2S via FeS2 precipitation is close to a limit and that high sulfide but low Fe2+ concentrations in the pore water can be expected, as observed.
Time Series of ΣH2S in JoCo and Big Egg Marshes: 2014–2016
Our group has studied Jamaica Bay marshes since 2004 (Cochran et al., 2013, 2018). In particular, we have pore water ΣH2S concentrations measured by “sipper” at the two marshes studied here. All samples were taken in the upper 25–30 cm and analyzed for ΣH2S as described above. Analytical techniques were the same throughout and thus the values are comparable within and between the marshes. However, although sampling sites were in the same general area of each marsh, they were not identical over time. In addition, not all marsh sites were sampled in each year. The record of sampling includes: Big Egg- 2004/05, 2014-2016; JoCo- 2005-2007, 2014-2016. These time series of samples permit us to examine changes in the average concentration of ΣH2S in pore water of the marsh peat in a depth zone in which root density is high and the plants can be considered susceptible to exposure to elevated levels of his phytotoxin. To do this, we calculated the average ΣH2S value of the pore water analyses from sippers deployed from ∼5 to 30 cm. Generally, 4–5 sample depths were involved (e.g., 5, 10, 15, and 25 cm). All sites sampled in each marsh at a given time were averaged to produce a single ΣH2S value, presumed to be representative of that marsh at that time. The results are shown in Figure 9, and the patterns in each marsh are as follows:
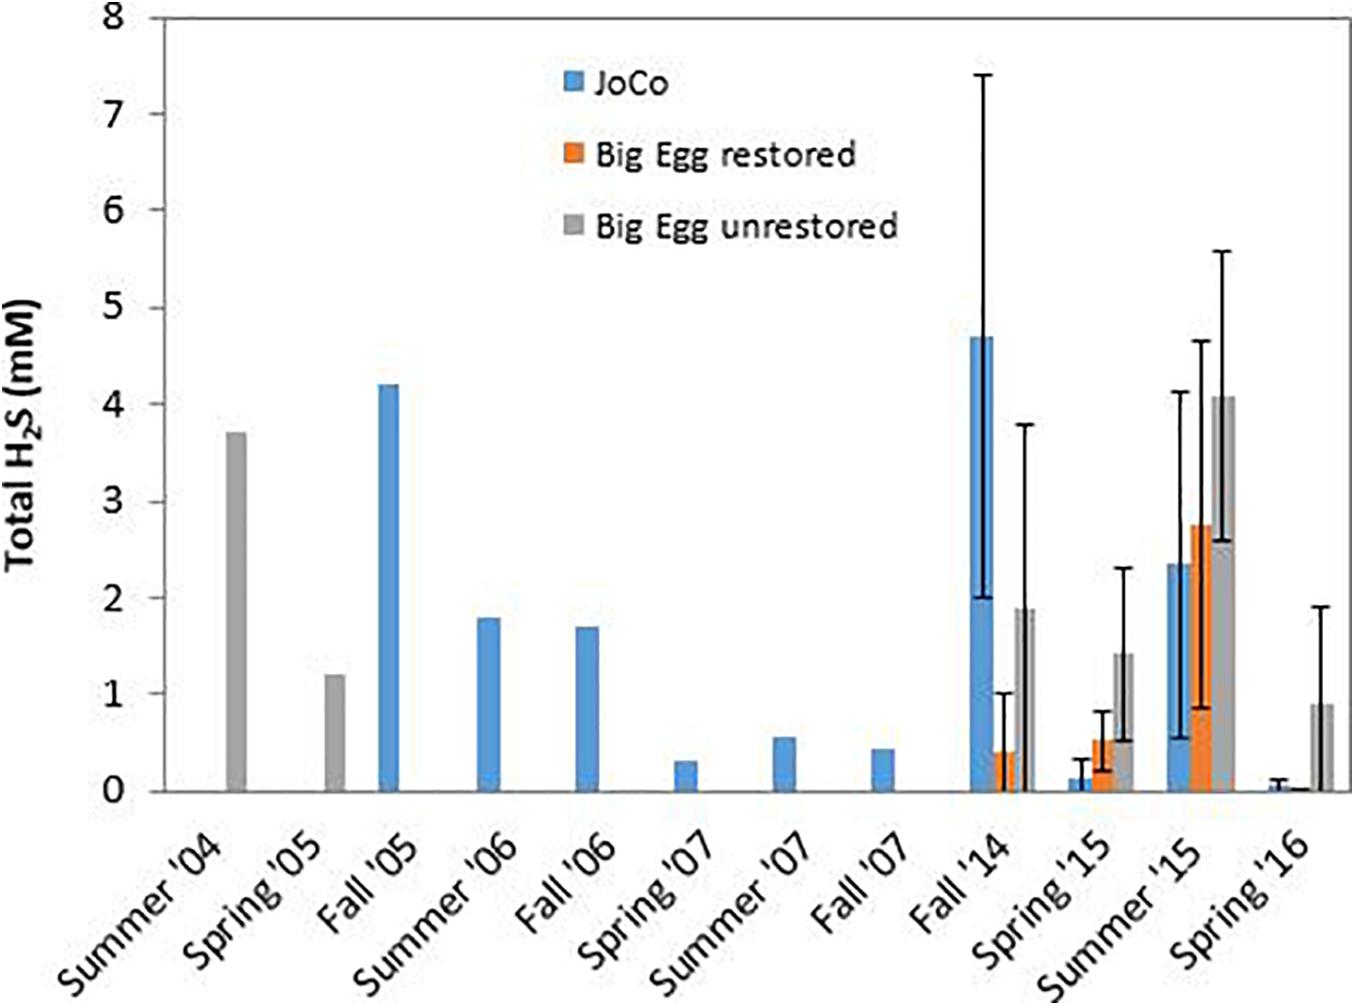
Figure 9. Temporal variation of average total dissolved inorganic sulfide (ΣH2S) in pore water of JoCo and Big Egg salt marsh at Jamaica Bay. BE1 is the restored marsh, BE2 and BE3 are the unrestored marsh. Data were averaged from ΣH2S concentrations measured on samples taken at 4–5 discrete depths from 5 to 30 cm. Vertical lines demote 1σ uncertainties of the mean of several sites sampled in each marsh from 2014 to 2016.
Big Egg: a portion of this marsh (BE1) was restored in 2003 by spraying sandy sediment from the adjacent subtidal bottom onto the marsh surface (Frame et al., 2006). The unrestored portion of the marsh was sampled in 2004/05 and again in our recent sampling. We also sampled the restored portion of the marsh in the present study (BE1). The effects of the sediment spray are well documented in the 210Pb profile in the core taken in this area of the marsh (Cochran et al., 2018; data not shown). Concentrations of ΣH2S in the unrestored portion of the marsh are as high as 3.5–4 mM in the summer and are quite similar between 2004/05 and 2014-16, with comparable values in comparable seasons (Figure 9). Samples from the restored portion of the marsh appear to have lower ΣH2S in the pore water, and the offset is especially clear in the fall 2014, and spring 2015 and 2016 samplings.
JoCo: JoCo presents a conundrum in that it is considered a “healthy” marsh in Jamaica Bay, yet over the period 2005–2016, average ΣH2S levels were >2 mM in summer and fall, 2006 and summer, 2015 and exceeded 4 mM in fall, 2005 and 2014. Offsetting these high concentrations is the fact that levels of ΣH2S were low (<0.5 mM) at other sampling times, including in the spring, summer and fall, 2007, and were exceptionally low (∼0 mM) in spring, 2015 and 2016. Several factors controlling ΣH2S are likely in play at JoCo. The large variations in ΣH2S from sampling to sampling may in part be due to the fact that most of the reactive iron in the JoCo peat is associated with FeS2 and is thus not able to readily react with H2S produced via sulfate reduction. Secondly, although temperature is a strong control on bacterial activity and hence the production of H2S, there is no clear relationship between mean air temperature during the month or week of sampling and mean pore water ΣH2S (data not shown). As noted above, drainage rates in JoCo are the fastest seen of the marshes examined in this study (Tamborski et al., 2017). These rates may vary with time as a function of tides (neap vs. spring) and season (warm vs. cold; variation in precipitation). It is possible that at least the portion of JoCo studied is at or near a “tripping point” for degradation.
Conclusion
Pore water H2S and Fe2+ distributions were measured at Big Egg and JoCo marshes in Jamaica Bay using in situ optical sensors that produced 2-D images of concentrations. Both H2S and Fe2+ distributions showed significant vertical and horizontal heterogeneities, as well as seasonal variations. The complicated 2-D distribution patterns associated with the effects of roots (e.g., oxygen transport) were also revealed. The sensor measurements were generally in good agreement with the dissolved H2S values obtained from discrete pore water samples (calculated from ΣH2S and pH). However, the dissolved Fe2+ data obtained from the discrete pore water samples were somewhat less than those from in situ sensor measurements. In particular, the traditional discrete method missed the Fe2+ maximum zones and spatial resolution of Fe2+ in the marsh pore water. The H2S concentrations measured by in situ sensors at JoCo and Big Egg were elevated (2–6 mM) in late summer and early fall, but show a clear seasonal difference. The elevated H2S levels were higher than the threshold at which adverse effects on marsh plants may occur (∼2 mM). On the other hand, oxic zones formed around roots likely protect the plants from absorbing H2S in an extreme sulfidic environment. Dissolved Fe2+ concentrations in pore water measured with sensors at Big Egg and JoCo are generally low, largely due to the removal by pyrizitation. The data of solid phase S and Fe at Big Egg and JoCo showed that significant amounts (>50%) of diagenetically reactive Fe were associated with the pyrite and thus not readily able to react as pore water H2S increases. Indeed, at JoCo, virtually all of the reactive Fe was associated with pyrite in the spring, 2016 sampling, suggesting that the negative feedback on pore water H2S concentrations associated with the coupled Fe and S redox cycles is weak and that the ability of Fe to control pore water sulfide through pyrite formation is limited there.
The present study, together with those conducted by our group since 2004, has permitted us to document the pore water geochemistry of the Big Egg and JoCo. The large change is seen in the significant reduction of the phytotoxin H2S in the pore water in the restored portion of Big Egg marsh, while the unrestored portions there continue to display high pore water H2S, especially in summer samplings. At JoCo, sampling in fall, 2005, and summer and fall, 2006 showed high (2–4 mM) average values of H2S in the pore water. In contrast values in spring, summer and fall, 2007 were <0.5 mM. The recent sampling in 2014-16 shows strong seasonality, with high values in fall, 2014 (>4 mM) and summer, 2015, but low values (<0.2 mM) in the two spring samplings (2015, 2016). Although the marsh plants at JoCo are exposed to occasional high levels of H2S that might be considered toxic, the marsh is relatively elevated compared with mean sea level, and drainage through the marsh peat is more rapid at JoCo than at Big Egg. This may help explain why JoCo continues to be a “healthy” marsh. Relatively healthy marshes such as JoCo should especially be the subject of continued monitoring, for both geochemical and biological parameters.
Data Availability Statement
The original contributions presented in the study are included in the article/supplementary material, further inquiries can be directed to the corresponding author/s.
Author Contributions
QZ and JC: conceived of the project. QZ, JC, CH, HY, HF, JT, PF, and WC: pore water and marsh peat cores sampling in the field. QZ and HY: field and lab sensor deployments and analyses. CH and JC: pore water and sediment analyses in field and lab. QZ, JC, and CH: data interpretation and manuscript preparation. All authors contributed to the article and approved the submitted version.
Funding
This work was supported by finding from the National Park Service (Task Agreement P14AC01395, Cooperative Agreement P14AC00888). The sensors were partially support by NSF OCE 1737749 and NSF OCE 1332418.
Conflict of Interest
The authors declare that the research was conducted in the absence of any commercial or financial relationships that could be construed as a potential conflict of interest.
The handling editor declared a past co-authorship with the authors JC and CH.
Acknowledgments
We would like to thank the Science and Resilience Institute at Jamaica Bay for supporting field work, Robert C. Aller for discussion of results, Yu Qian for assistance in the field. Patricia Rafferty (National Parks Service) Don Riepe, and Elizabeth Manclark (American Littoral Society) provided much appreciated logistical support.
References
Alldred, M., Borrelli, J. J., Hoellein, T., Bruesewitz, D., and Zarnoch, C. (2020). Marsh plants enhance coastal marsh resilience by changing sediment oxygen and sulfide concentrations in an urban, eutrophic estuary. Estuaries Coasts 43, 801–813. doi: 10.1007/s12237-020-00700-9
Aller, R. C. (1982). “The effects of macrobenthos on chemical properties of marine sediments and overlying water,” in Animal-Sediment Relations, eds P. L. McCall and M. J. S. Tevesz (New York, NY: Plenum), 53–102. doi: 10.1007/978-1-4757-1317-6_2
Aller, R. C. (2001). “Transport and reactions in the bioirrigated zone,” in The Benthic Boundary Layer, eds B. P. Boudreau and B. B. Jørgensen (Oxford: Oxford University Press), 269–301.
Aller, R. C., Madrid, V., Chistoserdov, A., Aller, J. Y., and Heilbrun, C. (2010). Unsteady diagenetic processes and sulfur biogeochemistry in tropical deltaic muds: implications for oceanic isotope cycles and the sedimentary record. Geochim. Cosmochim. Acta 74, 4671–4692. doi: 10.1016/j.gca.2010.05.008
Armstrong, W. (1979). Aeration in higher plants. Adv. Bot. Res. 7, 225–332. doi: 10.1016/s0065-2296(08)60089-0
Bagarinao, T. (1992). Sulfide as an environmental factor and toxicant–tolerance and adaptations in aquatic organisms. Aquat. Toxicol. 24, 21–62. doi: 10.1016/0166-445x(92)90015-f
Berner, R. A. (1984). Sedimentary pyrite formation: an update. Geochim. Cosmochim. Acta 48, 605–615. doi: 10.1016/0016-7037(84)90089-9
Brendel, P., and Luther, G. W. (1995). Development of a gold amalgam voltammetric microelectrode for the determination of dissolved Fe, Mn, O2 and S(-2) in pore waters of marine and freshwater sediments. Environ. Sci. Technol. 29, 751–761. doi: 10.1021/es00003a024
Bull, D. C., and Taillefert, M. (2001). Seasonal and topographic variations in pore waters of a southeastern USA salt marsh as revealed by voltammetric profiling. Geochem. Trans. 2, 104. doi: 10.1039/b108493c
Campbell, A., Wang, Y., Christiano, M., and Steverns, S. (2017). Salt Marsh Monitoring in Jamaica Bay, New York from 2003 to 2013: a decade of change from restoration to hurricane sandy. Remote Sens. 9:131. doi: 10.3390/rs9020131
Canfield, D. E. (1989). Reactive iron in marine sediments. Geochim. Cosmochim. Acta 53, 619–632. doi: 10.1016/0016-7037(89)90005-7
Canfield, D. E., Raiswell, R., and Bottrell, S. (1992). The reactivity of sedimentary iron minerals toward sulfide. Am. J. Sci. 292, 659–683. doi: 10.2475/ajs.292.9.659
Cao, Z., Zhu, Q., Aller, R. C., Aller, J. Y., and Waugh, S. (2013). Seasonal, 2-D sedimentary extracellular enzyme activities and controlling processes in Great Peconic Bay. Long Island. J. Mar. Res. 71, 399–423. doi: 10.1357/002224013812587573
Cline, J. E. (1969). Spectrophotometric determination of hydrogen sulfide in natural waters. Limnol. Oceanogr. 14, 454–458. doi: 10.4319/lo.1969.14.3.0454
Cochran, J. K., Kolker, A. S., Hirschberg, D. J., Renfro, A. A., Goodbred, S. Jr., and Beck, A. J. (2013). Sulfur Cycling in Salt Marshes of Jamaica Bay, Gateway National Recreation Area: Possible Links to Marsh Loss. Natural Resource Technical Report NPS/NER/NRTR—2013/730. Fort Collins, CO: National Park Service.
Cochran, J. K., Zhu, Q., Heilbrun, C., Tamborski, J., Yin, H., Fitzgerald, P., et al. (2018). Health and Resilience of Salt Marshes in Jamaica Bay, NY: Geochemical and Dynamical Perspectives. Natural Resources Report NPS/NCBN/NRR – 2018/1643. Fort Collins, CO: National Park Service.
Colmer, T. D. (2003). Long-distance transport of gases in plants: a perspective on internal aeration and radial oxygen loss from roots. Plant Cell Environ. 26, 17–36. doi: 10.1046/j.1365-3040.2003.00846.x
Deegan, L. A., Johnson, D. S., Warren, R. S., Peterson, B. J., Fleeger, J. W., Fagherazzi, S., et al. (2012). Coastal eutrophication as a driver of salt marsh loss. Nature 490, 388–392. doi: 10.1038/nature11533
Feng, H., Qian, Y., Cochran, J. K., Zhu, Q., Heilbrun, C., Li, L., et al. (2018). Seasonal differences in trace element concentrations and distributions in Spartina alterniflora root tissue. Chemosphere 204, 359–370. doi: 10.1016/j.chemosphere.2018.04.058
Frame, G. W., Mellander, M. K., and Adamo, D. A. (2006). “Big egg marsh experimental restoration in Jamaica Bay, New York,” in People, Places, and Parks: Proceedings of the 2005 George Wright Society Conference on Parks, Protected Areas, and Cultural Sites, ed. D. Harmon (Hancock, MI: The George Wright Society), 123–130.
Goldhaber, M. B. (2003). “Sulfur-rich Sediments,” in Treatise on Geochemistry, Vol. 7, ed. F. T. Mackenzie (Amsterdam: Elsevier), 257–288. doi: 10.1016/b0-08-043751-6/07139-5
Hambrick III, G. A., DeLaune, R. D., and Patrick, W. H. (1980). Effect of estuarine sediment pH and oxidation-reduction potential on microbial hydrocarbon degradation. Appl. Environ. Microbio. 40, 365–369. doi: 10.1128/aem.40.2.365-369.1980
Han, C., Ren, J., Tang, H., Xu, D., and Xie, X. (2016). Quantitative imaging of radial oxygen loss from Valisneria spiralis roots with a fluorescent planar optode. Sci. Total Environ. 569-570, 1232–1240. doi: 10.1016/j.scitotenv.2016.06.198
Hines, M. E., Knollmeyer, S. L., and Tugel, J. B. (1989). Sulfate reduction and other sedimentary biogeochemistry in a northern New England salt marsh. Limnol. Oceanogr. 34, 578–590. doi: 10.4319/lo.1989.34.3.0578
Howarth, R. W. (1979). Pyrite: its rapid formation in a salt marsh and its importance in ecosystem metabolism. Science 203, 49–51. doi: 10.1126/science.203.4375.49
Howes, B. L., and Teal, J. M. (1994). Oxygen loss from Spartina alterniflora and its relationship to salt marsh oxygen balance. Oecologia 97, 431–438. doi: 10.1007/bf00325879
Johnston, D. T. (2011). Multiple sulfur isotopes and the evolution of Earth’s surface sulfur cycle. Earth Sci. Rev. 106, 161–183. doi: 10.1016/j.earscirev.2011.02.003
Jørgensen, B. B., and Kasten, S. (2006). “Sulfur cycling and methane oxidation,” in Marine Geochemistry, eds H. D. Schulz and M. Zabel (Berlin: Springer), 271–309. doi: 10.1007/3-540-32144-6_8
Jørgensen, B. B., and Nelson, D. C. (2004). “Sufide oxidation in marine sediments: geochemistry meets microbiology,” in Sulfur Biogeochemistry – Past and Present, Vol. 379, eds J. P. Amend, K. J. Edward, and T. W. Lyons (Boulder, CO: Geological Society of America), 63–81.
Kolker, A. S. (2005). The Impacts of Climate Variability and Anthropogenic Activities on Salt Marsh Accretion and Loss on Long Island. Ph.D. Thesis. Stony Brook, NY: Stony Brook University, 260.
Koop-Jakobsen, K., Mueller, P., Meier, R. J., Liebsch, G., and Jensen, K. (2018). Plant-sediment interactions in salt marshes – an optode imaging study of O2, pH, and CO2 gradients in the rhizosphere. Front. Plant Sci. 9:541. doi: 10.3389/fpls.2018.00541
Kostka, J. E., and Luther, G. W. (1995). Seasonal cycling of Fe in saltmarsh sediments. Biogeochemistry 29, 159–181. doi: 10.1007/bf00000230
LaFond-Hudson, S., Johnson, N. W., Pastor, J., and Dewey, B. (2018). Iron sulfide formation on root surfaces controlled by the life cycle of wild rice (Zizania palustris). Biogeochemistry 141, 95–106. doi: 10.1007/s10533-018-0491-5
Lamers, L. P. M., Govers, L. L., Jassen, I. C. J. M., Geurts, J. J. M., Van der Welle, M. E. W., and Van Katwijk, M. M. (2013). Sulfide as a soil phytotoxin—a review. Front. Plant Sci. 4:268. doi: 10.3389/fpls.2013.00268
Luo, M., Huang, J., Tong, C., Liu, Y., Duan, X., and Hu, Y. (2017). Iron dynamics in a subtropical estuarine tidal marsh: effect of season and vegetation. Mar. Ecol. Prog. Ser. 577, 1–15. doi: 10.3354/meps12268
Luo, M., Zeng, C. S., Tong, C., Huang, J. F., Chen, K., and Liu, F. Q. (2016). Iron reduction along an inundation gradient in a tidalsedge (Cyperus malaccensis) marsh: the rates, pathways, and contributions to anaerobic organic matter mineralization. Estuaries Coasts 39, 1679–1693. doi: 10.1007/s12237-016-0094-0
Luo, M., Zeng, C. S., Tong, C., Huang, J. F., Yu, Q., Guo, Y. B., et al. (2015). Kinetics of chemical and microbial iron reduction along an inundation gradient in a tidal marsh of the Min River Estuary, Southeastern China. Geomicrobiol. J. 32, 635–647. doi: 10.1080/01490451.2014.950362
Luther, G. W., and Church, T. M. (1988). Seasonal cycling of sulfur and iron in pore waters of a Delaware salt marsh. Mar. Chem. 23, 295–309. doi: 10.1016/0304-4203(88)90100-4
Luther, G. W., Church, T. M., Scudlark, J. R., and Cosman, M. (1986). Inorganic and organic sulfur cycling in salt-marsh pore waters. Science 232, 746–749. doi: 10.1126/science.232.4751.746
Luther, G. W., Findlay, A. J., MacDonald, D. J., Owings, S. M., Hanson, T. E., Beinart, R. A., et al. (2011). Thermodynamics and kinetics of sulfide oxidation by oxygen: a look at inorganically controlled reactions and biologically mediated processes in the environment. Front. Microbiol. 2:62. doi: 10.3389/fmicb.2011.00062
Marsooli, R., Orton, P. M., and Mellor, G. (2017). Modeling wave attenuation by salt marshes in Jamaica Bay, New York, using a new rapid wave model. J. Geophys. Res. Oceans 122, 5689–5707. doi: 10.1002/2016jc012546
Morse, J. W., Millero, F. J., Cornwell, J. C., and Rickard, D. (1987). The chemistry of the hydrogen sulfide and iron sulfide system in natural water. Earth Sci. Rev. 24, 1–42. doi: 10.1016/0012-8252(87)90046-8
New York City Department of Environmental Protection (2007a). Jamaica Bay Watershed Protection Plan, Vol. I. New York, NY: New York City Department of Environmental Protection.
New York City Department of Environmental Protection (2007b). Jamaica Bay Watershed Protection Plan, Vol. II. New York, NY: New York City Department of Environmental Protection.
Rafferty, P., Castagna, J., and Adamo, D. (2010). Building Partnerships to Restore an Urban Marsh Ecosystem at Gateway National Recreation Area. Washington, DC: National Park Service.
Reese, B. K., Finneran, D. W., Mills, H. J., Zhu, M.-X., and Morse, J. W. (2011). Examination and refinement of the determination of aqueous hydrogen sulphide. Aquat. Geochem. 17, 567–582. doi: 10.1007/s10498-011-9128-1
Soana, E., and Bartoli, M. (2013). Seasonal variation of radial oxygen loss in Vallisneria spiralis L: an adaptive response to sediment redox? Aqua. Bot. 104, 228–232. doi: 10.1016/j.aquabot.2012.07.007
Stookey, L. L. (1970). Ferrozine – a new spectrophotometric reagent for iron. Anal. Chem. 42, 779–781. doi: 10.1021/ac60289a016
Sundby, B., Vale, C., Caetano, M., and Luther, G. W. (2003). Redox chemistry in the root zone of a salt marsh sediment in the Tagus Estuary, Portugal. Aquat. Geochem. 9, 257–271. doi: 10.1023/b:aqua.0000022957.42522.9a
Tamborski, J. J., Cochran, J. K., Heilbrun, C., Rafferty, P., Fitzgerald, P., Zhu, Q., et al. (2017). Investigation of pore water residence times and drainage velocities in salt marshes using short-lived radium isotopes. Mar. Chem. 196, 107–115. doi: 10.1016/j.marchem.2017.08.007
USFWS (U.S. Fish & Wildlife Service) (1997). Significant Habitats and Habitat Complexes of the New York Bight Watershed. Charlestown, RI: U.S. Fish & Wildlife service.
Weiss, J. V., Emerson, D., and Megonigal, J. P. (2005). Rhizosphere iron (III) deposition and reduction in a Juncus effusus L.-dominated wetland. Soil Sci. Soc. Am. J. 69, 1861–1870. doi: 10.2136/sssaj2005.0002
Yin, H., Zhu, Q., and Aller, R. C. (2017). An irreversible planar optical sensor for multi-dimensional measurements of sedimentary H2S. Mar. Chem. 195, 143–152. doi: 10.1016/j.marchem.2017.03.005
Zhu, Q., and Aller, R. C. (2012). Two-dimensional dissolved ferrous iron distributions in marine sediments as revealed by a novel planar optical sensor. Mar. Chem. 136-137, 14–23. doi: 10.1016/j.marchem.2012.04.002
Keywords: salt marsh geochemistry, planar optical sensors, Jamaica Bay, 2-D distributions, Fe2+ and H2S
Citation: Zhu Q, Cochran JK, Heilbrun C, Yin H, Feng H, Tamborski JJ, Fitzgerald P and Cong W (2021) Small-Scale Geochemical Heterogeneities and Seasonal Variation of Iron and Sulfide in Salt Marshes Revealed by Two-Dimensional Sensors. Front. Earth Sci. 9:653698. doi: 10.3389/feart.2021.653698
Received: 15 January 2021; Accepted: 06 April 2021;
Published: 29 April 2021.
Edited by:
Natascha Riedinger, Oklahoma State University, United StatesReviewed by:
Vincent Noel, Stanford University, United StatesSophia LaFond-Hudson, Oak Ridge National Laboratory (DOE), United States
Copyright © 2021 Zhu, Cochran, Heilbrun, Yin, Feng, Tamborski, Fitzgerald and Cong. This is an open-access article distributed under the terms of the Creative Commons Attribution License (CC BY). The use, distribution or reproduction in other forums is permitted, provided the original author(s) and the copyright owner(s) are credited and that the original publication in this journal is cited, in accordance with accepted academic practice. No use, distribution or reproduction is permitted which does not comply with these terms.
*Correspondence: Qingzhi Zhu, cWluZy56aHVAc3Rvbnlicm9vay5lZHU=; J. Kirk Cochran, a2lyay5jb2NocmFuQHN0b255YnJvb2suZWR1
†Present Address: Joseph J. Tamborski, Department of Ocean and Earth Sciences, Old Dominion University, Norfolk, VA, United States