 Vassily Mikhaltsevitch
 Maxim Lebedev1
 Euripedes A. Vargas Jr.
 Guilherme F. Vasquez
- 1Exploration Geophysics, Curtin University, Perth, WA, Australia
- 2Department of Civil Engineering, Pontifical Catholic University of Rio de Janeiro, Rio de Janeiro, Brazil
- 3Rock Seismic Profile Integration, Petrobras, Rio de Janeiro, Brazil
In presented paper, we describe the technical and physical aspects of the application of a low-frequency (LF) apparatus based on a longitudinal type of forced oscillations. In particular, we investigate the influence of the strain gauge position on a tested sample on measurement results, we also examine the creep effect associated with the mineralogy of rocks, as well as the dispersion and attenuation in a liquid-saturated rock sample caused by the presence of the volume of pore fluid exterior to the sample (dead volume). The effect of the position of the strain gauges is investigated using a cylindrical acrylic sample and two pairs of strain gauges fixed in the middle and at one of the sample ends under a uniaxial pressure of 15 MPa. The obtained results demonstrate that elastic and anelastic parameters of the tested sample are independent from the location of the strain gauges. The impact of the creep phenomenon on elastic moduli was studied using three room-dry samples of Savonnieres limestone, Berea sandstone and Eagle Ford shale. The measurements were conducted for 120 h at a frequency of 2 Hz under a uniaxial pressure of 10 MPa and demonstrated that the LF moduli of all rocks were noticeably reduced with time. The effect of dead volume was investigated at seismic frequencies using limestone saturated with n-decane. It was found that the Young’s and bulk moduli exhibit strong dispersion at frequencies above 10 Hz if the dead volume is close to or greater than the pore volume of the sample. We also found that the characteristic frequency of dispersion corresponding to the attenuation peak is independent of the size of the dead volume and determined only by the physical parameters of the sample and pore fluid. We present also the results of the Young’s modulus and attenuation measurements conducted at seismic frequencies on vertical and horizontal shale samples saturated with water. It was shown that the relationship between the extensional attenuation and the Young’s modulus dispersion observed in the samples saturated at a relative humidity of 97.5% is consistent with the Kramers–Kronig relation.
Introduction
In the past decades, a variety of forced-oscillation (FO) methods have been employed to measure the mechanical properties of rocks, in which dissipated energy is characterized by a phase lag between stress and strain. The upper frequency of the FO methods, generally covering the frequency range from 10–5 to 100 Hz, is limited by spurious acoustic resonances in the tested sample or in the mechanical parts of the instrument (D’Anna and Benoit, 1990; Lakes, 2004).
The first FO measurements of the intrinsic attenuation and elastic parameters of rocks were performed by Bruckshaw and Mahanta (1961); Peselnick and Outerbridge (1961), and Usher (1962). Bruckshaw, Mahanta and Usher developed à forced vibration method where the Young’s modulus of a specimen is estimated by measuring the magnitude of vibration for an exciting sinusoidal force at a frequency much less than the resonant frequency of the measurement system, and the attenuation is determined as the phase shift (loss angle) between the specimen vibrations and the applied force. Peselnick and Outerbridge (1961) designed a torsion pendulum, where a tested specimen is submitted to a harmonic torque at frequencies of 1 to 10 Hz, that enables measurements of attenuation and shear moduli of coherent rocks. Bruckshaw and Mahanta (1961) observed an increase of 2% in the Young’s modulus of various dry rocks at frequencies between 40 and 120 Hz. A similar result for dry sedimentary and igneous rocks was obtained by Usher (1962) at the frequency range from 2 to 40 Hz. Usher also observed a decrease in the Young’s modulus of the rocks containing moisture, accompanied by a large increase in attenuation with frequency. Peselnick and Outerbridge (1961) combined attenuation data for dry Solnhofen limestone obtained using the torsional pendulum (4–10 Hz) and a bar resonance setting (10 kHz) with the results of the ultrasonic attenuation measurements (10 MHz) of Peselnick and Zietz (1959) conducted on the same sample. They found that the shear internal friction in the dry limestone increases fivefold with an increase of frequency from 4 to 10 MHz, while the shear modulus remains constant.
In all first FO experiments the amplitude of strains in rocks was not controlled. Later in a number of studies (Gordon and Davis, 1968; Mavko, 1979; Winkler et al., 1979), it has been reported that frictional attenuation in rocks depends on strain amplitude but it becomes strain-independent for amplitudes <10–6, which more adequately represent seismic-wave strains in real fields. Therefore, to meet the reservoir conditions, laboratory measurements should be performed with strains below 10–6.
Another requirement, which should be taken into account when constructing an FO device, is related to the boundary conditions. As was shown by Dunn (1986) and White (1986) in their analysis of the experiments carried out by Spencer (1981), the attenuation in a fluid-saturated rock sample with open boundaries can stem from radial fluid flow due to the pressure difference between the central and peripheral parts of the sample (the Biot–Gardner effect). Hence, to avoid the distortion of the attenuation associated with intrinsic absorption mechanisms by the Biot–Gardner effect, the boundaries of the tested samples have to be closed with the membrane impenetrable for fluids and sealed by the confining pressure which has to be higher than the pore pressure in the sample.
The low-frequency (LF) laboratory tests that have been considerably developed in recent decades, utilize a stress-strain relationship and differ by the type of the forced oscillations applied to a specimen under investigation: torsional (Jackson and Paterson, 1987; Paffenholz and Burkhardt, 1989; Nakagawa, 2013; Saltiel et al., 2017), longitudinal (Spencer, 1981; Paffenholz and Burkhardt, 1989; Batzle et al., 2006; Takei et al., 2011), and volumetric (Adelinet et al., 2010). However, the devices based on torsional types of oscillations are not capable to measure the complete set of elastic properties of rocks.
The FO laboratory apparatuses, which are capable of measuring the complete set of elastic moduli, such as Young’s, bulk and shear moduli, and also satisfy the strain-amplitude and boundary conditions, were designed by Spencer et al. (1994); Batzle et al. (2006), Mikhaltsevitch et al. (2014); Pimienta et al. (2015), Szewczyk et al. (2016); Sun et al. (2018), and Borgomano et al. (2020).
In the devices proposed by Spencer et al. (1994); Batzle et al. (2006) and Sun et al. (2018) the hydrostatic confining pressure is exerted by pressurized nitrogen gas. An axial periodical dynamic force is applied to the sample by an electromechanical shaker at a frequency of 0.2–155 Hz (Spencer et al., 1994), 5 Hz–2 kHz (Batzle et al., 2006), or 1 Hz–2 kHz (Sun et al., 2018). Since the shaker is unable to operate under high load, the entire device, including the jacketed rock sample with two strain gauges (Batzle et al., 2006) or capacitive displacement transducers (Spencer et al., 1994) to measure axial and radial strains, is mounted inside a gas pressure vessel. This design creates significant limitations on the dimensions of mechanical assembly of the device. The insufficient mass of the mechanical assembly is a source of spurious resonances (Batzle et al., 2006; Sun et al., 2019).
Another FO laboratory apparatus with the longitudinal type of the forced oscillations and hydraulic oil as a confining-pressure medium was built at the Department of Exploration Geophysics of Curtin University and at the Department of Civil Engineering of Pontifical Catholic University of Rio de Janeiro (Mikhaltsevitch et al., 2014). The apparatus operates at seismic frequencies and measures Poisson ratio and Young modulus by comparing the strains in a rock and in a standard with well-known parameters. The dynamic strains generated in the rock by a piezoelectric actuator do not exceed 10–6. The extensional attenuation is measured as a phase lag between the phases of the applied stress and strain in the sample.
The setups reported by Pimienta et al. (2015) and Szewczyk et al. (2016) are conceptually similar in design to the devices presented by Spencer et al. (1994) and Batzle et al. (2006). A few modifications in the instrument proposed by Pimienta et al. (2015) and Szewczyk et al. (2016) include the replacement of the medium for confining pressure by hydraulic oil and using a piezoelectric actuator instead of an electromechanical shaker. The setup described by Pimienta et al. (2015) is built on the basis of the apparatus presented earlier by Adelinet et al. (2010) and allows to measure bulk modulus using oscillations of the confining pressure at teleseismic frequencies (0.01–0.1 Hz). An upgraded version of this setup reported by Borgomano et al. (2020) is able to measure the complex bulk modulus up to 1 Hz, and Young’s modulus and Poisson ratio up to 1 kHz at temperatures of 20–100°C.
The widespread use of LF measurements of elastic and inelastic properties of rocks based on the FO method in laboratory research has led to the need to summarize the special features of such measurements. Due to certain differences in the utilized techniques underlying various LF apparatuses based on different aspects of the general FO method, and also in medium used to create confining pressure, such generalizations, apparently, should be carried out for each technique separately. In this paper, we describe the technical and physical peculiarities of the application of a LF apparatus based on a longitudinal type of forced oscillations and using a liquid (hydraulic oil) to create confining pressure. In particular, we investigate the influence of the position of the strain gauges on the measurement results, the creep effect associated with the mineralogy of the sample, as well as the dispersion and attenuation in a liquid-saturated sample caused by the presence of the so-called dead volume, i.e., the volume formed by the parts of the fluid line adjoined to both ends of the sample. The effect of the position of the strain gauges was investigated on a 15 cm length cylindrical acrylic sample using two pairs of strain gauges fixed in the middle and at 2 cm from one of the sample ends under an axial pressure of 15 MPa. The impact of the creep phenomenon on elastic moduli was studied using three sedimentary rocks represented by three room-dry samples of Savonnieres limestone, Berea sandstone and Eagle Ford shale. The LF measurements were conducted for 120 h at frequencies of 0.1–120 Hz under a uniaxial pressure of 10 MPa and demonstrated that the moduli of all rocks were reduced with time, upon that the largest reduction was observed in Eagle Ford shale, where the bulk and shear moduli were decreased by 12 and 8%, correspondingly. Furthermore, we present the results of the measurements of the transversely isotropic Young’s moduli and extensional attenuation obtained for two Wellington shale samples as a function of water saturation at frequencies between 0.1 and 100 Hz. The samples were cored along vertical and horizontal directions with respect to the formation bedding and saturated with water at four values of relative humidity ranging from 12 to 97.5%. Peaks of attenuation were found for both samples at relative humidity of 97.5% Hz. Our analysis demonstrates the applicability of the Kramers–Kronig relations for the quantitative analysis of the relationship between the extensional attenuation and the transversely isotropic Young’s moduli of Wellington shale.
Experimental Forced-Oscillation Setup
The mechanical assembly of the experimental setup is presented in Figure 1. The assembly comprises the frame formed by two steel platforms, four poles connecting and supporting the platforms, and a column of units located in the center of the frame (the total mass of the frame is 650 kg). The column is formed by hydraulic and piezoelectric actuators, a Hoek’s triaxial cell, an aluminum standard, a rock sample mounted inside an elastomer sleeve and placed in a Hoek’s cell and two plugs with passages for pore fluid (Figure 1). The Hoek’s cell and the hydraulic actuator are connected with two manual hydraulic pumps, which provide lateral and longitudinal static forces applied to the sample. The dynamic stress applied to the rock sample by the piezoelectric actuator and strains in the rock are controlled by three semiconductor strain gauges (type KSP-6-350-E4, Kyowa Ltd). One gauge attached to the aluminum standard is oriented in the axial direction and the other two, attached to the sample, are orientated to measure radial and axial strains. All strain gauges are connected with electric bridges (BCM-1 Wheatstone Bridge, Omega Engineering) via a feedthrough assembly.
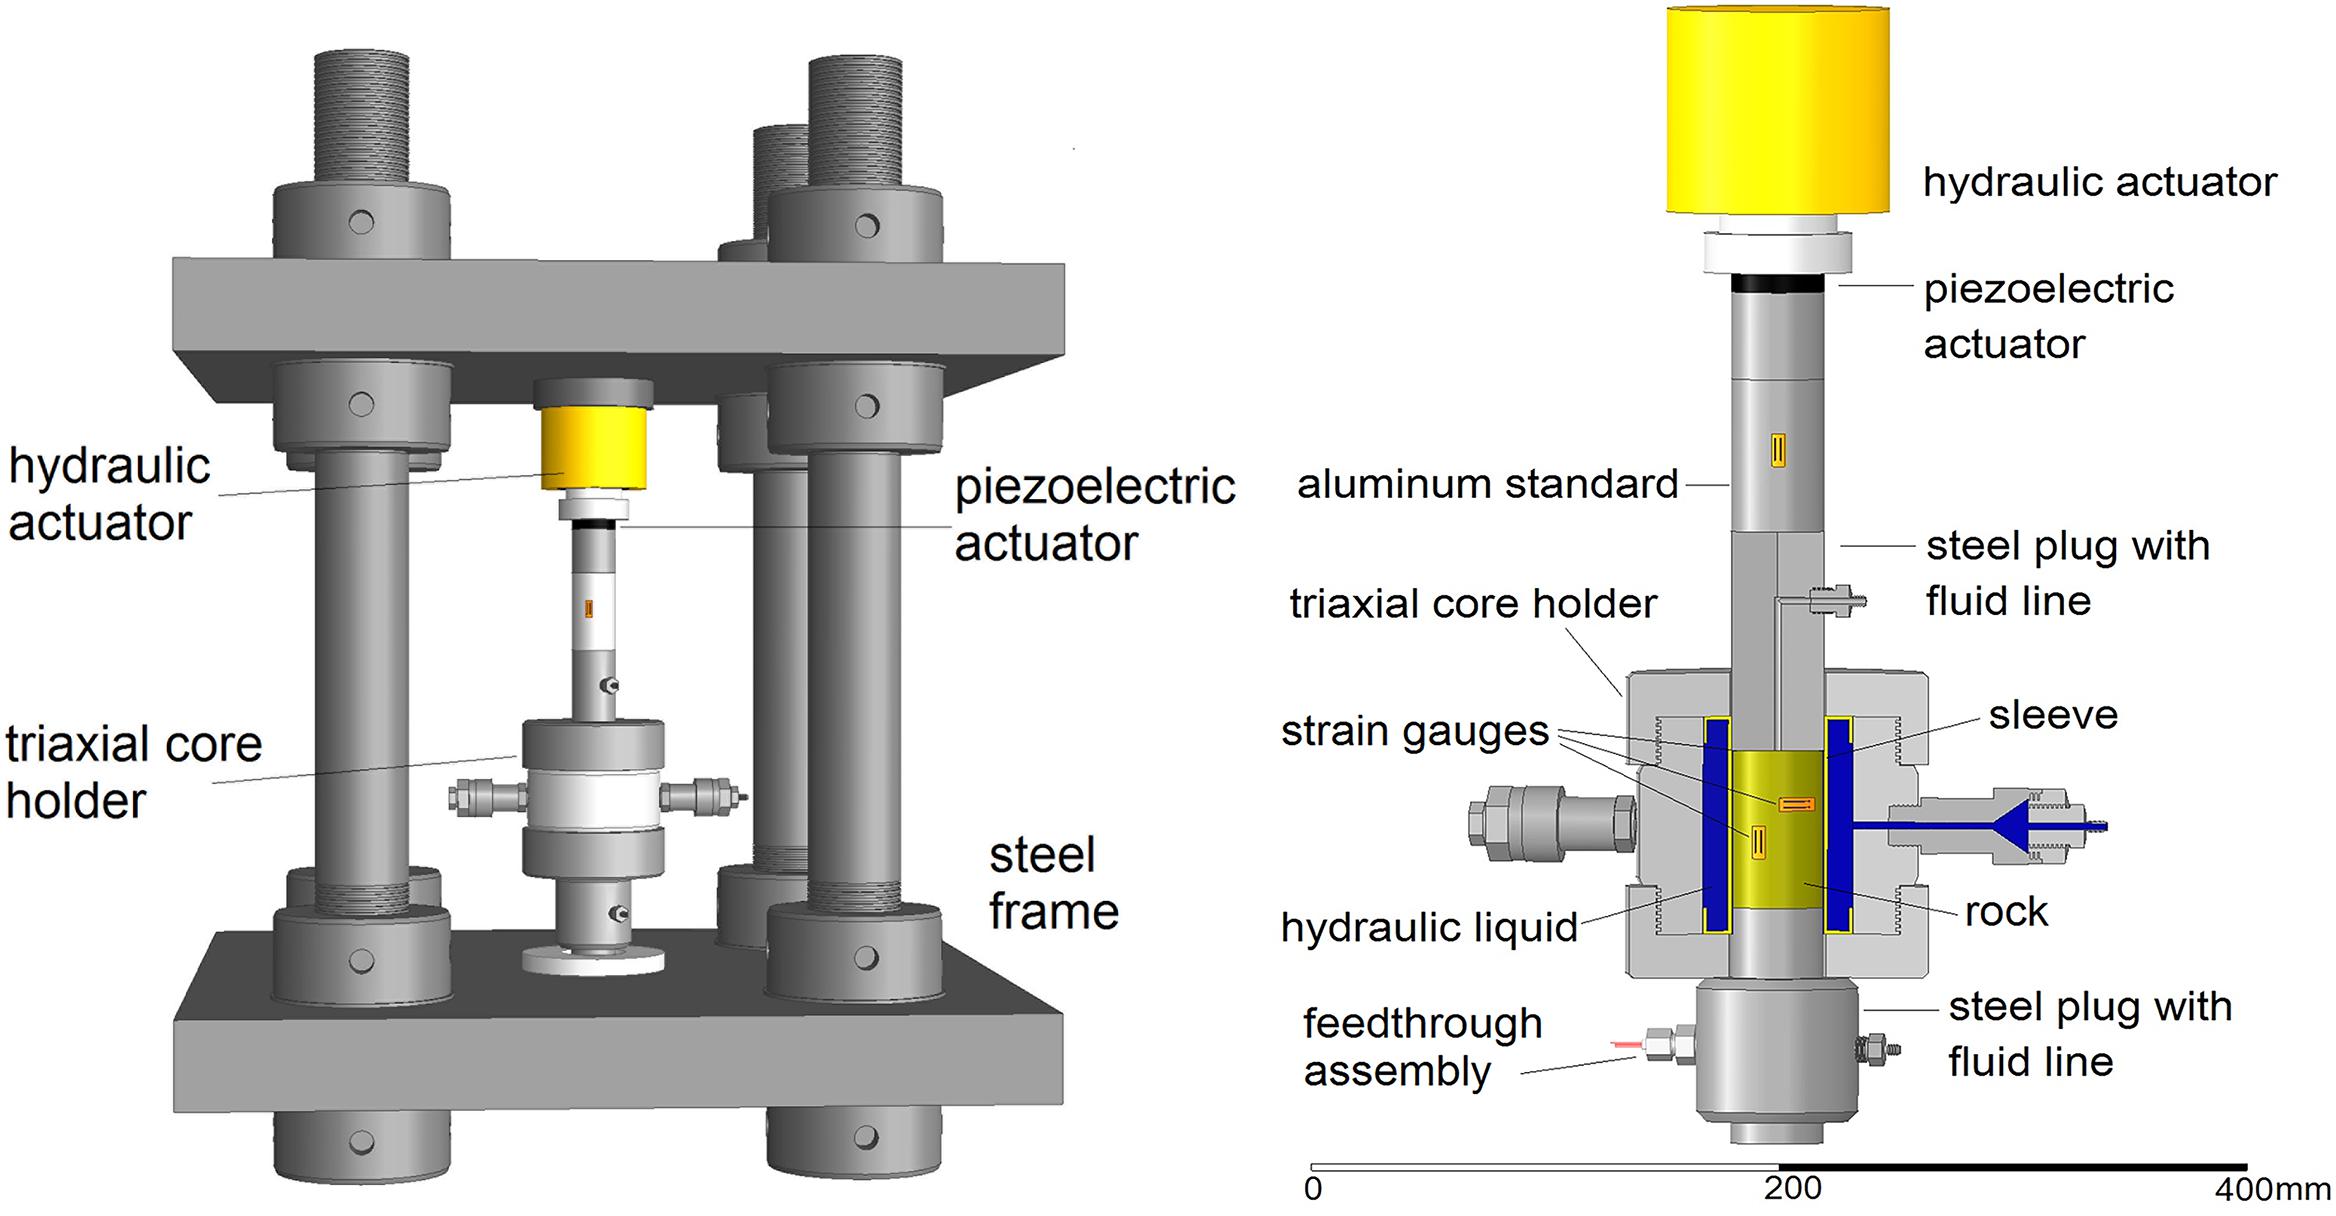
Figure 1. The seismic frequency laboratory rig.
The electrical schematic of the apparatus is presented in Figure 2. The periodic voltage of a generator is converted by the piezoelectric actuator into mechanical stress, which induces displacements in the standard and the rock. The displacements modulate the resistance of the strain gauges. The electric bridges transform the modulated resistance into electric signals, which are digitized by an analog to-digital converter (model 100, InstruNet, Omega Engineering) and then averaged and processed in a data acquisition computer. The extensional attenuation is found as the phase delay between the dynamic stress and the strain in the rock.
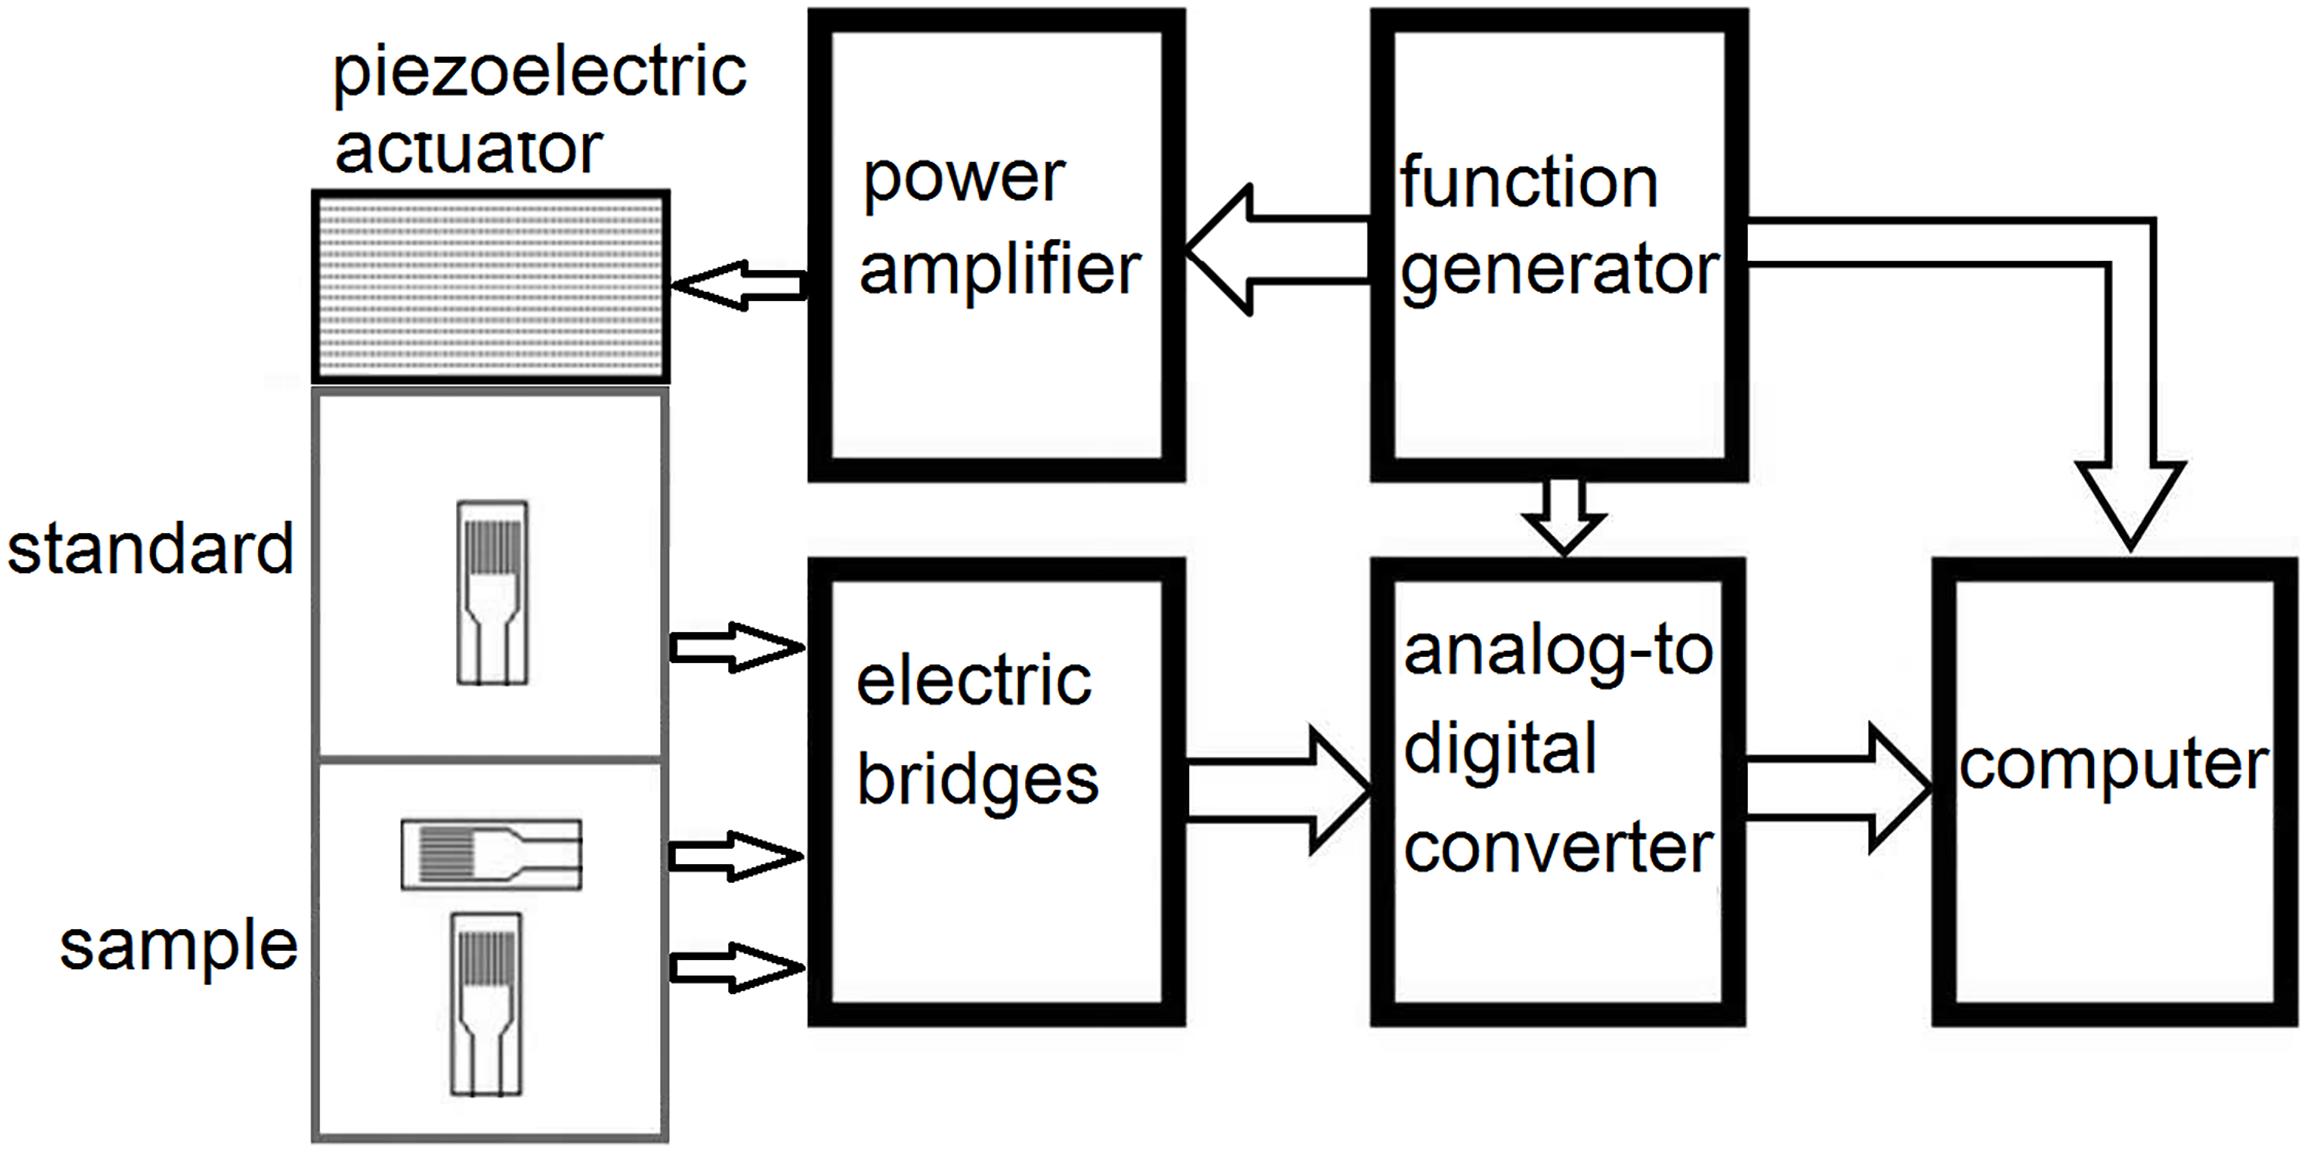
Figure 2. The electrical schematics of the seismic frequency laboratory apparatus.
Method and Operation
Measurements are performed using the stress-strain technique developed by Spencer (1981); Paffenholz and Burkhardt (1989), and Batzle et al. (2006). Our approach is outlined below in more detail.
The Young’s modulus E of the rock sample is obtained as
where εst and εax are the axial strains measured on the standard and rock sample, correspondingly, Est is the known Young’s modulus of the standard.
The Poisson ratio ν is found using the relation
where εrad is the radial strain in the rock. For isotropic rocks, the bulk K and shear μ moduli of the sample can be found as
P- and S-velocities are given by
where ρ is the rock density.
To derive the relationship for the extensional attenuation related to internal frictions in the rock, let us consider the viscoelastic material with the complex Young’s modulus E equal to
where E0 is the absolute value of the Young’s modulus, ϕ is the phase angle between the stress applied to the sample and the strains in the sample (loss angle), σ is the applied stress. Assuming that the loss angle in aluminum is negligible, the Eq. 5 can be rewritten as
where E0 = Estεst/ε0, ε = ε0exp(−iϕ) is the complex amplitude of the strain in the rock, εst and ε0 are the absolute values of the axial strain amplitudes in the standard and rock sample, respectively.
Thus, the extensional attenuation can be presented as
The phase angle ϕ can be found as the phase difference between the strains in the aluminum standard and in the sample.
The uncertainty of the phase measurements in our experiments is ±0.003 rad.
Effect of the Strain Gauge Position on Measurements
In a FO laboratory apparatus, a sample to be measured, which is usually cylindrical, is placed between metal plugs under high static pressure. Presumably, due to the cohesion between the sample and plug ends under applied pressure, the measured specimen can be deformed non-uniformly along its axis, resulting in a “barrel” geometry (Figure 3). In this study, we investigate the “barrel shape” effect using a cylindrical viscoelastic sample of a 15 cm length (acrylic material ASTM-D-5436, Spartech Townsend). To enhance the effect, the ends of the sample were glued to the adjacent metal plugs and only axial pressure was applied in this experiment. The measurement tests were carried out at a uniaxial pressure of 15 MPa. Two pairs of semiconductor strain gauges were attached to the sample, one of which was glued in the middle of the sample, and the other at a distance of two centimeters from one of the ends, and one strain gauge was glued on the standard. The strain gauges of each pair attached to the sample are orientated to measure axial and radial strains.
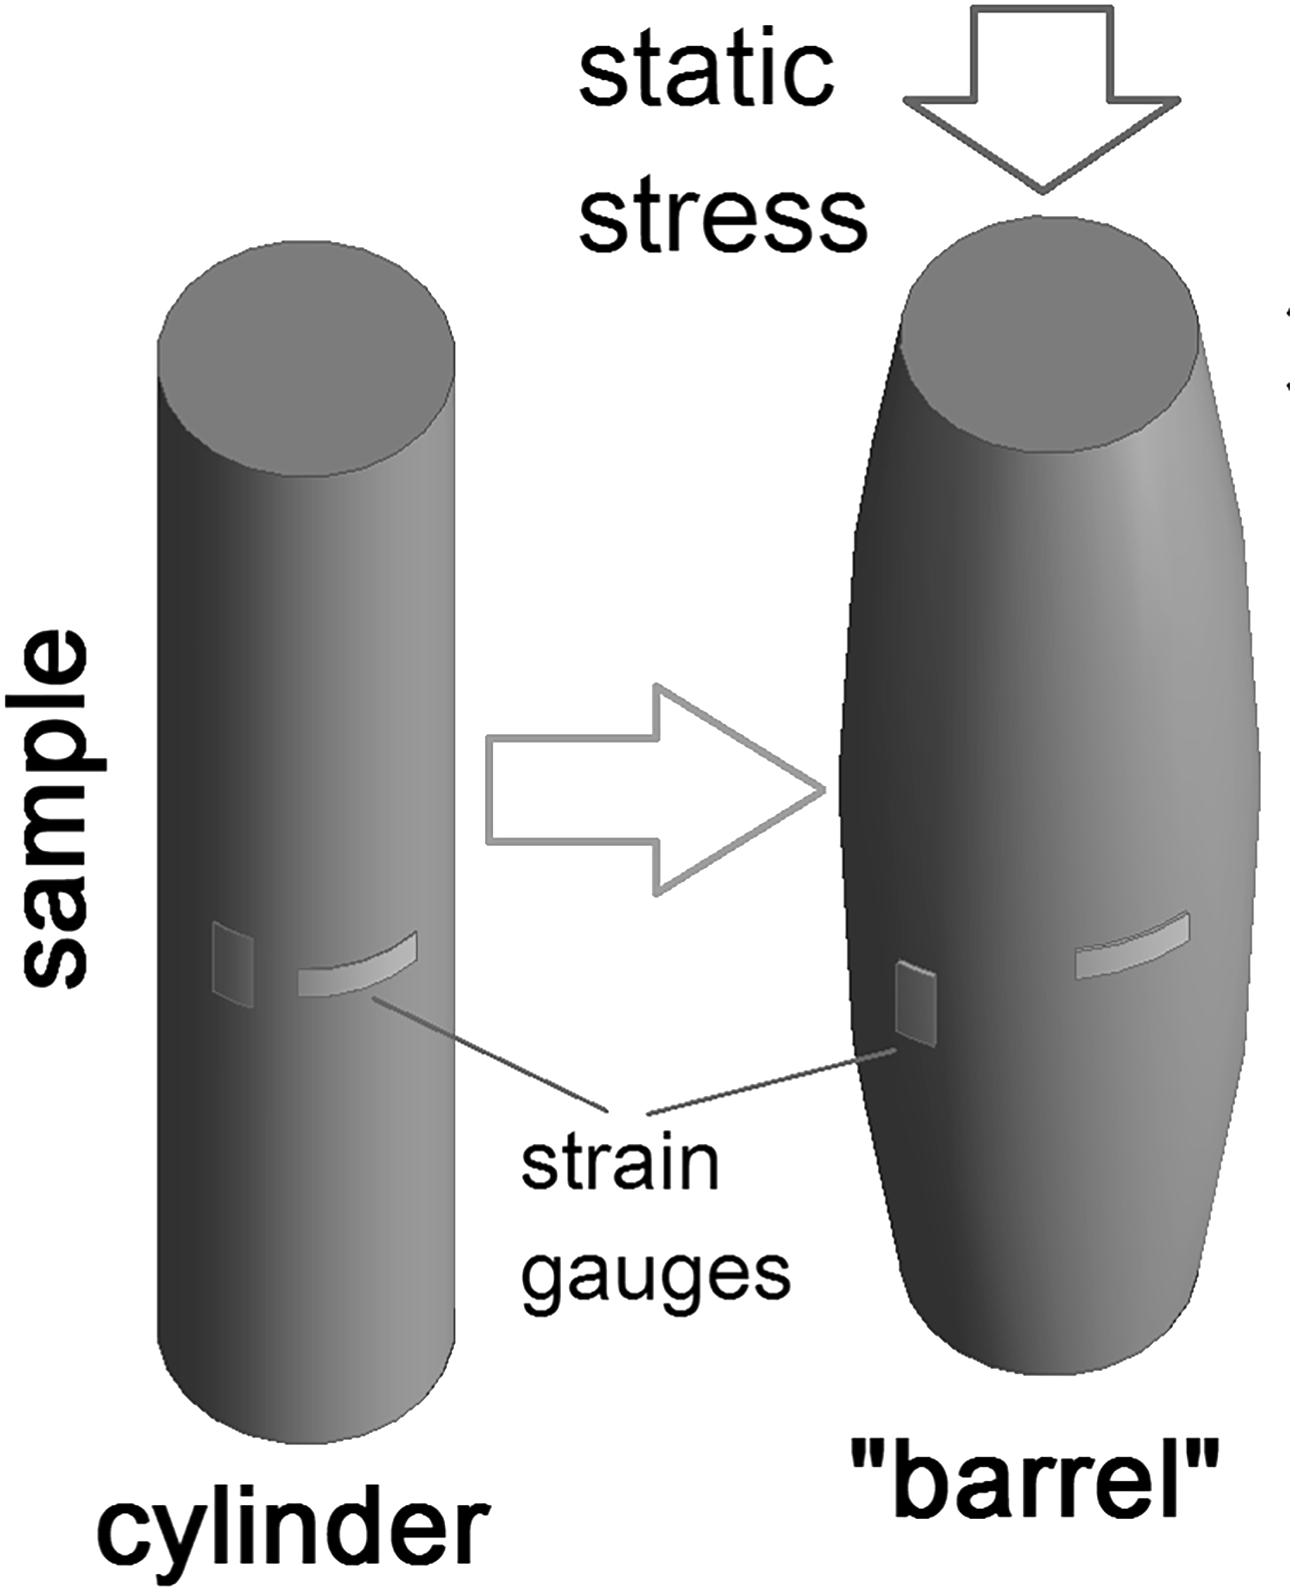
Figure 3. The “barrel” effect under uniaxial static pressure.
The results of the direct measurements of the Young’s modulus and Poisson ratio are presented in Figure 4. The bulk and shear moduli calculated using Eq. 3 and the value of extensional attenuation derived from the phase difference between the strains in the sample and the standard in accordance with Eq. 7 are shown in Figure 5. The error bars for the moduli estimates were computed in accordance with the uncertainty analysis procedure elaborated for LF stress-strain measurements in Adam et al. (2009).

Figure 4. The frequency dependences of the Young’s modulus (A) and Poisson ratio (B) of the acrylic sample measured at a uniaxial of 15 MPa.
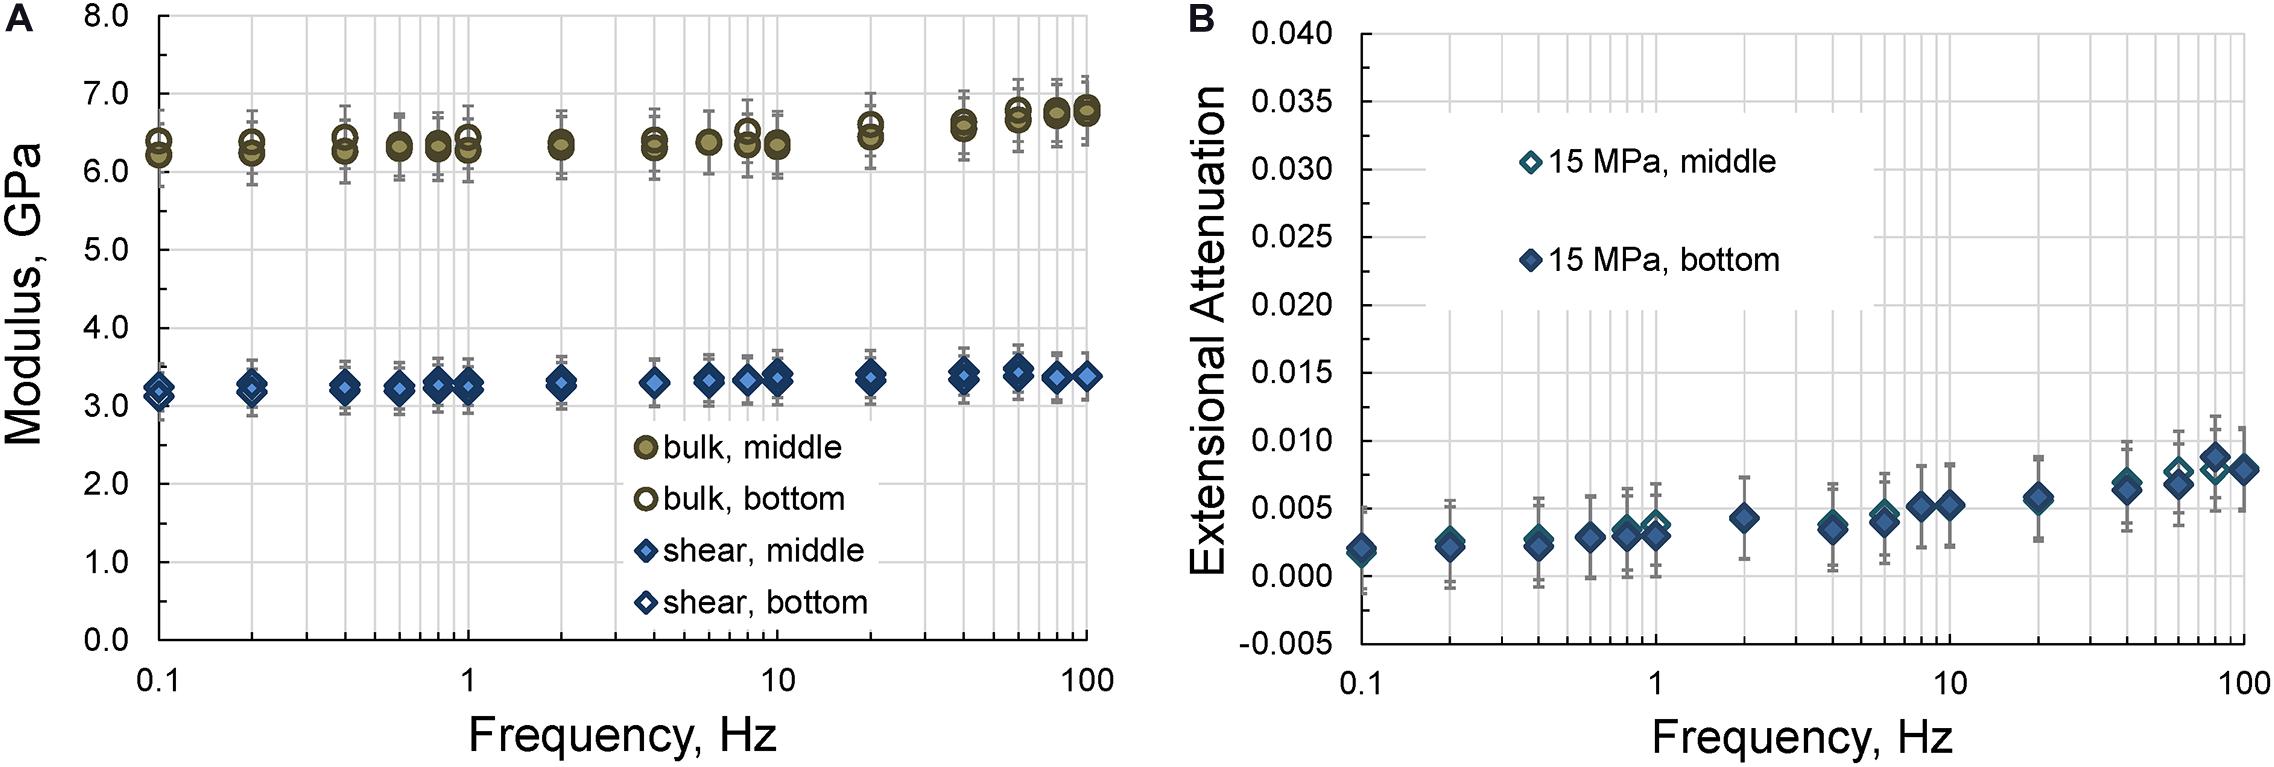
Figure 5. The frequency dependences of the bulk and shear moduli (A) and the extensional attenuation (B) measured on the 15-cm acrylic sample in the middle and at a distance of 2 cm from the lower end of the sample at a uniaxial pressure of 15 MPa.
As can be seen from Figures 4, 5, the results of the measurements are not affected by the position of the strain gauges.
Therefore, we can conclude that the location of the strain gauges on the sample does not affect the results of the LF experiment. Also note that the results of the attenuation measurements demonstrate that the extensional attenuation is also independent of the position of the strain gauges.
The results of our study demonstrate that elastic and anelastic parameters of a cylindrical solid sample made of a relatively soft material such as acrylic are independent of the location of the strain gauges on the sample. However, it should be noted that, as shown by Sun et al. (2020), in the case of fluid-saturated rock samples, the measurement results can be dependent on the position of the strain gauges due to local squirt flow.
Creep Effect in Low-Frequency Experiments
The time-delayed deformation under constant stress, or the creep effect, is one of the most fundamental properties of sedimentary rocks. The creep effect, which originates from viscoelastic properties of the solid framework of a rock, has been extensively studied in recent decades [see, e.g., Lexcellent (2018)]. A significant portion of the experimental techniques developed for the laboratory study of the creep effect is focused on the static and quasi-static aspects of the viscoelastic behavior of a rock (Brantut et al., 2013). However, the influence of the creep effect on the results of LF laboratory measurements of elastic moduli of rocks has not been pursued in detail in rock physics research. As was noted by Takei et al. (2011), the LF methods are sensitive to the contact conditions between a tested rock and surrounding metal plugs, which to a considerable degree depend on the creep properties of the rock. Takei et al. (2011) found that nearly perfect contact for plastic materials can be achieved after a plastic sample experiences a few days of creep under a stress to minimize dislocations. It can be also noted that taking into account the creep effect is important for comparing the results of LF measurements with the results of ultrasonic tests. The latter usually last no longer than a few hours, while LF experiments take in general several days, and therefore creep drifts can have a significant effect on the difference in the measured values of the elastic properties of rocks. Since the LF techniques become common practices in many rock physics laboratories (Subramaniyan et al., 2014; Ògúnsàmì et al., 2020), the influence of the creep effect on the results of the LF measurements becomes an important object of research.
In this section, we present the results of our experimental study conducted on three sedimentary rocks, Savonnieres limestone, Berea sandstone and Eagle Ford shale, at a seismic frequency of 2 Hz, which demonstrate that viscous deformation of the solid framework noticeably affects the dynamic elastic moduli of rocks measured at a relatively low (10 MPa) constant uniaxial pressure.
Creep Experiment
Our experiments were performed using the uniaxial version of the FO apparatus at strain amplitudes of 10–8–10–7. The measurements were carried out for 120 h on three room-dry sedimentary rocks, which are represented by Savonnieres limestone, Berea sandstone and Eagle Ford shale, at a frequency of 2 Hz under a constant uniaxial pressure of 10 MPa. The physical characteristics of the specimens used in our measurements are summarized in Table 1.
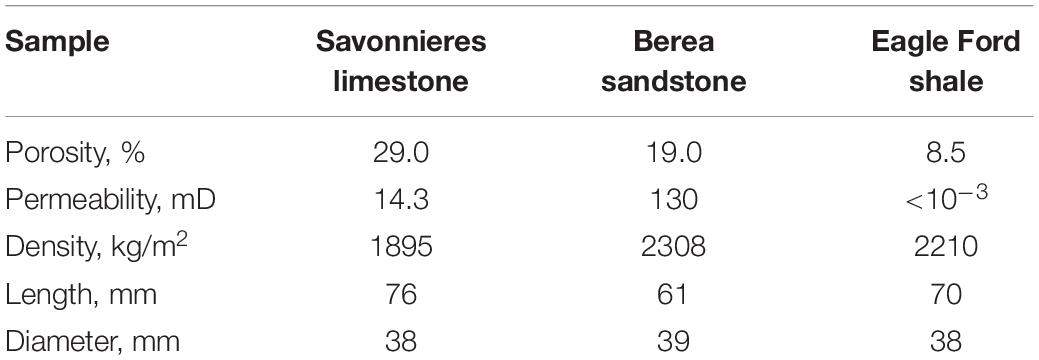
Table 1. Physical characteristics of the specimens.
Results of Creep Measurements
The time dependences of the dynamic elastic moduli obtained at 2 Hz using the FO method for three specimens are presented in Figures 6–8. We found that the changes in elastic moduli obtained after 120 h of the experiment were as follows: Eagle Ford shale–9% (Young), 12% (bulk) and 8% (shear); Savonnieres limestone–5% (Young), 10% (bulk) and 4% (shear); Berea sandstone–3% (Young), 5% (bulk), and 2.5% (shear). The observed decrease in the Poisson ratio was 1% in Eagle Ford shale, and 6% in Savonnieres limestone and Beria sandstone. Our results also show that for all tested rocks the change in both bulk and shear moduli measured 24–30 h after commencing the experiments does not exceed 2%.

Figure 6. The dependencies of the Young’s modulus (A) and Poisson ratio (B) on time measured for three rock samples. The measurements are conducted at a uniaxial pressure of 10 MPa.
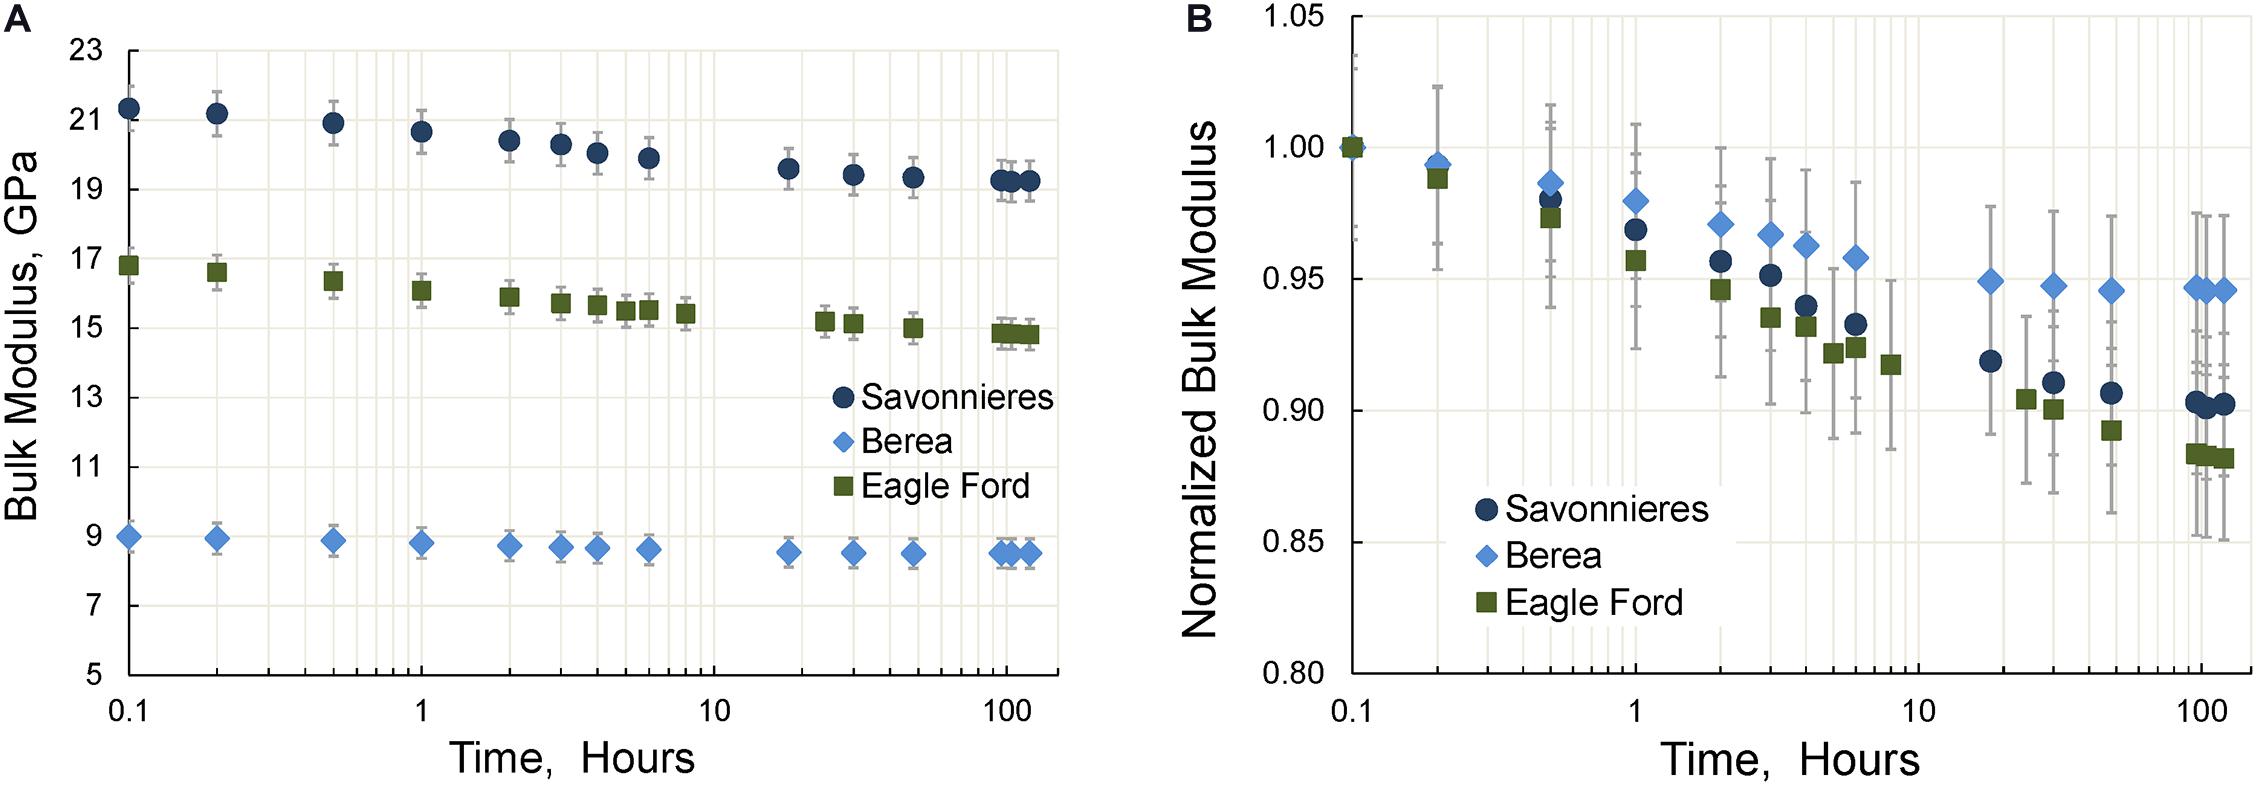
Figure 7. The time dependencies of the bulk (A) and normalized bulk (B) moduli of three tested samples. The measurements are conducted at a uniaxial pressure of 10 MPa.
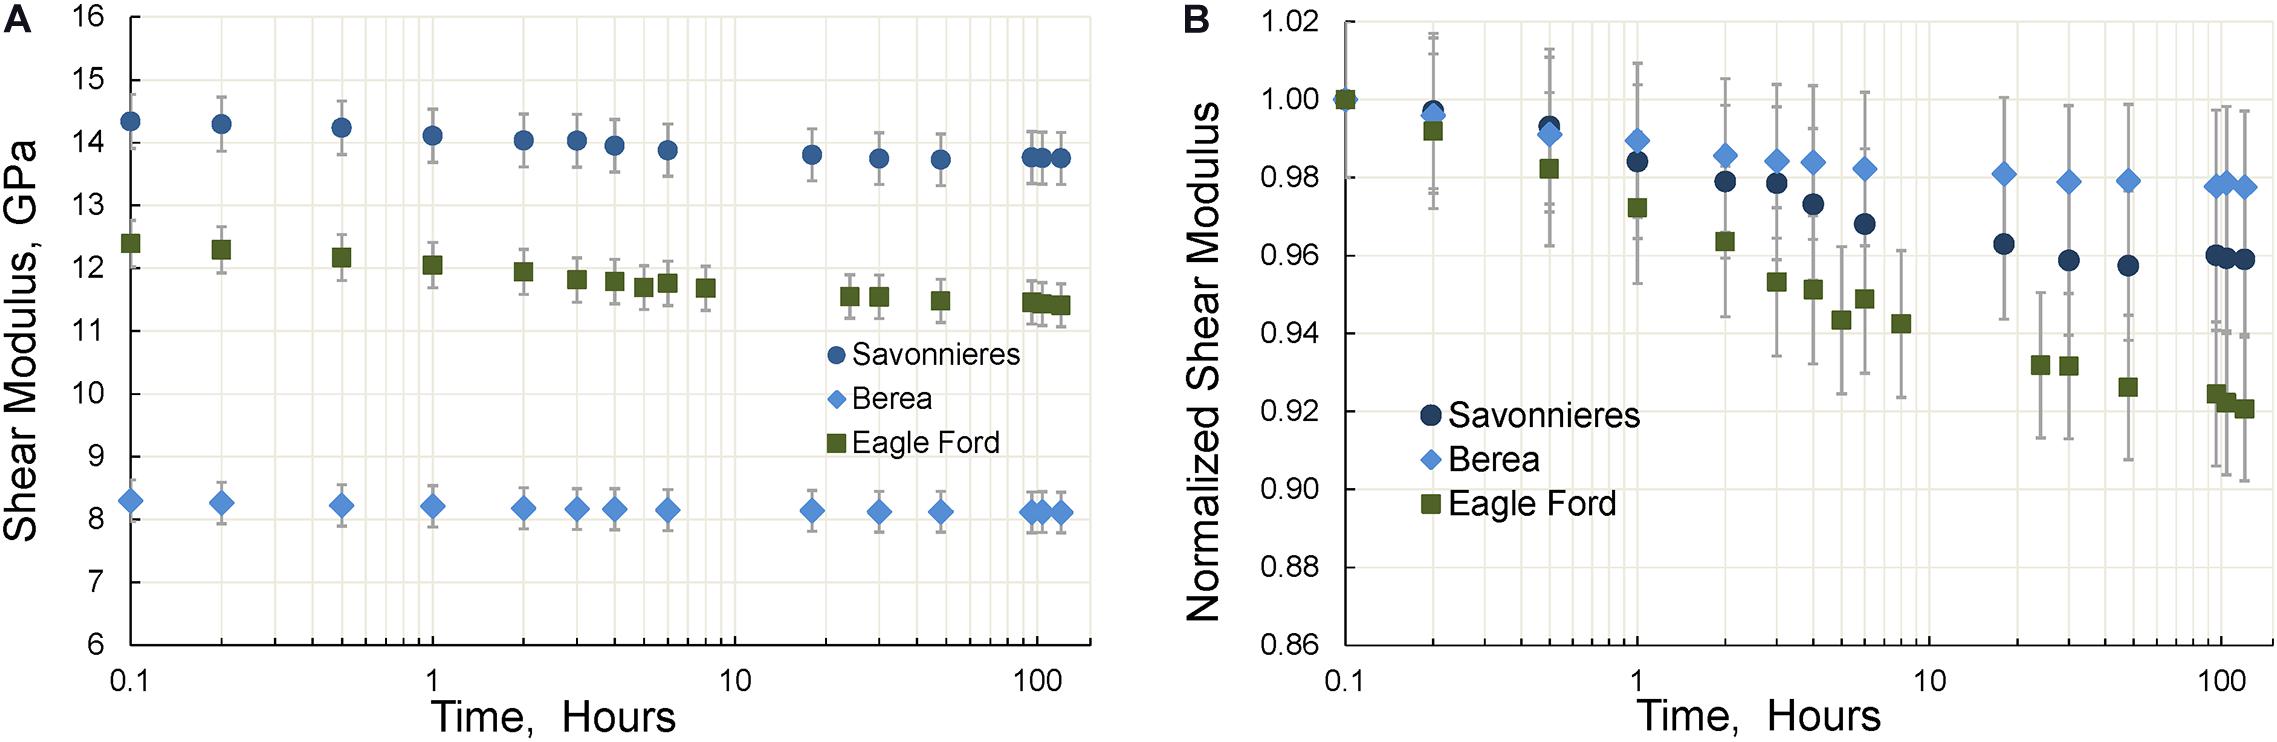
Figure 8. The time dependencies of the shear (A) and normalized shear (B) moduli of three tested samples. The measurements are conducted at a uniaxial pressure of 10 MPa.
The time dependences of the extensional attenuation and P- and S-wave velocities are presented in Figure 9. As can be seen from Figure 9B, the dispersion of the S-wave velocity is less than the dispersion of the P-wave velocity for all rocks. Thus, the decrease of the P- and S-velocities is, correspondingly, 5 and 4% in Eagle Ford shale, 4 and 2% in Savonnieres limestone, and 2 and 1% in Berea sandstone.
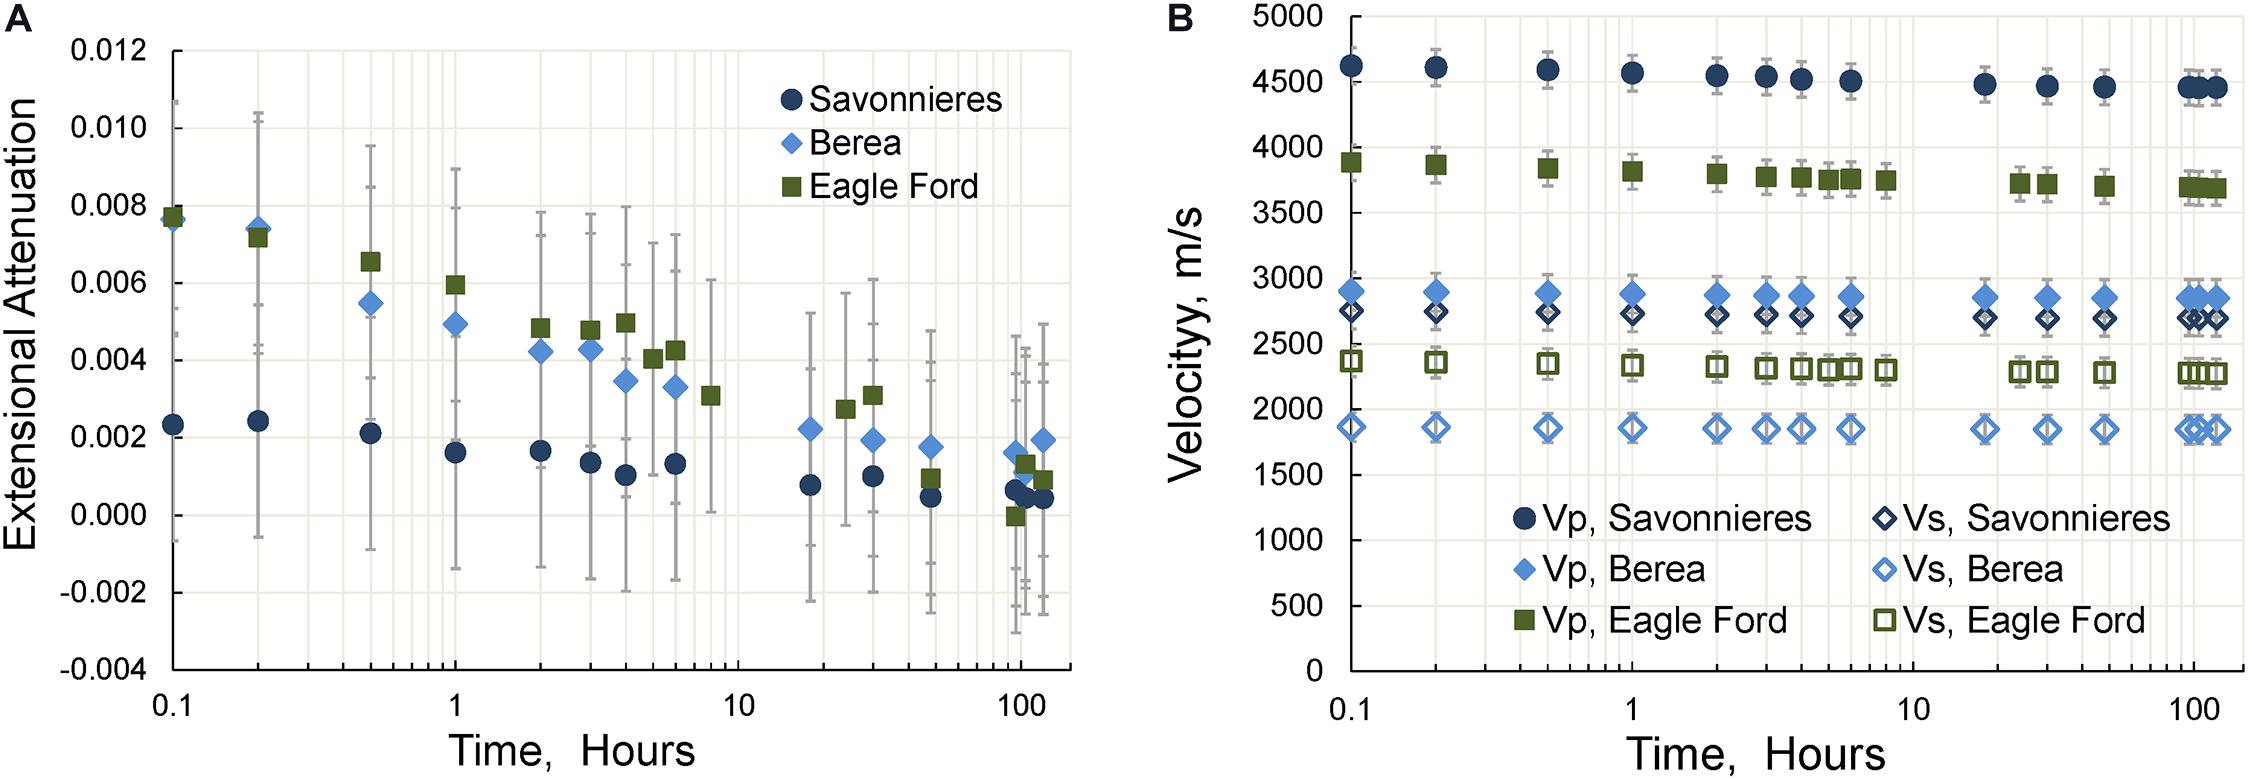
Figure 9. The dependencies of the extensional attenuation (A) and P-wave and S-wave velocities (B) on time. The measurements are carried out at a uniaxial pressure of 10 MPa.
Our study of the influence of the creep on the dynamic elastic moduli of three room-dry sedimentary rocks (Savonnieres limestone, Berea sandstone, and Eagle Ford shale), which was carried out at a seismic frequency of 2 Hz under a constant uniaxial pressure of 10 MPa, demonstrates that the creep effect can have a significant impact on the values of the measured moduli that should be taken into consideration, in particular, when comparing the results of ultrasonic and LF measurements.
The Effect of the Boundary Conditions in the Forced-Oscillation Devices on Low Frequency Measurements
The dispersion of moduli and attenuation observed in the LF experiments based on the FO method are often crucially depend on the boundary conditions of the tested rock sample, whether the sample surface is properly sealed (Dunn, 1986; White, 1986) or surrounded by rigid pore-fluid containers connected with the pore space of the rock, so-called “dead” fluid volumes (Cheng, 2016). As a rule, these dead volumes are represented by the segments of the fluid line located between the sample ends and the nearby valves. Dunn (1986) and White (1986) showed that open boundary conditions cause radial fluid flow due to the pressure difference between the center and the surface of the tested sample, which results in the observed dispersion of moduli and the attenuation (Dunn, 1986). Using the results of the experiments carried out on water- and glycerol-saturated Fontainebleau and Berea sandstones with a dead volume of 6.6 ml at frequencies of 0.004–0.4 Hz (Pimienta et al., 2015), Pimienta et al. (2016) demonstrated that the dead volume can also be accountable for the flow of the pore fluid even under conditions of à fully saturated rock and a closed pore-fluid line, and, as a consequence, for the observed attenuation and bulk modulus dispersion.
The purpose of this study is to quantify the dead volume effect in a seismic frequency range of 0.1–120 Hz. We estimate the impact of the size of the dead volume on the frequency dependences of the elastic moduli.
Experiments With Dead Volume
In this study, the LF experiments were carried out on a Savonnieres limestone sample at a differential pressure of 7 MPa. The physical parameters of the dry sample are as follows: the density is 1920 kg/m3, porosity and permeability are 29% and 14.3 mD, correspondingly. The diameter of the sample is 38 mm, the length is 71 mm, and the pore space is 23 ml.
In our FO apparatus, the storage capacity of the pore fluid can be varied from 2 to 270 ml. We used this capacity as a variable dead volume to estimate the impact of the dead volume on the measured elastic moduli of the sample. The pore fluid used in our experiments was n-decane. The parameters of n-decane at 20°C are as follows: the density is 730 kg/m3, viscosity is 0.92 mPas, the bulk modulus is equal to 1.15 GPa (Prak et al., 2017).
Here we present the frequency dependences of the elastic moduli measured with dead volumes equal to 2, 30, and 100 ml at a pore pressure of 3 MPa, as well as with the open fluid line, in the frequency range of 0.1–120 Hz. The confining pressure was 10 MPa in the experiments with the dead volumes and 7 MPa when the fluid line was open.
Results of Experiments With Dead Volume
The frequency dependences of the Young’s modulus and Poisson ratio measured with three dead volumes and with the open fluid line are given in Figure 10.
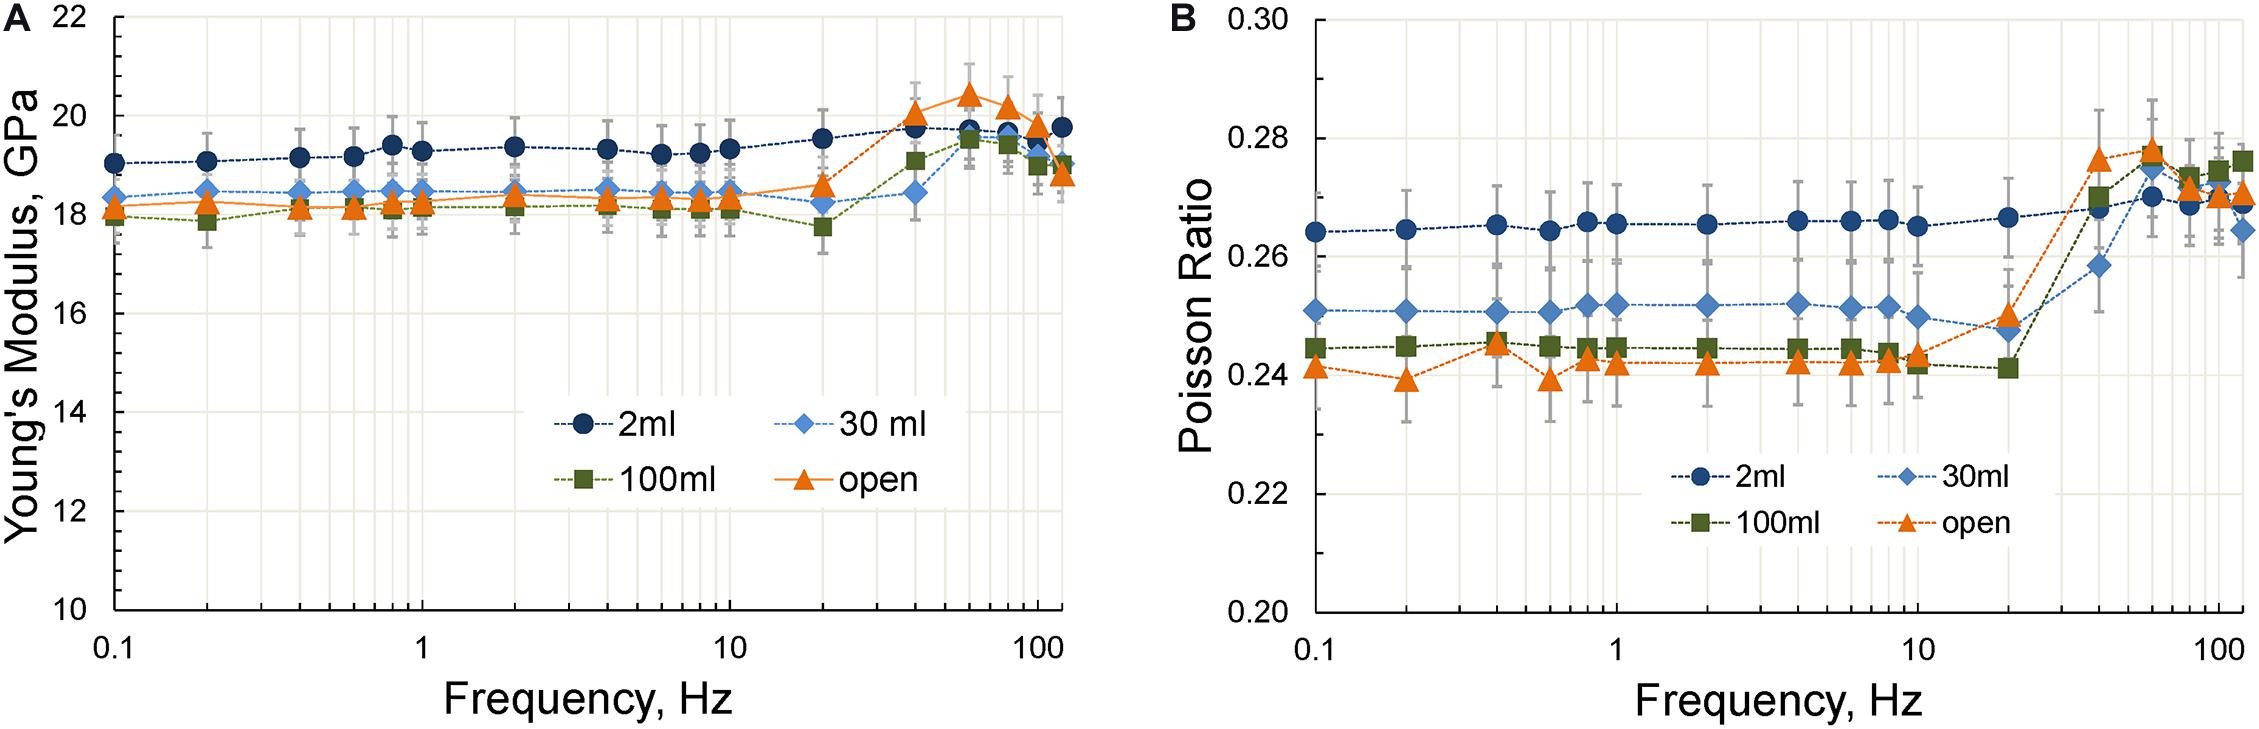
Figure 10. The frequency dependences of the Young’s modulus (A) and Poisson ratio (B) measured at dead volumes of 2, 30, and 100 ml, as well as with the open fluid line. All measurements are performed at a differential pressure of 7 MPa.
The frequency dependences of the extensional attenuation, bulk and shear moduli obtained in accordance with Eq. 3 for the open line are presented in Figure 11. The dependencies of the bulk moduli demonstrate strong dispersion at frequencies above 20 Hz when the dead volume is close to the pore volume of the sample or exceeds it. Our measurements show that the size of the dead volume does not affect the characteristic frequency of the Young’s/bulk modulus dispersion associated with the attenuation peak, but completely determines the magnitude of this dispersion. As can be seen in Figure 11B, the dispersion of the shear modulus is negligible at all dead volumes.
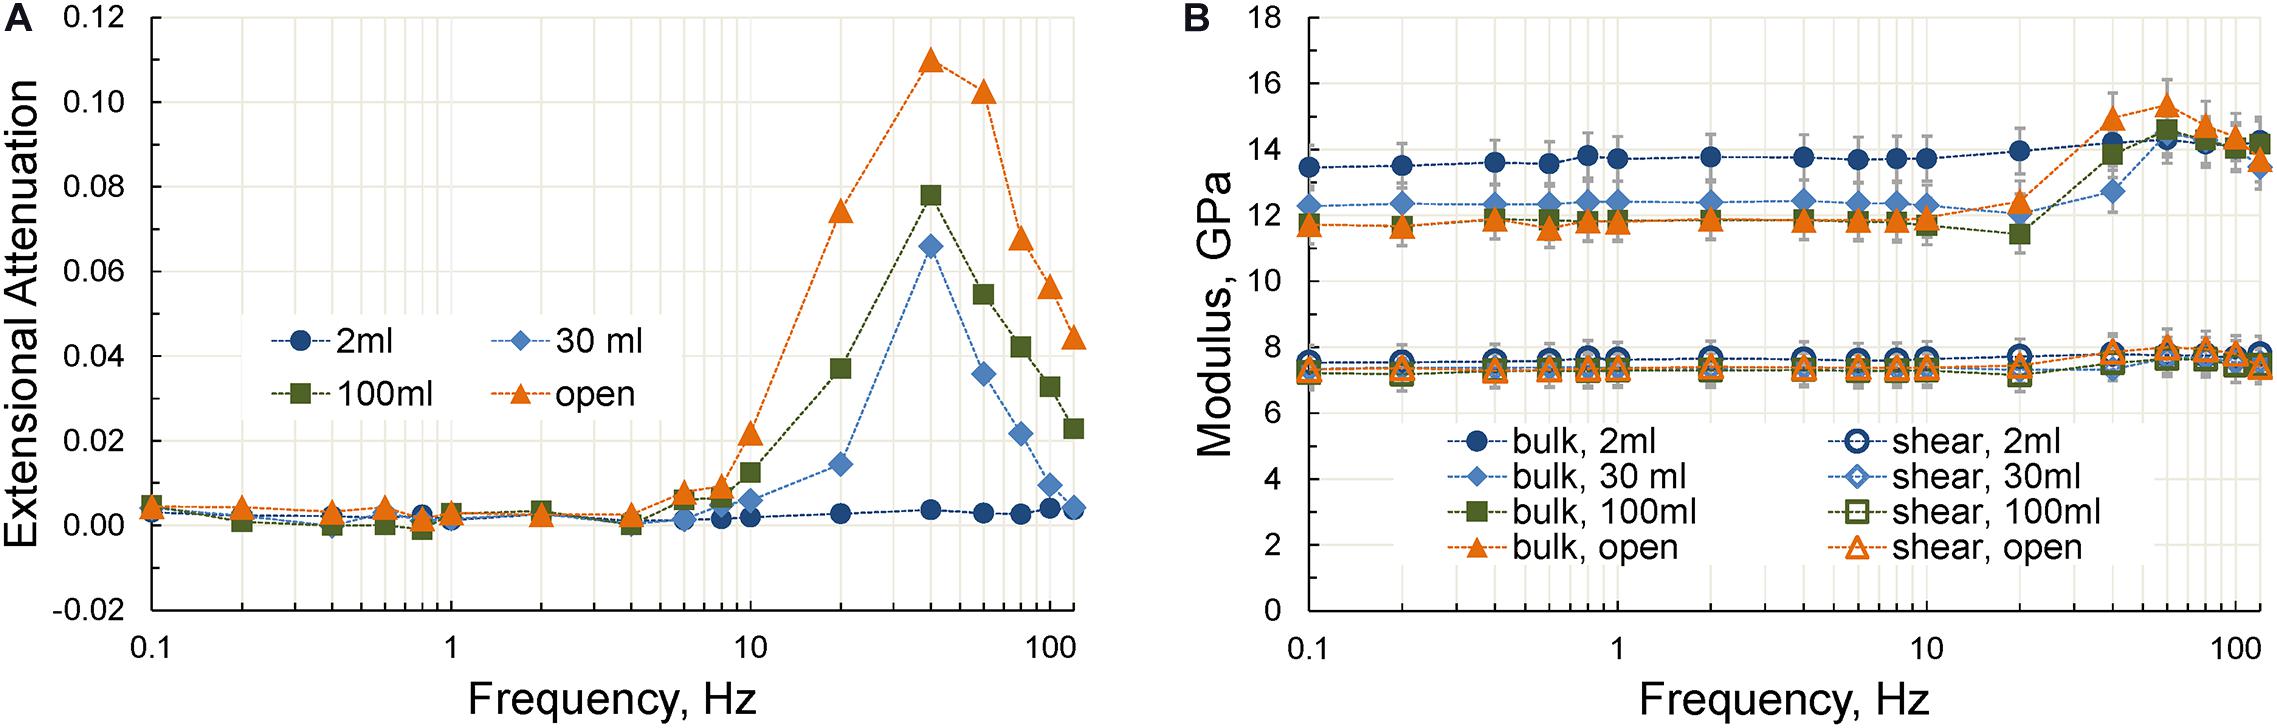
Figure 11. The frequency dependences of the extensional attenuation (A) and the bulk and shear moduli (B) obtained for dead volumes of 2, 30, and 100 ml and for the open fluid line. The measurements are carried out at a differential pressure of 7 MPa.
Analysis of the Experiments With Dead Volume
To estimate the characteristic frequency of the dispersion in a fluid-saturated homogeneous and isotropic porous rock caused by the presence of the dead volume VD, we consider the change in the volumetric strain εV in response to the change in the confining pc and fluid pf pressures. According to Cheng (2016), εV, pc, and pf are connected by the following constitutive equation of poroelasticity
where Kd is the drained bulk modulus, n is the pore pressure coefficient.
Pimienta et al. (2016) developed a poroelastic model for LF experiments with dead volume by solving the one-dimensional diffusion equation. Based on this model, they obtained the following expression for the pore fluid pressure pf in a fully saturated specimen connected to a dead volume container in response to the applied harmonic stress pc = Δp0eiωt with an amplitude of Δp0 :
where B is the Skempton coefficient, L is the length of a rock sample, z is the distance from one of the sample ends, with D = k/(Ssη) being the fluid pressure diffusivity, Ss = n/(B⋅Kd), k is the rock permeability, η is the fluid viscosity, , A is the cross-sectional area of the rock sample, S = VD/Kf, Kf is the bulk modulus of fluid, ω = 2πf, f is the frequency of the harmonic stress applied to the rock.
After substituting Eq. 9 into Eq. 8, we find the volumetric strain εV in the sample subjected to the harmonic stress pc :
The local effective bulk modulus Ke(z,ω) of the combined fluid-saturated sample–dead volume system can be found as
Since, as demonstrated by our experiments, the characteristic frequency of dispersion does not depend on the size of the dead volume, let us consider only the case with the open fluid line, i.e., when Vd→∞ and c→0:
where εAV(z,ω) is the volumetric strain amplitude, corresponds to the strain amplitude in the undrained regime
εVD is the strain amplitude associated with pressure diffusion
where .
The attenuation corresponding to the effective bulk modulus Ke is
As follows from Eqs 12, 14, Im(εV) = Im(εDV) = 0 at both ends of the sample z = 0 and z = L, and, as a consequence, the bulk attenuation is also equal to 0 at both sample ends.
The amplitude of the bulk strain at the location of the strain gauges, in the middle of the sample, is
As follows from Eq. 16, at ω→0 and ε(L/2)→ε0 at ω→∞. In accordance with Eqs 11, 16, the ratio of the undrained bulk modulus Ku and the local drained modulus measured at z = L/2 and ω→0 can be expressed as
If we consider the results of our measurements for bulk moduli presented in Figure 11B and assume that the bulk modulus measured at a dead volume of 2 ml is a good approximation for the undrained bulk modulus Ku, we obtain
Therefore, the attenuation can be estimated as
The analysis of the function −1/cosh((1 + i)x) with real variable shows that the maximum of its imaginary part is reached at
With good accuracy, Eq. 20 can be approximated as follows:
Thus, the characteristic frequency of the dispersion fC corresponding to the attenuation peak is
As was demonstrated by Chandler and Johnson (1981), if the drained bulk and shear moduli of a rock are much larger than the bulk moduli of fluid Kf, the diffusivity D is
In this case, Eq. 22 can be rewritten as
Substituting the n-decane viscosity η = 0.92 mPas (Prak et al., 2017) and parameters of the sample into Eq. 24, we obtain
As can be seen in Figure 11A, the analytical solution given by Eq. 24 underestimates the frequency of the attenuation peak observed in the experiment. This can be explained by using the one-dimensional approach in our calculations, which takes into account only the fluid movements along the axis of a sample and neglects the movements orthogonal to the axis. However, the found analytical solution is a reasonably good estimate for the characteristic frequency of the dispersion and attenuation observed in the experiment. The advantage of this solution, besides its simplicity, is that it is based only on the physical parameters of the sample and fluid.
Let us note, that the frequency of the attenuation peak in the case of the open fluid line can also be considered as the cut-off frequency associated with the transition between drained and undrained regimes. As follows from dimensional analysis of diffusion process, this frequency is proportional to the diffusion coefficient D and inversely proportional to a squared characteristic length l (Cleary, 1978):
Combining Eqs 23, 26, we obtained (David et al., 2013):
For axial diffusion, l is equal to half the length of the sample L, which yields
After substituting the parameters of n-decane and the sample, we obtain the estimate of the frequency of the attenuation associated with diffusion along the saturated sample
which is higher than the frequency of the attenuation peak obtained in the experiment.
Therefore, Eqs 24, 28 can be considered as the lower and upper bounds for the observed frequency of the attenuation peak fexp
The important finding of our experiments with dead volume, carried out in the seismic frequency band on Savonnieres limestone saturated with n-decane, lies in the fact that the characteristic frequency of dispersion does not depend on the size of the dead volume and is completely determined by the parameters of a tested sample and saturating fluid.
Application of the Kramers–Kronig Relation to the Measurements on Wellington Shale at Seismic Frequencies
As was pointed out in Mikhaltsevitch et al. (2016b), one of the main issues encountered when using an FO apparatus is the intrinsic spurious resonances occurring in the mechanical parts of the apparatus, which can significantly affect the signals obtained from a tested specimen (Adam et al., 2009; Sun et al., 2019; Li et al., 2020). This issue can be resolved by using a diagnostic tool, such as the Kramers–Kronig relation, which can verify the quality of the measurement results and control the signal distortions stemming from the external interference or intrinsic spurious resonances.
Mikhaltsevitch et al. (2016b); Chapman et al. (2019), and Sun et al. (2020) demonstrated that the Kramers–Kronig relation in the form found by Mikhaltsevitch et al. (2016b) can be used for verification of the laboratory measurements carried out on solid isotropic specimens at low frequencies. Here we illustrate the applicability of the Kramers–Kronig relation to validate the experimental data obtained for the transversely isotropic (TI) medium represented by Wellington shale. It is shown that the relationship between the measured TI Young’s moduli and extensional attenuation can be validated using the Kramers–Kronig relation.
In this study, we present the results of the measurements of the TI Young’s moduli and extensional attenuation obtained for two smectite-bearing Wellington shale samples drilled at 0° (V-sample) and 90° (H-sample) angles with respect to the bedding plane and saturated with water at relative humidity (RH) of 12, 44, 72, and 97.5%. To avoid a laceration of strain gauges due to the high compressibility of the shale, the laboratory tests were carried out at a relatively low confining pressure of 6 MPa.
Description of Wellington Shale Samples
The Wellington shale samples used in this study are described previously in Mikhaltsevitch et al. (2018). The helium gas permeability and porosity of both samples were estimated at <1 μD and 9%, correspondingly. The XRD analysis of the samples shows that the mineralogy of the shale is as follows: smectite–6%, illite-smectite–19%, kaolinite–9%, quartz–22%, calcite–31%, mica–5%, dolomite–3%, and albite–2%. The shale samples were saturated in desiccators with salt solutions providing RH of 12, 44, 72, and 97.5%. The time of saturation at each HR was 7 weeks. The length of the V- and H-samples is 71 mm and 65 mm, correspondingly, the diameter of both samples is 38 mm, the density is ∼2500 kg/m3 at 44% RH. The TI Young’s moduli and extensional attenuation are evaluated in accordance with expressions (1) and (7), correspondingly.
Results of the Measurements on Wellington Shale
The dependences of the TI Young’s moduli and attenuation on the frequency of stress oscillations obtained at frequencies of 0.1–100 Hz for RH of 12, 44, 72, and 97.5% are shown in Figures 12, 13, respectively. The noticeable Young’s modulus dispersion and attenuation were observed only at saturation corresponding to 97.5% RH. The peaks of attenuation were found at frequencies 2 and 6 Hz for the V- and H-samples, respectively (Figure 13). An estimate of the characteristic frequency fC corresponding to a peak of attenuation is given by the following expression (Dutta and Seriff, 1979)
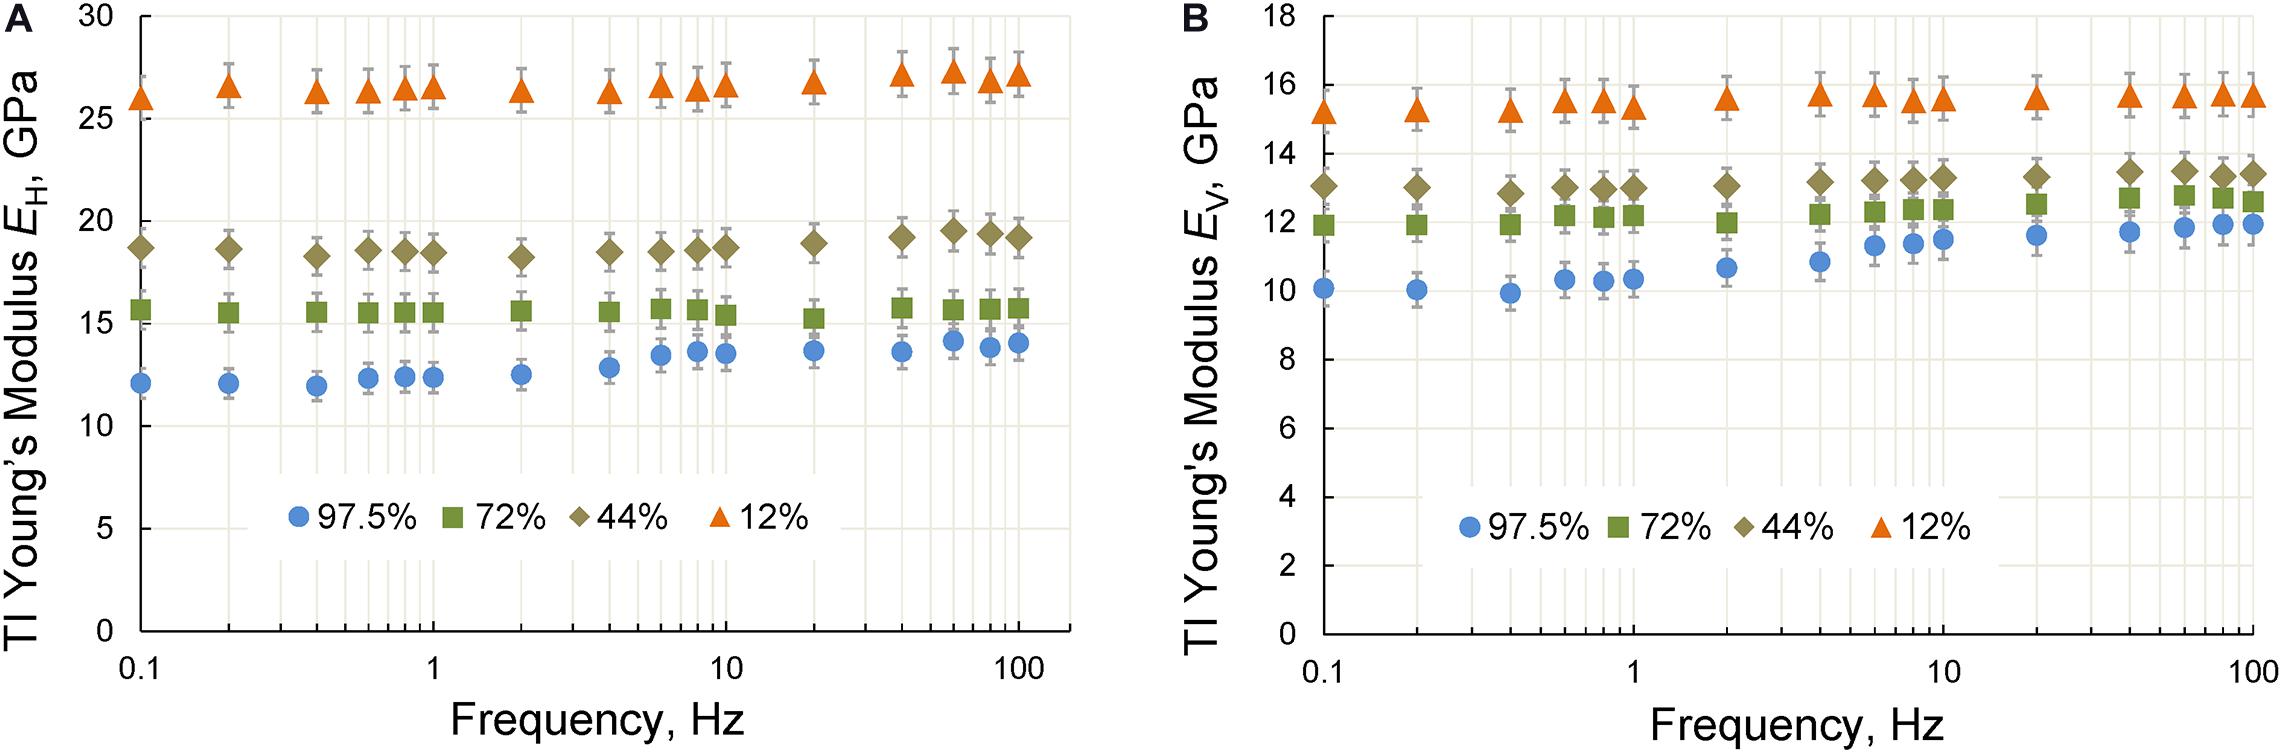
Figure 12. The TI Young’s moduli measured on the horizontal (A) and vertical (B) shale samples saturated at relative humidity of 12, 44, 72, and 97% under a confining pressure of 6 MPa.
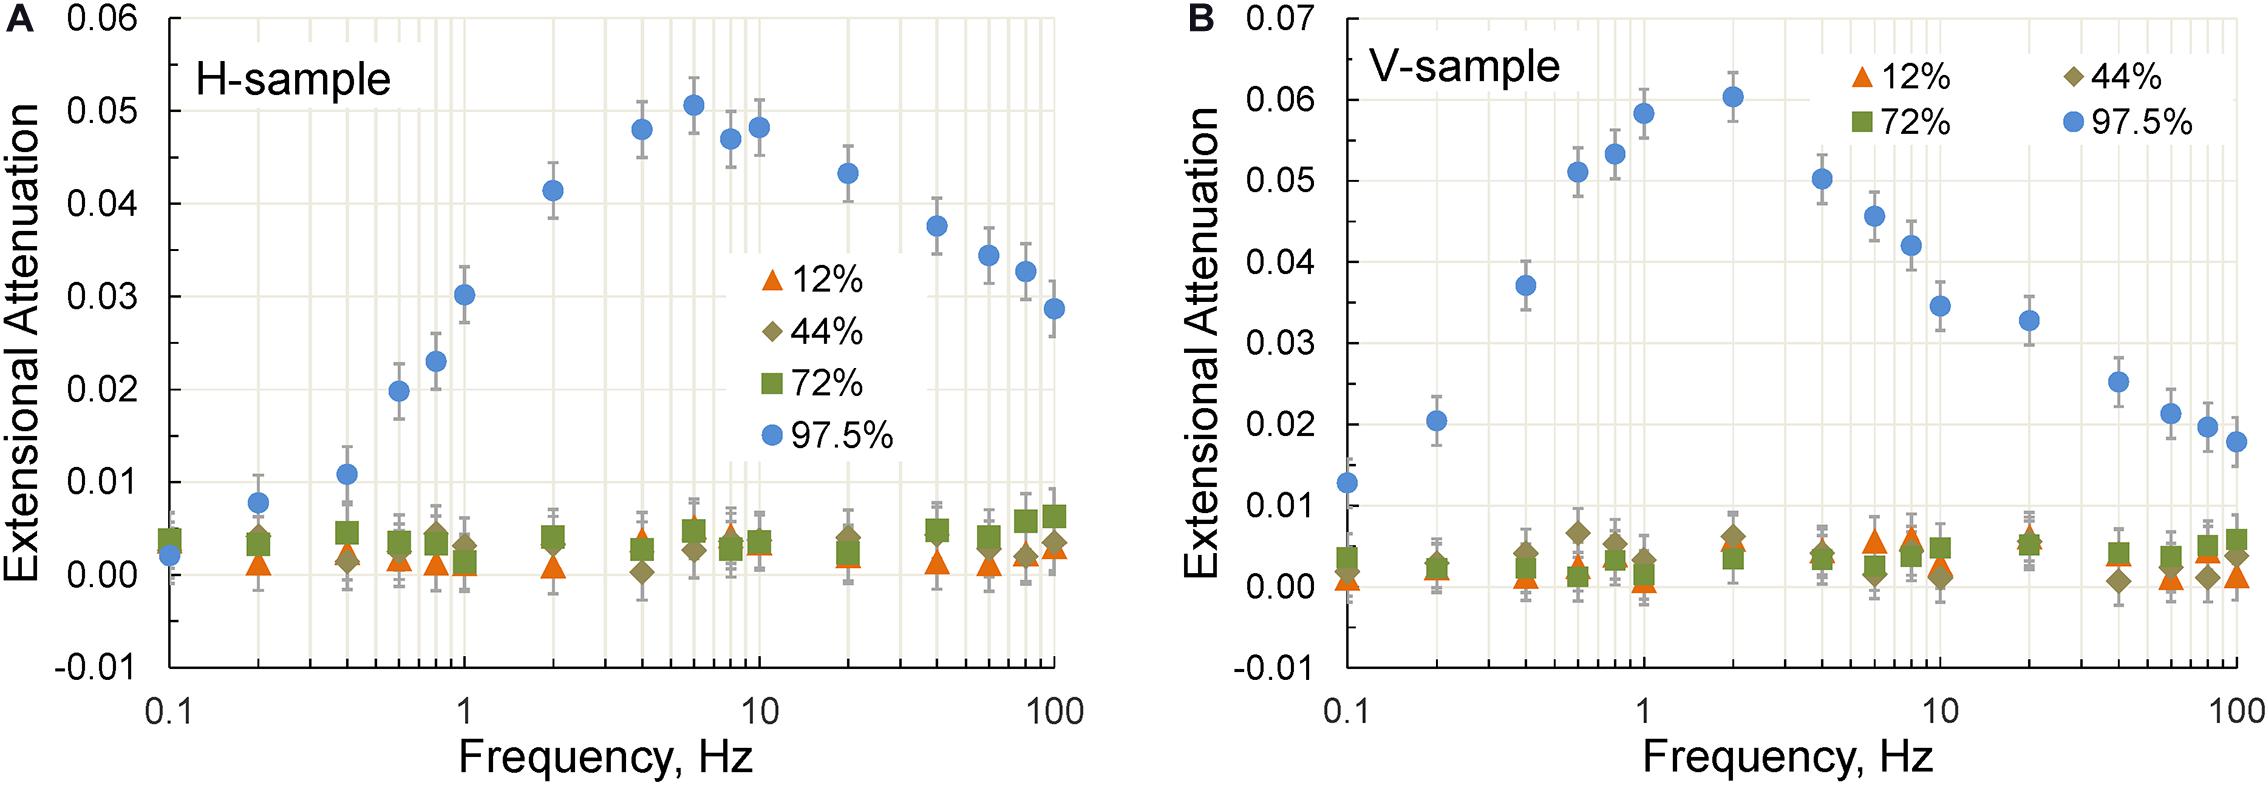
Figure 13. The extensional attenuation measured on the horizontal (A) and vertical (B) samples at a confining pressure of 6 MPa and relative humidity of 12, 44, 72, and 97.5%.
where Kw is the bulk modulus of water, ϕ is the rock porosity, ηw is the water viscosity, k is permeability of the sample, and h is the characteristic size of the water patches in the sample.
Based on Eq. 31, the difference in the peak frequencies observed in the V- and H-samples can be explained by the anisotropy of the permeability of Wellington shale.
Inasmuch as the measurements of Young’s modulus and attenuation were performed synchronously and independently in the frequency range covering most of the attenuation peaks, we can verify the consistency of the experimental data with the causality principle presented by the Kramers–Kronig relations, as described in detail by Mikhaltsevitch et al. (2016b). The Kramers–Kronig relation linking the extensional attenuation with the Young’s modulus E measured at a frequency f and at some reference frequency f0 can be expressed as
The Young’s moduli computed from the attenuation data are presented in Figure 14. Good agreement between the measured and computed Young’s moduli indicates that the measurements are consistent with the causality principle and confirms the physical nature of the observed attenuation and Young’s modulus dispersion. Let us note that the obtained results are qualitatively similar to those previously reported for Mancos shale (Mikhaltsevitch et al., 2016a).
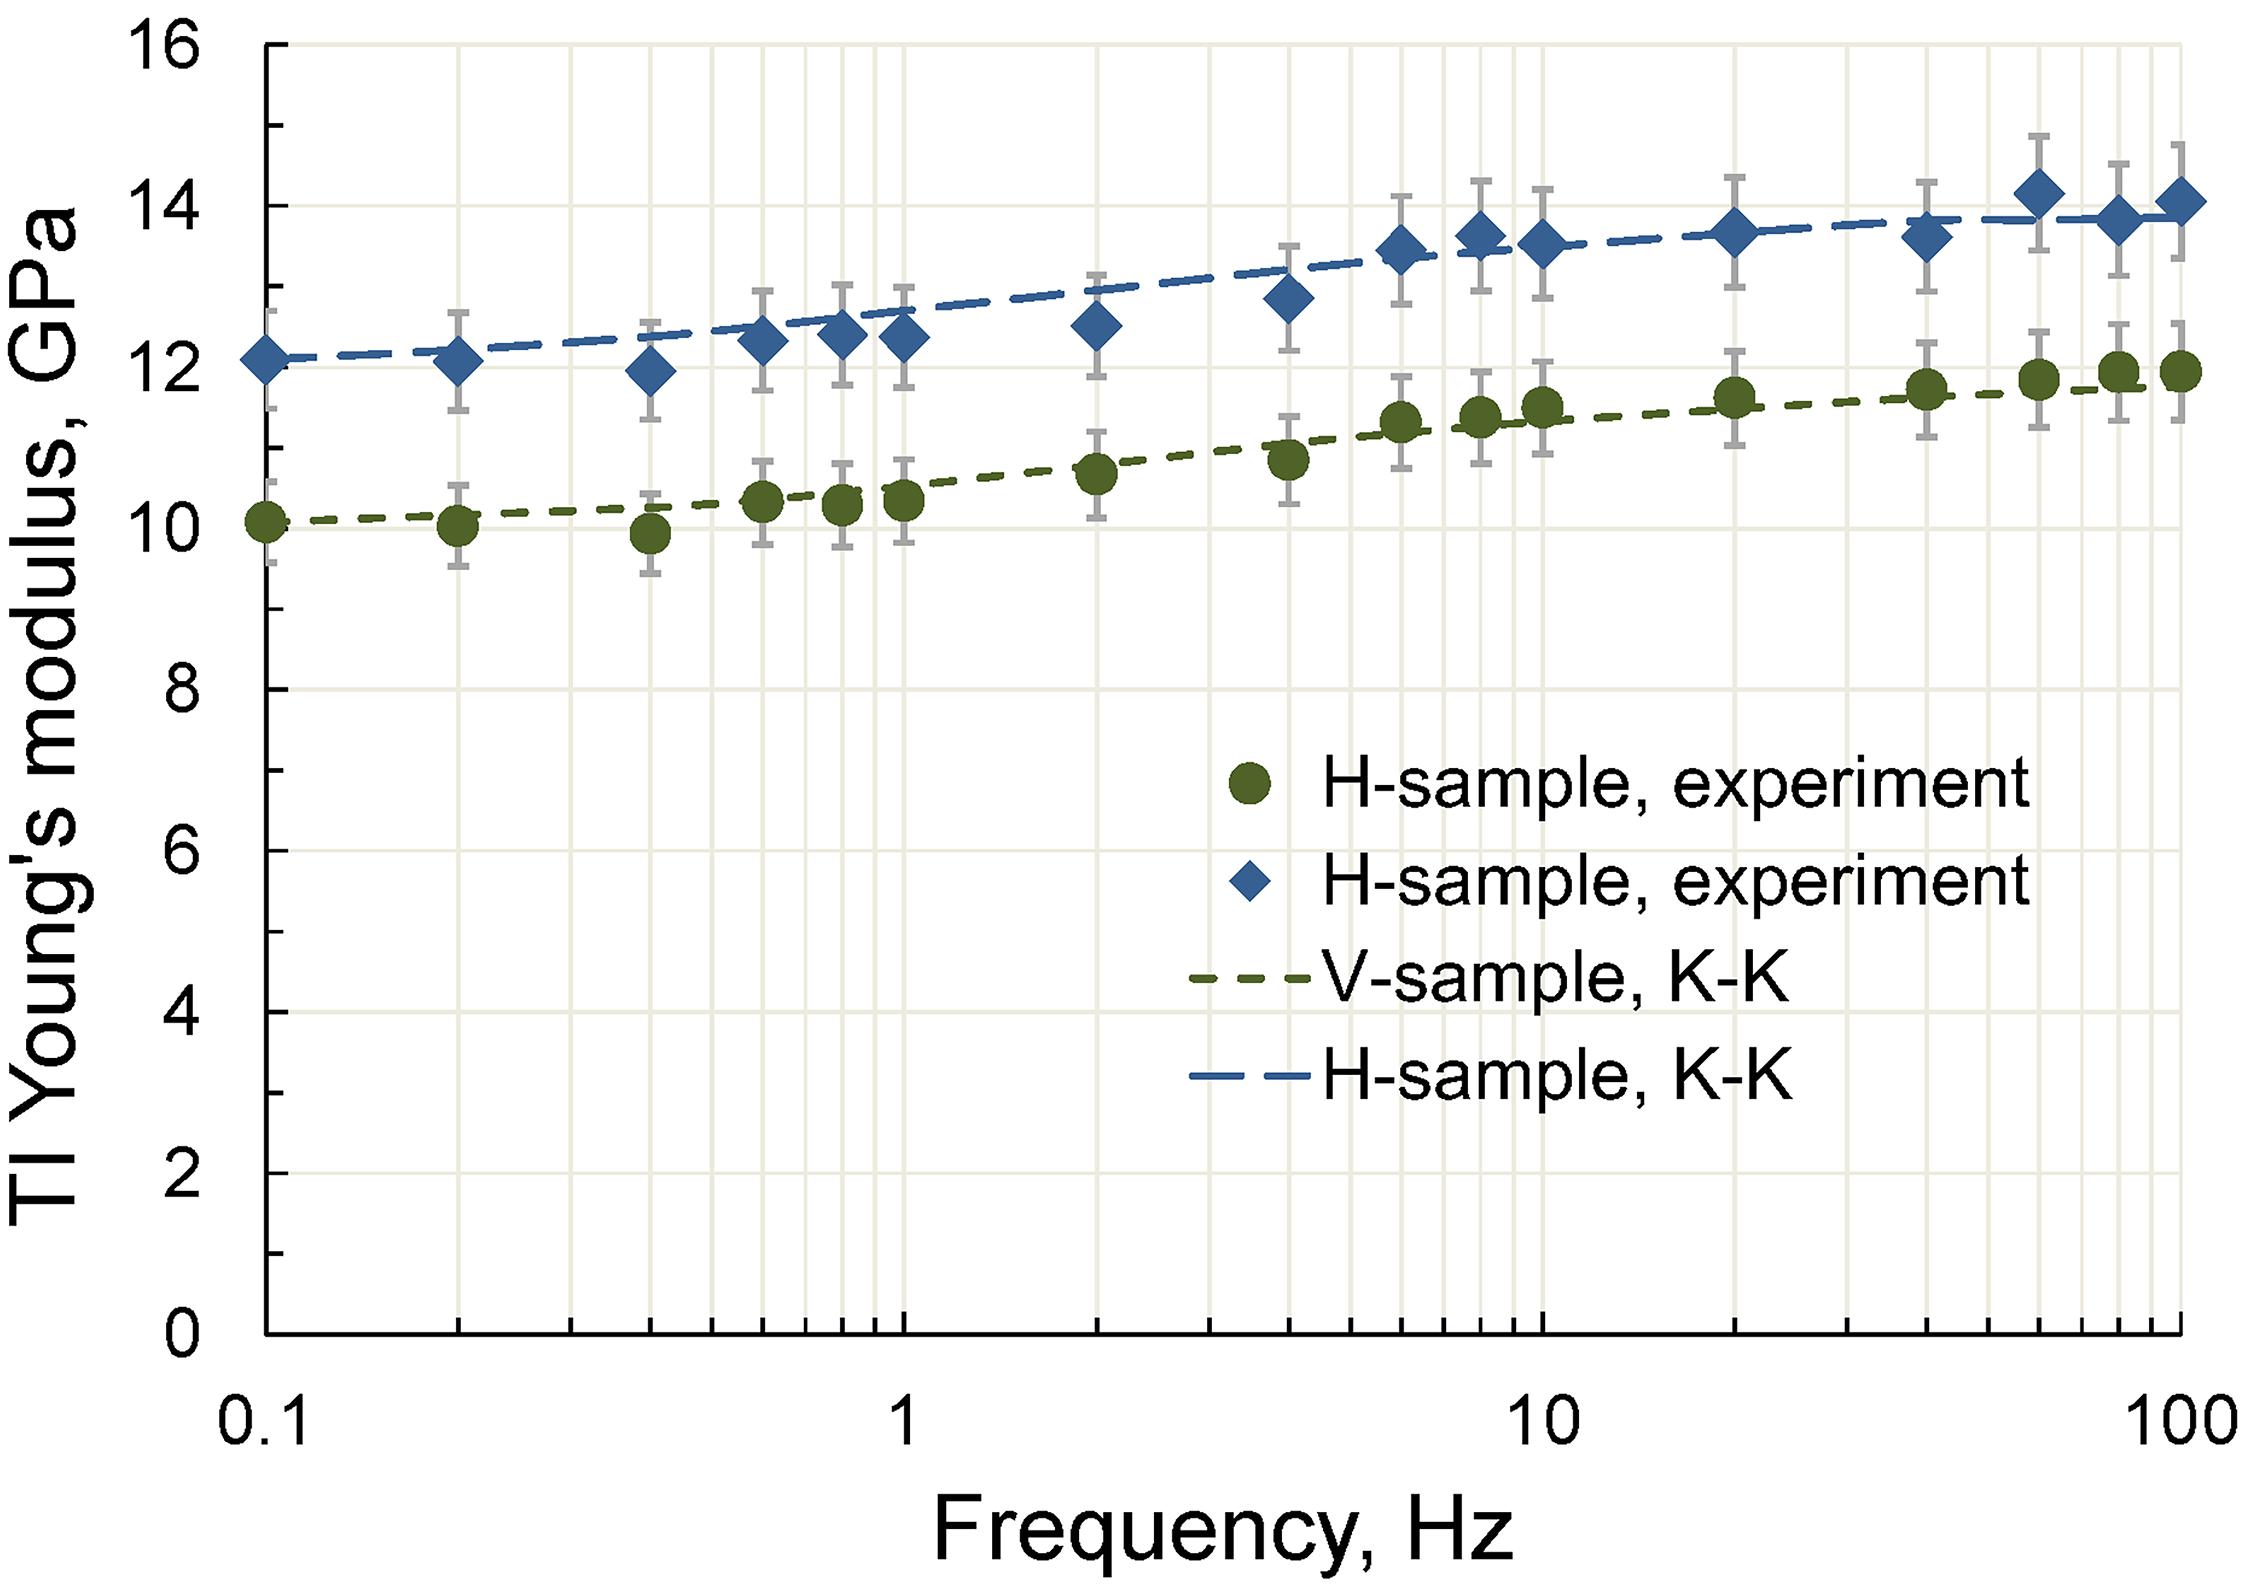
Figure 14. The frequency dependences of the TI Young’s moduli measured on the H- and V-samples at 97.5% RH and the Young’s moduli computed using the Kramers–Kronig relation.
Conclusion
In this paper, we give a detailed description of the technical characteristics and main features of operation of a LF apparatus based on a longitudinal type of forced oscillations, and also present the results of our study of some physical aspects associated with the application of the FO method to the measurements of elastic and anelastic properties of rocks. Specifically, we investigated the effect of the strain gauge position on a solid specimen under test on the measurements, we also studied the effect of creep on the elastic moduli of three different rock specimens, as well as the elastic modulus dispersion and attenuation in liquid-saturated sandstone associated with the presence of a dead fluid volume, i.e., the volume of fluid located outside the rock, but connected with its pore space.
The influence of the strain gauge position on the elastic moduli and attenuation measurements was studied using a cylindrical acrylic sample with a length of 15 cm and two pairs of strain gauges glued in the center of the sample and at a distance of 2 cm from the lower end of the sample under a uniaxial pressure of 15 MPa. The results of our tests show that elastic and anelastic parameters of the acrylic sample are independent from the location of the strain gauges on the sample. The effect of creep on the LF moduli was studied on three dry samples of Savonnieres limestone, Berea sandstone and Eagle Ford shale. The tests were carried out for 120 h at a frequency of 2 Hz under a uniaxial pressure of 10 MPa. It was shown that the moduli of all rocks decrease with time. The largest decrease was found in Eagle Ford shale, where the bulk and shear moduli decreased by 12 and 8%, correspondingly, and the lowest decrease was observed in Berea sandstone, where the reduction of the bulk and shear moduli were 5 and 2.5%.
We also present the results of the laboratory tests conducted at seismic frequencies on an n-decane saturated limestone sample with the dead volume gradually changed from 2 to 100 ml, as well as with the open pore-fluid line. It was shown that the Young’s and bulk moduli exhibit strong dispersion accompanied by attenuation at frequencies exceeding 10 Hz, if the dead volume is comparable to or exceeds the pore volume of the sample. Using a one-dimensional poroelastic model, we found that the characteristic frequency of dispersion is determined only by the parameters of the rock sample and saturating fluid.
Furthermore, we demonstrate of the applicability of the Kramers–Kronig relation for verification of the TI Young’s modulus and extensional attenuation measurements on shale. The TI Young’s moduli and attenuation were measured on two Wellington shale samples, vertical and horizontal, saturated with water at four values of relative humidity in the range from 12 to 97.5%. It was shown that the relationship between the extensional attenuation and the TI Young’s modulus dispersion observed in the shale samples saturated at a relative humidity of 97.5% is consistent with the Kramers–Kronig relation.
Data Availability Statement
The datasets presented in this study can be found in online repositories. The names of the repository/repositories and accession number(s) can be found below: http://doi.org/10.5281/zenodo.4442082.
Author Contributions
VM: experimental work, results analysis, and manuscript writing. ML: scientific advice, experimental suggestion, and manuscript review. RC: experimental work, calculations, and manuscript writing. EV: manuscript review and scientific advice. GV: manuscript review and experimental suggestion. All authors contributed to the article and approved the submitted version.
Conflict of Interest
The authors declare that the research was conducted in the absence of any commercial or financial relationships that could be construed as a potential conflict of interest.
References
Adam, L., Batzle, M., Lewallen, K. T., and van Wijk, K. (2009). Seismic wave attenuation in carbonates. J. Geophys. Res. 114:B06208. doi: 10.1029/2008JB005890
Adelinet, M., Fortin, J., Gueguen, Y., Schubnel, A., and Geoffroy, L. (2010). Frequency and fluid effects on elastic properties of basalt. experimental investigations. Geophys. Res. Lett. 37:L02303. doi: 10.1029/2009GL041660
Batzle, M. L., Han, D.-H., and Hofmann, R. (2006). Fluid mobility and frequency-dependent seismic velocity - direct measurements. Geophysics 71, N1–N9. doi: 10.1190/1.2159053
Borgomano, J. V. M., Gallagher, A., Sun, C., and Fortin, J. (2020). An apparatus to measure elastic dispersion and attenuation using hydrostatic- and axial-stress oscillations under undrained conditions. Rev. Sci. Instrum. 91:034502. doi: 10.1063/1.5136329
Brantut, N., Heap, M. J., Meredith, P. G., and Baud, P. (2013). Time-dependent cracking and brittle creep in crustal rocks: a review. J. Struct. Geol. 52, 17–43. doi: 10.1016/j.jsg.2013.03.007
Bruckshaw, J. M., and Mahanta, P. C. (1961). The variation of the elastic constants of rocks with frequency. Geophys. Prospect. 9, 65–76. doi: 10.1111/j.1365-2478.1961.tb01690.x
Chapman, S., Borgomano, J. V. M., Yin, H., Fortin, J., and Quintal, B. (2019). Forced oscillation measurements of seismic wave attenuation and stiffness moduli dispersion in glycerine-saturated Berea sandstone. Geophys. Prospect. 67, 956–968. doi: 10.1111/1365-2478.12710
Chandler, R. N., and Johnson, D. L. (1981). The equivalence of quasistatic flow in fluid saturated porous media and Biot’s slow wave in the limit of zero frequency. J. Appl. Phys. 52, 3391–3395. doi: 10.1063/1.329164
Cleary, M. P. (1978). Elastic and dynamic response regimes of fluid-impregnated solids with diverse microstructures. Int. J. Solids Struct. 14, 795–819. doi: 10.1016/0020-7683(78)90072-0
D’Anna, G., and Benoit, W. (1990). Apparatus for dynamic and static measurements of mechanical properties of solids and of fluxlattice in typeII superconductors at low frequency (10–5–10 Hz) and temperature (4.7–500 K). Rev. Sci. Instrum. 61, 3821–3826. doi: 10.1063/1.1141507
David, E. C., Fortin, J., Schubnel, A., Guéguen, Y., and Zimmerman, R. W. (2013). Laboratory measurements of low- and high-frequency elastic moduli in Fontainebleau sandstone. Geophysic 78, D369–D379. doi: 10.1190/geo2013-0070.1
Dunn, K.-J. (1986). Acoustic attenuation in fluid-saturated porous cylinders at low frequencies. J. Acoust. Soc. Am. 79, 1709–1721. doi: 10.1121/1.393232
Dutta, N. C., and Seriff, A. J. (1979). On White’s model of attenuation in rocks with partial gas saturation. Geophysics 44, 1806–1812. doi: 10.1190/1.1440940
Gordon, R. B., and Davis, L. A. (1968). Velocity and attenuation of seismic waves in imperfectly elastic rock. J. Geophys. Res. 73, 3917–3935.
Jackson, I., and Paterson, M. S. (1987). Shear modulus and internal friction of calcite rocks at seismic frequencies: pressure, frequency and grain size dependence. Phys. Earth Planet. Inter. 45, 349–367.
Lakes, R. S. (2004). Viscoelastic measurement techniques. Rev. Sci. Instrum. 75, 797–810. doi: 10.1063/1.1651639
Lexcellent, C. (2018). Linear and Non-Linear Mechanical Behavior of Solid Materials. Cham: Springer. doi: 10.1007/978-3-319-55609-3
Li, H., Lin, J., Gao, J., He, Y., Han, D., and Zhao, L. (2020). Precision analysis of forced-oscillation device: numerical modelling and experimental investigations. J. Geophys. Eng. 17, 980–992. doi: 10.1093/jge/gxaa057
Mavko, G. (1979). Frictional attenuation: an inherent amplitude dependence. J. Geophys. Res. Solid Earth 84, 4769–4776. doi: 10.1029/JB084iB09p04769
Mikhaltsevitch, V., Lebedev, M., and Gurevich, B. (2014). A laboratory study of low-frequency wave dispersion and attenuation in water-saturated sandstones. Lead. Edge 33, 616–622. doi: 10.1190/tle33060616.1
Mikhaltsevitch, V., Lebedev, M., and Gurevich, B. (2016a). “A laboratory study of the elastic anisotropy in the Mancos shale at seismic frequencies,” in Paper Presented at the SEG International Exposition and 87th Annual Meeting, (Dallas, TX), doi: 10.1190/segam2016-13850199.1
Mikhaltsevitch, V., Lebedev, M., and Gurevich, B. (2016b). Validation of the laboratory measurements at seismic frequencies using the Kramers-Kronig relationship. Geophys. Res. Lett. 43, 4986–4991. doi: 10.1002/2016GL069269
Mikhaltsevitch, V., Lebedev, M., and Gurevich, B. (2018). “The effect of water saturation on the elastic properties of the Wellington shale at seismic frequencies,” in Proceedings of the 80th EAGE Conference and Exhibition, Vol. 2018, (Copenhagen), 1–5. doi: 10.3997/2214-4609.201801546
Nakagawa, S. (2013). “Low-frequency (<100 Hz) dynamic fracture compliance measurement in the laboratory,” in Paper Presented at 47th U.S. Rock Mechanics/Geomechanics Symposium, (San Francisco, CL).
Ògúnsàmì, A., Jackson, I., Borgomano, J. V. M., Fortin, J., Sidi, H., Gerhardt, A., et al. (2020). Elastic properties of a reservoir sandstone: a broadband inter-laboratory benchmarking exercise. Geophys. Prospect. 69, 404–418. doi: 10.1111/1365-2478.13048
Paffenholz, J., and Burkhardt, H. (1989). Absorption and modulus measurements in the seismic frequency and strain range on partially saturated sedimentary rocks. J. Geophys. Res. 94, 9493–9507. doi: 10.1029/JB094iB07p09493
Peselnick, L., and Outerbridge, W. F. (1961). Internal friction in shear and shear modulus of Solenhofen limestone over a frequency range of 107 cycles per second. J. Geophys. Res. 66, 581–588. doi: 10.1029/JZ066i002p00581
Peselnick, L., and Zietz, I. (1959). Internal friction of fine-grained limestones at ultrasonic frequencies. Geophysics 24, 285–296. doi: 10.1190/1.1438583
Pimienta, L., Fortin, J., and Gueguen, Y. (2015). Experimental study of Young’s modulus dispersion and attenuation in fully saturated sandstones. Geophysics 80, L57–L72. doi: 10.1190/geo2014-0532.1
Pimienta, L., Borgomano, J. V. M., Fortin, J., and Gueguen, Y. (2016). Modelling the drained/undrained transition: effect of the measuring method and the boundary conditions. Geophys. Prospect. 64, 1098–1111.
Prak, D. J. L., Lee, B. G., Cowart, J. S., and Trulove, P. C. (2017). Density, viscosity, speed of sound, bulk modulus, surface tension, and flash point of binary mixtures of butylbenzene + linear alkanes (n-decane, n-dodecane, n-tetradecane, n-hexadecane, or n-heptadecane) at 0.1 MPa. J. Chem. Eng. Data 62, 169–187. doi: 10.1021/acs.jced.6b00542
Saltiel, S., Selvadurai, P. A., Bonner, B. P., Glaser, S. D., and Ajo-Franklin, J. B. (2017). Experimental development of low-frequency shear modulus and attenuation measurements in mated rock fractures: shear mechanics due to asperity contact area changes with normal stress. Geophysics 82, M19–M36. doi: 10.1190/geo2016-0199.1
Spencer, J. W. (1981). Stress relaxation at low frequencies in fluid-saturated rocks: attenuation and modulus dispersion. J. Geophys. Res. 86, 1803–1812. doi: 10.1029/JB086iB03p01803
Spencer, J. W., Cates, M. E., and Thompson, D. D. (1994). Frame moduli of unconsolidated sands and sandstones. Geophysics 59, 1352–1361. doi: 10.1190/1.1443694
Subramaniyan, S., Quintal, B., Tisato, N., Saenger, E. H., and Madonna, C. (2014). An overview of laboratory apparatuses to measure seismic attenuation in reservoir rocks. Geophys. Prospect. 62, 1211–1223. doi: 10.1111/1365-2478.12171
Sun, C., Tang, G. Y., Fortin, J., Borgomano, J. V. M., and Wang, S. (2020). Dispersion and attenuation of elastic wave velocities: impact of microstructure heterogeneity and local measurements. J. Geophys. Res. Solid Earth 125:e2020JB020132. doi: 10.1029/2020jb020132
Sun, C., Tang, G., Zhao, J., Zhao, L., Long, T., Li, M., et al. (2019). Three-dimensional numerical modelling of the drained/undrained transition for frequency-dependent elastic moduli and attenuation. Geophys. J. Int. 219, 27–38. doi: 10.1093/gji/ggz284
Sun, C., Tang, G., Zhao, J., Zhao, L., and Wang, S. (2018). An enhanced broad-frequency-band apparatus for dynamic measurement of elastic moduli and Poisson’s ratio of rock samples. Rev. Sci. Instrum. 89:064503. doi: 10.1063/1.5018152
Szewczyk, D., Bauer, A., and Holt, R. M. (2016). A new laboratory apparatus for the measurement of seismic dispersion under deviatoric stress conditions. Geophys. Prospect. 64, 789–798. doi: 10.1111/1365-2478.12425
Takei, Y., Fujisawa, K., and McCarthy, C. (2011). Experimental study of attenuation and dispersion over a broad frequency range: 1. the apparatus. J. Geophys. Res. 116:B09204. doi: 10.1029/2011JB008384
Usher, M. J. (1962). Elastic behaviour of rocks at low frequencies. Geophys. Prospect. 10, 119–127. doi: 10.1111/j.1365-2478.1962.tb02002.x
White, J. E. (1986). Biot-Gardner theory of extensional waves in porous rods. Geophysics 51, 742–745. doi: 10.1190/1.1442126
Keywords: forced-oscillation, apparatus, elastic, attenuation, rock physics
Citation: Mikhaltsevitch V, Lebedev M, Chavez R, Vargas EA Jr and Vasquez GF (2021) A Laboratory Forced-Oscillation Apparatus for Measurements of Elastic and Anelastic Properties of Rocks at Seismic Frequencies. Front. Earth Sci. 9:654205. doi: 10.3389/feart.2021.654205
Received: 15 January 2021; Accepted: 22 February 2021;
Published: 11 March 2021.
Edited by:
Erik H. Saenger, Bochum University of Applied Sciences, GermanyReviewed by:
Samuel Chapman, École Normale Supérieure, FranceJerome Fortin, UMR 8538 Laboratoire de Géologie de l’Ecole Normale Supérieure (LG-ENS), France
Copyright © 2021 Mikhaltsevitch, Lebedev, Chavez, Vargas and Vasquez. This is an open-access article distributed under the terms of the Creative Commons Attribution License (CC BY). The use, distribution or reproduction in other forums is permitted, provided the original author(s) and the copyright owner(s) are credited and that the original publication in this journal is cited, in accordance with accepted academic practice. No use, distribution or reproduction is permitted which does not comply with these terms.
*Correspondence: Vassily Mikhaltsevitch, Vi5NaWtoYWx0c2V2aXRjaEBjdWVyaW4uZWR1LmF1; Vi5NaWtoYWx0c2V2aXRjaEBjdXJ0aW4uZWR1LmF1