 Yuxing Zeng
 Chao Huang1
- 1Climate Center of Hunan Province, Changsha, China
- 2Key Laboratory of Hunan Province for Meteorological Disaster Prevention and Mitigation, Changsha, China
Floods in the middle reaches of the Yangtze River threaten thousands of million people, causing casualties and economic loss. Yet, the prediction of floods in this region is still challenging. To better understand the floods in this region, we investigate the interdecadal-interannual rainfall variation of the flood season (April–September) in Hunan province. The relationship between the rainfall and the Pacific decadal oscillation (PDO), Atlantic Multidecadal Oscillation (AMO), and El Niño-Southern Oscillation (ENSO) are also analyzed. The results show that the precipitation in the flood seasons shows an interdecadal oscillation with a period of about 20 years, which is caused by the joint effect of the PDO and AMO. When the PDO and AMO are in the same phase, the corresponding flood season is characterized by more precipitation, and conversely, it is less precipitation. Further analyses show that in the year after El Niño, when the PDO and AMO are both in the positive phase, it is favorable for the west Pacific subtropical high (WPSH) to be stronger and more southward than normal. Such circulation anomaly is conducive to the water vapor transport to the southern China, and as a result there is more precipitation in Hunan. When the PDO and AMO are both in the negative phase, the WPSH is weaker than normal, but the India-Burma trough is obviously stronger, which is also favorable for the southwesterly water vapor transport to the southern China. However, in the next year of the La Niña year, regardless of the phase combination of the PDO and AMO, the southern coast of China are controlled by a negative geopotential height anomaly and the WPSH retreats to the sea, which is not conducive to the northward transport of water vapor, and the precipitation in Hunan is less than normal. But if only the cold SST background in the previous stage is considered (without reaching the standard of a La Niña event),is more precipitation in most of the Hunan Province. Therefore, at the interannual scale, the PDO and AMO also have a modulating effect on the precipitation signal. However, the interannual-scale ENSO signal has a greater influence on the precipitation in Hunan flood seasons. Our results will give implications for the predications of floods in Hunan.
Introduction
Hunan Province is located in the central China, downstream of the Tibetan Plateau and south of the middle reaches of the Yangtze River. Hunan is surrounded by mountains on three sides, and belongs to the subtropical monsoon climate zone. The precipitation distribution is uneven and has large interannual variation. April to September is the flood season in Hunan Province, accounting for about 70% of the annual precipitation (Duan et al., 1999). The ENSO is the strongest interannual variability signal of the coupled tropical sea-air system, and is also the main modulator of the precipitation interannual variability in China during the flood season (e.g., Fu and Teng, 1988; Ye, 1990; Jin and Tao, 1999; Gao and Wang, 2007; Zong et al., 2010). Both the PDO and the AMO could significantly modulate the precipitation impact from the interannual variability of ENSO.
The PDO is a long-lived El Niño-like pattern of Pacific climate variability, and the characteristics and roles of the PDO are summarized by Mantua and Hare (2002). The PDO can affect the interdecadal variability of the summer precipitation in the eastern China by influencing the atmospheric circulations in East Asia.Moreover, the PDO can significantly influence the interdecadal north-south movement of the main summer rainfall belt in eastern China. When the PDO is in a positive phase, a wave train from the Sea of Japan to the East China Sea (Pacific-Japan teleconnection pattern, also called the P-J wave train) will be excited off the coast of East Asia, which will affect the precipitation in the southern China, making the summer precipitation less in northern China and more in the middle-lower reaches of the Yangtze River (Zhang et al., 2007). When the PDO is in a negative phase, the response of the circulation is generally opposite to that during the positive phase, making the East Asian subtropical westerly jet weaken, and thereby resulting in more summer precipitation in the Huanghuai area and less summer precipitation in the middle-lower reaches of the Yangtze River (Zhu et al., 2015). Besides, if the PDO is in a positive phase, East Asia is dominated by the anomalous western North Pacific anticyclone and the cyclonic circulation near Japan in El Niño decaying summers, and the average precipitation anomaly in China shows a tripolar distribution, i.e., more precipitation in the central region and less precipitation in the north and south. But, if the PDO is in a negative phase East Asia is mainly influenced by the anomalous western North Pacific anticyclone circulation in El Niño decaying summers, and the precipitation anomaly is in a dipolar distribution with significant intra-seasonal variability (Feng et al., 2015). Dong (2016) distinguished the similarities and differences between the PDO and ENSO effects on the East Asian summer monsoon. They also found that after excluding the effect of ENSO, the anomalous characteristics of the East Asian summer monsoon during different PDO phases are similar to those with the effect of the ENSO.
The AMO is the most significant interdecadal characteristic of the North Atlantic sea surface temperature (SST) (Sutton and Hodson, 2007), and its phase variations are closely related to the Atlantic meridional overturning circulation. The warming of most of Eurasia during the warm AMO phase enhances the sea-land thermal difference between Eurasia and the Pacific Ocean in summer, resulting in enhanced East Asian summer monsoon (Lu et al., 2006; Wang et al., 2009). Also, the warm AMO phase can excite the wave train of the Eurasian teleconnection pattern at middle and high latitudes and the teleconnection wave train propagating along the East Asian subtropical westerly jet at middle latitudes during the boreal summer, and the wave trains can lead to cyclonic anomalies over the Huanghuai area and anticyclonic anomalies over the Yangtze River, thereby causing more precipitation in the Huanghuai area and less precipitation in the middle-lower reaches of the Yangtze River (Si and Ding, 2016). The AMO can also affect the interdecadal variability of SST in the tropical western Pacific through atmospheric teleconnection, further influencing the interdecadal variability of the summer monsoon circulation in East Asia and summer precipitation in the eastern China (Sun et al., 2017). Zhang and Delworth (2010) also found that the changes in precipitation patterns in the east-central China in the early 1990s were closely associated with the AMO changes.
However, any single factor could not determine the precipitation variability, and the interannual and interdecadal variabilities of precipitation are the results of multiple factors (Li et al., 2018). The above previous studies have shown that the ENSO, PDO, and AMO all have relatively good correlations with summer precipitation in the eastern China. However, the interrelationships among them on interdecadal scales and the synergistic effects on the precipitation in the Hunan flood seasons need to be further investigated. The remainder of this article is organized as follows. Data and methods are given in section “Data and Methods.” Section “Results” presents the main results of this study. The cause analysis is performed in section “Circulation Analysis.” Finally, the conclusions and discussion are given in section “Conclusions and Discussion.”
Data and Methods
Data
The data used in this article includes the 1910–2019 monthly homogenized precipitation data in Hunan, the PDO, AMO, and SST data, the daily precipitation observation data and the reanalysis data.
Previous studies on the interdecadal variability of precipitation are mostly based on reanalysis data. However, Peng et al. (2017) got a 100-year long precipitation dataset of Hunan’s flooding season based on station data. This dataset fills in the missing values of some Hunan stations before 1950 by univariate linear regression. The dataset is already examined and corrected by a two-phase regression model, metadata of station location history, and the standard normal homogeneity test. The homogenized precipitation data in Hunan would better explain the regional characteristics of long-term precipitation changes, particularly given that the precipitation data before 1950 are incomplete due to war and other reasons in this region and the inhomogeneity problems of the precipitation data in China, it fill in the missing data of each station with a regression model based on the adjacent stations’ data.
The SST data is from the Extended Reconstructed SST version 4 from the National Oceanic and Atmospheric Administration, with a spatial resolution of 2.0° × 2.0°, and this dataset starts from January 1854 (Smith et al., 2008). Moreover, the daily precipitation observation data is from 97 meteorological stations in Hunan, and the time length from January 1, 1961 to August 31, 2020. The data is strictly processed for quality control. The geopotential height data is provided by the National Centers for Environmental Prediction/National Center for Atmospheric Research, with a spatial resolution of 2.5° × 2.5°(Kalnay, 1996). In addition, the data has 17 vertical levels from 1000 hPa to 10 hPa, and the main level used is 500 hPa. The start time of the reanalysis data is January 1948. Note that the climatic averages of each meteorological element used in the article are averaged between 1981 and 2010.
The PDO index quantifies the strength of SST oscillations and is defined as the time coefficient from the first mode of the empirical orthogonal function analysis for monthly average SST anomalies in the north of 20°N in the North Pacific (Hare and Mantua, 2000). The AMO is a quasi-periodic warm-cool anomaly of the SST in the North Atlantic region, with a basin-wide scale and a multidecadal scale (Kerr, 2000). The AMO index is defined as the regional average SST value in the North Atlantic of 0°N–60°N, 0°W–80°W.
Methods
In this article, the Nino 3.4 zone (170°W–120°W, 5°S–5°N) is used as the monitoring zone for the El Niño (La Niña) events. The 3-month moving average of the NINO3.4 index is calculated (one decimal is retained, same below), if the value is greater than or equal to 0.5°C (less than or equal to −0.5°C) and maintains for at least 5 months, then an El Niño (La Niña) event is determined.
To obtain the interdecadal scale components of meteorological elements, we use the Lanczos filter method to perform an 11-year low-pass filter (Duchon, 1979). In the low-pass filter the low-frequency signals can pass, while high-frequency signals above a defined threshold are blocked or attenuated. However, the amplitude of blocking and attenuation varies according to the signals’ frequency and the filter purpose.
Wavelet analysis can analyze the one-dimensional signal in terms of both time and frequency, and can finely characterize the local features of the climate system and the oscillations near arbitrary points. It also can distinguish local singularities. Moreover, it can analyze the perturbation characteristics at different scales according to the periodic evolution with different scales over time, and determine the significant cycles of the climate series (Hudgins and Huang, 1996).
Results
Temporal Variations of the Precipitation, PDO, and AMO in Hunan Flood Seasons
From 1910 to 2019, there is no significant change of precipitation during Hunan flood seasons (April–September, same below), with overall more precipitation in the 1910s, 1930s, 1950s, 1970s, 1990s and 2010s and overall less precipitation in the 1920s, 1940s, 1960s, 1980s and 2000s (Figure 1A). The variations are almost the same as the precipitation trends in southern China (e.g., Ding et al., 2008; Huang et al., 2011; Zhu et al., 2011; Xu et al., 2015). The wavelet transform shows that the precipitation in Hunan flood seasons has an interdecadal fluctuation on an about 20-year scale, with a short period of 2–3 years in the 1930s, 1950s, 1970s and 21st century (Figure 2). The correlation coefficient of the precipitation in Hunan flood seasons with the PDO index is quite small, and the correlation coefficient with the AMO is only 0.12 without passing the significance test at 90% confidence level.
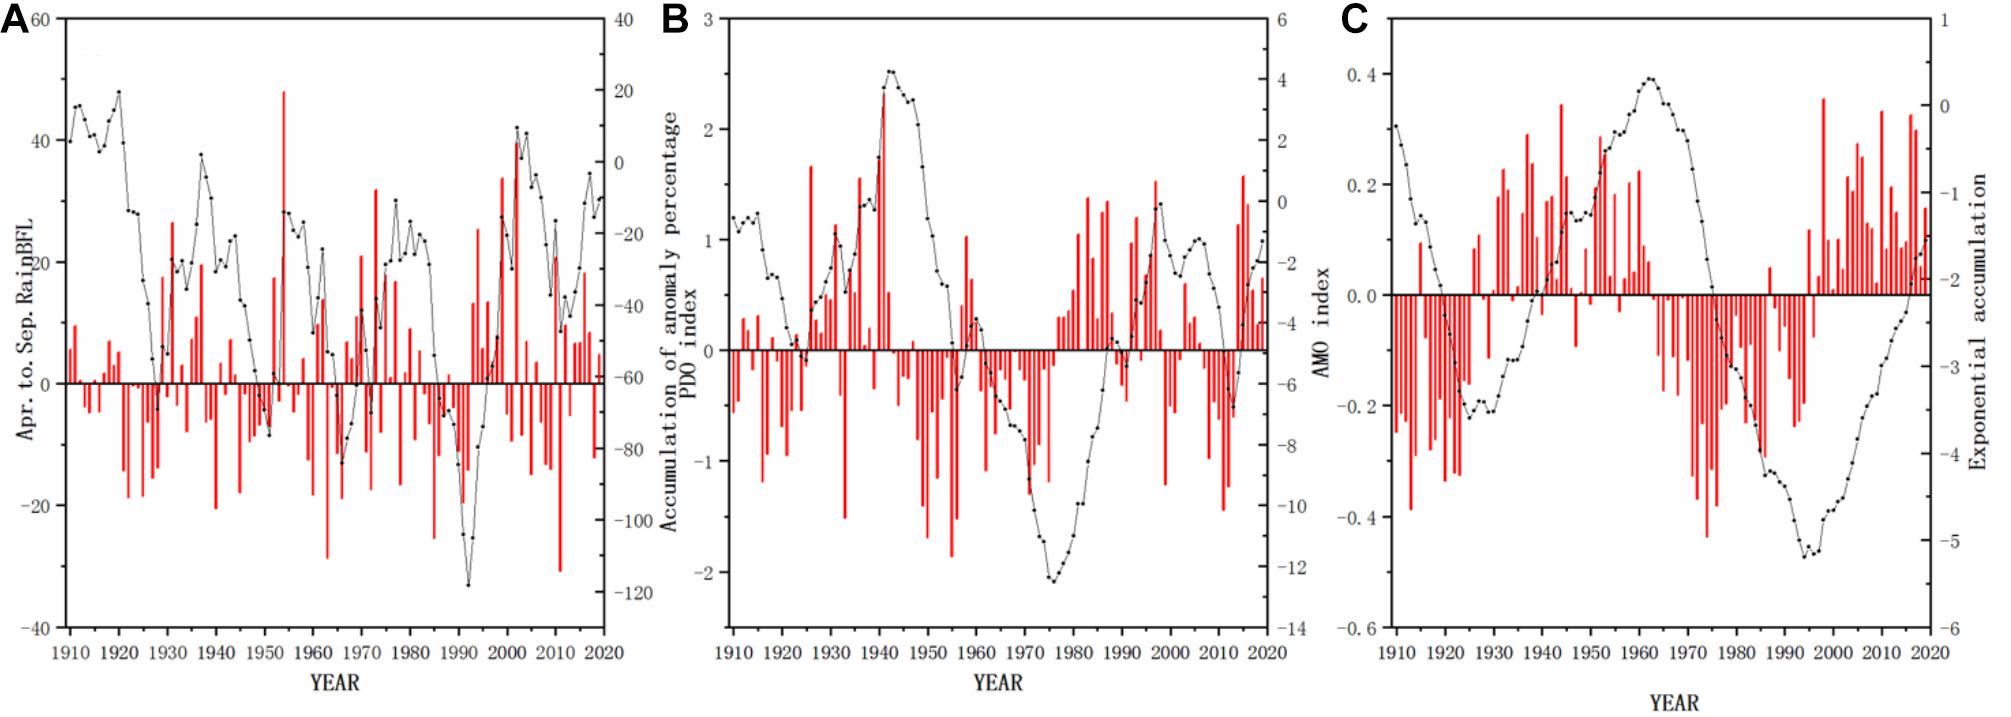
Figure 1. Time series of (A) the precipitation anomaly percentage, (B) PDO index, and (C) AMO index in Hunan flood seasons during 1910–2019 (the red line is the exponential sequence and the black line is the anomaly accumulation value).
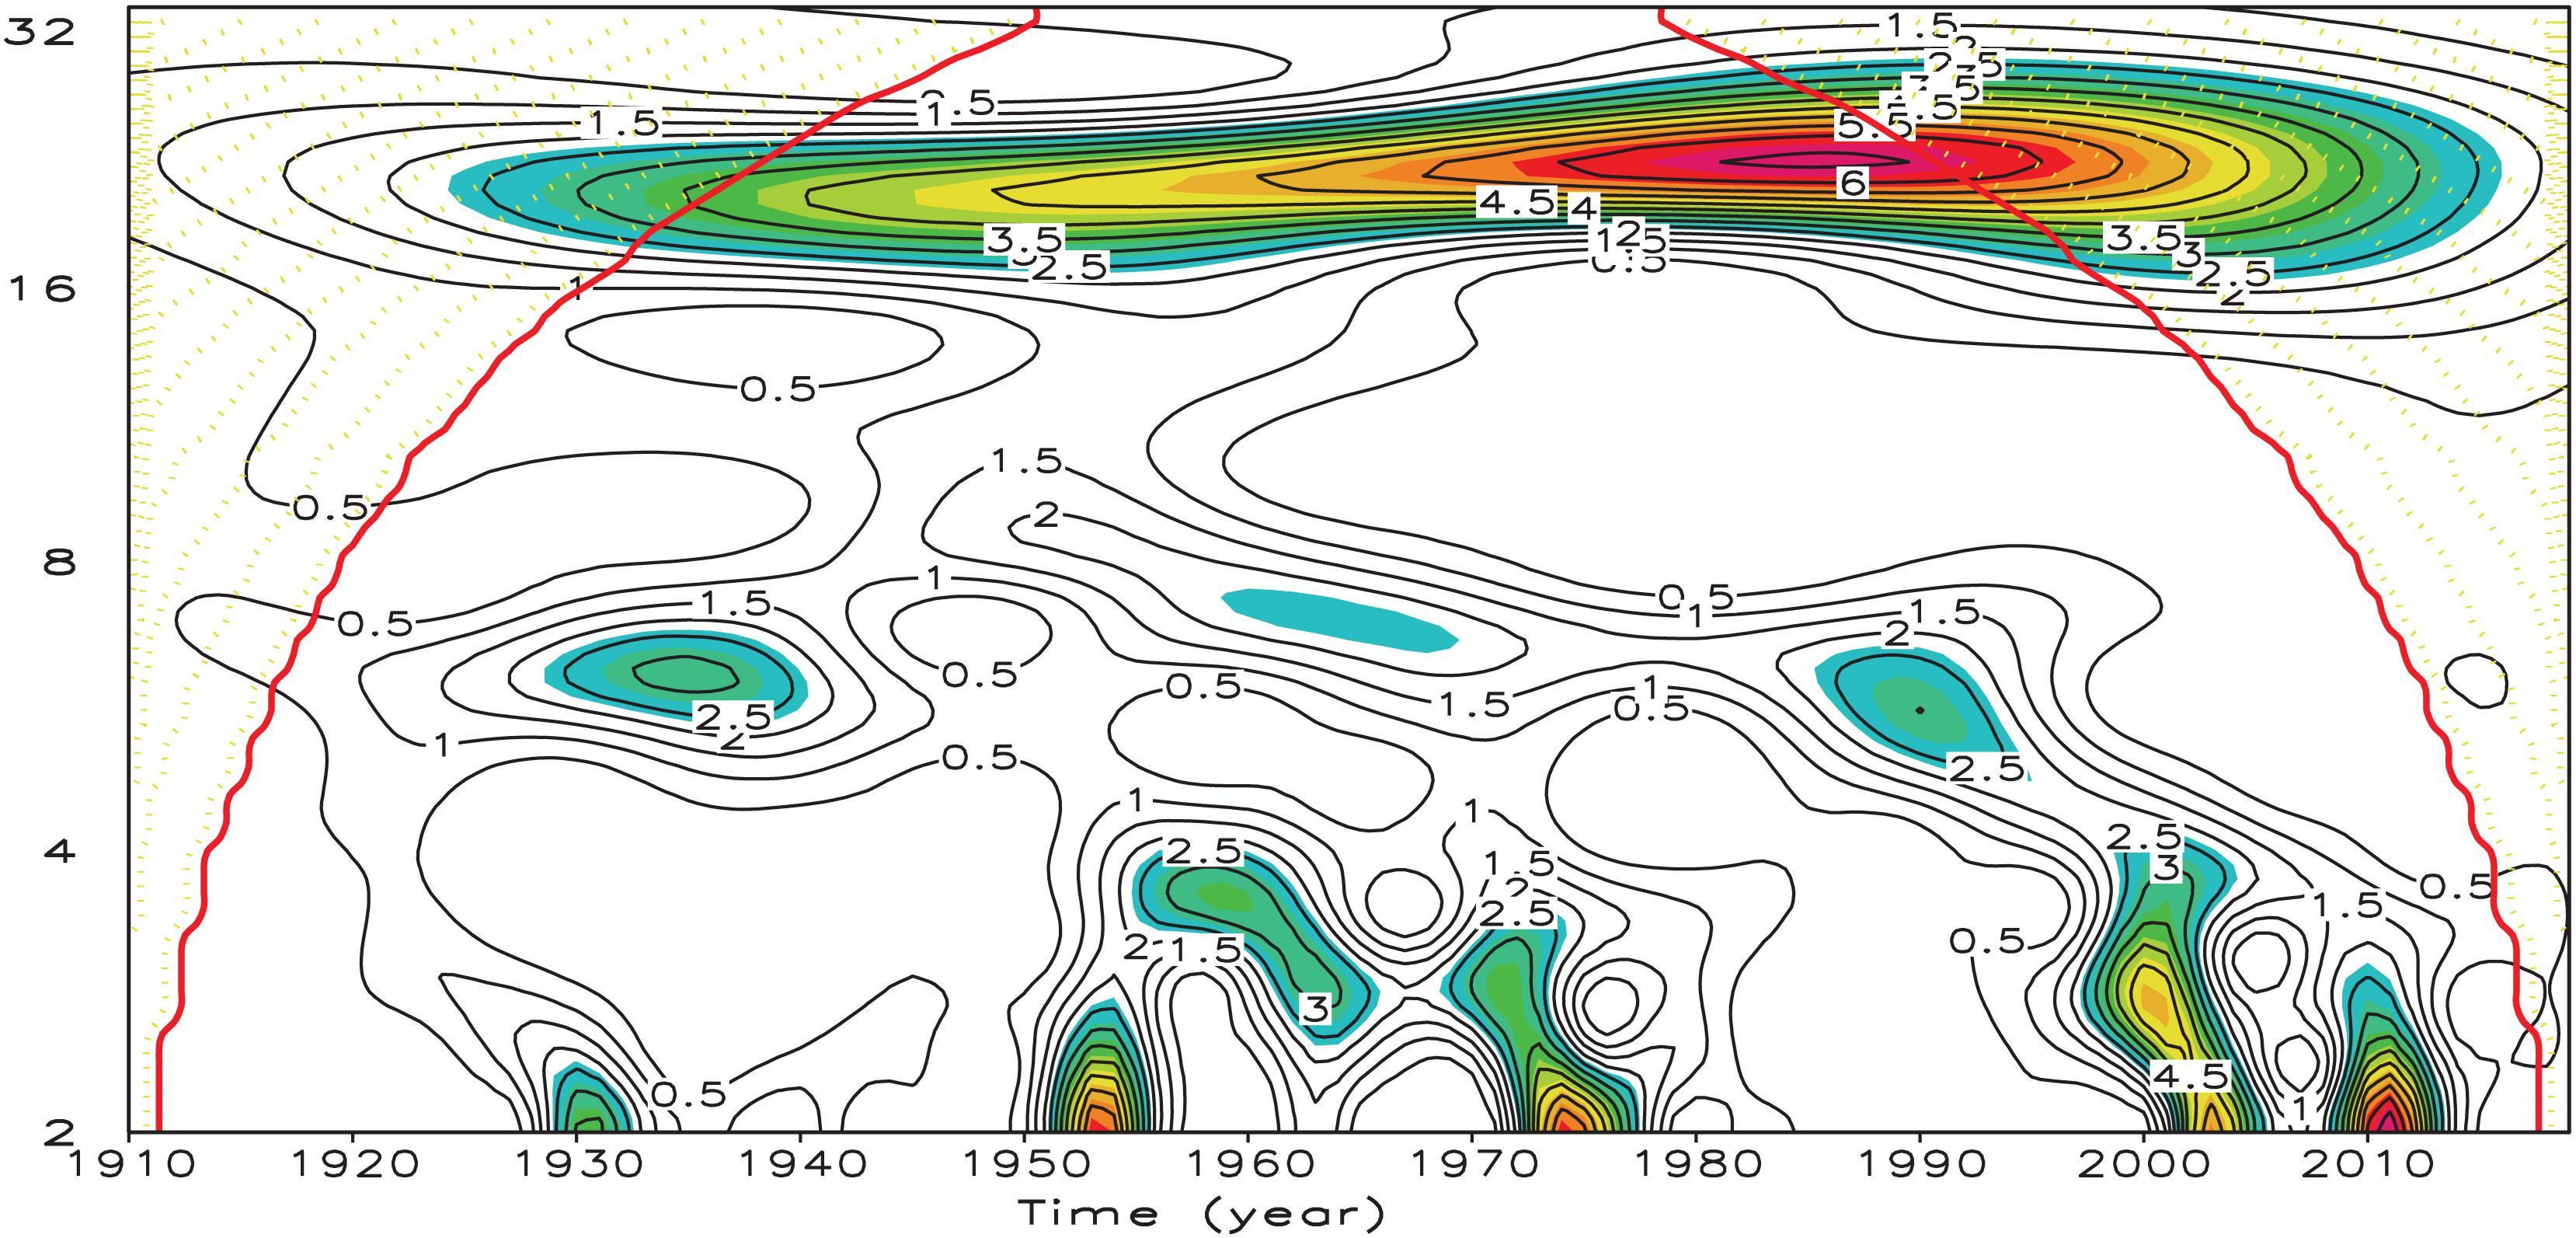
Figure 2. Wavelet analyses for the precipitation anomaly percentage in Hunan flood seasons during 1910–2019. The shaded areas pass the significance test at 95% confidence level.
For the variations of the PDO and AMO, the PDO (Figure 1B) is mainly in a negative phase before the 1920s and then turns into a positive phase after the 1920s. In the 1940s, the PDO turns back to the negative phase and maintains until the mid-1970s, and after that the PDO is mainly in a positive phase except around 2010. The AMO (Figure 1C) is mostly in a negative phase until the mid-1920s, and then changes into a positive phase until the early 1960s. Then, the AMO is in a negative phase from the 1960s to the late 20th century. In the 21st century the AMO changes into a positive phase.
Relationships Between the Precipitation Interdecadal Variations in Hunan Flood Seasons and the PDO and AMO
Temporal Variations of Precipitation, the Pacific Decadal Oscillation and the Atlantic Multidecadal Oscillation
Figure 3 shows the time series of the PDO, AMO and the precipitation after low-pass filtering, as well as the precipitation anomaly percentage during Hunan flood seasons. As can be seen, the PDO and AMO are in the same phase in 53 years, of which there are more precipitation in 32 years, accounting for 60.4% (32/53, Table 1). While the PDO and AMO are in the opposite phase in 57 years, of which there are less precipitation in 38 years, accounting for 66.7% (38/57, Table 1), i.e., Hunan flood seasons are dominated by less precipitation. This situation is especially obvious from the 1960s, i.e., when the PDO and AMO are in the same phase 81.8% (18/22) of the years are with more precipitation, and when the PDO and AMO are in the opposite phase 64.9% (24/37) of the years are with less precipitation. Therefore, the following analysis of precipitation anomalies began in 1961.
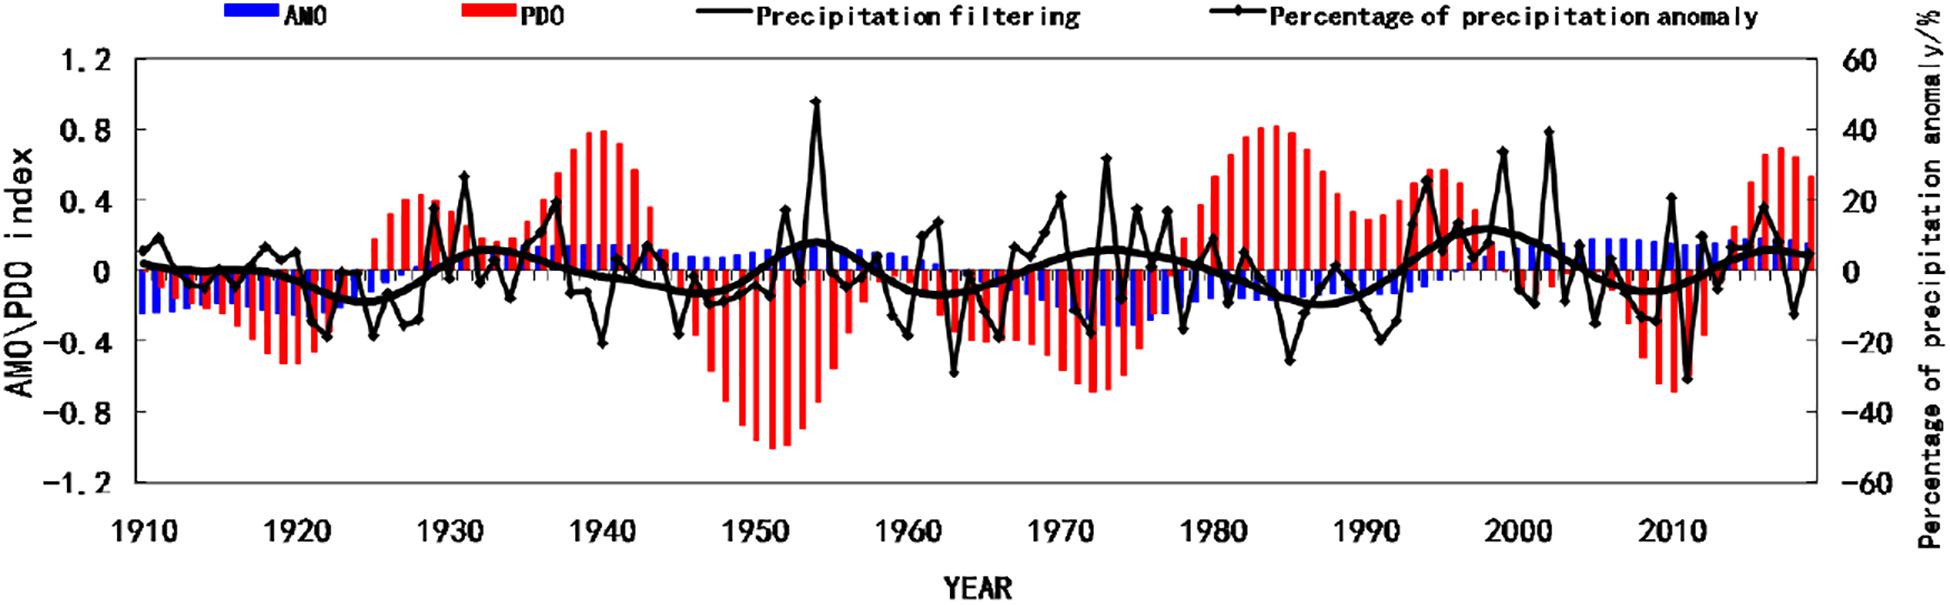
Figure 3. Temporal variations of the AMO index, the PDO index, the precipitation and the precipitation anomaly percentage in Hunan flood seasons during 1910–2019.
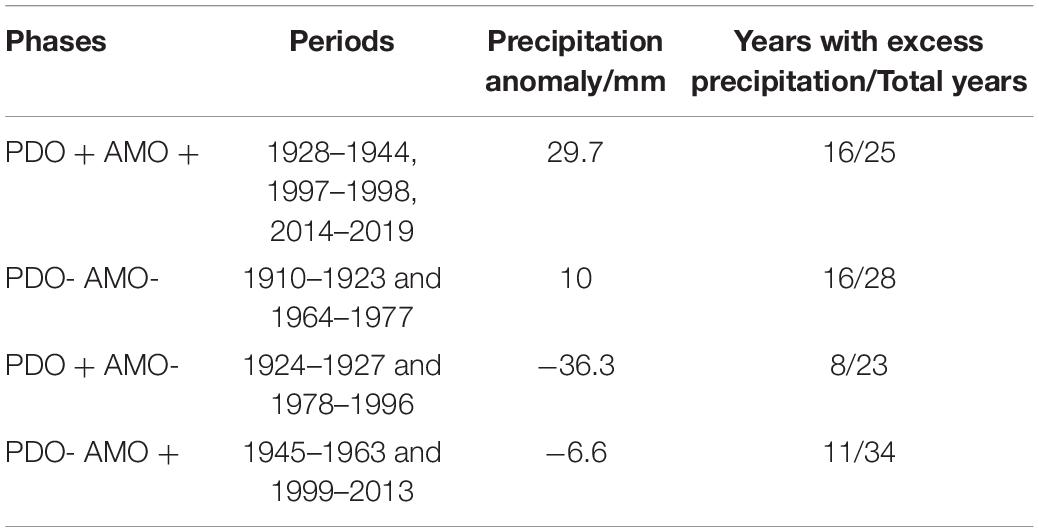
Table 1. The periods of different PDO and AMO phases, the corresponding average precipitation in the flood season, and the years with excess precipitation during 1910–2019.
Spatial Variations of the Precipitation in Hunan Flood Seasons
As can be seen in Figure 4 (The frequency of positive precipitation anomaly is the proportion of the years with positive precipitation anomaly. In the following, the analysis of precipitation is based on its positive anomaly frequency), when the PDO and AMO are in the same phase, the precipitation in Hunan flood seasons is more than normal in most of the regions. Moreover, the excess precipitation is more significant in the years with the same positive phase than in the years with the same negative phase except in southeast Hunan. In the years with both negative phase, the precipitation in east Hunan is locally less than normal. In the years with a positive PDO phase and a negative AMO phase, the precipitation during flood seasons is less than normal in most of the regions, except the northwest Hunan. In the years with a negative PDO phase and a positive AMO phase the precipitation is only slightly more than normal in the southeast Hunan. If the results processed by the low-pass filtering are similar, i.e., the precipitation is mainly more than normal in the years with the same PDO and AMO phase and less than normal in the years with the opposite phase, but the excess precipitation is more extensive and more frequent (figure omitted).
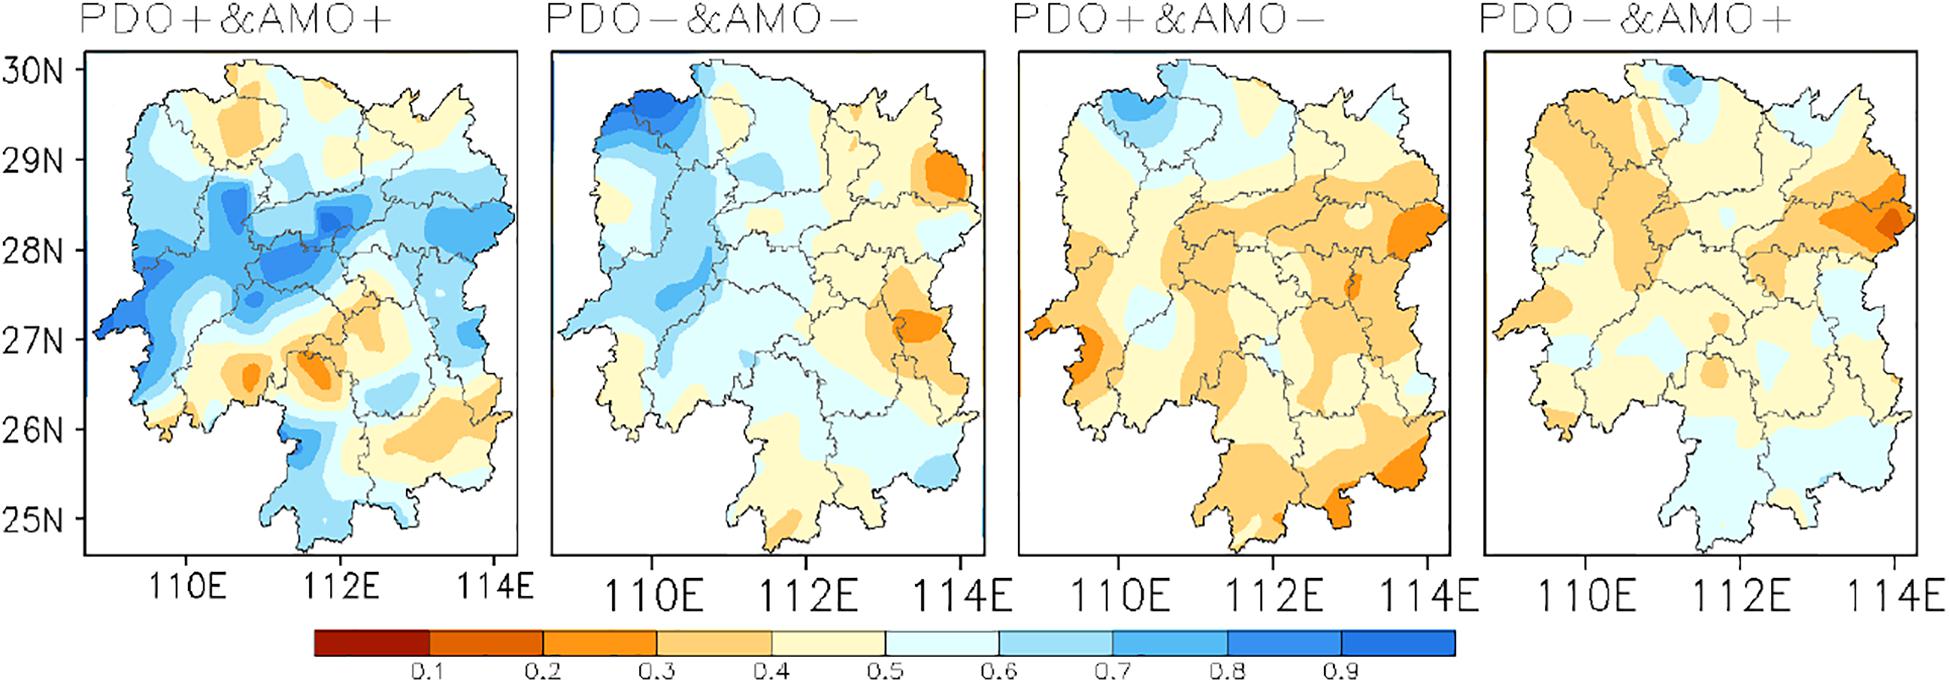
Figure 4. Composition graph of the frequency of positive precipitation anomaly during Hunan flood seasons corresponding to different PDO and AMO phases from 1961 to 2019.
Impacts of ENSO Events on Interannual Precipitation Fluctuations
Impacts of El Niño Events
In the next years of the El Niño events after 1961, when the PDO and AMO are in the same phase, the precipitation in Hunan flood season is mainly more than normal, accounting for 80% (8/10, Table 2). When the PDO and AMO are in the opposite phase, the years with the precipitation less than normal account for 46.2% of the total (6/13, Table 2).
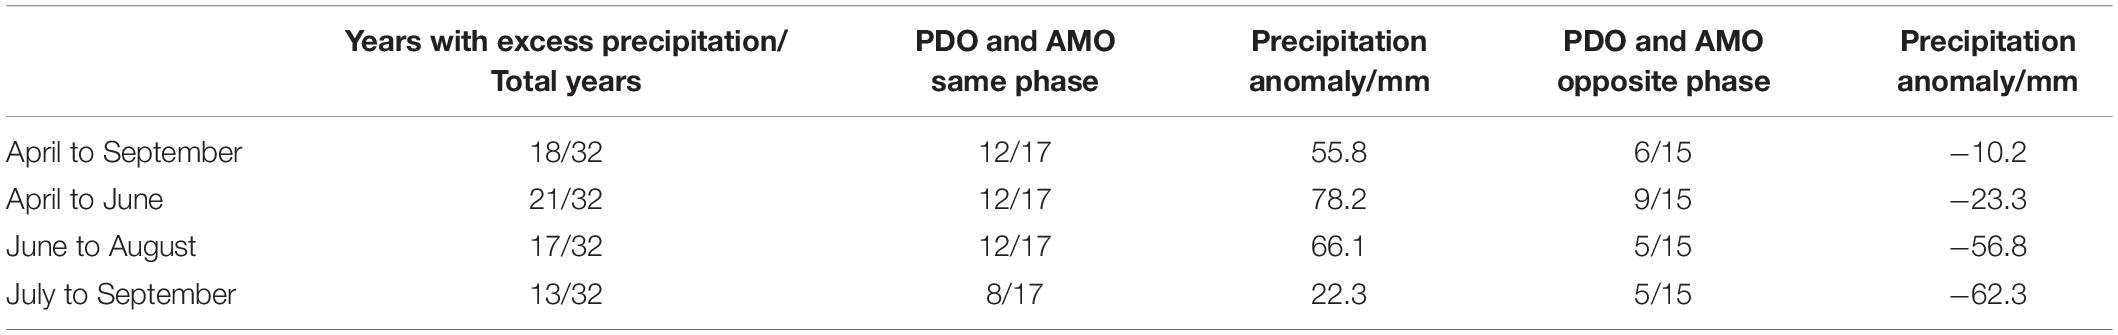
Table 2. Statistics of the precipitation in Hunan flood seasons in the next years of the El Niño events during 1910–2019.
The precipitation series in the next years of El Niño events the results are shown in Figure 5. It can be found that when the PDO and AMO are in the same phase, the precipitation is more than normal in most of the regions in Hunan, except for local areas of southeast Hunan. Moreover, when the PDO and AMO are both in a positive phase, the positive precipitation anomaly is larger and distribute more wide. However, less precipitation occurs in most of Hunan in the years with the positive PDO phase and negative AMO phase, except for the northern Hunan. Under the negative PDO phase and positive AMO phase, the results are slightly different, with less precipitation in most areas except for the northwest and southeast Hunan. Compared with the results in Figure 4, it can be found that the frequency of positive or negative anomaly of precipitation is higher under the impacts of ENSO than without the impacts of ENSO. If the time series of precipitation is also processed by the low-pass filtering, the results are similar to Figure 5. When the AMO and PDO are in the positive phase, the precipitation is more than normal. However, the range of less precipitation is significantly enlarged when both PDO and AMO are in the negative phase (figure omitted).
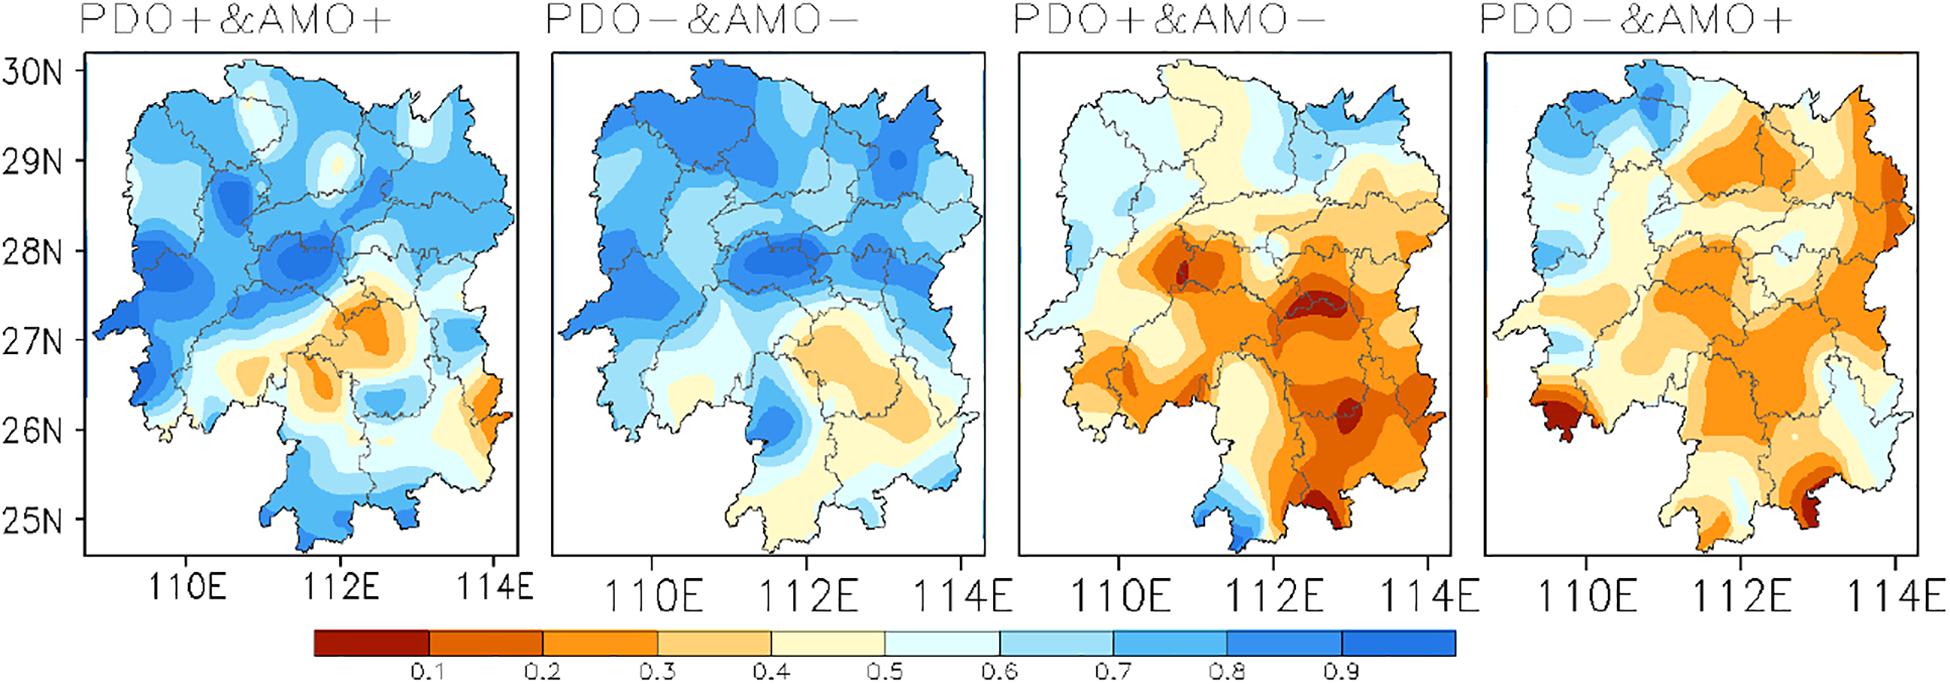
Figure 5. The same as Figure 4, but for the next years of El Niño events.
Impacts of La Niña Events
In the next years of La Niña events, when the PDO and AMO are in the same phase, the precipitation in Hunan flood seasons is less than normal at a percentage of 66.7% (4/6). When the PDO and AMO are in the opposite phase, the Hunan flood season is also dominated by less precipitation, and the years with less precipitation accounts for 75% (9/12, Table 3). In a word, the overall precipitation in Hunan flood seasons is mainly less than normal in the next years of La Niña events, and the years with less precipitation account for 72.2% (13/18, Table 3) of the total.
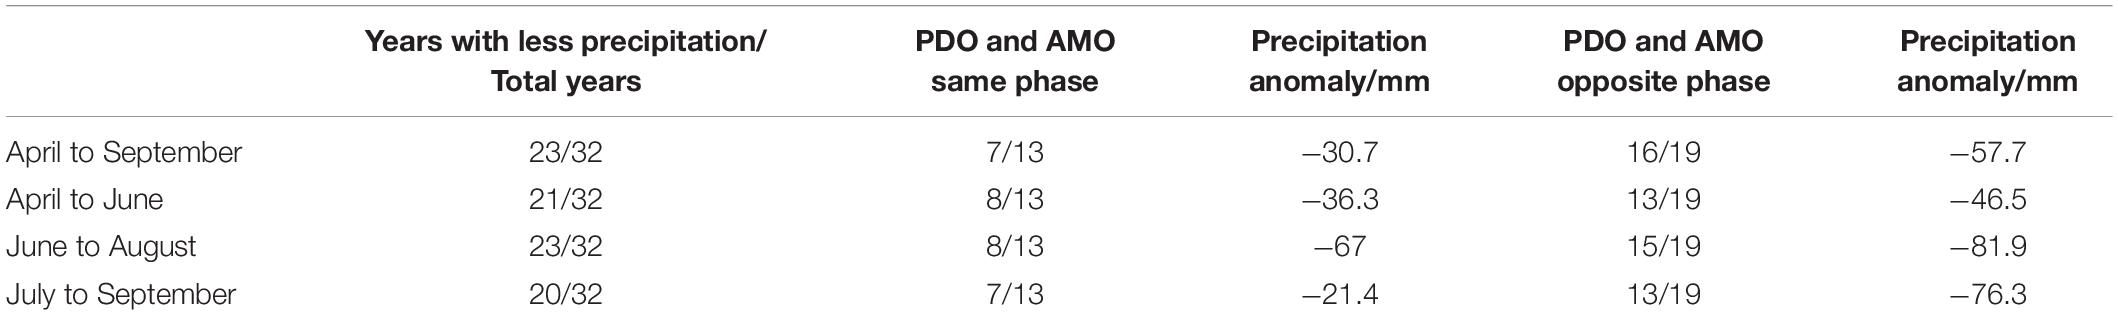
Table 3. Statistics of the precipitation in Hunan flood seasons in the next years of the La Niña events during 1910–2019.
The precipitation series in the next years of La Niña events is processed by the low-pass filtering, and the results are shown in Figure 6. The previous studies have shown that in the next years of La Niña events, the precipitation is mainly less than normal during the flood seasons in the middle and lower Yangtze River. However, for the precipitation in Hunan flood seasons (Figure 6), when the PDO and AMO are in the same phase, the precipitation in Hunan in the flood season is more than normal. Note that only in 2018 the PDO and AMO are both in the positive phase. In the years when the PDO and AMO are both in the negative phase, the precipitation in southeastern Hunan is mainly more than normal. Under the positive PDO phase and the negative AMO phase the precipitation in flood season is consistently less than normal in the whole province, and the degree of less precipitation is also more significant than that in the next years of El Niño events. In addition, the precipitation distribution in Hunan flood season is more in the north and less in the south under the negative PDO phase and the positive AMO phase. Note that without the low-pass filtering for the precipitation series, the precipitation is mainly less than normal regardless of the combination of PDO and AMO phases (Figure 7).
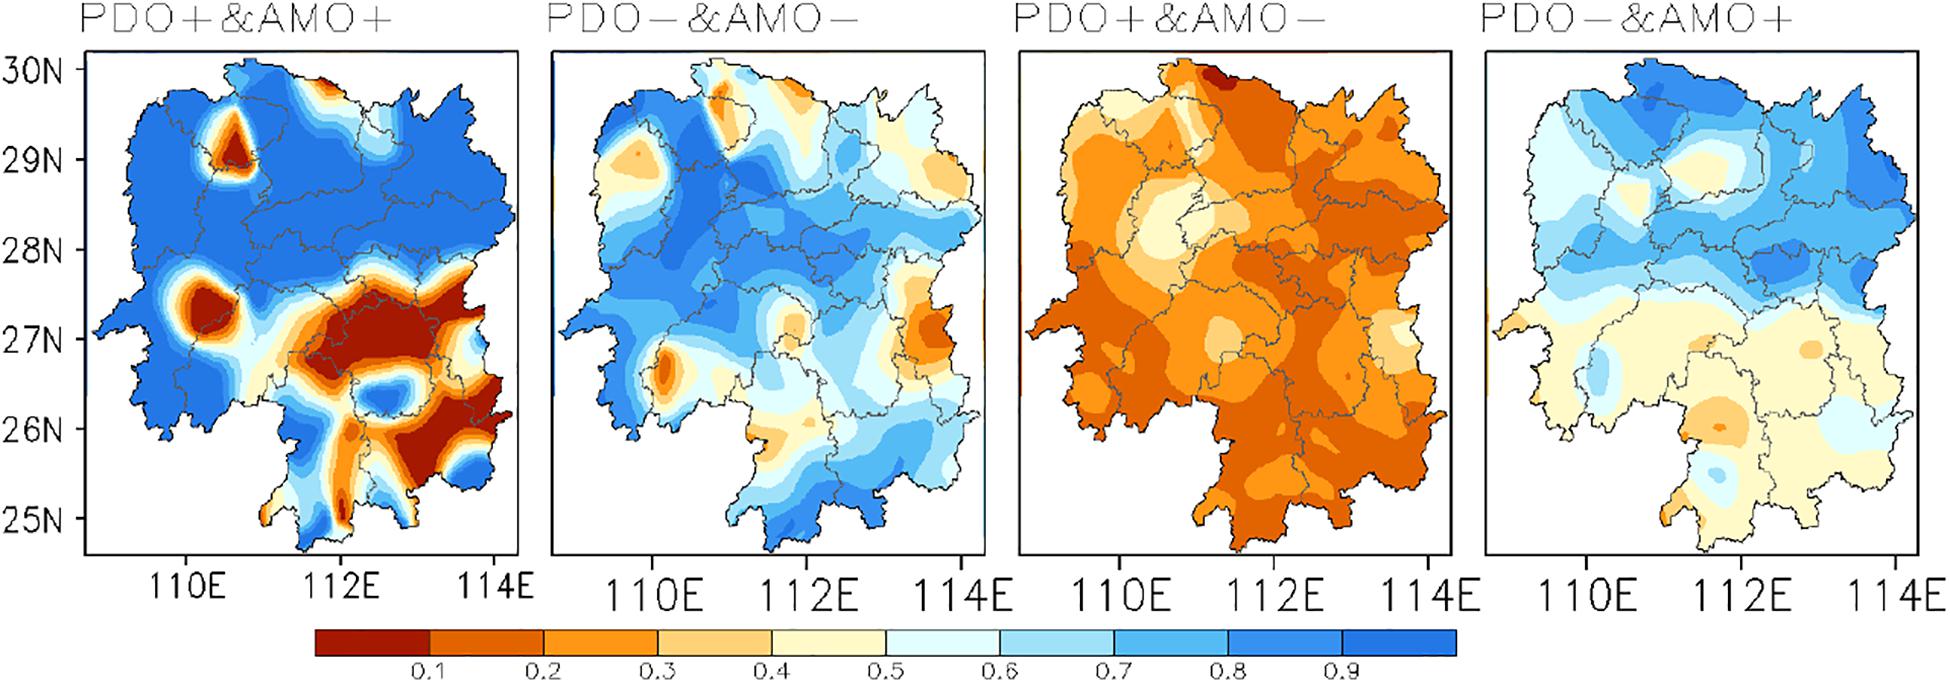
Figure 6. The same as Figure 4, but for the next years of La Niña events and the precipitation series is processed by the low-pass filtering.
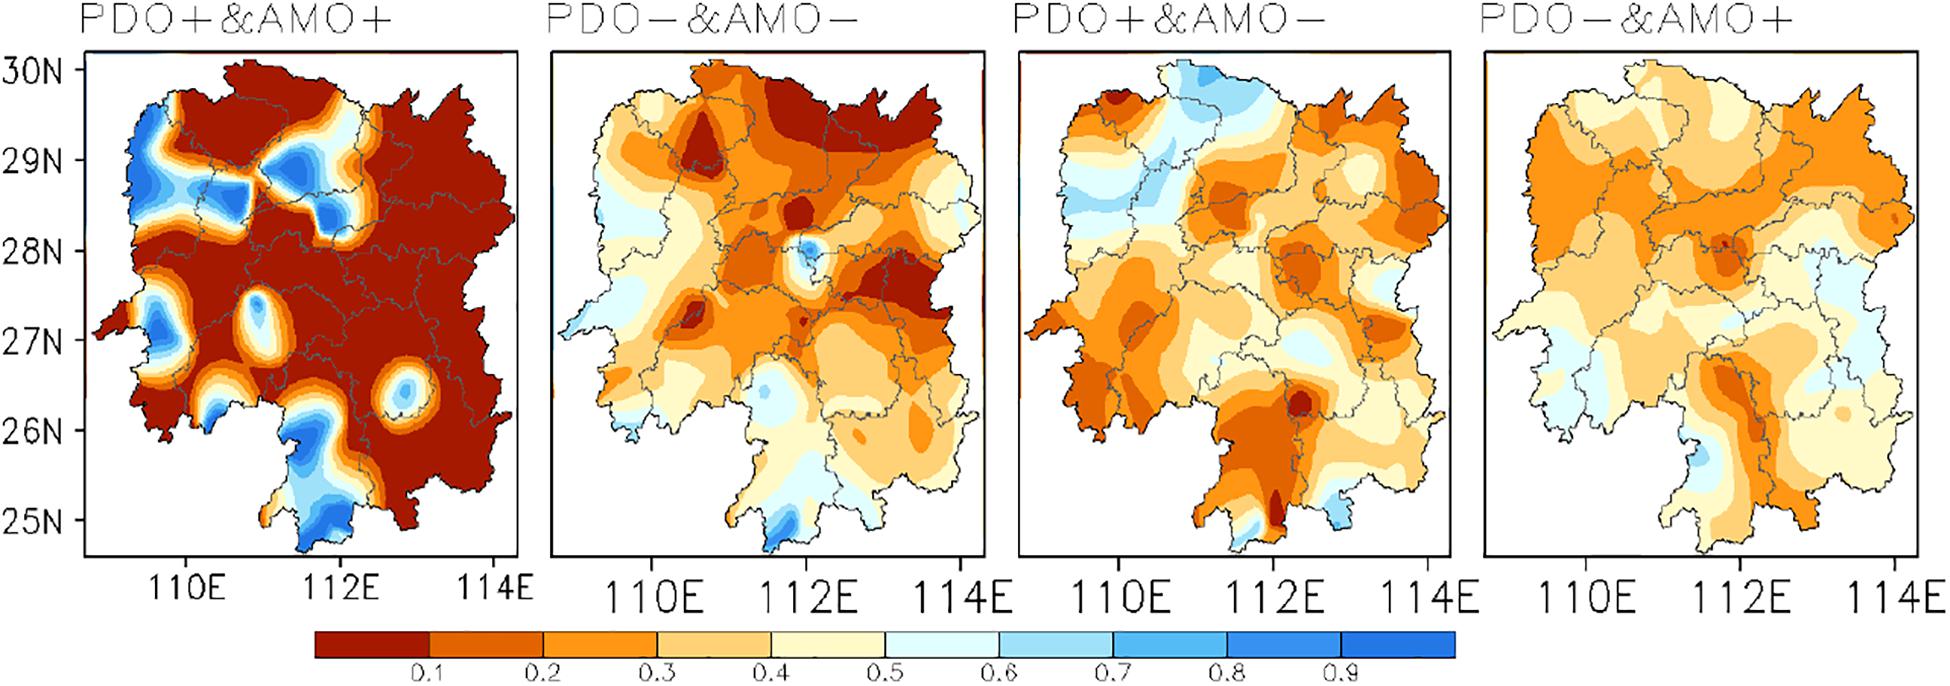
Figure 7. The same as Figure 4, but for the next years of La Niña events.
If only the cold SST background in the previous stage is considered (without reaching the standard of a La Niña event) and the precipitation series is not processed by the low pass filtering, the results are shown in Figure 8. When the PDO and AMO are in the same phase, the precipitation in flood seasons is mainly more in south-central Hunan and less in the northern Hunan. However, the precipitation is less than normal in most areas when the PDO and AMO are in the opposite phase. Therefore, on the interdecadal scale the precipitation in Hunan flood seasons is mainly affected by the joint effect of the PDO and AMO. Besides, the PDO and AMO also have a modulating effect on the precipitation on the interannual scale. However, the ENSO signal has more influence on the anomalous precipitation in Hunan flood seasons on the interannual scale.
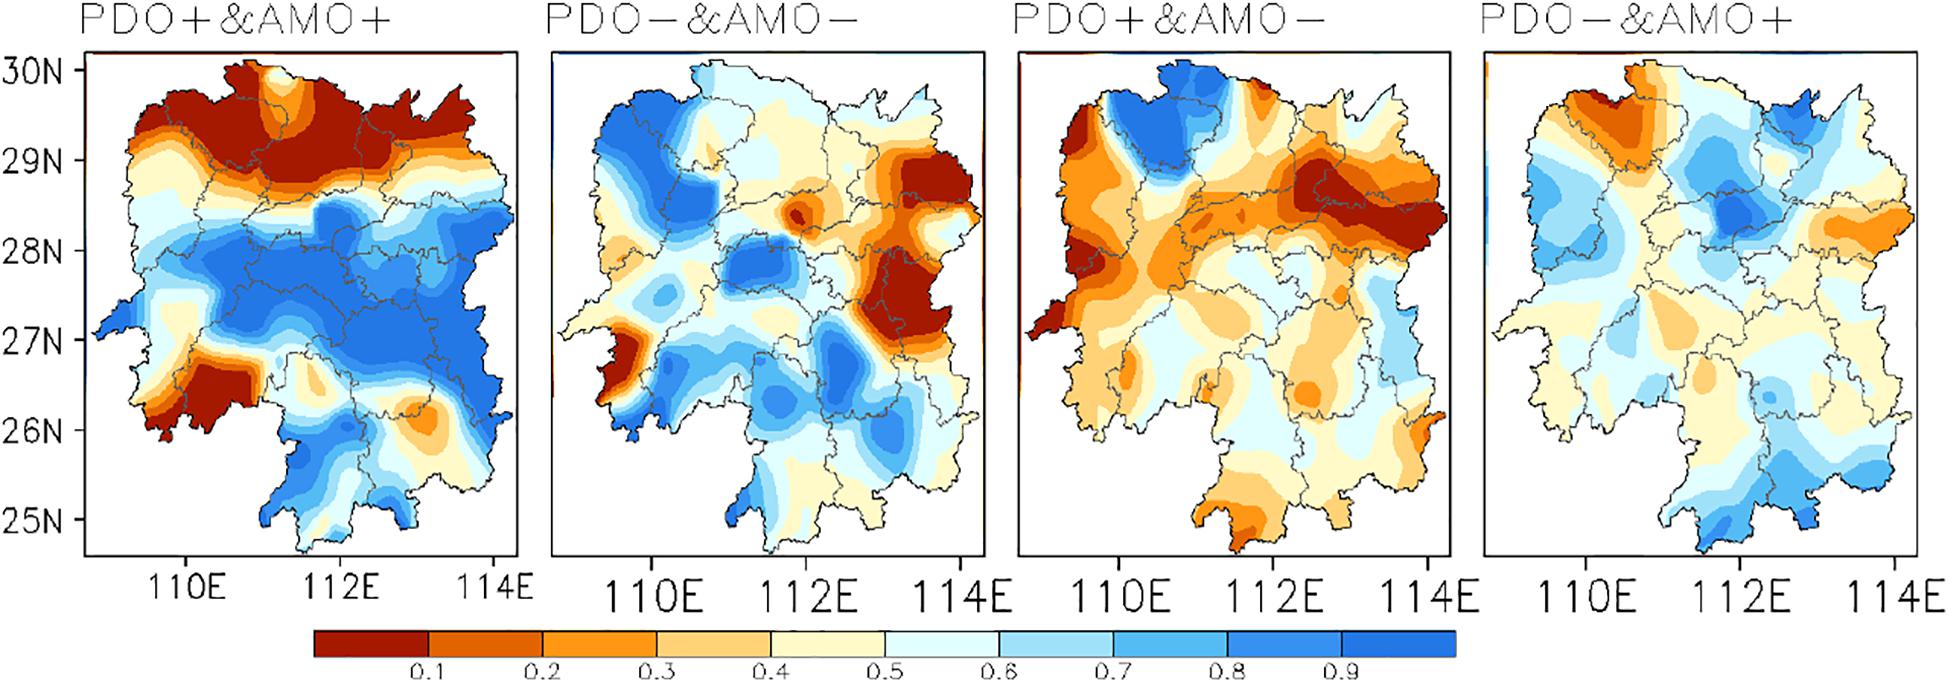
Figure 8. Composition of precipitation anomaly percentage in flood season of Hunan Province for the cold SST background in the previous stage (without reaching the standard of a La Niña event).
Circulation Analysis
The above analyses have shown that regardless of the PDO and AMO phases, the precipitation anomaly in the next years of ENSO events is more significant than in normal years. Thus, the following cause analysis focuses on the precipitation and circulations in the next years of ENSO events.
As shown in Figure 9, in the next years of El Niño events, when the PDO and AMO are both in the positive phase the 500 hPa height field is the opposite to that when the PDO and AMO are both in the negative phase, but the influence on the precipitation in Hunan flood seasons is generally the same (Figure 9). Under the positive phase of the PDO and AMO, the area near Lake Baikal is in a low-pressure trough and is controlled by the negative geopotential height anomaly, so the circulation situation is favorable for the cold air to advance southward and affect southern China from the westward path. In addition, the middle and low latitudes are controlled by the positive geopotential height anomaly. However, the west Pacific subtropical high (WPSH, black lines of 5880) is obviously stronger and more southward than normal (red lines of 5880), favoring the water vapor transport to southern China. Therefore, precipitation in most Hunan is more than normal. Under the negative phase of the PDO and AMO, the significantly weaker East Asian trough is conducive to the southward movement of cold air. In addition, the WPSH is weaker than normal, but the India-Burma trough is significantly stronger, also contributing to the southwesterly water vapor transport to Hunan, and thereby resulting in more precipitation. However, the temperature is lower than that in the positive phase of the PDO and AMO (figure omitted). Under the positive PDO phase and the negative AMO phase, the middle latitudes are controlled by the negative geopotential height anomaly, and the southward cold air is strong. Meanwhile, the WPSH is on the sea and far from the mainland, and the India-Burma trough is weak, which is not conducive to the water vapor transport, resulting in less precipitation in Hunan. Under the negative PDO phase and the positive AMO phase, the middle latitudes are controlled by the positive geopotential height anomaly. Moreover, the weak cold air in the north is favorable for water vapor transport to the farther north. This circulation situation results in less precipitation in Hunan.
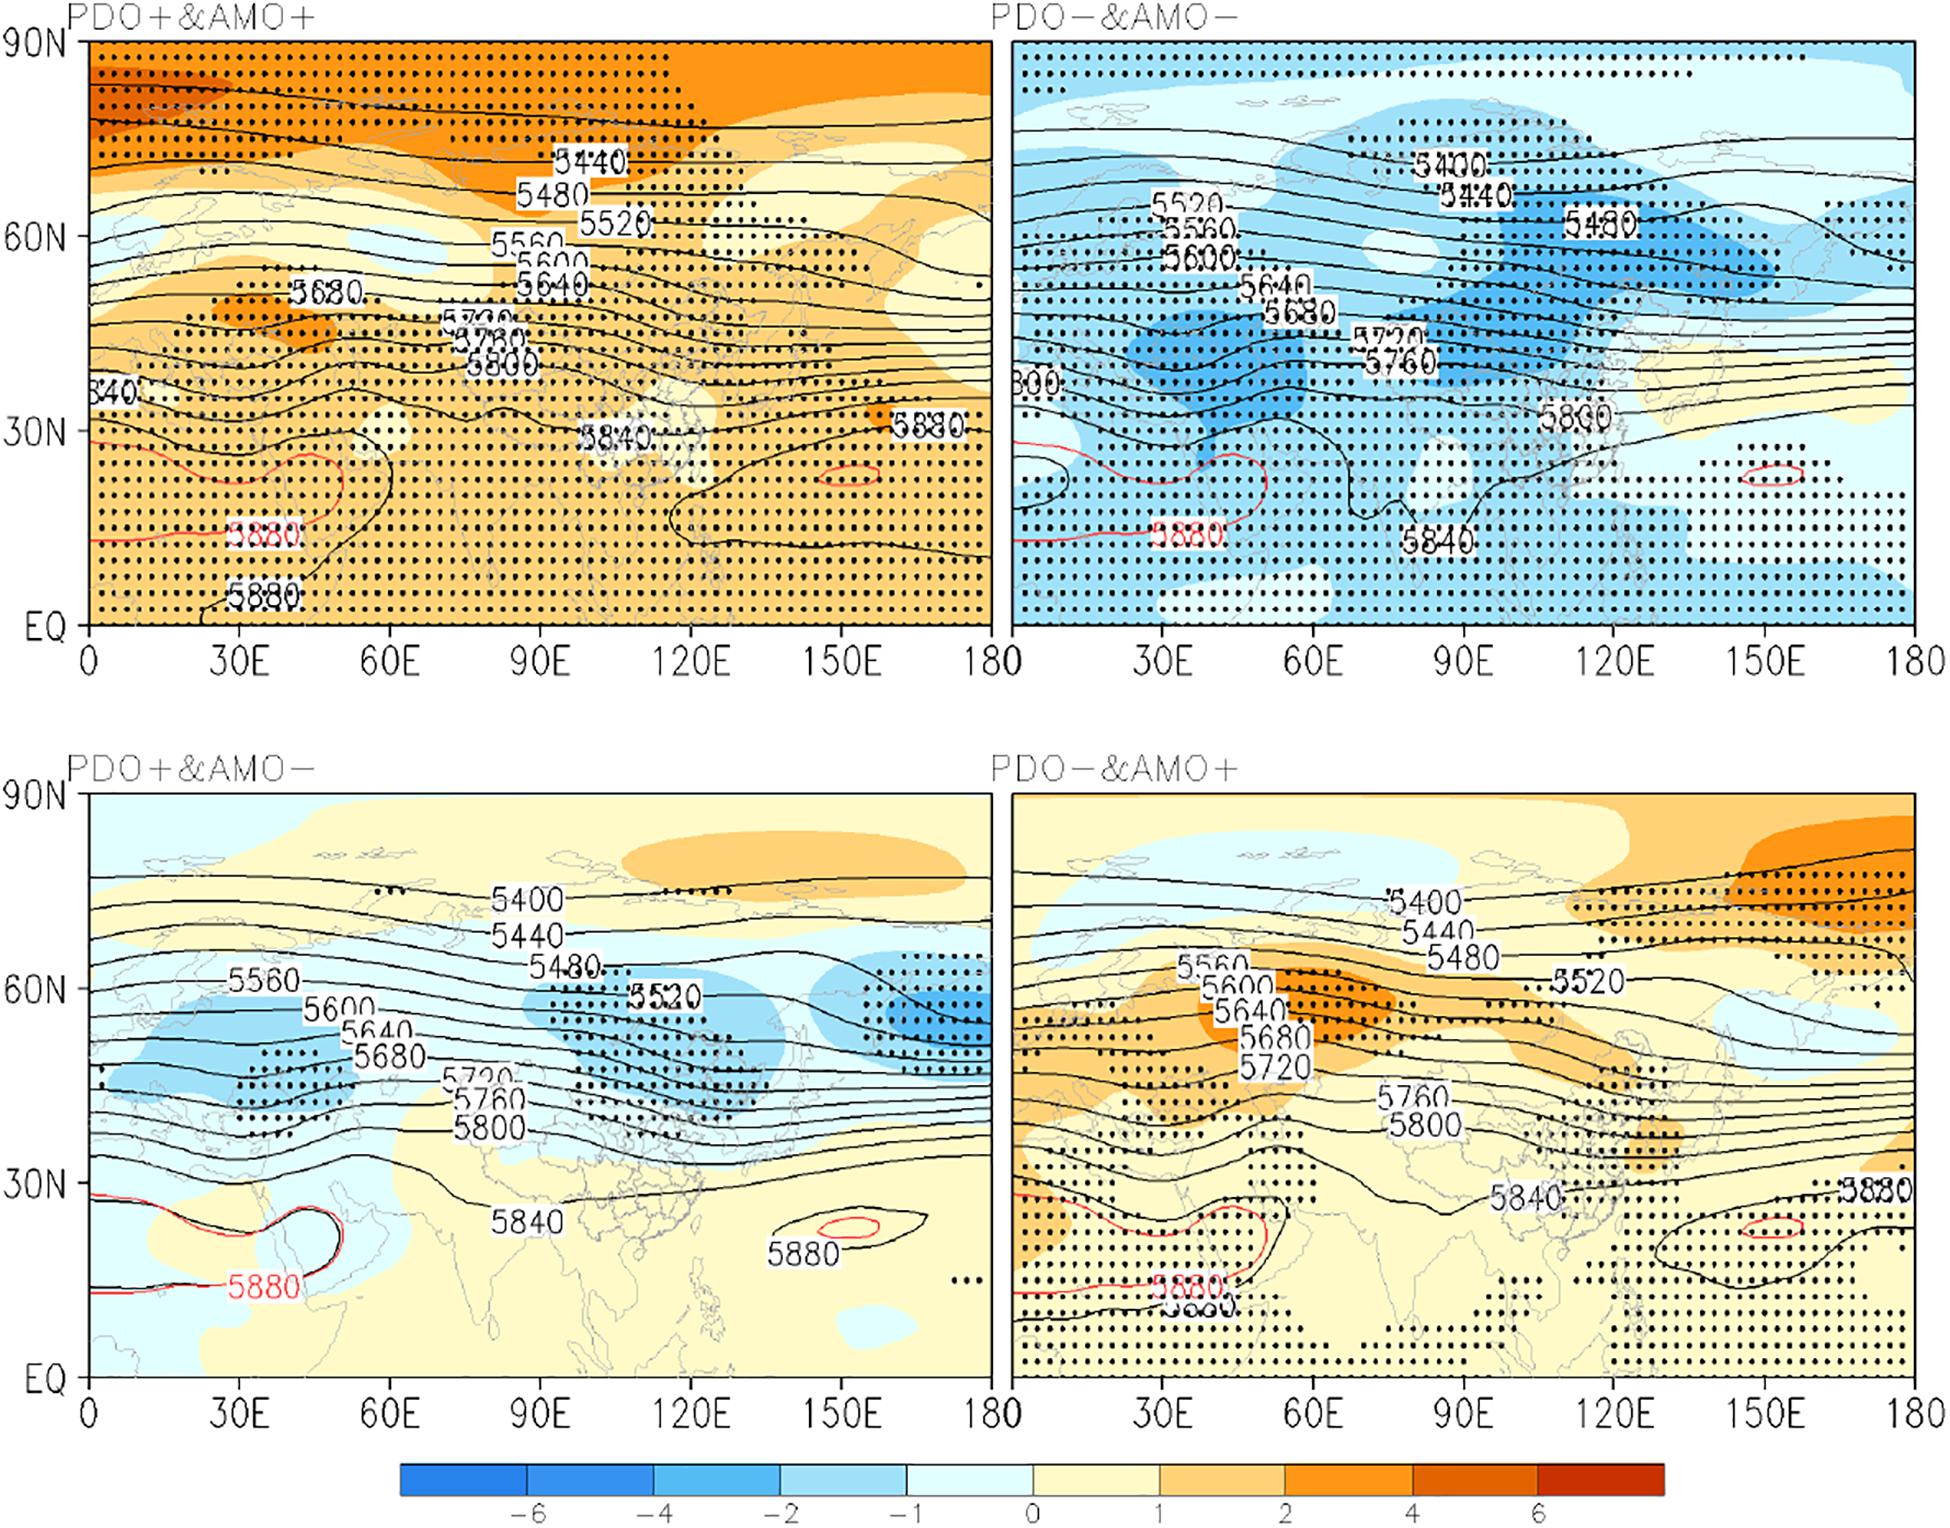
Figure 9. The composite 500 hPa geopotential height in the next years of El Niño events during 1961–2019 under different PDO and AMO phases. The punctate areas pass the significance test at 90% confidence level. The red lines denote 588 dagpm of climatology and shaded area denotes 500 hPa anomalies (the same below).
As shown in Figure 10, in the next years of La Niña events, the eastern coast of China presents a positive-negative-positive anomalous distribution of the East Asia/Pacific teleconnection under the positive phase of the PDO and AMO (the samples are only for 2018). The WPSH retreats back to the sea and the positive geopotential height anomaly controls southern China, which is not conducive to water vapor transport, easily causing high temperature and less precipitation in Hunan. Under the negative phase of the PDO and AMO, the WPSH is anomalously weak and the negative geopotential height anomaly controls the whole low latitudes, leading to the weak water vapor transport and less precipitation in Hunan. The results under the opposite phase of the PDO and AMO are similar to those under the same negative phase.
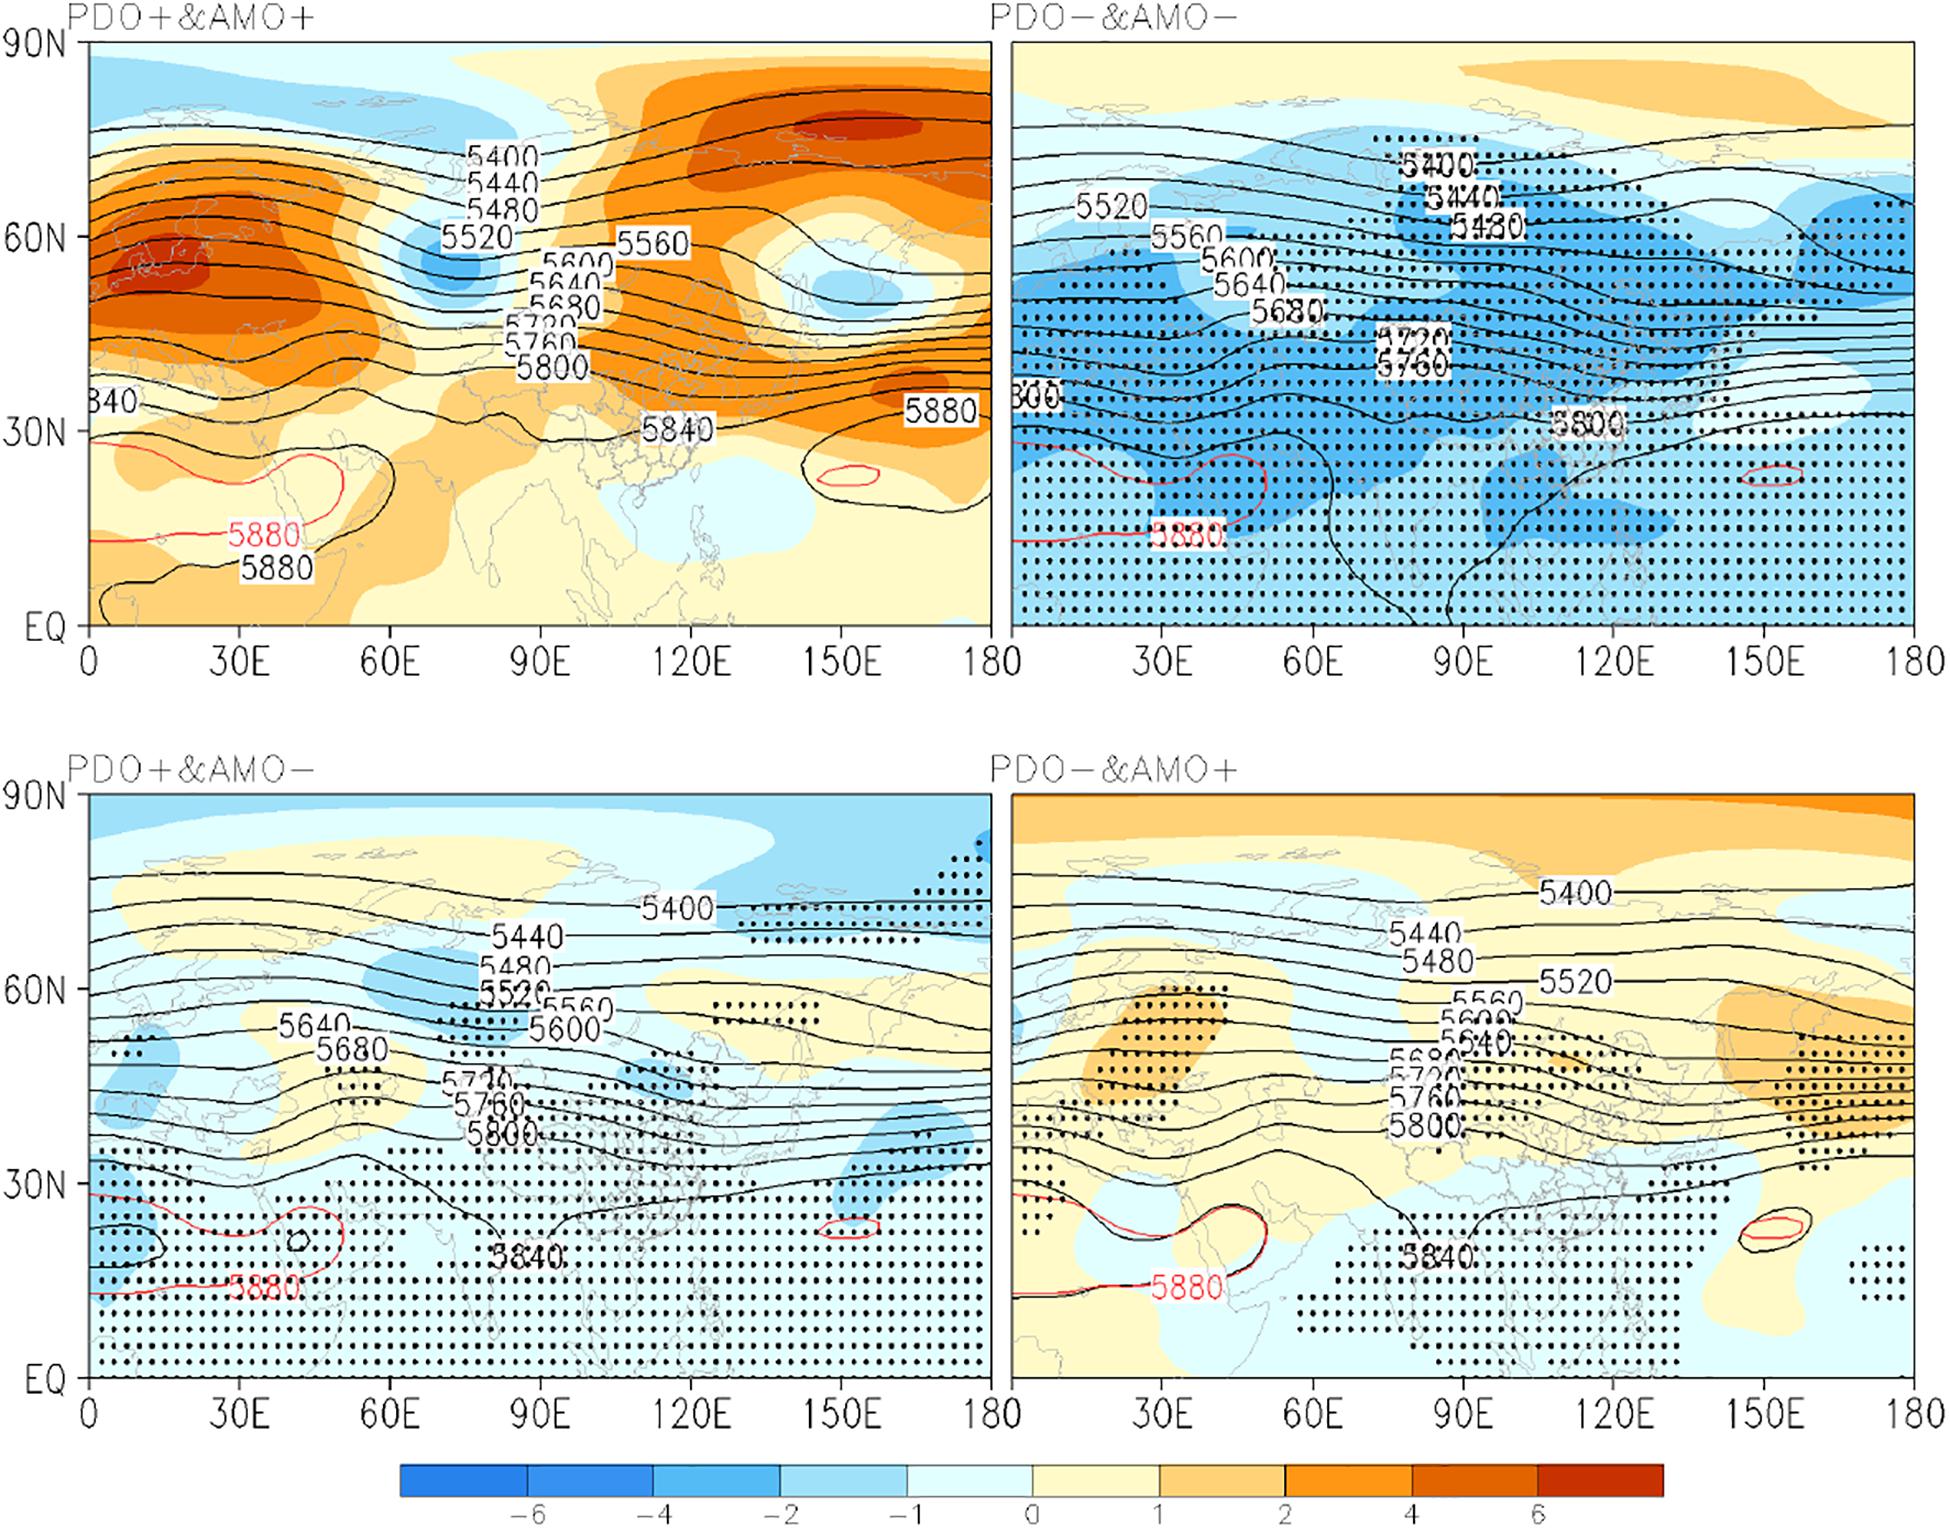
Figure 10. The same as Figure 8, but for the next years of La Niña events.
As shown in section “Impacts of La Niña Events,” after the low pass filtering the precipitation in Hunan flood seasons is mainly more than normal in the south-central parts under the same phase of the PDO and AMO in the next years of La Niña events. Therefore, we also perform the low pass filtering on the 500 hPa geopotential height in the next years of La Niña events. Note that when the PDO and AMO are in the same positive phase, only 2018 is the next year of the La Niña event, And the results in shown in Figure 11. As can be seen, under the same positive phase of the PDO and AMO the 500 hPa circulation situation in the middle and low latitudes in the next years of La Niña events is similar to that in the next years of El Niño events. At this time, the WPSH is obviously stronger and more southward than normal, favoring the water vapor transport to southern China, so the precipitation in most of Hunan is more than normal. Under the same negative phase of the PDO and AMO, the significantly weaker East Asian trough is conducive to the southward movement of cold air. Meanwhile, the WPSH is weaker than normal, but the India-Burma trough is significantly stronger, contributing to the southwesterly water vapor transport to southern China, and thereby resulting in more precipitation in Hunan. While under the two kinds of the opposite phase, the circulation situation is generally the same. The WPSH is anomalously weak and the negative geopotential height anomaly controls the whole low latitudes, leading to the weak water vapor transport and less precipitation in Hunan.
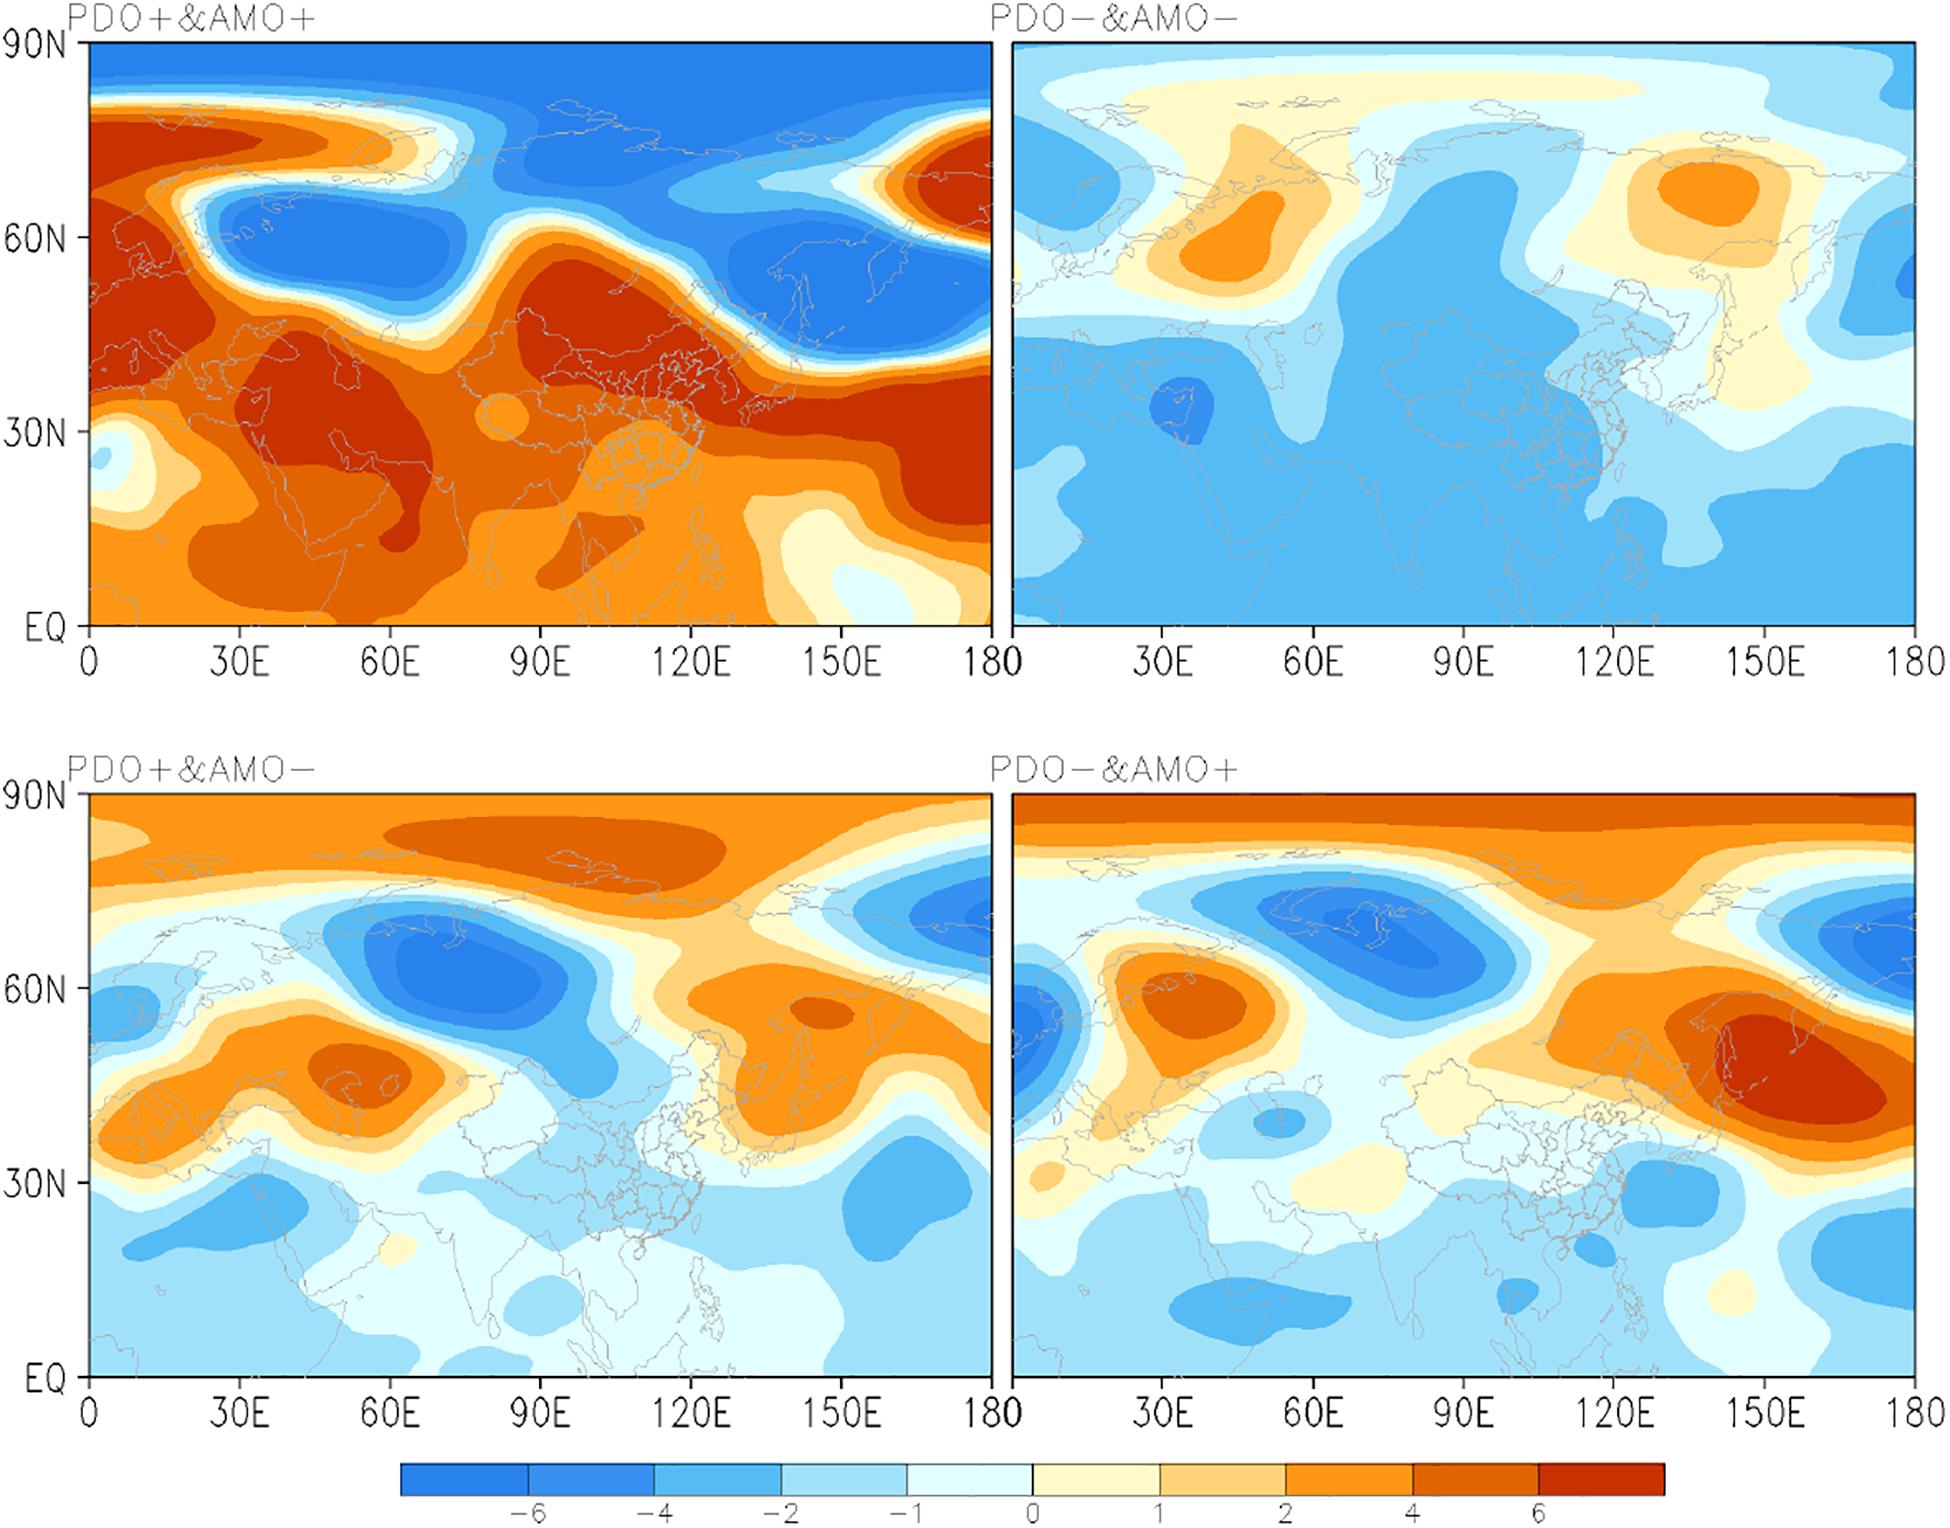
Figure 11. The same as Figure 9, but for the results after the low-pass filtering.
Conclusion and Discussion
Based on the above analyses, the following conclusions can be obtained.
Since 1910, the precipitation in Hunan flood seasons has an obvious 20-year variation cycle. The PDO index has an obvious period of 5–6 years from the early 1920s to the early 1960s and in 1990s. In the 21st century, the period is about eight years. The AMO index is a multidecadal climatic factor, and its interannual cycle is not significant. Since the 1960s, in 81.8% of the years the precipitation in Hunan flood seasons is mainly more than normal in the years when the PDO and AMO are in the same phase. Conversely, the precipitation in Hunan flood seasons is mainly less than normal, accounting for 64.9% of the total years.
Since 1961, the precipitation in flood seasons is mainly more than normal in most Hunan under the same positive phase of the PDO and AMO, except for the northwest Hunan and parts of southeast Hunan, especially in summer. Under the same negative phase of the PDO and AMO, the precipitation during the first rainy season is more than normal in northern Hunan, and the precipitation during the later flood season is more than normal in southern Hunan. Overall, the summer precipitation is more than normal in most areas. Under the positive PDO phase and negative AMO phase, the precipitation in flood seasons is less than normal in most regions of Hunan, especially in the first rainy season. The precipitation in summer and in the later flood season is more in the west and less in the east. Under the negative PDO phase and positive AMO phase, the precipitation is more than normal in most of the regions in the first rainy season, and in other time the precipitation is less than normal in Hunan, especially in northern Hunan.
In the next years of El Niño events since 1961, the precipitation in Hunan flood season is more than normal in most areas of Hunan under the same phase of the PDO and AMO, except for parts of southeastern Hunan. Under the positive PDO phase and the negative AMO phase, the precipitation is less than normal in most areas, except for northern Hunan. Under the negative PDO phase and the positive AMO phase, the precipitation is less than normal except in northwest Hunan and parts of southeast Hunan. The main reason is that under the same positive PDO and AMO phase, the WPSH is stronger and more southward than normal, favoring the water vapor transport to southern China, and thereby resulting in more precipitation in most Hunan. When the PDO and AMO are in the same negative phase, the significantly weaker East Asian trough is conducive to the southward movement of cold air. Meanwhile, the WPSH is weaker than normal, but the India-Burma trough is significantly stronger, contributing to the southwesterly water vapor transport to southern China, and thereby resulting in more precipitation in Hunan. Under the positive PDO phase and the negative AMO phase, the WPSH is on the sea and far from the mainland, and the India-Burma trough is weak, which is not conducive to the water vapor transport, resulting in less precipitation in Hunan. Under the negative PDO phase and the positive AMO phase, the middle latitudes are controlled by the positive geopotential height anomaly. Moreover, the weak cold air in the north is favorable for water vapor transport to the farther north, and this circulation situation results in less precipitation in Hunan.
In the next years of La Niña events since 1961, after the low pass filtering the precipitation in Hunan flood seasons is mainly more than normal under the same phase of the PDO and AMO on the interdecadal scale, and the precipitation in southeastern Hunan is mainly more than normal when the PDO and AMO are in the opposite phase. Under the positive PDO phase and the negative AMO phase, the precipitation is consistently less than normal in the whole province, and the anomaly of less precipitation is more significant than that in the next years of El Niño events. Moreover, under the negative PDO phase and the positive AMO phase, the precipitation in Hunan flood seasons is more in the north and less in the south. Note that the circulation situation in the next years of La Niña events is similar to those in the next years of El Niño events, indicating that the critical climatic systems causing the more precipitation in Hunan are the same.
It is worth noting that this study only explains the differences of the precipitation in Hunan flood seasons under different phases of the PDO and AMO from the statistic method. So, the related physical mechanisms need to be further analyzed in future work. At the same time, this study only analyzes one province, Hunan. Further research is needed to study the decadal variability over the whole Yangtze River reaches. In addition, how PDO and AMO affect the subtropical high and surrounding circulation needs further investigations.
Data Availability Statement
The original contributions presented in the study are included in the article/supplementary material, further inquiries can be directed to the corresponding author.
Author Contributions
YZ analyzed the data. JP put forwarded the idea. YZ wrote the manuscript. All authors revised the manuscript.
Funding
This study was supported by the Innovation Development Project of China Meteorological Administration (Grant No. CXFZ2021Z033) and the Capacity Building Project of Hunan Meteorological Bureau in 2020 (Grant No. NLJS04).
Conflict of Interest
The authors declare that the research was conducted in the absence of any commercial or financial relationships that could be construed as a potential conflict of interest.
References
Ding, Y., Wang, Z., and Sun, Y. (2008). Inter-decadal variation of the summer precipitation in East China and its association with decreasing Asian summer monsoon. Part I: Observed evidences. Int. J. Climatol. 28, 1139–1161. doi: 10.1002/joc.1615
Dong, X. (2016). Influences of the Pacific Decadal Oscillation on the East Asian Summer Monsoon in non-ENSO years. Atmos. Sci. Lett. 17, 115–120. doi: 10.1002/asl.634
Duan, D. Y., Chen, Y. X., and Ju, J. L. (1999). Discussion on the division and variation of precipitation in flood season in Hunan Province (in Chinese). Resources and environment in the Yangtze River Basin. 8, 440–444.
Duchon, C. E. (1979). Lanczos Filtering in One and Two Dimensions. J. Appl. Meteor 18, 1016–1022. doi: 10.1175/1520-04501979018<1016:LFIOAT<2.0.CO;2
Feng, J., Wang, L., and Chen, W. (2015). How Does the East Asian Summer Monsoon Behave in the Decaying Phase of El Niño during Different PDO Phases? J. Clim. 27, 2682–2698. doi: 10.1175/JCLI-D-13-00015.1
Fu, C. B., and Teng, X. L. (1988). Climate anomalies in China associated with E1Nino/Southern Oscillation (in Chinese). Chin. J. Atmos. Sci 12, 133–141. doi: 10.3878/j.issn.1006-9895.1988.t1.11
Gao, H., and Wang, Y. G. (2007). ON the weakening relationship between summer precipitation in China and ENSO (in Chinese). Acta Meteorol. Sin. 65, 131–137. doi: 10.3321/j.issn:0577-6619.2007.01.013
Hare, S. R., and Mantua, N. J. (2000). Empirical evidence for North Pacific regime shifts in 1977 and 1989. Prog. Oceanogr. 47, 103–145. doi: 10.1016/S0079-6611(00)00033-1
Huang, R. H., Chen, J. L., and Liu, Y. (2011). Interdecadal Variation of the Leading Modes of Summertime Precipitation Anomalies over Eastern China and Its Association with Water Vapor Transport over East Asia (in Chinese). Chin. J. Atmos. Sci. 35, 589–606. doi: 10.3878/j.issn.1006-9895.2011.04.01
Hudgins, L., and Huang, J. P. (1996). Bivariate wavelet analysis of Asia monsoon and ENSO. Adv. Atmos. Sci. 13, 299–312. doi: 10.1007/BF02656848
Jin, Z. H., and Tao, S. Y. (1999). A Study on the Relationships between ENSO Cycle and Rainfalls during Summer and Winter in Eastern China (in Chinese). Chin. J. Atmos. Sci. 23, 663–672. doi: 10.3878/j.issn.1006-9895.1999.06.03
Kalnay, E. (1996). NCEP/NCAR 40-year reanalysis project. Bull. amer. meteor.Soc 77, 437–471. doi: 10.1175/1520-04771996077<0437:TNYRP<2.0.CO;2
Kerr, R. (2000). A North Atlantic climate pacemaker for the centuries. Science. 288, 1984–1985. doi: 10.1126/science.288.5473.1984
Li, W. J., Liu, J. P., and Ren, H. L. (2018). Characteristics and Corresponding Mechanisms of the Leading Modes of Interdecadal Variability of Summer Rainfall in Southern China (in Chinese). Chin. J. Atmos. Sci. 42, 859–876. doi: 10.3878/j.issn.1006-9895.1802.17283
Lu, R., Dong, B., and Ding, H. (2006). Impact of the Atlantic Multidecadal Oscillation on the Asian summer monsoon. Geophys. Res. Lett. 33, 194–199. doi: 10.1029/2006GL027655
Mantua, N. J., and Hare, S. R. (2002). The Pacific Decadal Oscillation. J. Oceanogr. 58, 35–44. doi: 10.1023/A:1015820616384
Peng, J. D., Liao, Y. F., Jiang, Y. H., Zhang, J., and Qi, X. (2017). Development of the homogenized monthly precipitation series during 1910–2014 and its changes in Hunan Province, China. J. Water Clim. Change. 8, 791–801. doi: 10.2166/wcc.2017.178
Si, D., and Ding, Y. H. (2016). Oceanic Forcings of the Interdecadal Variability in East Asian Summer Rainfall. J. Clim. 29, 7633–7649. doi: 10.1175/JCLI-D-15-0792.1
Smith, T. M., Reynolds, R. W., Peterson, T. C., and Lawrimore, J. (2008). Improvements to NOAA’s Historical Merged Land–Ocean Surface Temperature Analysis (1880–2006). J. Clim. 21, 2283–2296. doi: 10.1175/2007JCLI2100.1
Sun, C., Kucharski, F., Li, J. P., Jin, F.-F., Kang, I.-S., and Ding, R. (2017). Western tropical Pacific multidecadal variability forced by the Atlantic multidecadal oscillation. Nat. Commun. 8, 15998. doi: 10.1038/ncomms15998
Sutton, R. T., and Hodson, D. L. R. (2007). Climate Response to Basin-Scale Warming and Cooling of the North Atlantic Ocean. J. Clim. 20, 891–907. doi: 10.1175/JCLI4038.1
Wang, Y. M., Shuang, L. L., and Luo, D. H. (2009). Seasonal response of Asian monsoonal climate to the Atlantic Multi-decadal Oscillation. J. Geophys. Res 114, D02112. doi: 10.1029/2008JD010929
Xu, Z. Q., Fan, K., and Wang, H. J. (2015). Decadal variation of summer precipitation over China and associated atmospheric circulation after the late 1990s. J. Clim. 28, 4086–4106. doi: 10.1175/JCLI-D-14-00464.1
Ye, D. Z. (1990). Research progress of drought and flood climate (in Chinese). Bei Jing: Meteorological Press.
Zhang, Q. Y., Lu, J. M., and Yang, L. M. (2007). The Interdecadal Variation of Precipitation Pattern over China during Summer and Its Relationship with the Atmospheric Internal Dynamic Processes and Extra-Forcing Factors (in Chinese). Chin. J. Atmos. Sci. 31, 1290–1300. doi: 10.3878/j.issn.1006-9895.2007.06.23
Zhang, R., and Delworth, T. L. (2010). Simulated Tropical Response to a Substantial Weakening of the Atlantic Thermohaline Circulation. J. Clim 18, 1853–1860. doi: 10.1175/JCLI3460.1
Zhu, Y., Wang, H., Ma, J., Wang, T., and Sun, J. (2015). Contribution of the phase transition of Pacific Decadal Oscillation to the late 1990s’ shift in East China summer rainfall. J. Geophys. Res.: Atmos. 120, 8817–8827. doi: 10.1002/2015JD023545
Zhu, Y., Wang, H., Zhou, W., and Ma, J. (2011). Recent changes in the summer precipitation pattern in East China and the background circulation. Clim. Dyn. 36, 1463–1473. doi: 10.1007/s00382-010-0852-9
Keywords: Hunan province, precipitation in the flood seasons, Pacific decadal oscillation, Atlantic Multidecadal Oscillation, El Niño-Southern Oscillation
Citation: Zeng Y, Huang C, Tang Y and Peng J (2021) Precipitation Variations in the Flood Seasons of 1910–2019 in Hunan and Its Association With the PDO, AMO, and ENSO. Front. Earth Sci. 9:656594. doi: 10.3389/feart.2021.656594
Received: 21 January 2021; Accepted: 05 March 2021;
Published: 06 April 2021.
Edited by:
Qingxiang Li, Sun Yat-sen University, ChinaReviewed by:
Zhiqiang Gong, Beijing Climate Center (BCC), ChinaBosi Sheng, Sun Yat-sen University, China
Copyright © 2021 Zeng, Huang, Tang and Peng. This is an open-access article distributed under the terms of the Creative Commons Attribution License (CC BY). The use, distribution or reproduction in other forums is permitted, provided the original author(s) and the copyright owner(s) are credited and that the original publication in this journal is cited, in accordance with accepted academic practice. No use, distribution or reproduction is permitted which does not comply with these terms.
*Correspondence: Jiadong Peng, MTQ4NjU5NzZAcXEuY29t