 Yonggang Ge
 Xiaojun Guo
 Meiqiang Zhan3
- 1Key Laboratory of Mountain Hazards and Surface Process/Institute of Mountain Hazards and Environment, Chinese Academy of Sciences, Chengdu, China
- 2CAS Center for Excellence in Tibetan Plateau Earth Sciences, Beijing, China
- 3China Railway Changjiang Transport Design Group Co., LTD, Chongqing, China
Lateral slope deposits along a channel represent an important source of material for initiation and development of debris flows/floods that are typically observed in many headwater tributaries. This study found that the failure process of such a deposit reflects combined interaction between external hydrodynamic factors (inflow discharge and channel slope) and internal factors (compactness and fine particle content). The erosion process comprises two stages: runoff erosion toward the toe of the deposit body and soil failure owing to gravity. Spatially, the erosion rate is distributed unevenly across the deposit; the highest value occurs at the section close to the middle of the deposit, on the upstream face. Temporally, the erosion rate decreases exponentially. Overall, the average erosion rate decreases (increases) with bulk density (inflow discharge and channel slope). However, a slope of 7 is a threshold at which the tendency of the erosion rate in relation to the fine particle content differs. In comparison with the other three influencing factors, the effect of the fine particle content is much smaller. Although the bulk density of the deposit imposes the most significant effect, it is of the same order as that of both inflow discharge and channel slope. As the failure process can be summarized as repeated runoff scouring of the toe of the deposit, deposit failure, and entrainment of the failure body by runoff, we proposed a calculation method for the total time required for a complete lateral erosion process, and validation of the calculation suggested its reasonability. The findings of this study enhance the understanding of the mechanism of lateral soil deposit failure, which could help improve runoff-induced debris flood forecasting in headwater regions of mountainous catchments.
Introduction
In many headwater tributaries, lateral slope deposits along the channel represent an important source of material available for debris flow/flood initiation and flow development (Bardou and Jaboyedoff, 2008; Brenna et al., 2020; Guo et al., 2016; Guo et al., 2020). Such deposits, which often partially block the channel, usually form following landslides and collapses or as screes, and thus can have different composition and degrees of compactness. Generally, such deposits remain stable under regular runoff, but are potential to fail under certain surface runoff conditions. Failure of such a deposit reflects combined interaction between hydrodynamic and gravitational forces (Cui et al., 2013; Zhou et al., 2013; Zhou et al., 2015). From the perspective of inducing factors, upstream inflow is the main trigger for the initiation of movement of the material at the toe of the deposit, and the effect of gravity on the soil body also has to be considered in the failure process.
The impact of lateral slope deposit failure on the formation and/or development processes of a debris flow is sometimes considered in the same category as that of landslide dams, which generally block the channel entirely (Cui et al., 2013; Zhou et al., 2015). However, the difference is that the gravitational effect is seldom considered in the landslide-dam failure process (Xiangang et al., 2018; Jiang et al., 2020). Another similar phenomenon is the process of lateral erosion of a river bank, the initiation process of which is suggested to reflect the effect of water shear (i.e., the drag force of runoff) versus river bank resistance. The effect of channel runoff on the initiation of movement of soil particles has been studied previously through consideration of river dynamics, for example, the conditions for movement of uniform sand, and relationships between the parameters of the curve and grain composition were also proposed (e.g., Qian and Wan, 1983; Osman and Thorne, 1988; Qian et al., 1989; Nagata et al., 2000; Couper, 2004; Jason and Raymond, 2006; Khosravi and Azhini, 2007; Rinaldi et al., 2008). It has been suggested that the shear force required for the initiation of movement of soil is influenced by the cohesion of the soil (Osman and Thorne, 1988; Cui, 1992; Takahashi, 1978; Takahashi, 1991; Takahashi, 2014), which depends on the physical characteristics (e.g., compaction, percentage of fines, and moisture content) of the soil body (Knapen et al., 2007; Cui et al., 2017; Cui et al., 2019). Shields (1936) developed an empirical approach that involves the dimensionless shear stress as a function of the grain size and Reynolds number. The work was updated by Yalin and Karahan (1979) using carefully scrutinized, available experimental data and subsequently improved further by Soulsby (1997). In practice, shear stress is also determined in the field or in the laboratory using flume tests, submerged jet-index tests, the erosion function apparatus, cylindrical erosion tests, or other test methods (e.g., Hanson and Simon 2001; Briaud 2008; Chang et al., 2011; Zhang et al., 2016; Zhu and Zhang 2016).
Traditionally, the erosion rate of a soil body has been investigated by building empirical relationships between the influencing factors and the extent of soil erosion (e.g., Khosravi and Azhini, 2007). The mechanism controlling the combined influence of soil mechanics and hydrodynamics on failure has also been proposed (Osman and Thorne, 1988; Darby and Throne, 1996; Nagata et al., 2000; Dapporto et al., 2001; Couper, 2004; Jason and Raymond, 2006; Khosravi and Azhini, 2007; Rinaldi et al., 2008). A governing equation of river and/or rill erosion was proposed to determine the change of channel width, which assumes that the water flow power is smallest, critical shear stress is largest, or the sediment transport rate is largest (Lavelle and Mofjeld, 1987; ASCE Task Committee et al., 1998; Zhu et al., 2001). Nevertheless, the erosion rate values are often very difficult to estimate since the soil resistance (erosion rate) does not represent an actual measurable soil property (Knapen et al., 2007). As a result, it becomes crucial to link the erosion rate to one or some easy-measurable soil properties or flow conditions. Although some empirical equations are available to estimate the erodibility parameters by identifying the shear stress (e.g., Hanson and Simon, 2001; Annandale, 2006; Chang et al., 2011), it is also indicated that the erosion rate to concentrated flow is influenced by almost any soil property, turning it into a complex concept with a high spatial and temporal variability (Nachtergaele and Poesen, 2002), that is not yet fully understood. Additionally, considering the differences among a river bank, a rill, and a slope deposit in terms of morphology and grain composition, the erosion–failure process of lateral slope deposits should be investigated independently.
This work observed the failure process of a soil lateral slope deposit in a channel and investigated the relationship between the erosion rate and the inducing factors based on the experiment. The effects of influencing factors were analyzed quantitatively, and a method for calculating the time required for complete erosion of the deposit was proposed by combining two classical theories of channel erosion.
Experimental Design
Flume Setup
Flume-based experiments were designed and performed to investigate the failure process of a lateral slope deposit body, as shown in Figure 1. A cubic water supply box (dimensions: 80 × 80 × 80 cm) provided stable inflow conditions for the experiment, and the flow rate was controlled by a water tank valve. The angle of the flume (length: 400 cm, width: 40 cm, height: 40 cm) could be adjusted in the range of 0–15°. The bottom of the flume was coarsened manually. A rectangular weir (height: 25 cm) was placed in the flume 80 cm downstream from the water tank to allow stabilization and quantification of the upstream inflow. For ease in observing and recording the soil deposit failure at different times and determining the related parameters, the sides of the flume were constructed with toughened clear glass with marked coordinates.
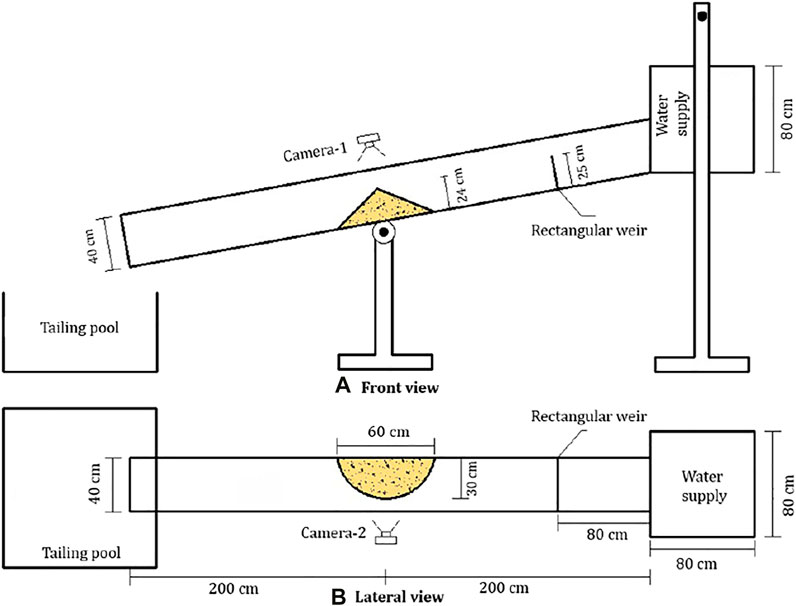
FIGURE 1. Experimental flume system.
Factor Selection and Deposit Body Design
The research objective of this series of experiments was to investigate the erosion of a lateral slope deposit body, typical of channels in headwater regions of mountainous catchments. Prior to deciding on the experimental design, a detailed survey of such deposits was performed in the field. The results revealed that the geometry of a lateral slope deposit body generally has a semitriangular conical form, and that the slope is typically in the range of 30–35°. Consequently, the experimental deposit body used in this study was designed to have similar shape and slope. The experimental deposit body was located in the center of the flume 200 cm downstream from the water tank.
We considered four parameters as the principal influencing factors of the stability of the deposit body under the runoff conditions: channel slope (θ), upstream water discharge (Q), fine particle content (δ), and bulk density of soil (ρ). In separate experiments, the value of θ was adjusted to 3°, 5°, 7°, 9°, 11°, and 13°; the value of Q was controlled to 1, 2, 3, and 4 L/S (10–3 m3/s); the value of δ was set to 5, 10, 15, 20, 30, and 40%; and the value of ρ was controlled to 1.4, 1.5, 1.6, 1.7, and 1.8 g/cm3 (Figure 2). In defining the content of fine particles, it is usually considered that the content of particles with diameter of <1 mm affects the moisture content of the deposit material, and has notable influence of its consolidation, plasticity, and flow state (Cui, 1992; Wang et al., 2017). Therefore, in this study, the threshold value between fine and coarse particles was set as 1 mm.
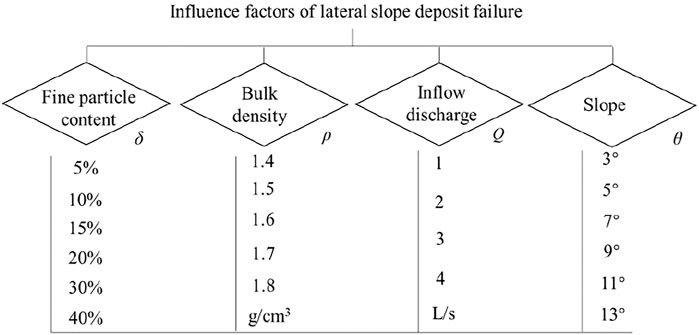
FIGURE 2. Influence factors of lateral slope deposit failure considered in this study.
Experimental Soil
The original experimental soil was collected from a single natural accumulation slope deposit body in the field, which is typically with a semitriangular conical form, and slope of 34°. The soils on the deposit were colluvium from the upper part of the slope. They were collected and then dried and screened, and the initial water content was controlled to 10%. The soil material with different particle size ranges was reorganized according to experimental requirements. Considering the influence of flume width, equivalent substitution (Guo et al., 2016) was used for reconfiguration of particles with size >10 mm. Ultimately, the final content of each particle group was obtained using the following formula:
where P>2 and P>10 represent the content of particles in the original soil with diameter >2 and >10 mm, respectively, and ΔPoi is the content of each particle group in the original grade.
The particle size parameters of the original and experimental soils are listed in Table 1. Among them, NM is the particle composition of the natural soil, ESNM is the particle composition of the natural soil after equivalent substitution using Eqs. 1, and S-1, S-2, S-3, S-4, S-5, and S-6 are the particle compositions of the soils with values of δ of 5, 10, 15, 20, 30, and 40%, respectively.
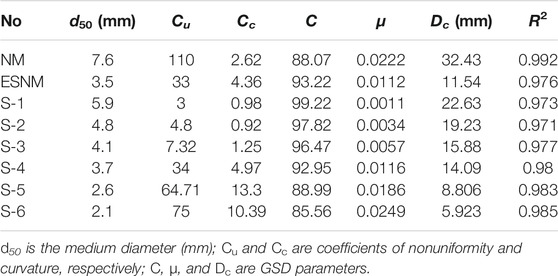
TABLE 1. Particle size parameters of the natural and experimental soils.
The particle size distributions are also expressed in terms of their grain size distribution (GSD) parameters (Li et al., 2013; Li et al., 2017):
where D is the particle diameter (mm); P(D) is the cumulative percentage content (%) larger than particle size D; C is a coefficient; μ is equivalent to the particle fractal index, which is related to soil structure (especially porosity); and Dc is defined as the characteristic particle size (mm), used to rescale the cumulative curve according to the real constant introduced by the accumulation curve.
Owing to substitution of particles with a diameter of >10 mm, the value of d50 in all the experimental soils was markedly smaller than that of the natural soil. However, as the GSD parameters of MC-4 are similar to those of the treated natural soil ESNM, MC-4 was considered representative of the natural soil.
Data Collection
An ultrasonic stage meter was used to measure the water level h(m) of the flow, and correction was performed on the basis of the graduated readings on both sides of the flume. Colored balls were used as tracers for the calculation of the mean velocity of the surface flow. Additionally, the video imagery was also used to validate the calculation. The inflow discharge was calculated using the basic equation Q = vA, where A is the section area (m2) that was determined on the basis of the measured water level h (m). Rules were pasted onto the glass sides of the flume to measure the erosion process of the soil deposit body. The video images were divided into a 2 × 2-cm grid to allow quantification of the spatial distribution and estimation of the volume of the deposit material.
Slope Failure Process
General Process of Lateral Soil Deposit Failure
Observation indicated that the soil deposit failure process was similar in most of the experiments but with differences in specific details. Thus, for illustrative purposes, here we consider experiment E-1 (ρ = 1.6 g/cm3, θ = 5°, Q = 3 L/s, and δ = 20%).
The duration of the entire failure process was 92 s. After the gate of the water tank was opened, as shown in Figure 3A, the partial blockage of the channel by the deposit body caused the inflow to become turbulent near the upstream side of the soil body, which led to water level rise and gradual expansion of the range of influence of the water flow. The particles of the slope toe were gradually mobilized, and the downstream water flow gradually became turbid (Figure 3B). With gradual erosion and frequent fluctuation of the water current, local small-scale failures occurred gradually in the upstream part of the soil body. As the deposit body was eroded, the shape of the slope toe in the upper part of the slope body changed, and the upper part of the slope body formed a free surface. Under the action of gravity, the upper part of the soil body underwent frequent intermittent and successive failures. The area of the soil body gradually shrank, the failure surface developed toward the downstream direction, and an obvious crack appeared at the top of the soil body (Figure 3C). This crack gradually widened and lengthened, which ultimately resulted in large-scale failure with a magnitude of approximately 500 cm3 (Figure 3D). Once the failed material fell into the channel, it dispersed quickly and accumulated loosely in front of the deposit body, temporarily (a period of 8 s) protecting the deposit body from further upstream erosion (Figures 3E,F). This process increased the flow and density of the downstream flow. This process occurred repeatedly during the remainder of the experiment. For instance, another crack appeared at t = 39 s, failure occurred at t = 42 s with magnitude of approximately 300 cm3, and the material was removed by the inflow by t = 46 s (Figures 3G–I). After t = 92 s, most of the soil body had failed and been eroded, which effectively removed the blocking effect of the channel by the deposit.
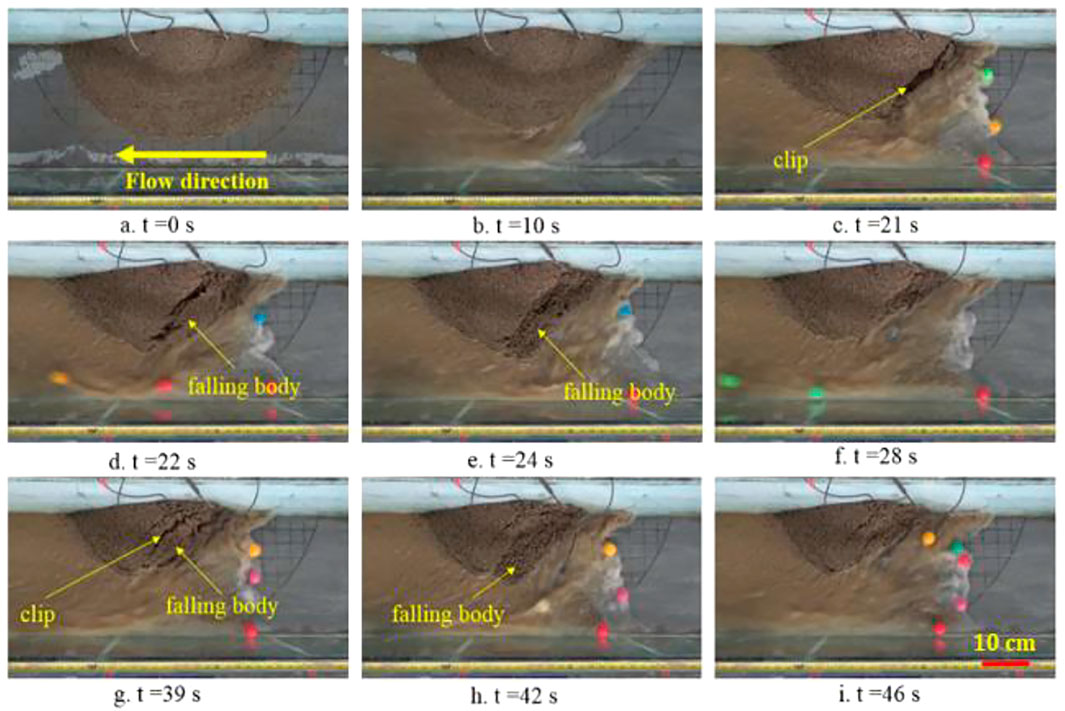
FIGURE 3. Typical features of the flow and deposit body during experiment E-1.
Morphological Variation and Erosion Process
The variation of the deposit body morphology, measured during the experiment, is plotted in Figure 4. The erosion was represented in both longitudinal and lateral directions. After repeated failure and entrainment of the soil material, the deposit body eventually evolved into a triangular or wedge shape, and the curvature of the outer contour gradually decreased before finally becoming aligned approximately parallel with the flow direction.
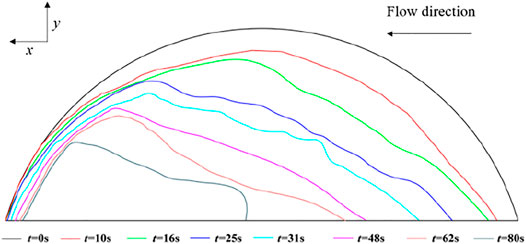
FIGURE 4. Morphological evolution of the deposit body.
Here, the erosion rate Eb, which is an important index of soil erosion, is used to represent the rate of failure. It is defined as the volume of the soil body eroded by the water flow per unit time:
where Eb is the erosion rate (m/s), Ws is the total eroded volume (m3), A is the eroded area, and T is the erosion duration (s).
As the soil body in the experiments was regarded as uniform, and the volume and the erosion distance have positive correlation, Eq. 3 can also be expressed as follows:
where L is the erosion distance (m).
Initially, we applied Eq. 4 to calculate the erosion rates, and used dx/dt and dy/dt to express the rates in both longitudinal and lateral directions (i.e., parallel and perpendicular to the inflow direction, respectively) to represent the effects of inflow and gravity, respectively.
Erosion Rate and Its Influencing Factors
Overall Tendency of Erosion
All cases exhibited a linear relationship of positive correlation between dx/dt and dy/dt under the effects of the different influencing factors, although the relationships differed in each experiment, as shown in Figure 5. The relationships reflect the influence of both water flow and gravity. Overall, dx was >dy, although dx was <dy in the initial period of some of the experiments in which θ was 3°. It indicates that under conditions with a slight slope, lateral erosion is more prominent than erosion in the direction of the flow, whereas in most other cases, erosion in the direction of the flow is more prominent, suggesting greater effect of inflow power.
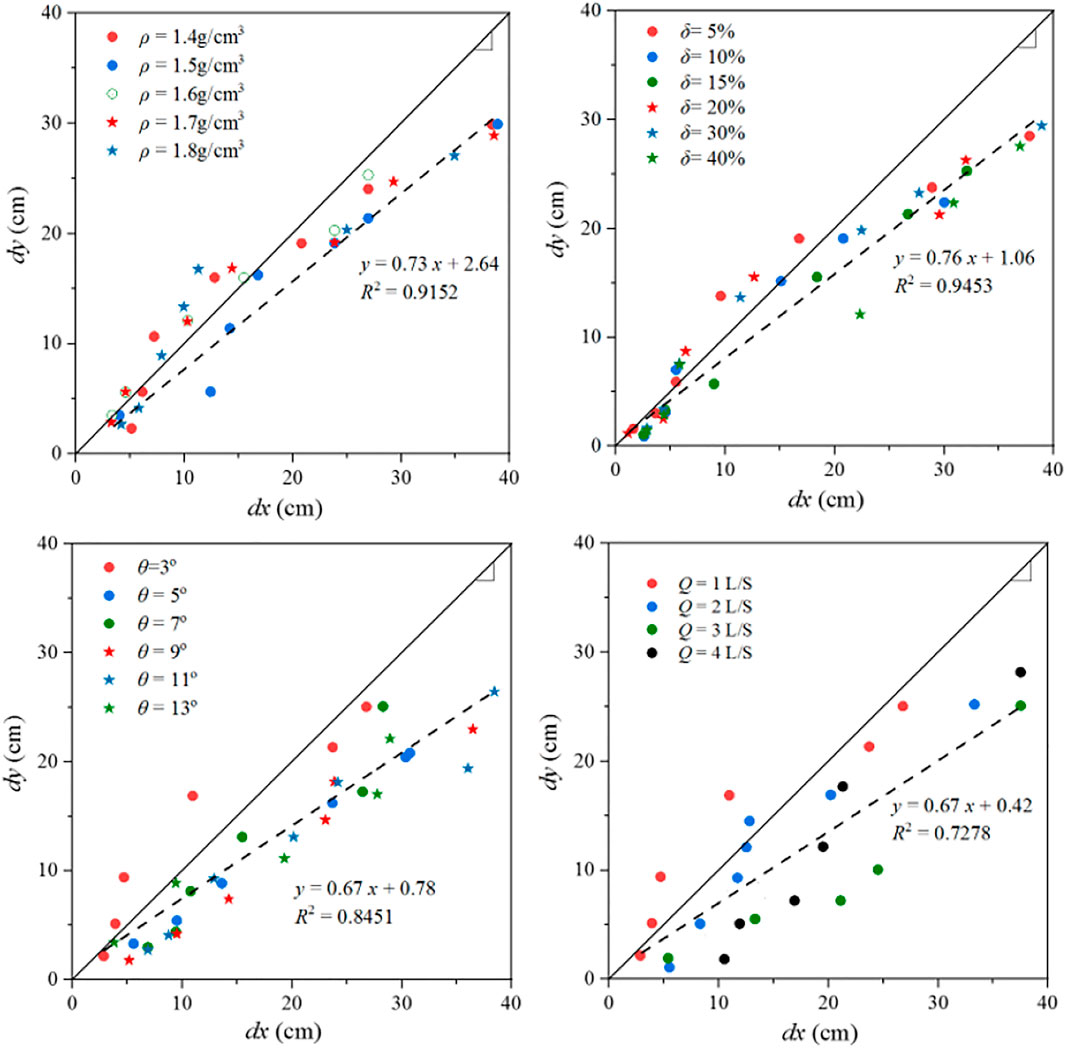
FIGURE 5. Linear positive correlation relationships between dx/dt and dy/dt under different influencing factors (ρ: bulk density, δ: fine particle content, θ: channel slope, and Q: upstream water discharge).
Temporal and Spatial Variations of the Erosion Rate
The temporal differences and spatial heterogeneities of the erosion rate of the slope deposit were investigated by measuring the morphology and the erosion process at different sections within the deposit at different times. Spatially, 15 sections were considered along the direction of flow (Figure 6). The dimensionless parameter x/L was used to determine the position of the section relative to the deposit body, that is, the location of Section 8 was at the central axis of the deposit, and its x-coordinate was set as 0. The coordinates of the beginning and end points of the deposit were −0.5 and 0.5, respectively, through which the coordinate of each individual section could be deduced.
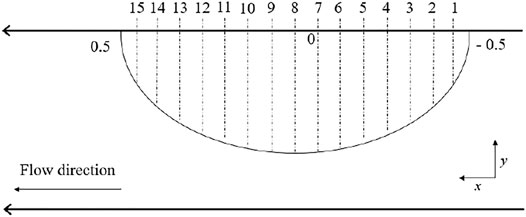
FIGURE 6. Measurement sections of the experiment.
Temporally, the failure period was divided evenly into nine subperiods (T-1−T-9), and the erosion rate at each section in each subperiod was measured.
It was found that the erosion rate exhibited notable nonuniform characteristics in both spatial and temporal perspectives. Taking periods T-1, T-4, and T-7 as examples, it can be seen from Figure 7 that the erosion rate first increased and then decreased with the increase of the relative position x/L of the observation section. The point of the peak erosion rate generally appeared to the left of the central axis (i.e., upstream of the deposit body) and then gradually moved downstream with time.
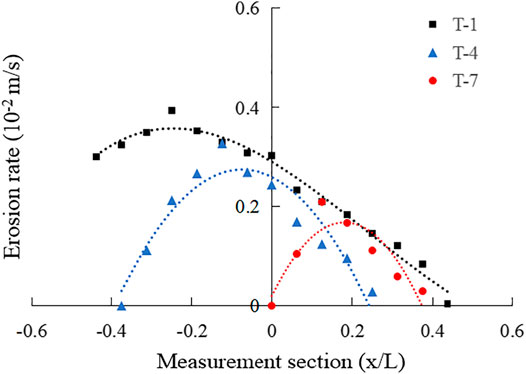
FIGURE 7. Erosion rate at different measurement sections with time.
Additionally, the average erosion rate of each time period was calculated and found to decrease exponentially with time, as shown in Figure 8. This is because the flow section becomes broadened with the ongoing progress of lateral erosion, and the erosion effect becomes weakened owing to the reduction of flow height, which decreases the shearing force of the flow. However, it should be noted that the erosion rate also fluctuated at certain periods owing to the randomness of the soil failures.
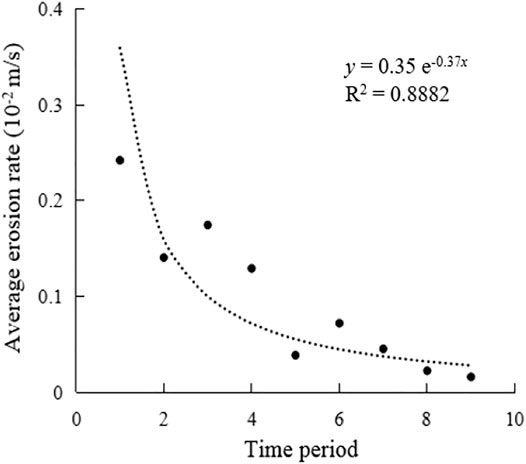
FIGURE 8. Decrease of the erosion rate with time.
Effects of Influencing Factors on the Mean Erosion Rate
(1) Fine Particles
We investigated the influence of individual factors on the erosion rate of the deposit body under conditions in which other factors were held constant. For example, in the set of experiments with ρ = 1.5 g/cm3, θ = 7°, and Q = 3 L/s, the value of δ was set at 5, 10, 15, 20, 30, and 40%, separately. It was found that the average erosion rate in both the longitudinal and the lateral directions (dx/dt and dy/dt) decreased with increasing δ, as shown in Figure 9A.
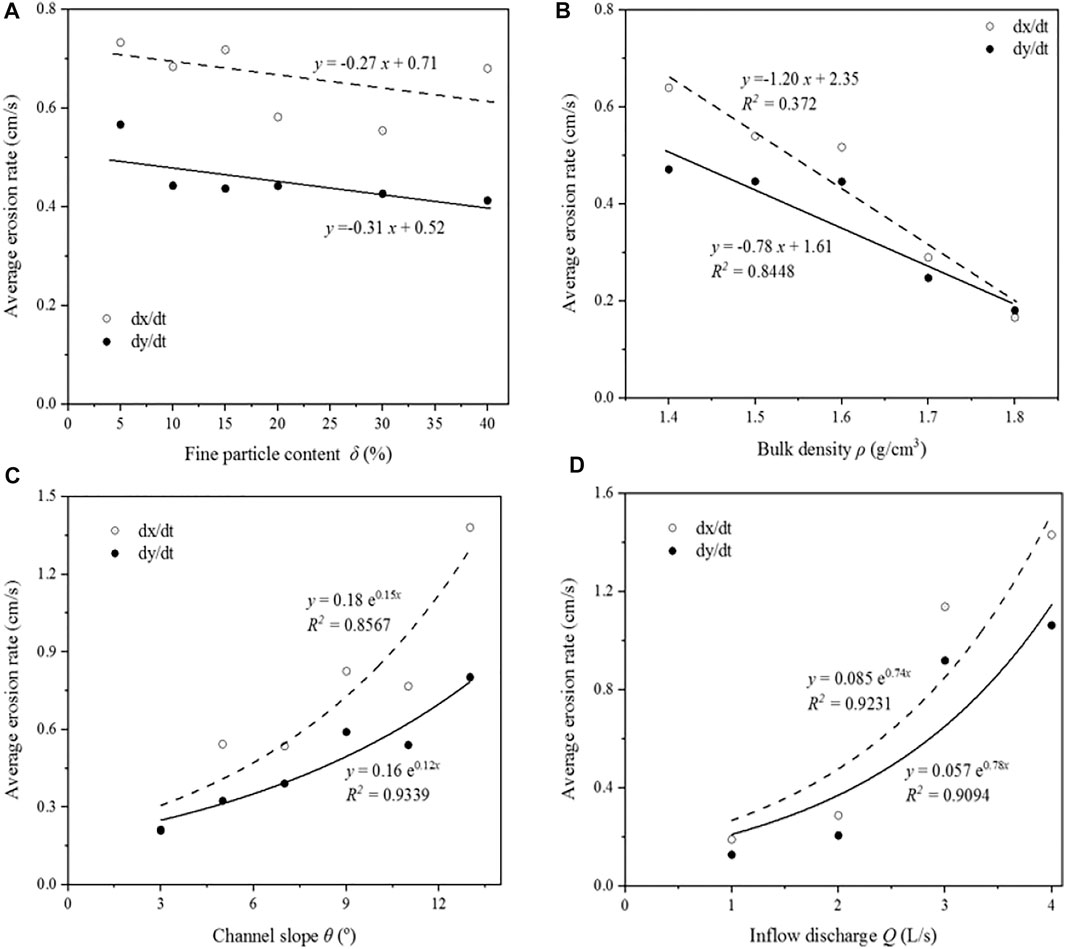
FIGURE 9. Relationships between the average erosion rate and different influencing factors.
We considered the set of experiments with δ = 20%, θ = 5°, Q = 3 L/s, and ρ controlled to 1.4, 1.5, 1.6, 1.7, and 1.8 g/cm3, separately, to investigate the influencing effect of ρ. The results revealed that the average erosion rate in both the longitudinal and the lateral directions (dx/dt and dy/dt) decreased with increasing ρ (Figure 9B).
Investigation of the effect of θ was conducted in the set of experiments with δ = 30%, ρ = 1.8 g/cm3, and Q = 3 L/s. Both the lateral and the longitudinal average erosion rates were correlated positively with θ, and the relationships could be expressed exponentially. The growth rate of dy/dt was slower than that of dx/dt, indicating that θ has greater influence on the erosion rate in the direction of flow (Figure 9C).
Investigation of the effect of Q was conducted on the basis of the set of experiments with δ = 30%, θ = 11, and ρ = 1.8 g/cm3. It can be seen in Figure 9D that both the lateral and the longitudinal erosion rates were correlated positively with the upstream flow rate; each increased exponentially and dx/dt was >dy/dt, similar to the effect of θ.
Under the same external (inflow and channel) conditions, the erosion rate of a soil deposit is affected mainly by the soil structure. The resistance forces (e.g., the Coulomb force, van der Waals force, and capillary force) within soil are greater in material with higher content of fine particles, resulting in the reduction of the erosion rate. Similarly, as soil compactness increases, soil shear strength and erosion resistance are enhanced, also resulting in a reduced erosion rate. However, as shown in Figure 8B, decrease of the erosion rate in the lateral direction (dy/dx) was more evident, which is consistent with the findings of Osman and Throne (1988), who reported that the lateral retreat distance of a cohesive river bank decreases with the power function of the bulk density of the soil.
For soil deposits, the hydraulic force is the main factor that induces failure. The water shear and water flow power are generally used as indices that combine the inflow and slope conditions (Bagnold, 1977; Hairsine and Rose, 1992; Elliot and Laflen, 1993; Nearing et al., 1997; Wang et al., 1998; Zhang et al., 2003), as shown in the following equations:
where τ is the water power (Pa), γ = ρg (N/m3), ρ is the flow density (103 kg/m3), h is the flow depth (m), J is the hydraulic gradient, and v is the flow velocity (m/s).
It can be found from Figure 10 that the average erosion rate increases exponentially with water shear and water flow power, which is in accord with the aforementioned results.
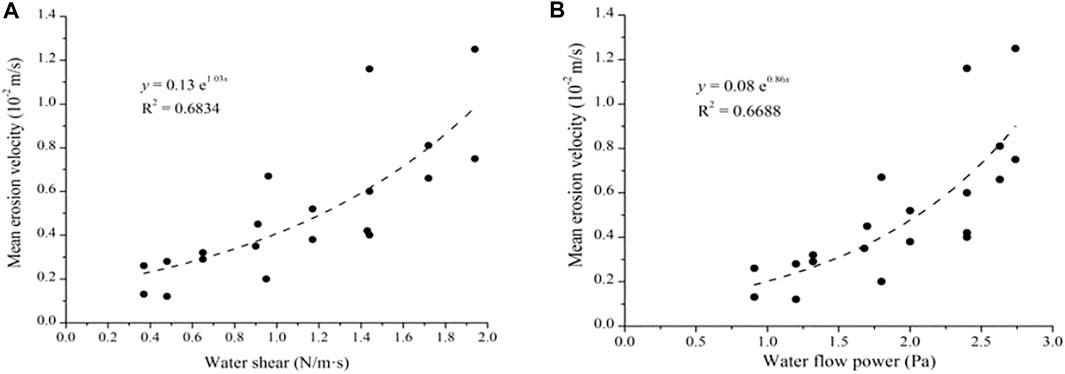
FIGURE 10. Relationship among mean erosion velocity and (A) water shear and (B) water flow power.
Coupling Effects of Influencing Factors
We investigated the coupling effects of influencing factors by conducting experiments with more than one variable to provide a reference for comparison with the effects of the individual factors.
(1) Fine Particle Content and Bulk Density
As both dy and dx always exhibited a linear positive relationship, we used the lateral retreat of the deposit body (dy/dx) to represent the erosion rate. It can be seen from Figure 11A that the erosion rate decreased with ρ for all values of δ, which is in accord with the aforementioned results. Multivariate nonlinear regression analysis was performed (Figure 11B, Eq. 7), which indicated that the effect of δ on the average erosion rate was much greater than that of ρ, as shown in the following equation:
where Eb is the erosion rate (10–2 m/s), and F and C represent the effects of δ and ρ, respectively.
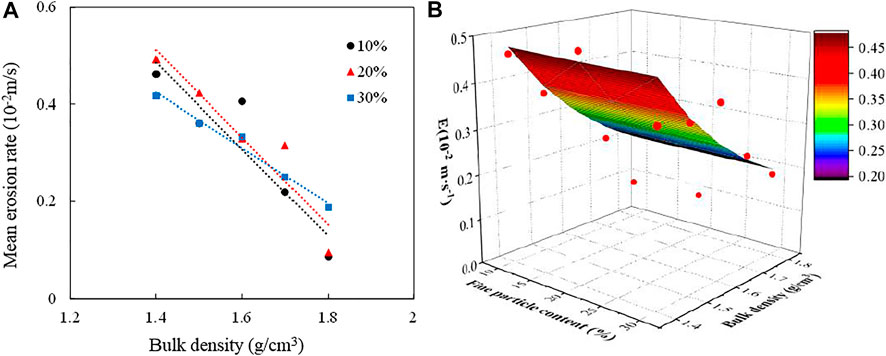
FIGURE 11. Relationship of the erosion rate with bulk density and fine particle content: (A) relationship between average erosion rate and bulk density with different values of fine particle content, and (B) multivariate nonlinear regression curve.
(2) Fine Particle Content and Slope
The relationship between the erosion rate (dy/dt) and δ was analyzed under conditions of different θ. It was found that the trend varied with respect to θ. For example, in the experiment with θ = 3°, the erosion rate increased with δ. In the experiment with θ = 7°, the erosion rate first increased and then decreased with δ. However, in the experiment with θ = 11°, the erosion rate decreased as δ increased. Additionally, the standard deviation under the condition of θ = 7° was the smallest among all the experiments. Therefore, it is considered that θ = 7° is the critical value above and below which δ plays a smaller and greater role, respectively, in relation to the erosion rate (Figure 12).
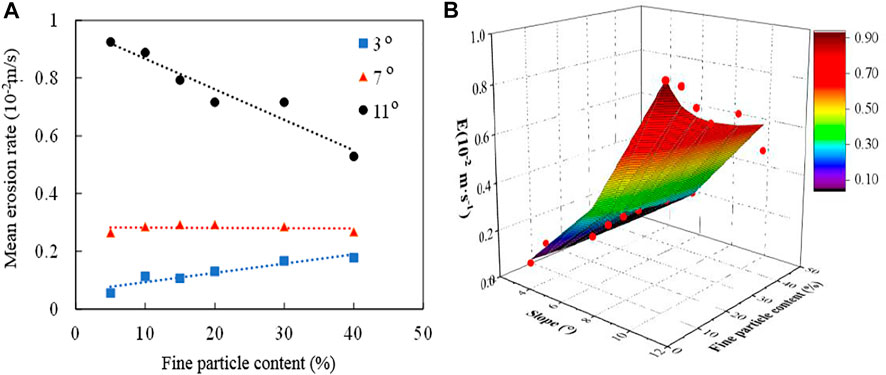
FIGURE 12. Relationship of the erosion rate with slope and fine particle content: (A) relationship between average erosion rate and fine particle content with different values of slope, and (B) multivariate nonlinear regression curve.
On the basis of the above, we divided the experimental slope into two sections and determined the fitted relationships between the erosion rate and δ for each section. Significant correlation was found in the formulas of the erosion rate fitted by δ and θ (Eq. 8), in which S represents the effects of θ. The equations indicate that the effect of θ is much more significant than that of δ:
(3) Bulk Density and Inflow Discharge
The results regarding the erosion rate (dy/dt) of the experiments coupling δ and Q are investigated. In the cases with δ = 1.4 and 1.8 g/cm3, the average erosion rate increased markedly with the increase of Q. The results of multiple nonlinear regression analysis are shown in Figure 13 and Eq. 9. It is indicated that the effect of δ had slightly more influence than Q on the average erosion rate; however, the values are of the same order of magnitude and very similar, as shown in the following equation:
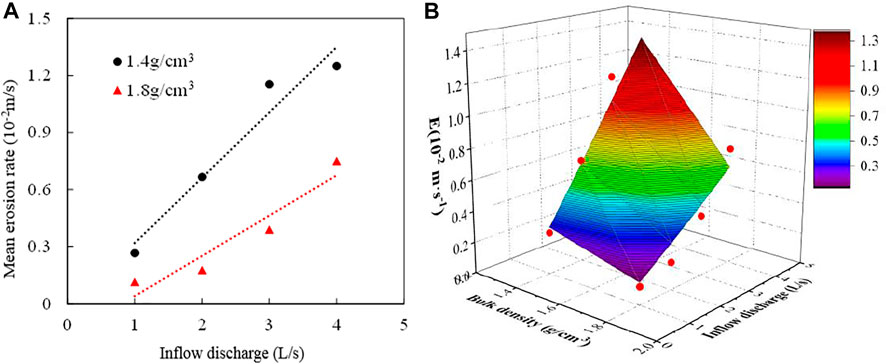
FIGURE 13. Relationship of the erosion rate with inflow discharge and bulk density: (A) relationship between the average erosion rate and inflow discharge with different values of bulk density, and (B) a multivariate nonlinear regression curve.
(4) Bulk Density and Slope
The results regarding the erosion rate (dy/dt) of the experiments coupling δ and θ are also investigated. In the cases with δ = 1.4 and 1.8 g/cm3, the average erosion rate increased markedly with θ. The results of multiple nonlinear regression analysis are shown in Figure 14 and Eq. 10. It is also indicated that the effect of the δ had slightly more influence than that of θ on the average erosion rate; however, the values are of the same order of magnitude and very similar, as shown in the following equation:
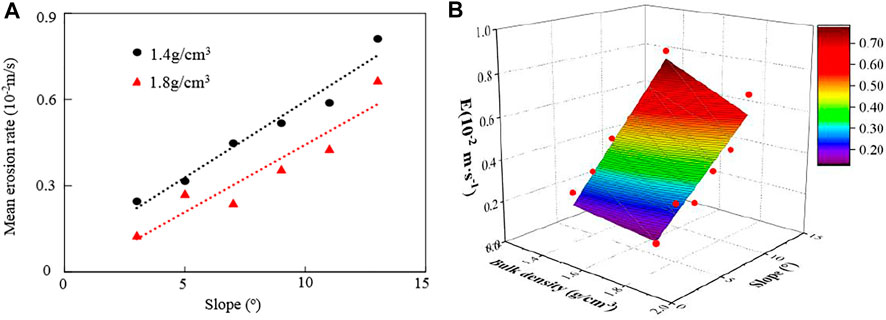
FIGURE 14. Relationships of the erosion rate with slope and bulk density: (A) relationship between the average erosion rate and slope with different values of bulk density, and (B) a multivariate nonlinear regression curve.
Estimation of Erosion Time
Surface runoff can create a substantial scouring effect on slope deposits. As mentioned above, the lateral erosion process of a slope deposit body can be summarized as repeated episodes of runoff scouring of the toe of the deposit, deposit failure, and entrainment of the failure body by runoff. As the failed material generally falls rapidly into the channel, the duration of the stage of failure is short. As such failures are temporally intermittent, the repetition of such a process causes continuous erosion of the deposit body in both the flow and the lateral directions.
The empirical formula for calculating the lateral scour rate, based on laboratory experiments by Hooke (1975), was used to estimate the runoff scouring time before the first failure:
where Ge is the scour rate (103 g/m2/s), τ is the channel shear ptforce (N/m2), τc is the initial critical shear stress of the soil (N/m2), τ − τc is the residual shear force (N/m2), and Geo is the erosion rate when the soil is in the critical state of initiation of movement (kg/m2/s), and the following empirical formula is available:
where C is the lateral scour coefficient (m), the empirical value of which is recommended as 2.23 × 10⁻² m by Osman and Throne (1988), and k is a constant (=1.3).
where dB/dt represents the distance of lateral erosion per unit time (m/s) and γb is the soil bulk density (KN/m3). The time required for lateral erosion of a deposit body can therefore be calculated as follows:
where W is the deposit width (m).
For the second stage of the process, that is, entrainment of the failure body by channel runoff, Wang et al. (1998) conducted many tests of sediment scour, and proposed that the scour rate is proportional to the water flow power and depends on particle size and bulk density. The proposed formula for the scour rate is as follows:
where Er is the scour rate (103 g/m2/s); γs and γ represent the density of the soil particles and that of the inflow water runoff (kg/m3); J is the flow slope; d is the average sediment diameter (m), and d50 is traditionally used; g is gravitational acceleration (m/s2); and U is the average flow velocity (m/s). The time required for a single deposit failure body to be transported by runoff can be estimated using Eq. 14, and the total time for stage two can be expressed as follows:
where Trx and Tr represent the time required for the xth and total failure of the body (s), respectively; ρs is the density of the soil (103 kg/m3); and Vx is the volume of the xth failure body (m3):
As recorded in the experiments, the entire failure process is actually a failure sequence that can be regarded as repetitions of two such stages. Therefore, the total failure time (T) required for complete erosion of the deposit body can be cumulated according to the recorded failure sequences as follows:
Given the complexity of the collapses as part of the widening process of lateral erosion, the widening model and estimation method proposed in this article represent a simple and preliminary generalization. Comparison of the calculated and the actual measured erosion time is presented in Figure 15. The strong correlation between the two indicates that the estimated value is largely in agreement with the actual value, suggesting the reasonableness of the proposed methods for the estimation of the duration required for erosion of the lateral slope deposit.
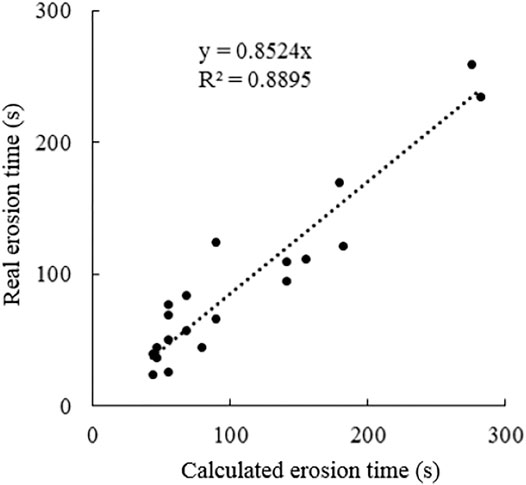
FIGURE 15. Relationship between theoretical erosion duration and actual erosion duration.
Discussion
Using flume-based experiments, this work investigated the effect of factors that influence the erosion rate of a slope deposit along a channel. Despite certain limitations that included the selection of the deposit material and the influence of the experimental dimensions, the general impact of various influencing factors on the failure process was determined.
It is known that the average rate of lateral erosion of gully bank deposits is affected by the nature of the soil (compactness and fine particle content) and external hydrodynamic conditions (slope and inflow), but each of these factors has a different level of influence on the average erosion rate. On the basis of our analyses, the effect of fine particle content was established as being less important than that of the other three factors. Of the remaining three factors, the impact of compactness, which was represented by bulk density in our analyses, was found to be greatest in the form of the exponent in the fitted relationships, although it was of the same order of magnitude as that of slope and inflow discharge.
The comparative importance of the influencing factors was also reflected in the failure process observed in the experiments. Failures can be categorized as collapses or slides according to the Varnes classification (Varnes, 1978; Hungr et al., 2001, 2014). Although the use of the terminology here might differ slightly from that adopted in reference to field collapses and slides, the underlying mechanisms are similar in that a collapse (slide) is dominated by tensile (shear) forces. It is known that external conditions (e.g., inflow discharge and slope) only affect the time of failure, that is, the erosion rate, whereas soil conditions (e.g., bulk density and fine particle content) affect the failure type. The principal failure mode of a loose deposit tends to be sliding, whereas that of a dense deposit primarily collapses following the appearance of vertical cracks. On the basis of the experiment, the threshold of demarcation between the two modes has been determined as approximately 1.6 g/cm3. Moreover, a soil body with low content of fine particles is more susceptible to large-scale overall slip, and the particles are dispersed. Our experiments indicated that a fine particle content of 30% is the threshold value between the two failure modes. This is in agreement with the theory, which suggests that when the content of fine particles is <25%, the soil structure is composed largely of coarse particles without fine particles filling the pores between the coarse particles (Vallejo and Mawby, 2000).
Another factor also considered to influence the erosion process is the blockage rate (W*), which is expressed as the ratio of the width of the deposit (W) to the channel width (WC). In this study, this ratio was considered as 0.4, 0.6, 0.7, 0.8, and 1.0 under the conditions of ρ = 1.5 g/cm3, θ = 7°, δ = 20%, and Q varying as 1, 2, 3, and 4 × 10⁻³ m3/s. The details of the set of experiments showed that W* had no substantial effect on the erosion time or the erosion rate under the experimental conditions with the same total deposit volume (Table 2). Moreover, the failure type showed no obvious difference according to the experiment records, whereas the effect of the total deposit volume was much more influential.
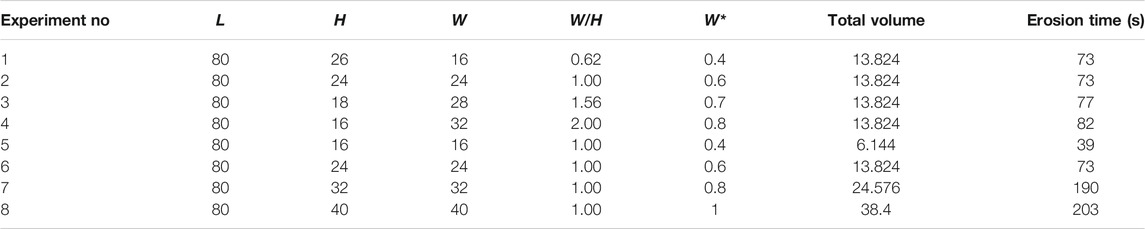
TABLE 2. The experiment set and results considering the blockage rate W*.
Conclusion
Slope deposits, typically observed along channels in many headwater tributaries, represent an important source of material for the initiation and development of debris flows. This type of deposit generally fails under the effect of scour by surface runoff. This study investigated the relative influence of internal factors (compactness and fine particle contents) and external factors (inflow discharge and channel slope) on the rate of erosion of a deposit body in an experimental flume. Despite certain experimental limitations, the main findings can be summarized as below.
The process of soil deposit failure is the result of combined action of hydrodynamic and gravitational forces on the soil. The process consists of two stages: runoff erosion toward the toe of the deposit body and soil failure owing to gravity. The erosion rate in both the direction of the flow and the lateral direction exhibited positive correlation with all influencing factors, although that of the former was slightly stronger. Spatially, the erosion rate was distributed unevenly across the deposit; the highest value occurred at the section close to the middle of the deposit, on the upstream face. Temporally, the erosion rate decreased exponentially.
Overall, the average erosion rate decreased with bulk density, and increased with inflow discharge and channel slope. A channel bed slope of 7° was determined as the critical slope in the relationship between the erosion rate and fine particle content. When the bottom bed slope was <7°, the average erosion rate increased with fine particle content, whereas the relationship exhibited a decreasing trend when the bottom bed slope was >7°. Multivariate nonlinear regression analysis suggested that the effect of fine particle content was much smaller than that of the other three factors. Although the bulk density of the deposit imposed the most notable effect, it was of the same order of magnitude as that of inflow discharge and channel slope. The blockage rate was also considered in the experiments; however, the results indicated that it had no significant effect on the erosion rate and failure type in comparison with the other factors.
The failure process can be summarized as repeated runoff scouring of the toe of the deposit, deposit failure, and entrainment of the failure body by runoff. As the second stage is very rapid, estimation of the total time required for a complete lateral erosion process is proposed as the summation of the durations of the first and third stages, and validation of the calculation suggested its reasonability.
Data Availability Statement
The original contributions presented in the study are included in the article/Supplementary Material; further inquiries can be directed to the corresponding author.
Author Contributions
YG: contributions to the conception, design of the work; drafting and revising the manuscript, and provides the finance support. XG: contributions to the conception, design of the work; analyzing the data, drafting and revising the manuscript. MZ: contributions to the experiments and initial data analysis. HY: contributions to the experiments and initial data analysis.
Conflict of Interest
MZ was employed by the China Railway Changjiang Transport Design Group Co. Ltd.
The remaining authors declare that the research was conducted in the absence of any commercial or financial relationships that could be conducted as a potential conflict of interest.
Acknowledgments
This research is supported by the NSFC (41790432 and 41977257), Strategic Priority Research Program of the CAS (XDA23090203), and Western Light of Young Scholars, CAS. We thank James Buxton MSc from Liwen Bianji, Edanz Group, China (www.liwenbianji.cn/ac), for editing the English text of this manuscript.
References
Annandale, G. W. (2006). Scour Technology-Mechanics and Engineering Practice. New York: McGraw-Hill. doi:10.1061/40803(187)167
ASCE Task CommitteeHydraulicBank mechanicsModeling of river bank width adjustment (1998). River Width Adjustment. II: Modeling. J. Hydraulic Eng. 124 (9), 903–917.
Bagnold, R. A. (1977). Bed Load Transport by Natural Rivers. Water Resour. Res. 13, 303–312. doi:10.1029/wr013i002p00303
Bardou, E., and Jaboyedoff, M. (2008). Debris Flows as a Factor of Hillslope Evolution Controlled by a Continuous or a Pulse Process? Geol. Soc. Lond. Spec. Publications 296, 63–78. doi:10.1144/sp296.5
Brenna, A., Surian, N., Ghinassi, M., and Marchi, L. (2020). Sediment-water Flows in Mountain Streams: Recognition and Classification Based on Field Evidence. Geomorphology 371, 107413. doi:10.1016/j.geomorph.2020.107413
Briaud, J.-L. (2008). Case Histories in Soil and Rock Erosion: Woodrow Wilson Bridge, Brazos River Meander, Normandy Cliffs, and New Orleans Levees. J. Geotech. Geoenviron. Eng. 134, 1425–1447. doi:10.1061/(asce)1090-0241(2008)134:10(1425)
Chang, D. S., Zhang, L. M., Xu, Y., and Huang, R. Q. (2011). Field Testing of Erodibility of Two Landslide Dams Triggered by the 12 May Wenchuan Earthquake. Landslides 8 (3), 321–332. doi:10.1007/s10346-011-0256-x
Couper, P. R. (2004). Space and Time in River Bank Erosion Research: A Review. Area 36 (4), 387–403. doi:10.1111/j.0004-0894.2004.00239.x
Cui, P. (1992). Studies on Condition and Mechanism of Debris Flow by Means of experiment. Chin. Sci. Bull. 37 (9), 759–763.
Cui, P., Zhou, G. G. D., Zhu, X. H., and Zhang, J. Q. (2013). Scale Amplification of Natural Debris Flows Caused by Cascading Landslide Dam Failures. Geomorphology 182, 173–189. doi:10.1016/j.geomorph.2012.11.009
Cui, Y.-F., Zhou, X.-J., and Guo, C.-X. (2017). Experimental Study on the Moving Characteristics of fine Grains in Wide Grading Unconsolidated Soil under Heavy Rainfall. J. Mt. Sci. 14 (3), 417–431. doi:10.1007/s11629-016-4303-x
Cui, Y., Jiang, Y., and Guo, C. (2019). Investigation of the Initiation of Shallow Failure in Widely Graded Loose Soil Slopes Considering Interstitial Flow and Surface Runoff. Landslides 16, 815–828. doi:10.1007/s10346-018-01129-9
Dapporto, S., Rinaldi, M., and Casagli, N. (2001). Failure Mechanisms and Pore Water Pressure Conditions: Analysis of a riverbank along the Arno River (Central Italy). Eng. Geol. 61 (4), 221–242. doi:10.1016/s0013-7952(01)00026-6
Darby, S. E., and Thorne, C. R. (1996). Development and Testing of Riverbank-Stability Analysis. J. Hydraulic Eng. 122 (8), 443–454. doi:10.1061/(asce)0733-9429(1996)122:8(443)
Elliot, W. J., and Laflen, J. M. (1993). A Process-Based Rill Erosion Model. Trans. ASAE 36 (1), 35–72. doi:10.13031/2013.28315
Guo, X., Cui, P., Li, Y., Zou, Q., and Kong, Y. (2016). The Formation and Development of Debris Flows in Large Watersheds after the 2008 Wenchuan Earthquake. Landslides 13 (1), 25–37. doi:10.1007/s10346-014-0541-6
Guo, X., Li, Y., Cui, P., Yan, H., and Zhuang, J. (2020). Intermittent Viscous Debris Flow Formation in Jiangjia Gully from the Perspectives of Hydrological Processes and Material Supply. J. Hydrol. 589, 125184. doi:10.1016/j.jhydrol.2020.125184
Hairsine, P. B., and Rose, C. W. (1992). Modeling Water Erosion Due to Overland Flow Using Physical Principles: 2. Rill Flow. Water Resour. Res. 28, 245–250. doi:10.1029/91wr02381
Hanson, G. J., and Simon, A. (2001). Erodibility of Cohesive Streambeds in the Loess Area of the Midwestern USA. Hydrol. Process. 15 (1), 23–38. doi:10.1002/hyp.149
Hooke, R. (1975). Distribution of Sediment Transport and Shear Stress in a Meander. Bend. J. Geol. 83 (5), 543–565. doi:10.2307/30061053
Hungr, O., Evans, S. G., Bovis, M. J., and Hutchinson, J. N. (2001). A Review of the Classification of Landslides of the Flow Type. Environ. Eng. Geosci. 7 (3), 221–238. doi:10.2113/gseegeosci.7.3.221
Hungr, O., Leroueil, S., and Picarelli, L. (2014). The Varnes Classification of Landslide Types, an Update. Landslides 11 (2), 167–194. doi:10.1007/s10346-013-0436-y
Jason, P. J., and Raymond, T. (2006). Hydraulic Erosion of Cohesive Riverbanks. Geomorphology 76, 193–206. doi:10.1016/j.geomorph.2005.11.003
Jiang, X., Wörman, A., Chen, P., Huang, Q., and Chen, H. (2020). Mechanism of the Progressive Failure of Non-cohesive Natural Dam Slopes. Geomorphology 363, 107198. doi:10.1016/j.geomorph.2020.107198
Khosravi, A., and Azhini, M. (2007). Modelling River-Bank-Erosion Processes and Mass Failure Mechanisms: Progress towards Fully Coupled Simulations. Dev. Earth Surf. Process. 11 (7), 213–239. doi:10.1016/S0928-2025(07)11126-3
Knapen, A., Poesen, J., Govers, G., Gyssels, G., and Nachtergaele, J. (2007). Resistance of Soils to Concentrated Flow Erosion: A Review. Earth-Sci. Rev. 80, 75–109. doi:10.1016/j.earscirev.2006.08.001
Lavelle, J. W., and Mofjeld, H. O. (1987). Do Critical Stresses for Incipient Motion and Erosion Really Exist? J. Hydraulic Eng. 113 (3), 370–385. doi:10.1061/(asce)0733-9429(1987)113:3(370)
Li, Y., Zhou, X., Su, P., Kong, Y., and Liu, J. (2013). A Scaling Distribution for Grain Composition of Debris Flow. Geomorphology 192, 30–42. doi:10.1016/j.geomorph.2013.03.015
Li, Y., Huang, C., Wang, B., Tian, X., and Liu, J. (2017). A Unified Expression for Grain Size Distribution of Soils. Geoderma 288, 105–119. doi:10.1016/j.geoderma.2016.11.011
Nachtergaele, J., and Poesen, J. (2002). Spatial and Temporal Variations in Resistance of Loess-Derived Soils to Ephemeral Gully Erosion. Eur. J. Soil Sci. 53, 449–463. doi:10.1046/j.1365-2389.2002.00443.x
Nagata, N., Hosoda, T., and Muramoto, Y. (2000). Numerical Analysis of River Channel Processes with Bank Erosion. J. Hydraul. Eng. 126 (4), 243–252. doi:10.1061/(asce)0733-9429(2000)126:4(243)
Nearing, M. A., Norton, L. D., Bulgakov, D. A., Larionov, G. A., West, L. T., and Dontsova, K. M. (1997). Hydraulics and Erosion in Eroding Rills. Water Resour. Res. 33 (4), 865–876. doi:10.1029/97wr00013
Osman, A. M., and Thorne, C. R. (1988). Riverbank Stability Analysis. I: Theory. J. Hydraulic Eng. 114 (2), 134–150. doi:10.1061/(asce)0733-9429(1988)114:2(134)
Rinaldi, M., Mengoni, B. E., Luppib, L., Darby, S. E., and Mosselman, E. (2008). Numerical Simulation of Hydrodynamics and Bank Erosion in a River bend. Water Resour. Res. 44, 1–17. doi:10.1029/2008wr007008
Shields, A. (1936). Application of Similarity Principles and Turbulence Research to Bed-Load Movement. Rep. No. 167. Pasadena, CA: California Institute of Technology.
Takahashi, T. (1978). Mechanical Characteristics of Debris Flow. J. Hydr. Div. 104, 1153–1169. doi:10.1061/jyceaj.0005046
Vallejo, L. E., and Mawby, R. (2000). Porosity Influence on the Shear Strength of Granular Material-clay Mixtures. Eng. Geology. 58, 125–136. doi:10.1016/s0013-7952(00)00051-x
Varnes, D. (1978). “Slope Movement Types and Processes,” in Landslides, Analysis and Control, Special Report 176: Transportation Research Board. Editors RL Schuster, and RJ Krizek (Washington, DC: National Academy of Sciences), 11–33.
Wang, Y., Cui, P., Wang, Z., and Liang, S. (2017). Threshold Criterion for Debris Flow Initiation in Seasonal Gullies. Int. J. Sediment Res. 32, 231–239. doi:10.1016/j.ijsrc.2017.03.003
Wang, Z., Huang, J., and Su, D. (1998). River Channel Scour and Scour Rate of clear Water Flow. J. Sediment Res. 42 (1), 3–13.
Xiangang, J., Jiahua, H., Yunwei, W., Zhipan, N., Fenghui, C., Zuyin, Z., et al. (2018). The influence of Materials on the Breaching Process of Natural Dams. Landslides 15, 243–255. doi:10.1007/s10346-017-0877-9
Yalin, M. S., and Karahan, E. (1979). Inception of Sediment Transport. J. Hydr. Div. 105 (11), 1433–1443. doi:10.1061/jyceaj.0005306
Zhang, G.-H., Liu, B.-Y., Liu, G.-B., He, X.-W., and Nearing, M. A. (2003). Detachment of Undisturbed Soil by Shallow Flow. Soil Sci. Soc. America J. 67, 713–719. doi:10.2136/sssaj2003.0713
Zhang, L., Peng, M., Chang, D., and Xu, Y. (2016). Dam Failure Mechanisms and Risk Assessment. Singapore: John Wiley & Sons. doi:10.1002/9781118558522
Zhou, G. G. D., Cui, P., Chen, H. Y., Zhu, X. H., Tang, J. B., and Sun, Q. C. (2013). Experimental Study on Cascading Landslide Dam Failures by Upstream Flows. Landslides 10, 633–643. doi:10.1007/s10346-012-0352-6
Zhou, G. G. D., Cui, P., Zhu, X. H., Tang, J. B., Chen, H. Y., and Sun, Q. C. (2015). A Preliminary Study of the Failure Mechanisms of Cascading Landslide Dams. Int. J. Sediment Res. 30 (3), 223–234. doi:10.1016/j.ijsrc.2014.09.003
Zhu, H., and Zhang, L. M. (2016). Field Investigation of Erosion Resistance of Common Grass Species for Soil Bioengineering in Hong Kong. Acta Geotech. 11 (5), 1047–1059. doi:10.1007/s11440-015-0408-6
Keywords: lateral deposit, soil failure, erosion rate, runoff, slope
Citation: Ge Y, Guo X, Zhan M and Yan H (2021) Erosion Rate of Lateral Slope Deposit Under the Effects of Different Influencing Factors. Front. Earth Sci. 9:670087. doi: 10.3389/feart.2021.670087
Received: 20 February 2021; Accepted: 27 May 2021;
Published: 18 June 2021.
Edited by:
Jie Dou, China University of Geosciences, ChinaCopyright © 2021 Ge, Guo, Zhan and Yan. This is an open-access article distributed under the terms of the Creative Commons Attribution License (CC BY). The use, distribution or reproduction in other forums is permitted, provided the original author(s) and the copyright owner(s) are credited and that the original publication in this journal is cited, in accordance with accepted academic practice. No use, distribution or reproduction is permitted which does not comply with these terms.
*Correspondence: Xiaojun Guo, YWFyb25ndW9AaW1kZS5hYy5jbg==; Bin Yu, eXViaW4wOEBjZHV0LmNu