 Dong-yang Li
 De-feng Zheng2*
 Ting-kai Nian
- 1State Key Laboratory of Coastal and Offshore Engineering, School of Civil Engineering, Dalian University of Technology, Dalian, China
- 2Liaoning Key Laboratory of Physical Geography and Geomatics, School of Geography, Liaoning Normal University, Dalian, China
- 3Zhejiang Huadong Construction Co., Ltd., PowerChina Huadong Engineering Co., Ltd., Hangzhou, China
An accurate investigation of the landslide dam breach process is crucial for the understanding the breach mechanism and disaster prediction. However, the numerical research on the landslide dam breach process to date is rarely reported, especially regarding the soil-water flow coupling effect incorporated in the erosion process. This paper presents a numerical investigation on the longitudinal breach process of landslide dams via a coupled discrete element method (DEM) and computational fluid dynamics (CFD) with the volume of fluid (VOF). Moreover, a virtual sphere model is proposed to overcome the computational instability caused by the particle size approaching the mesh size. The accuracy and validity of the improved coupled method are verified using a series of single particle sedimentation cases. By employing this method, the longitudinal breach process of landslide dams featuring different materials and hydrodynamic conditions has been simulated. It is found to satisfactorily reproduce the longitudinal breach process of landslide dams including surface flow erosion, backward erosion, head-cut erosion, and water and sediment rebalance or complete breach. The effects of the inflow discharges and dam materials on the erosion process are systematically resolved. The breach flow can cause the rotation trend of particles and lead to the increase of tangential contact force at the initial stage of the dam breaching. During the breach process, both the strength and density of the force chain continue to attenuate. The results obtained from the improved coupled DEM-CFD simulations can reasonably explain the particle-fluid interaction mechanisms, physical and morphological evolution and breach process at both macroscopic and mesoscopic scales.
Introduction
Landslide dams, presented as natural dams formed by landslides blocking the river channels, are widely distributed in mountainous regions all over the world (Schuster and Costa, 1986; Korup, 2004; Nian et al., 2018). The natural lake formed upstream of the landslide dam is called the barrier lake. As a natural dam without a spillway to control the reservoir capacity of the barrier lake, it has a high risk of failure that may cause outburst floods with potentially catastrophic consequences in downstream areas (Casagli et al., 2003; Chang et al., 2011; Wu et al., 2020). For example, the landslide dam on the Dadu River in 1786 broke 10 days after forming and caused severe floods that killed more than 100,000 people (Dai et al., 2006). Recently, a huge landslide dam (called Baige landslide dam) was formed on the Jinsha River in China on October 11, 2018, and created a barrier lake with a maximum reservoir capacity of more than 200 million m3 (Ouyang et al., 2019). Two days later, the breach of the Baige landslide dam occurred, affecting more than 100,000 people and causing up to 15 billion economic losses. Therefore, there is an urgent need to deepen the understanding the landslide dam breach mechanism that is essential for breaching prediction and disaster assessment (Jiang et al., 2020).
The research on the breach mechanism of the landslide dam has received considerable attention in recent years. Model experiments in the laboratory and field are currently the most common approaches for investigating the breach process of landslide dams. Many researchers carried out a series of experiments to explore the breach process of landslide dams under different geomorphological conditions, hydrodynamic conditions and dam geometries mainly focusing on the breach flow discharge, evolution of breach morphology, and erosion characteristics (Davies et al., 2007; Cao et al., 2011; Chen et al., 2015; Xiangang et al., 2018; Wang et al., 2018; Jiang, 2019; Zhou et al., 2019). The breach mechanism of landslide dams was discussed based on macroscopic observation, and the primary factors affecting the landslide dam breach process were identified (such as inflow discharge, barrier lake volume, dam material and downstream slope angle). While experiment investigations of the landslide dam breach mechanism are still challenging due to the limitations of the experimental conditions and measurement methods, and thus may not be able to fully reveal the microscopic characteristics (Cao et al., 2011; Wang et al., 2018).
The mathematical models are currently another kind of methods to investigate the landslide dam breach issue. In general, they can be categorized as the parametric model and physically based model (ASCE/EWRI Task Committee on Dam/Levee Breaching, 2011). The parametric models are mainly based on the statistical data of landslide dam failure events, and breach parameters are estimated from empirical formulas without any breach process calculations (Zhong et al., 2016). Besides, these models can only provide discrete characteristic values such as failure time and peak breach flow (Xu et al., 2009; Peng and Zhang, 2012; Sattar, 2014). The physically based models are developed based on the hydrodynamic and erosion process during the landslide dam breach that is widely used in practice (Chang and Zhang, 2010; Zhong et al., 2018, 2020; Zhang et al., 2019). However, these models bear a considerable degree of uncertainty as the longitudinal evolution mode and erosion development process are simplified and pre-defined (Wang et al., 2015; Zhong et al., 2020). Particularly, the landslide dam breach involves complicated interactive processes between breach flow, breach morphology and the multi-scale particle transport, the mathematical models can not enough describe the soil-water flow coupling effect incorporated in the erosion process. To date, the understanding of the breach mechanism has still remained poor (Bovis and Jakob, 2000; Cao et al., 2011; Jiang et al., 2020).
This article aims to provide new insights of the breach mechanism of landslide dams through numerical simulation. To achieve this goal, a coupled discrete element method (DEM) and computational fluid dynamics (CFD) with the volume of fluid (VOF) was used to model the longitudinal breach process of landslide dams, and a virtual sphere was proposed to overcome the computational convergence caused by the limitation of particle and mesh cell size. Then, the dam morphological evolution, force evolution and the influence of hydrodynamic conditions and dam materials on the breach process are investigated systematically, and the longitudinal breach mechanism of landslide dams is discussed at both macroscopic and mesoscopic scales. The erosion process at the dam crest as well as the capability of the improved coupled DEM-CFD modeling of landslide dam breach is also discussed.
Improved Coupled DEM-CFD Method for Landslide Dam Breach Simulation
Currently, the coupled methods of continuous and discontinuous seem to facilitate modeling the interaction of soil and water flow. In this regard, the coupled DEM and CFD numerical method has already been used to investigate the underwater sedimentation of the landslide dam and seepage failure mechanism of dam material (Zhao et al., 2017; Shi et al., 2018; Nian et al., 2021). However, it is noted that the traditional DEM-CFD model is difficult to be directly applied in the simulation of the landslide dam breach process due to the shortcoming in describing the evolution of the free river surface. Besides, the critical size ratio of particle to mesh cell also limits the modeling of coarse particles in dam material and the accurate calculation of the fluid domain.
In this section, an improved coupled DEM-CFD method is developed to simulate the longitudinal breach process of landslide dams, and a virtual sphere model is proposed as a new local porosity calculation method to overcome the limitation of the particle and mesh cell size. The granular landslide dam material is modeled by the DEM, the fluid domain is described by the Navier-Stokes equation to be solved by the CFD, and the free fluid surface is simulated by the VOF model by taking into account the presence of the interface between fluid phases. The derivation of the governing equations, calculation of coupling forces, and realization of the virtual sphere model are described in detail in the following sections.
Governing Equations for the Improved Coupled DEM-CFD Method
For the particle in the fluid, the governing equations for the translational and rotational motions of a single particle are determined according to Newton’s second law and can be expressed as (Cundall and Strack, 1980):
Where mi is the mass of particle i, vi, and ωi are the translation and angular velocities of particle i, respectively. Fij is the contact force between particle i and particle j, respectively. Ff is the particle-fluid interaction force acting on particle i. rc is the distance from the center of the particle to the contact point and Mij is the rolling resistant moment. The Hertz-Mindlin contact model is adopted to describe the interaction behavior in normal and tangential directions (Utili et al., 2015; Li et al., 2020):
Where Fn and are the normal force and the normal damping force, while Ft and are the tangential force and the tangential damping force, δn and δt are the normal overlap and the tangential overlap, and are the normal component and tangential component of the relative velocity, E∗, R∗, and m∗ are the equivalent Young’s Modulus, the equivalent radius and the equivalent mass, respectively. Sn is the normal stiffness and St is the tangential stiffness. μr is the coefficient of rolling friction and Ri is the distance of the contact point from the center of mass.
The governing equation of fluid flow considering the presence of particles is as follows (Anderson and Jackson, 1967):
Where u is the fluid velocity, ρf is the density of the fluid, μf is the fluid viscosity, p is the fluid pressure, g is the gravity acceleration. The terms on the right side of Equation (9) represent the pressure gradient, stress, gravity, and particle-fluid interaction force, respectively. fpf in Equation (9) can be related to Ff in Equation (1) with, with Vcell being the volume of a CFD mesh cell. ε is the local porosity that is used to represent the influence of particles on the fluid calculations. Fs = σκ∇α1 is the surface tension force, with σ being the surface tension and κ being the local curvature at the interface.
In this research, based on the multiphase fluid theory in the CFD, the VOF model is introduced to describe the dynamic behaviors of the barrier lake and breach flow with free fluid surface evolution (Hirt and Nichols, 1981). In each mesh cell, the volume fraction of all the fluid phases is ε, for which, the volume fraction of the primary phase (e.g., water) is α1, while the volume fraction of the secondary phase (e.g., air) is α2 (α2 = 1−α1). Hence, for the fluid phase is fully occupied by water, α1 = 1, for the fluid phase is full of air, α1 = 0. The case of 0 < α1 < 1 normally refers to the presence of a free fluid surface. The free surface motion between the two phases can be tracked by solving the continuity equation of the secondary phase volume fraction:
At the interface of air and water in the VOF model, the characteristics of fluid density ρf and viscosity μf in Equation (9) are derived from the characteristic of each phase by linear interpolation with the volume fraction:
Particle-Fluid Interaction
The interaction force between particles and fluid mainly includes the buoyant force, drag force, lift force, and virtual mass force (Zhu et al., 2007). The buoyant force Fb, drag force Fd, and lift force Fl are generally considered significant in the sediment entrainment problem (Li and Zhang, 2018; Ibrahim and Meguid, 2020) and are introduced to describe the particle-fluid interactions in this research.
The buoyant force Fb acting on the particle under consideration can be calculated by:
Where Vp is the volume of the particle.
The drag force is caused by the viscous shearing effect of fluid, and is induced by the relative motion between particle and fluid. The Di Felice drag force model (Di Felice, 1994) is used herein to define the drag force:
Where is the drag force coefficient, d is the diameter of the particle, v is the velocity of the particle, is the corrective coefficient and is the particle Reynolds number.
The lift force accounts for the rotational movement of particles, and the Saffman lift force FlS (Saffman, 1965) and Magnus lift force FlM (Rubinow and Keller, 1961) are both considered in this research. Equations to calculate these forces are given as follow:
Calculation of Local Porosity for Coarse Dam Material
In the locally averaged DEM-CFD method, the local porosity ε plays a crucial role in the solution of fluid governing equations and the calculation of particle-fluid interaction. The calculation of porosity in previous researches is to directly calculate the volume occupied by particles in a single fluid mesh cell [in the central model, the particle volume is assigned to the fluid grid where the center of mass is located, while in the divided model, the particle volume is divided according to the actual position of the particle (Kloss et al., 2012; Zhao and Shan, 2013)]. In either way, the fluid domain would be discontinuous and cause numerically incorrect results when the particle size approaches the minimum fluid mesh cell size. In 3D coupled models, the size ratio of the fluid cell to particle diameter was suggested keeping not less than 4 to keep the accuracy of the interaction calculation (Zhao et al., 2014). For the simulation of landslide dam material with non-negligible coarse particles, a larger mesh cell size would force to be used that is contrary to the requirement of accurate fluid domain calculation.
To overcome the limitation of the size ratio of the fluid cell to dam material, Shi et al. (2018) adopted a method of cluster element generation to replace coarse particles with fine particle clusters. But this would lead to volume errors of the replaced large particles. In this research, based on the porous cube method (Link et al., 2005), an alternative way to calculate local porosity, the virtual sphere model, is presented. As shown in Figure 1, for coarse particles with a diameter greater than a quarter of the mesh cell size (represented by a solid circle), the local porosity calculation is based on the larger mesh cell range (represented by colored cells) defined by the virtual sphere (represented by dotted circles). The virtual sphere has the same centroid as the real particle, and the diameter is 4 times the real particle diameter. The volume of the real particles is equally divided into the related mesh cells involved in the local porosity calculation:
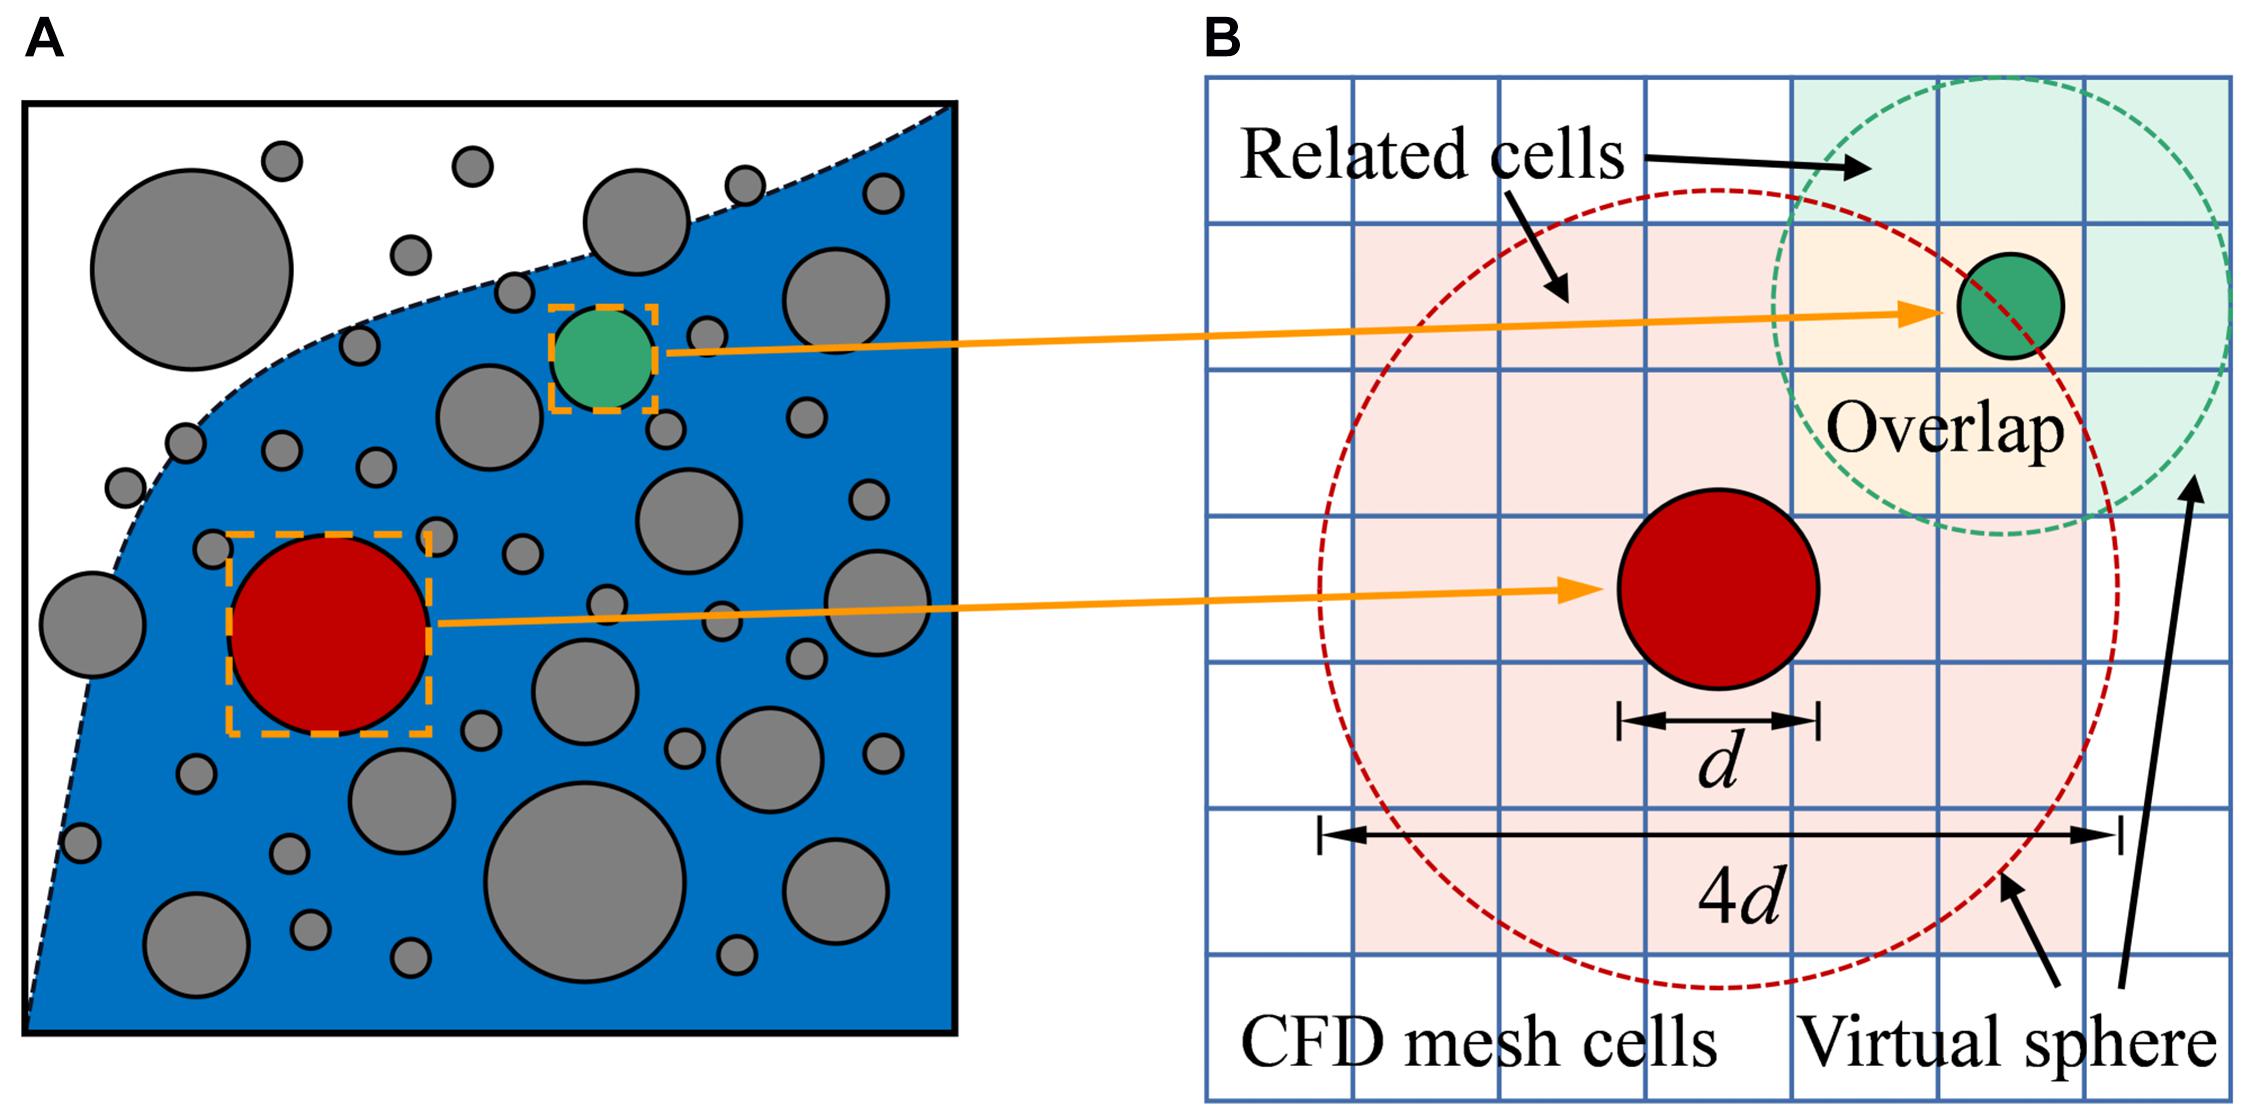
Figure 1. Schematic of the virtual sphere model. (A) Particle-fluid system in coupled DEM-VOF with free fluid surface and coarse particles. (B) Example for the local porosity calculation of coarse particles.
Where φVS,i is the volume contributed by particle i to a related mesh cell participating in the local porosity calculation, Vp is the actual particle volume and VVS is the volume of all related mesh cells involved in the local porosity calculation. The mesh cells related to different virtual spheres are allowed to overlap, so the porosity of one certain mesh cell involved in the calculation should be:
Benchmarking Example
The sedimentation of a single particle from air to water has been simulated to verify the accuracy and validity of the present improved DEM-CFD program. A fluid domain of 0.1 m × 0.1 m × 0.2 m is set, with the upper and lower parts filled with air and water, respectively. The motionless particle with a diameter of 1 mm is placed at a distance of 0.05 m above the water surface. The main simulation parameters are shown in Table 1. The movement of the particle can be expressed as:
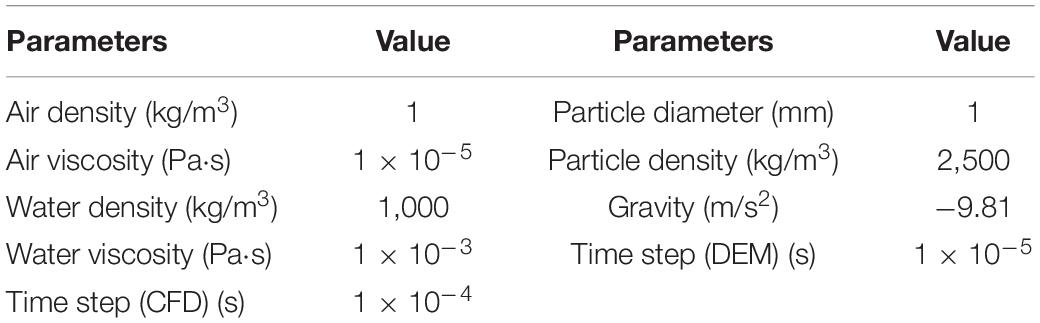
Table 1. Parameters for single particle sedimentation simulation.
The fluid domain in the simulation is meshed by equilateral hexahedrons with an equal size of 4 times the particle diameter. In Figure 2, the time series of particle sedimentation velocity from numerical results are compared with the analytical solutions. The numerical results are in good agreement with the analytical solutions, and the particle velocities are both stabilized at 0.134 m/s.
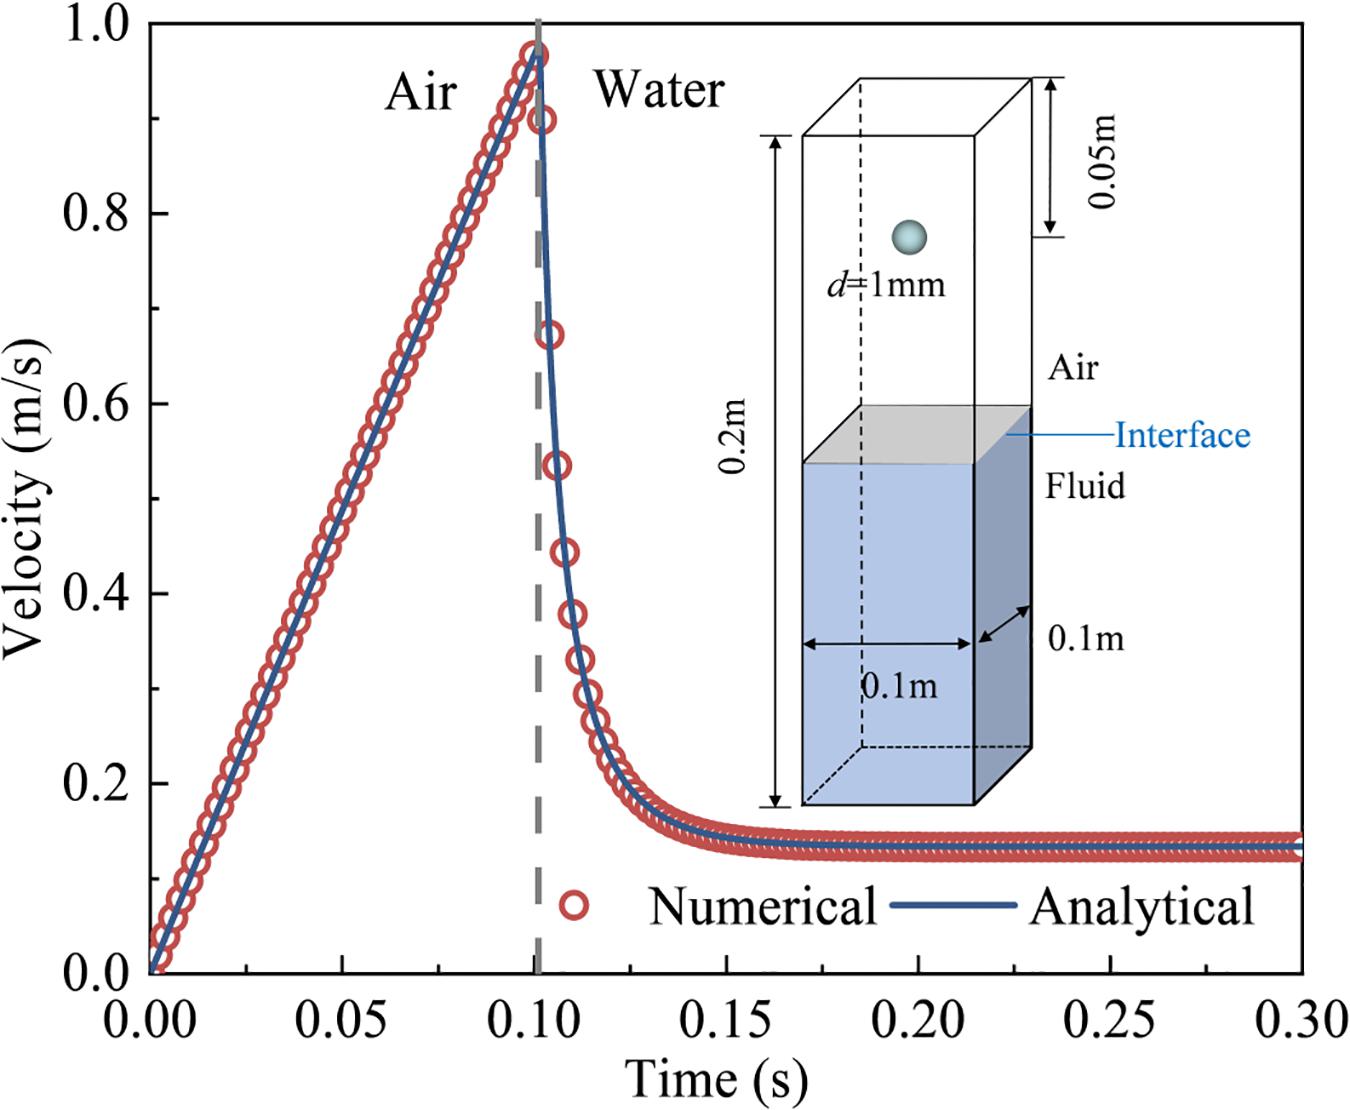
Figure 2. Time series of particle sedimentation velocity.
Furthermore, the single-particle sedimentation simulations with different size ratios of the fluid cell to particle diameter have been carried out to verify the validity of the coupling force calculation by the virtual sphere model. The particle diameter is kept constant, and the mesh size varies between 1 and 5 mm. The simulation is carried out simultaneously in the central model and virtual sphere model. The simulation results are shown in Figure 3. In the central model, as the size ratio continues to decrease, the error of the terminal velocity keeps increasing. This result reflects the critical size effect of the locally averaged DEM-CFD method, that is, keeping the size ratio above 4 would obtain more accurate results. On the contrary, the simulation results of the virtual sphere model under different mesh sizes are relatively stable. Compared with the central model, the accuracy of terminal velocity is improved by 40% maximum with the virtual sphere model. It indicates that the virtual sphere model effectively eliminates the limitation on the size ratio of the mesh cell to particle diameter in the local porosity calculation.

Figure 3. The effect of size ratio in Central model and virtual sphere model.
Model Configurations
Both the geometric configuration of the landslide dam and the reservoir capacity of the barrier lake play an important role in the evolution of the dam breaching, which should be considered when designs the landslide dam model configuration (Zhou et al., 2019). Peng and Zhang (2012) proposed three dimensionless parameters to define the geometric characteristics of landslide dams and barrier lakes: the ratio of the dam height to its width () and the ratio between the cubic root of the dam volume and height () define the dam shape, and the ratio between the cube root of the lake volume and the dam height () define the lake shape. Zhou et al. (2019) determined the distribution range of these dimensionless parameters by analyzing 80 reported cases over the world, where ranges from 0.03 to 1, ranges from 1 to 5, and ranges from 1 to 6. These evaluation results provide an important reference for the design of the landslide dam model configuration and are also used to guide the model design of this research.
The schematic diagram of model configurations is illustrated in Figure 4. The simulation was conducted in a flume measuring 7 m long, 0.5 m wide, and 0.5 m deep, and the inclination angle of the river bed was 5°. The landslide dam was placed 3 m away from the inlet. The height of the landslide dam was 0.3 m, the top width was 0.3 m, the angle between the upstream slope and the river bed was 35°, and the angle between the downstream slope and the river bed was 25°. An “idealized” geometric configuration of the landslide dam across the river channel was used in this research, which would still very meaningful to advance the understanding of the longitudinal breach mechanism of landslide dams (Cao et al., 2011). The values of , , and were 0.18, 2.2, and 2.0, respectively, and were all conformed to the distribution range of dimensionless parameters given by Zhou et al. (2019). The upstream and downstream boundaries were set as inlet and outlet, and the top boundary was set as an open-air condition. In this research, the upstream inlet flow discharge was changing to study the influence of different hydrodynamic conditions on the dam breaching process. The ratio of the cube root of the inflow discharge per unit time to the dam height was defined as the hydrodynamic coefficient, where Qin is the inflow discharge and Tu is the time scale. The dimensionless coefficient was evaluated with the data of 70 landslide dams reported by Shen et al. (2020), and it was found that the inflow discharge distributes in a relatively wide range from 0.007 to 1.176, Tu = 1s). According to the evaluation results of the dimensionless coefficient, it was determined that the inflow discharges in this research are 0.005 m3/s, 0.01 m3/s, 0.015 m3/s, and 0.02 m3/s ( range from 0.57 to 0.9) to represent the inflow from low to high. Figure 5 shows the grain size distribution of Yangjiagou landslide dam (Li et al., 2021) and 14 landslide dams in Southwest China (Zhang et al., 2011). Considering the grain size effect and the computational limitations, the particles with diameters larger than 50 mm and less than 1 mm were removed. Two types of non-cohesive landslide dam materials were set and shown in Figure 5, one for unsize coarse-grained granular material (consisting of gravels, represented by C) and one for wide size range fine-grained granular material (consisting of sands and gravels, represented by F). The serial numbers for the unsize coarse-grained granular material specimens with these four inflow discharges were C1, C2, C3, and C4, and those for the wide size range fine-grained granular material specimens were F1, F2, F3, and F4, respectively, as summarized in Table 2. The fluid domain was discretized by fixed-grid parallelepiped cells with a size of 50 mm. The parameters used in the model are given in Table 3. The values of these DEM parameters have been calibrated by Li et al. (2020). A total of 8 sets of simulations were carried out (see Table 2), and the dam breaching process as well as the influence of different characteristics of dam materials and inflow discharges were discussed in the following sections.
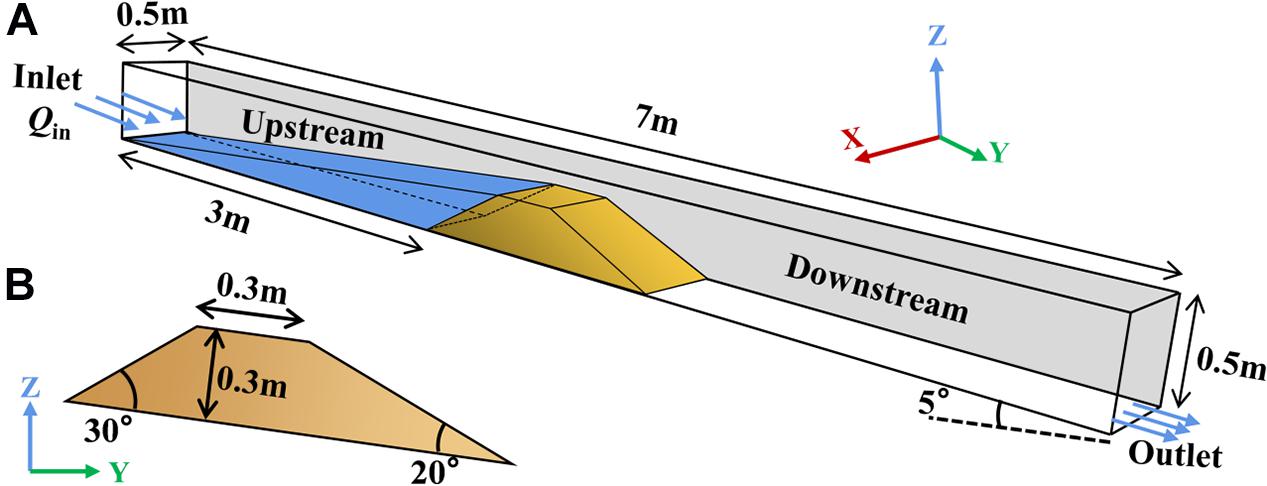
Figure 4. Configurations of the simulation model: (A) panorama; (B) longitudinal section of the landslide dam.
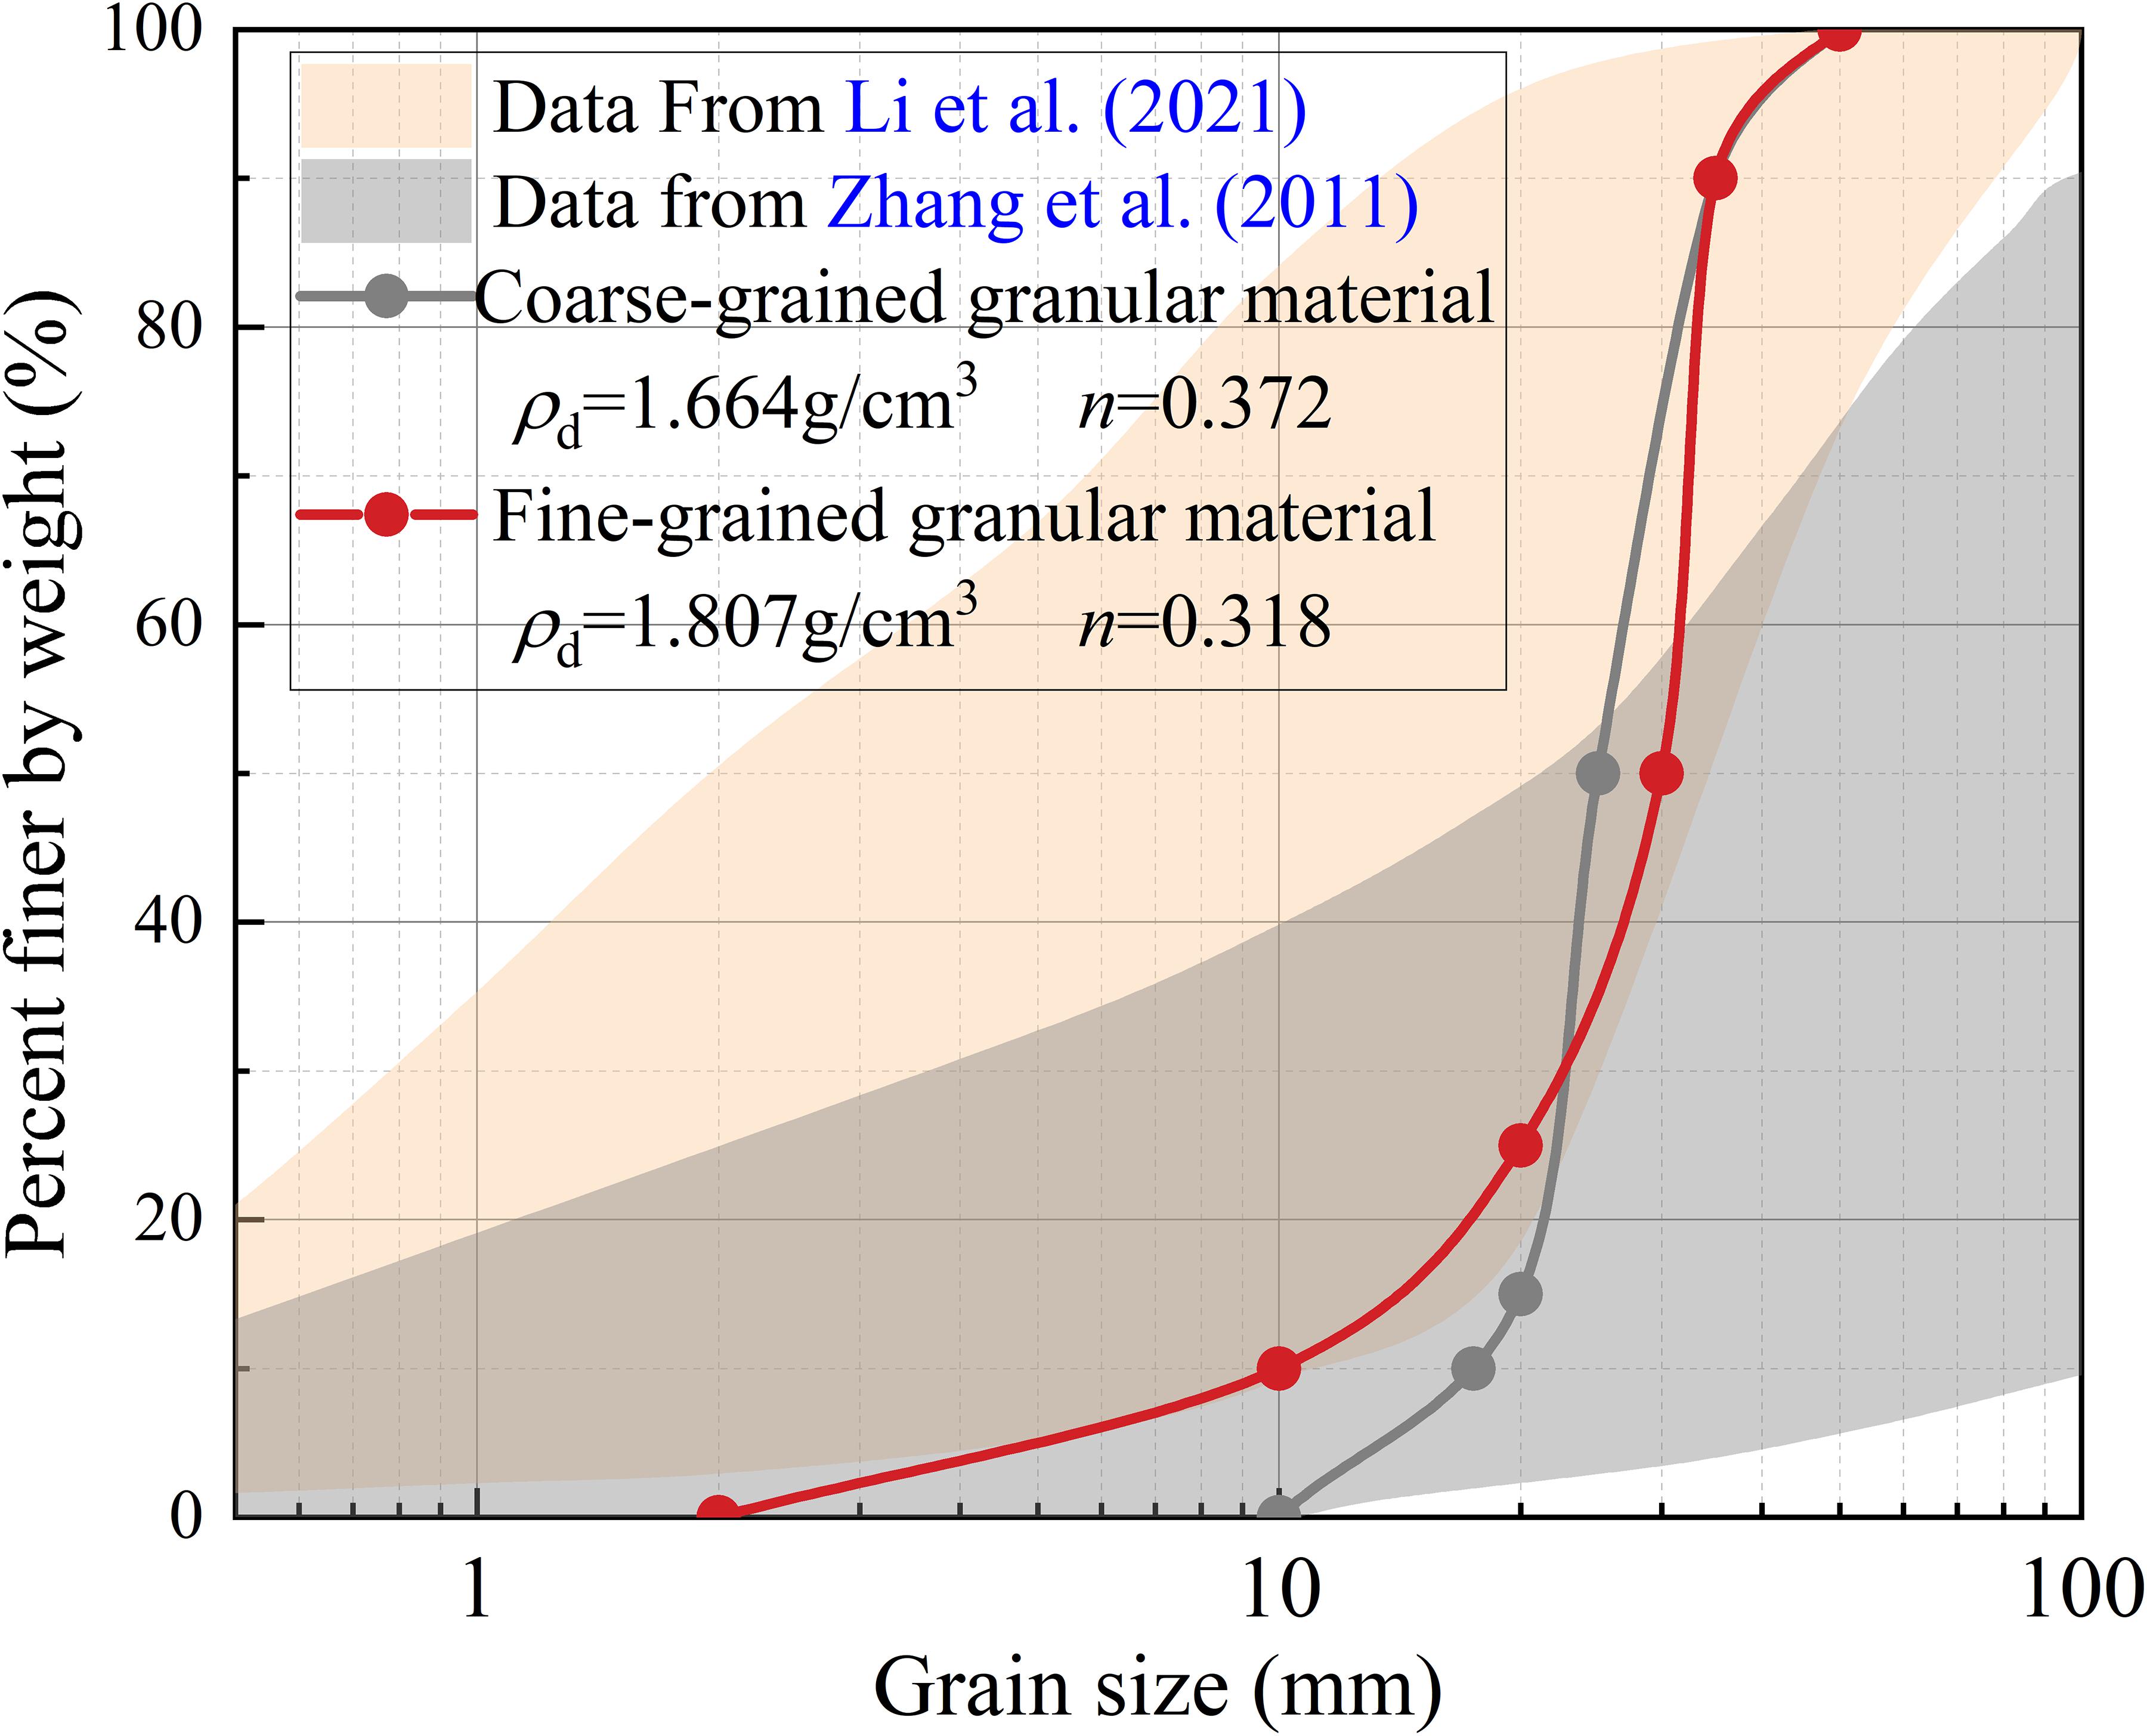
Figure 5. Grain size distribution of the simulation materials. The light shaded region is the cumulative grain size distribution of 14 landslide dams in Southwest China (Zhang et al., 2011), the gray shaded region is the cumulative grain size distribution of Yangjiagou landslide dam (Li et al., 2021), and the solid lines represents the grain size distribution of the modeled landslide dams.
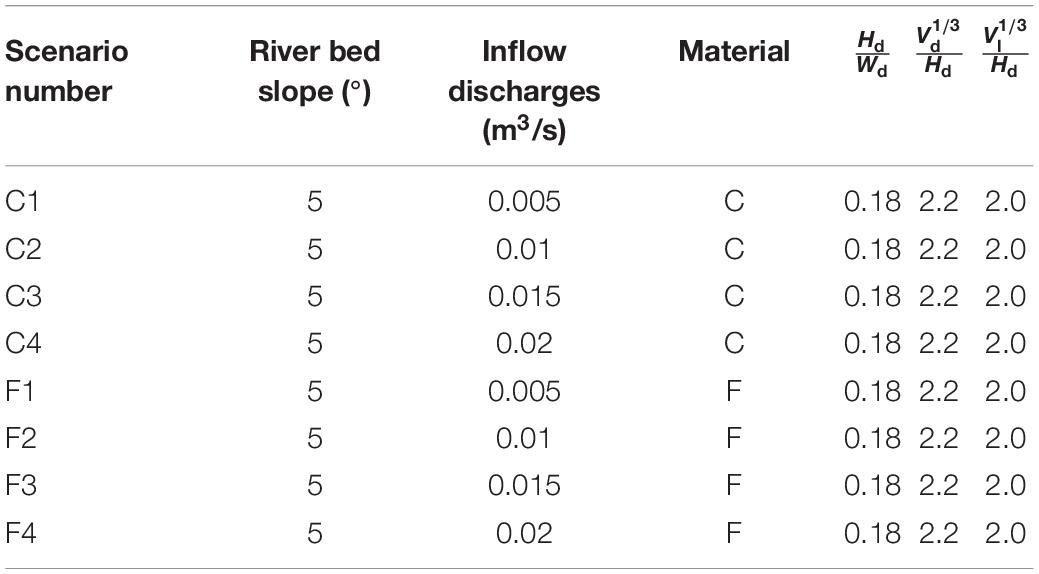
Table 2. Summary of simulation scenario for landslide dam breach.
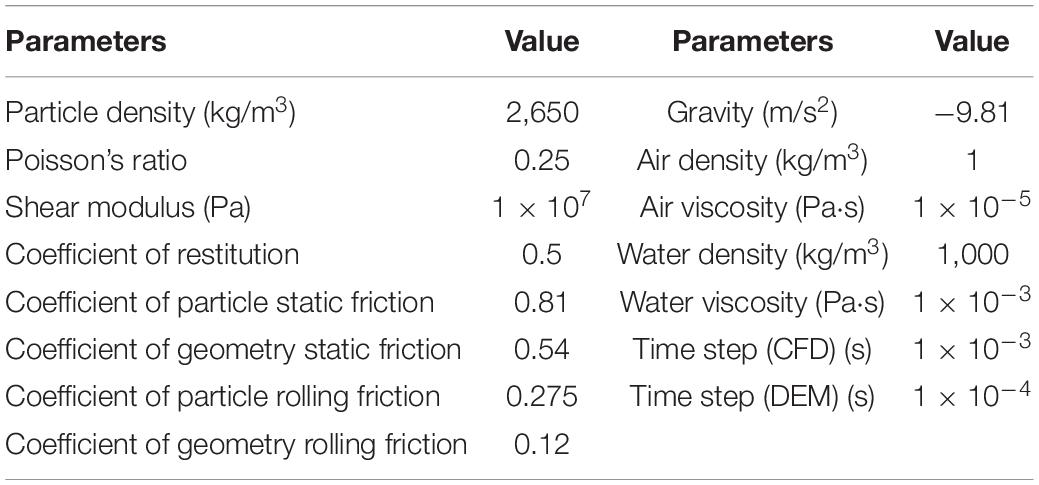
Table 3. Parameters to simulate the landslide dam breach process.
Numerical Simulation of the Landslide Dam Breach Process
General Description
Although each scenario has its own characteristics, they all share important universal characteristics. In general, with the continuous inflow from upstream, the water level of the barrier lake gradually increases. During this process, due to the fragmented dam materials with large pores inside, the seepage flow would first appear at the foot of the downstream slope. Once the water level overtops the dam crest, dam breaching commences through overtopping erosion (Nian et al., 2020). Figure 6 shows the typical temporal sequences of the landslide dam breach process (scenario C2). The numerical results indicate that the longitudinal breach of landslide dams experiences four phases: surface flow erosion, backward erosion, head-cut erosion, and water and sediment rebalance or complete breach. The characteristics of different breaching phases are considered to describe the dam breaching process, as follows:
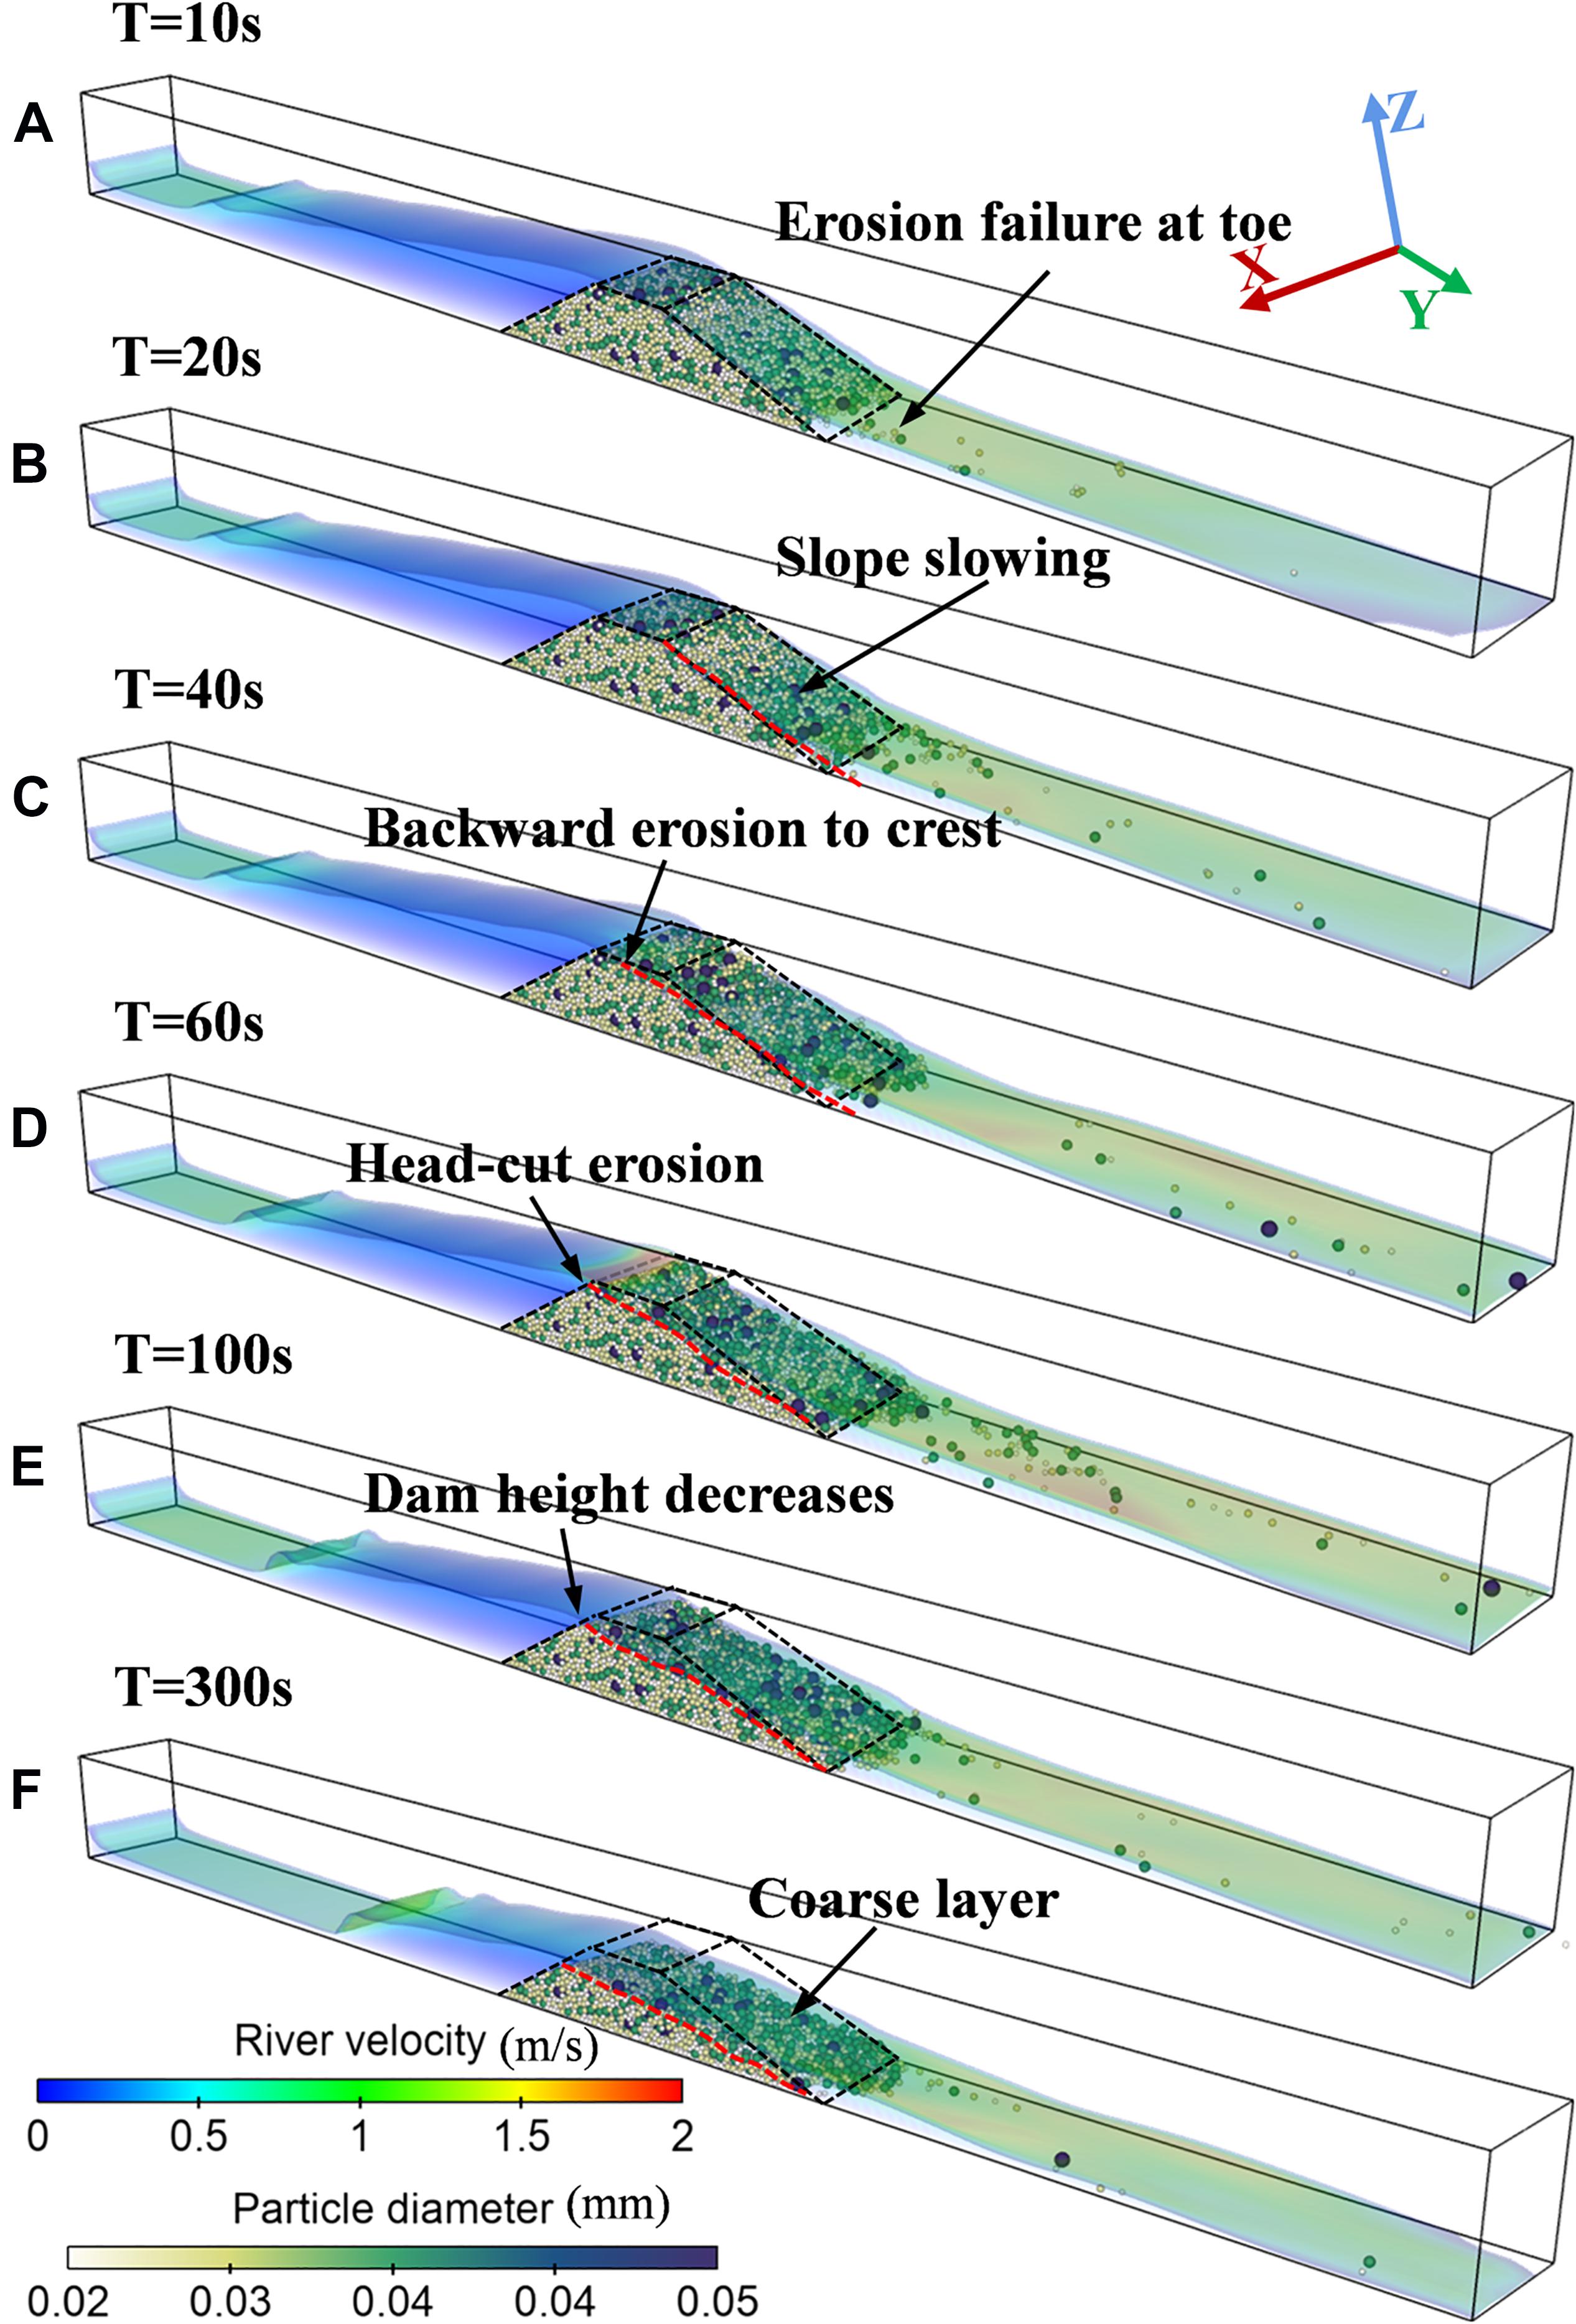
Figure 6. Time series of landslide dam breaching. The red dotted line is the downstream slope contour, and the black dashed line is the initial state contour of the dam. (A) Surface flow erosion; (B,C) backward erosion; (D,E) head-cut erosion; (F) water and sediment rebalance.
(a) Surface flow erosion. The dam breaching initially begins at the downstream slope of the dam, and the scouring of the surface flow is the key factor for the particle activation on the downstream surface (Jiang et al., 2020). During this phase, it can be observed that the water flow on the slope is accelerated by gravity, the flow velocity at the foot of the downstream slope increases significantly, and the erosion ability of the water flow is enhanced (Figure 6A). The failure of the landslide dam starts from the toe of the downstream slope, and the activation of fine particles is earlier than that of coarse particles.
(b) Backward erosion. With the further development of erosion, the breach of the dam body started to transform from the failure of the particles at the downstream slope to the activation of a certain scale dam material. In this phase, the hydraulic-gravity coupling [consisting of the scouring and seepage of the breach flow as well as the gravity potential energy of the dam material (Dang et al., 2008)] is the main factor for the activation of the dam. The backward erosion of the landslide dam without initial breach develops from the toe to the crest of the downstream slope, accompanied by the continuous slowing of the downstream dam slope angle (Figures 6B,C), which is in agreement with the experiment results from Cao et al. (2011).
(c) Head-cut erosion. As the backward erosion continues to develop and reaches the upstream dam crest, the head-cut erosion begins and causes the dam height to decrease significantly. In this phase, the breach flow discharge increases rapidly due to the decrease of the dam height, and the increase in the flow velocity at the dam crest could be significantly observed in Figure 6D. The increase of the flow velocity at the dam crest would further strengthen the erosion capacity of the breach flow and in turn accelerates the development of head-cut erosion.
(d) Water and sediment rebalance or complete breach. As the water level of the barrier lake continues to drop, the outflow discharge is gradually decreased, and the erosion capacity of the breach flow continues to weaken. The coarse particles on the downstream slope accumulate and form a coarse layer as the dam breaching progresses, which hinders the further erosion of the lower particles. In the case of low inflow discharge, the inflow and the breach flow could reach a new balance, and the dam no longer undergoes significant erosion damage. In the case of high inflow discharge, the dam would fail completely.
Force Evolution During Landslide Dam Breach
The time series of normal contact force, tangential contact force, and particle-fluid interaction force are shown in Figure 7. As shown in Figure 7, on the one hand, the breach flow reduces the normal contact force between the particles through the buoyancy force, on the other hand, the breach flow causes the rotation trend of particles through the seepage and scouring, resulting in an increase of tangential contact force between particles. About 50 s, the backward erosion has progressed to the upstream dam crest, and this marks the beginning of the head-cut erosion phase. The erosion capacity of the breach flow is enhanced due to the loss of the dam height. This would cause the normal contact force and the tangential contact force to decrease rapidly. For the particle-fluid interaction force, there will be a certain increase in the initial breaching stage due to the appearance of the overtopping flow. As the breach progresses and the storage capacity decreases, the particle-fluid interaction force continues to decrease.
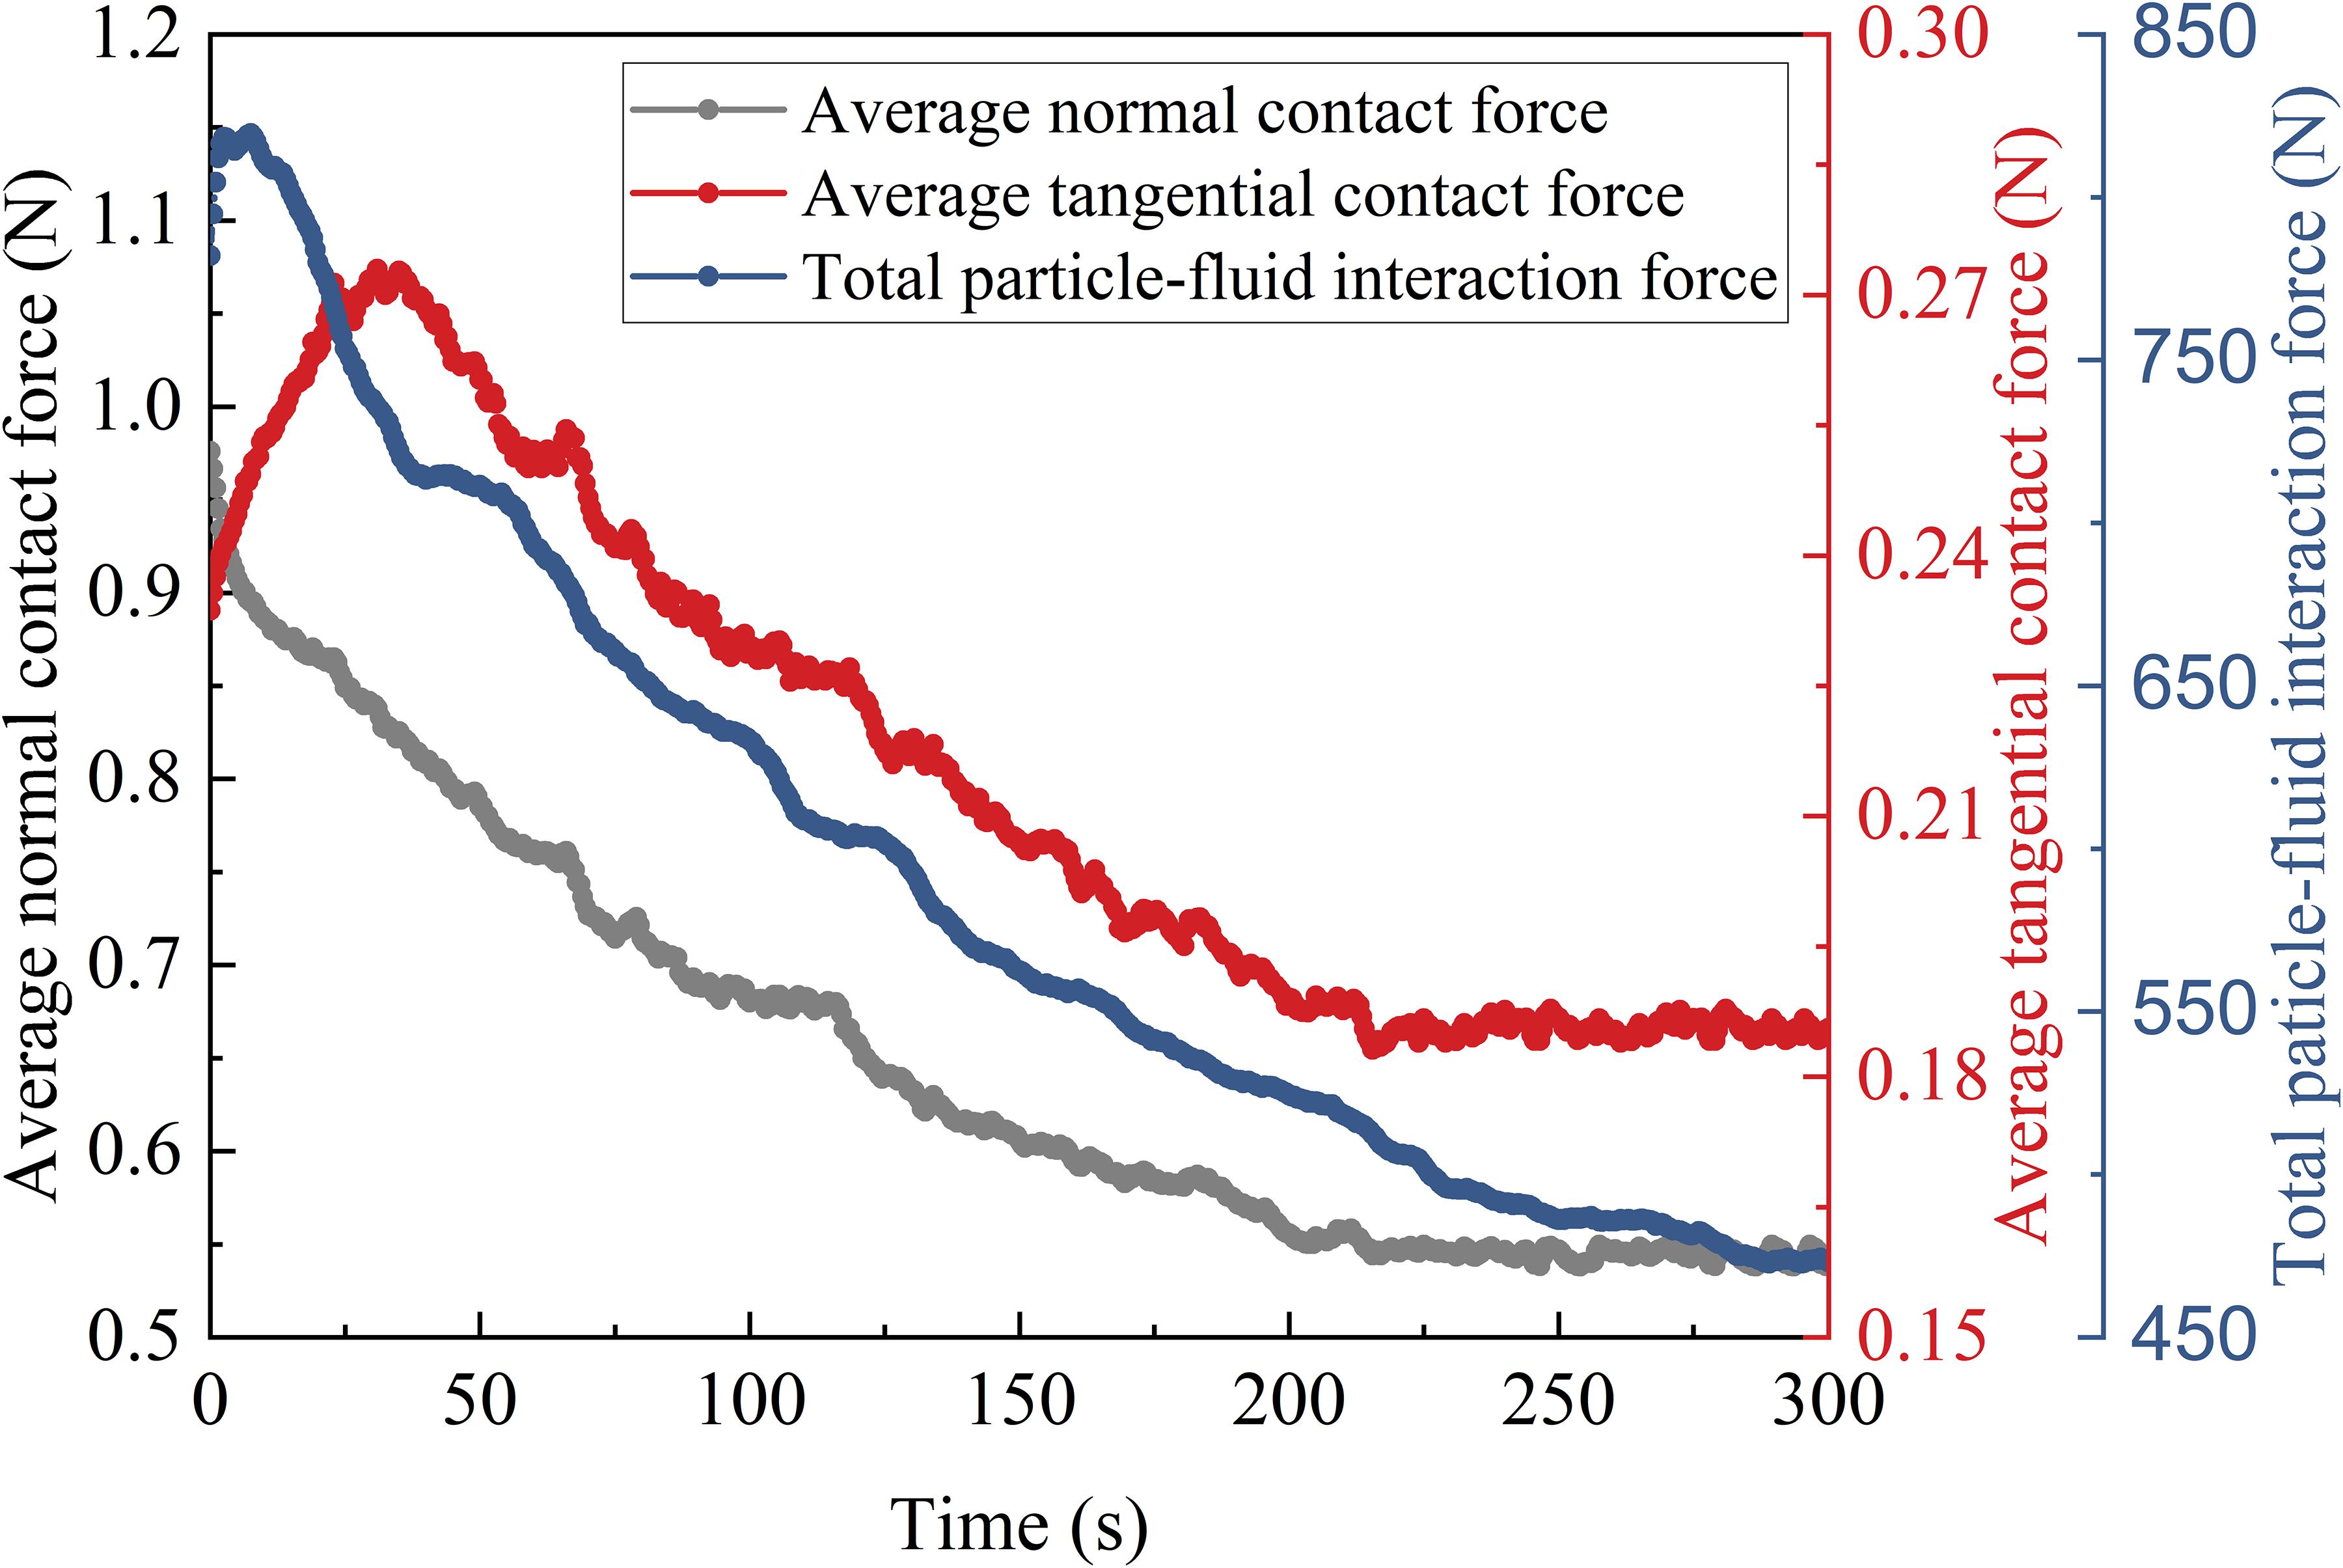
Figure 7. Time series of normal contact force, tangential contact force and particle-fluid interaction force. The black axis, red axis, and blue axis on the y-axis represent the average normal contact force Fn, average tangential contact force Ft and total particle-fluid interaction force Ff, respectively.
The total energy E of the particle system is defined as the sum of the kinetic energy, rotational kinetic energy and potential energy, which can comprehensively reflect the energy evolution in the dam breaching process. The dimensionless total energy [E] is normalized by the total energy at t divided by the initial total energy at rest state:
The evolution process of the dimensionless total energy of each scenario is shown in Figure 8. As the breach progresses, the dam material is activated by the breach flow and propagates downstream, accompanied by the transformation of potential energy to kinetic energy. The activated particles are continuously lost due to the carrying of the breach flow, resulting in the continuous reduction of the dam volume and the continuous attenuation of the total energy. With the formation of the coarse layer and the continuous decrease of the storage capacity, the breach of the dam tends to stagnate, and the attenuation of the total energy gradually stabilizes. In this process, the increase in the inflow discharge can significantly increase the initial decay rate of the total energy and reduce the residual value of the total energy, which also marks the intensification of the breach and the continuous decrease of the residual dam volume. With the same inflow discharge, the residual total energy of the wide size range fine-grained granular dam is always lower than that of the unsize coarse-grained granular dam. This is because fine particles are easier to activate and aggravate the dam breach.
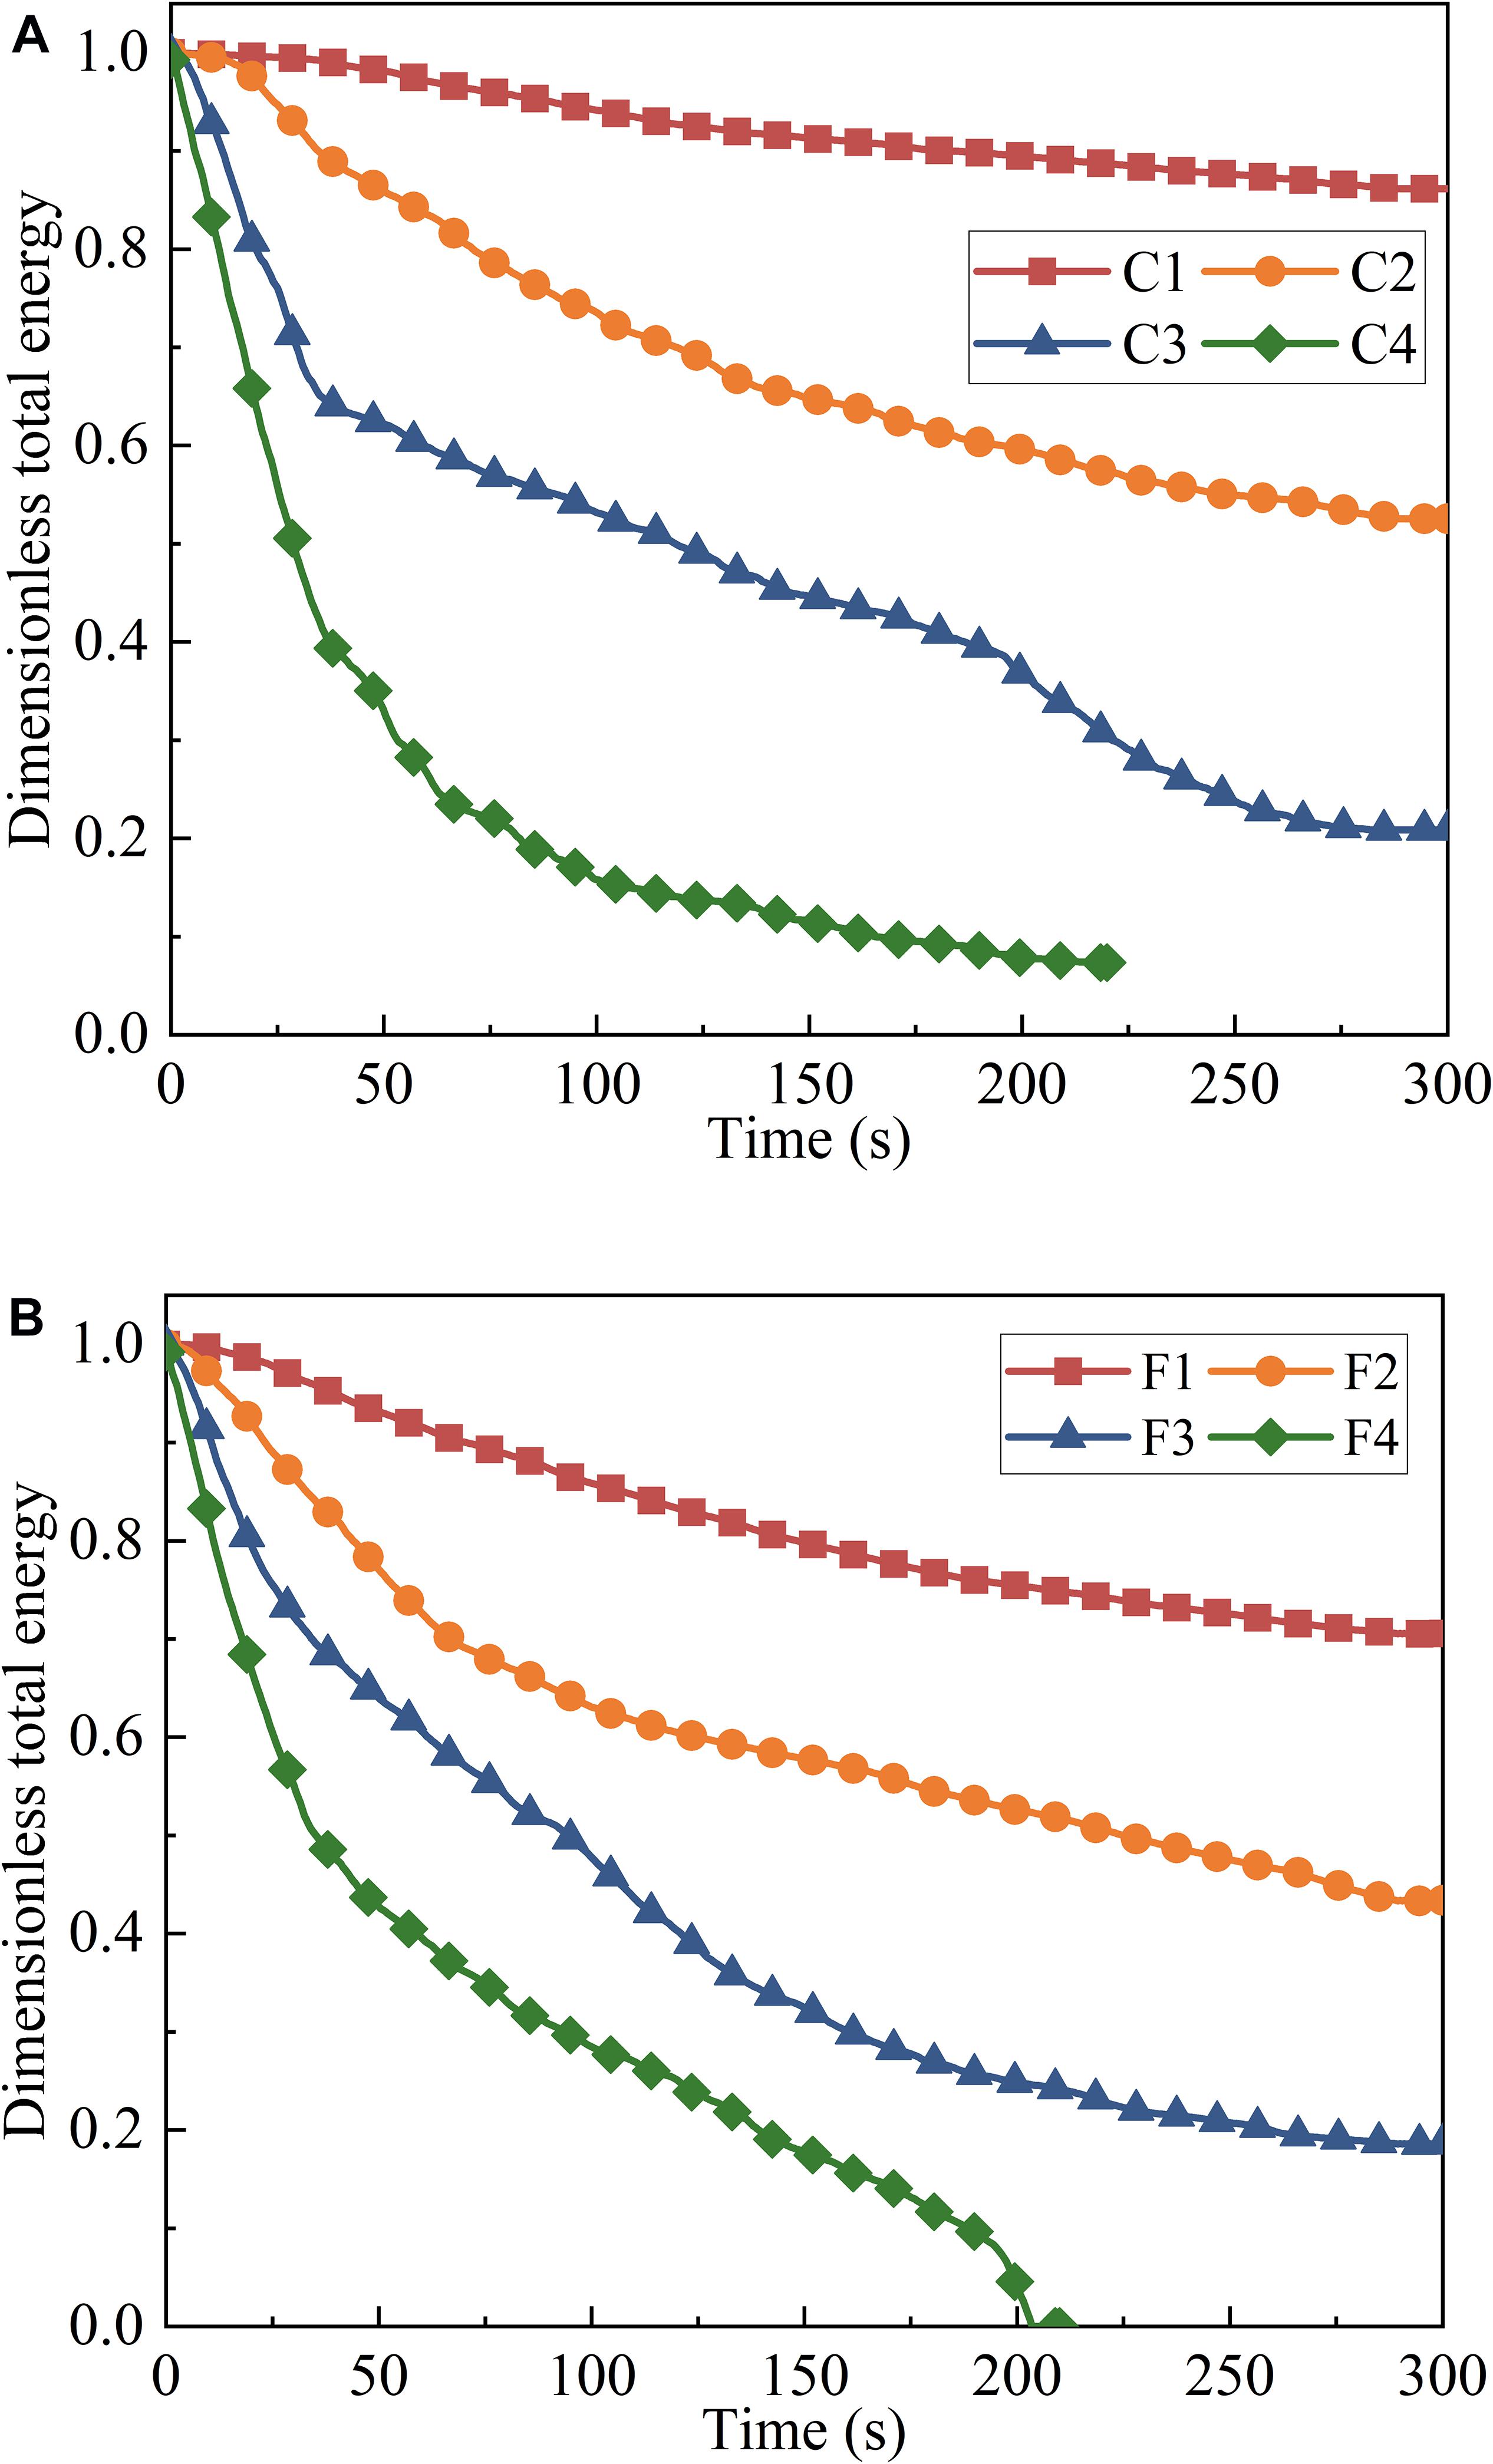
Figure 8. Evolution of the total energy of the particle system: (A) for unsize coarse-grained landslide dams; (B) for wide size range fine-grained landslide dams.
Breach Morphology Evolution Processes of Landslide Dam Along the Longitudinal Direction
Figure 9 shows the time series of breach morphology evolution processes of landslide dams along the longitudinal direction with different inflow discharge and dam materials. The morphology curve gradually changes from sparse to dense with time, and finally basically no longer changes, indicating the end of the failure process. In the case of 0.005 m3/s inflow discharge and unsize coarse-grained dam material, the overtopping flow does not appear. It can be seen in Figure 9A that when the deformation progresses to the middle of the dam crest, the dam failure stops. In the case of low inflow discharge and coarse granular landslide dam with high porosity, the seepage effect is responsible for the main drainage function and may lead to substantial dam subsidence (Jiang et al., 2020). This kind of subsidence is similar to backward erosion and the failure point develops from the downstream slope to the dam crest. The dam material composed of fine particles can reduce the void ratio and improve the impermeability of the dam (Dhungana and Wang, 2020). Compared with Figure 9A, the dam in Figure 9E has experienced a complete overtopping breach process.
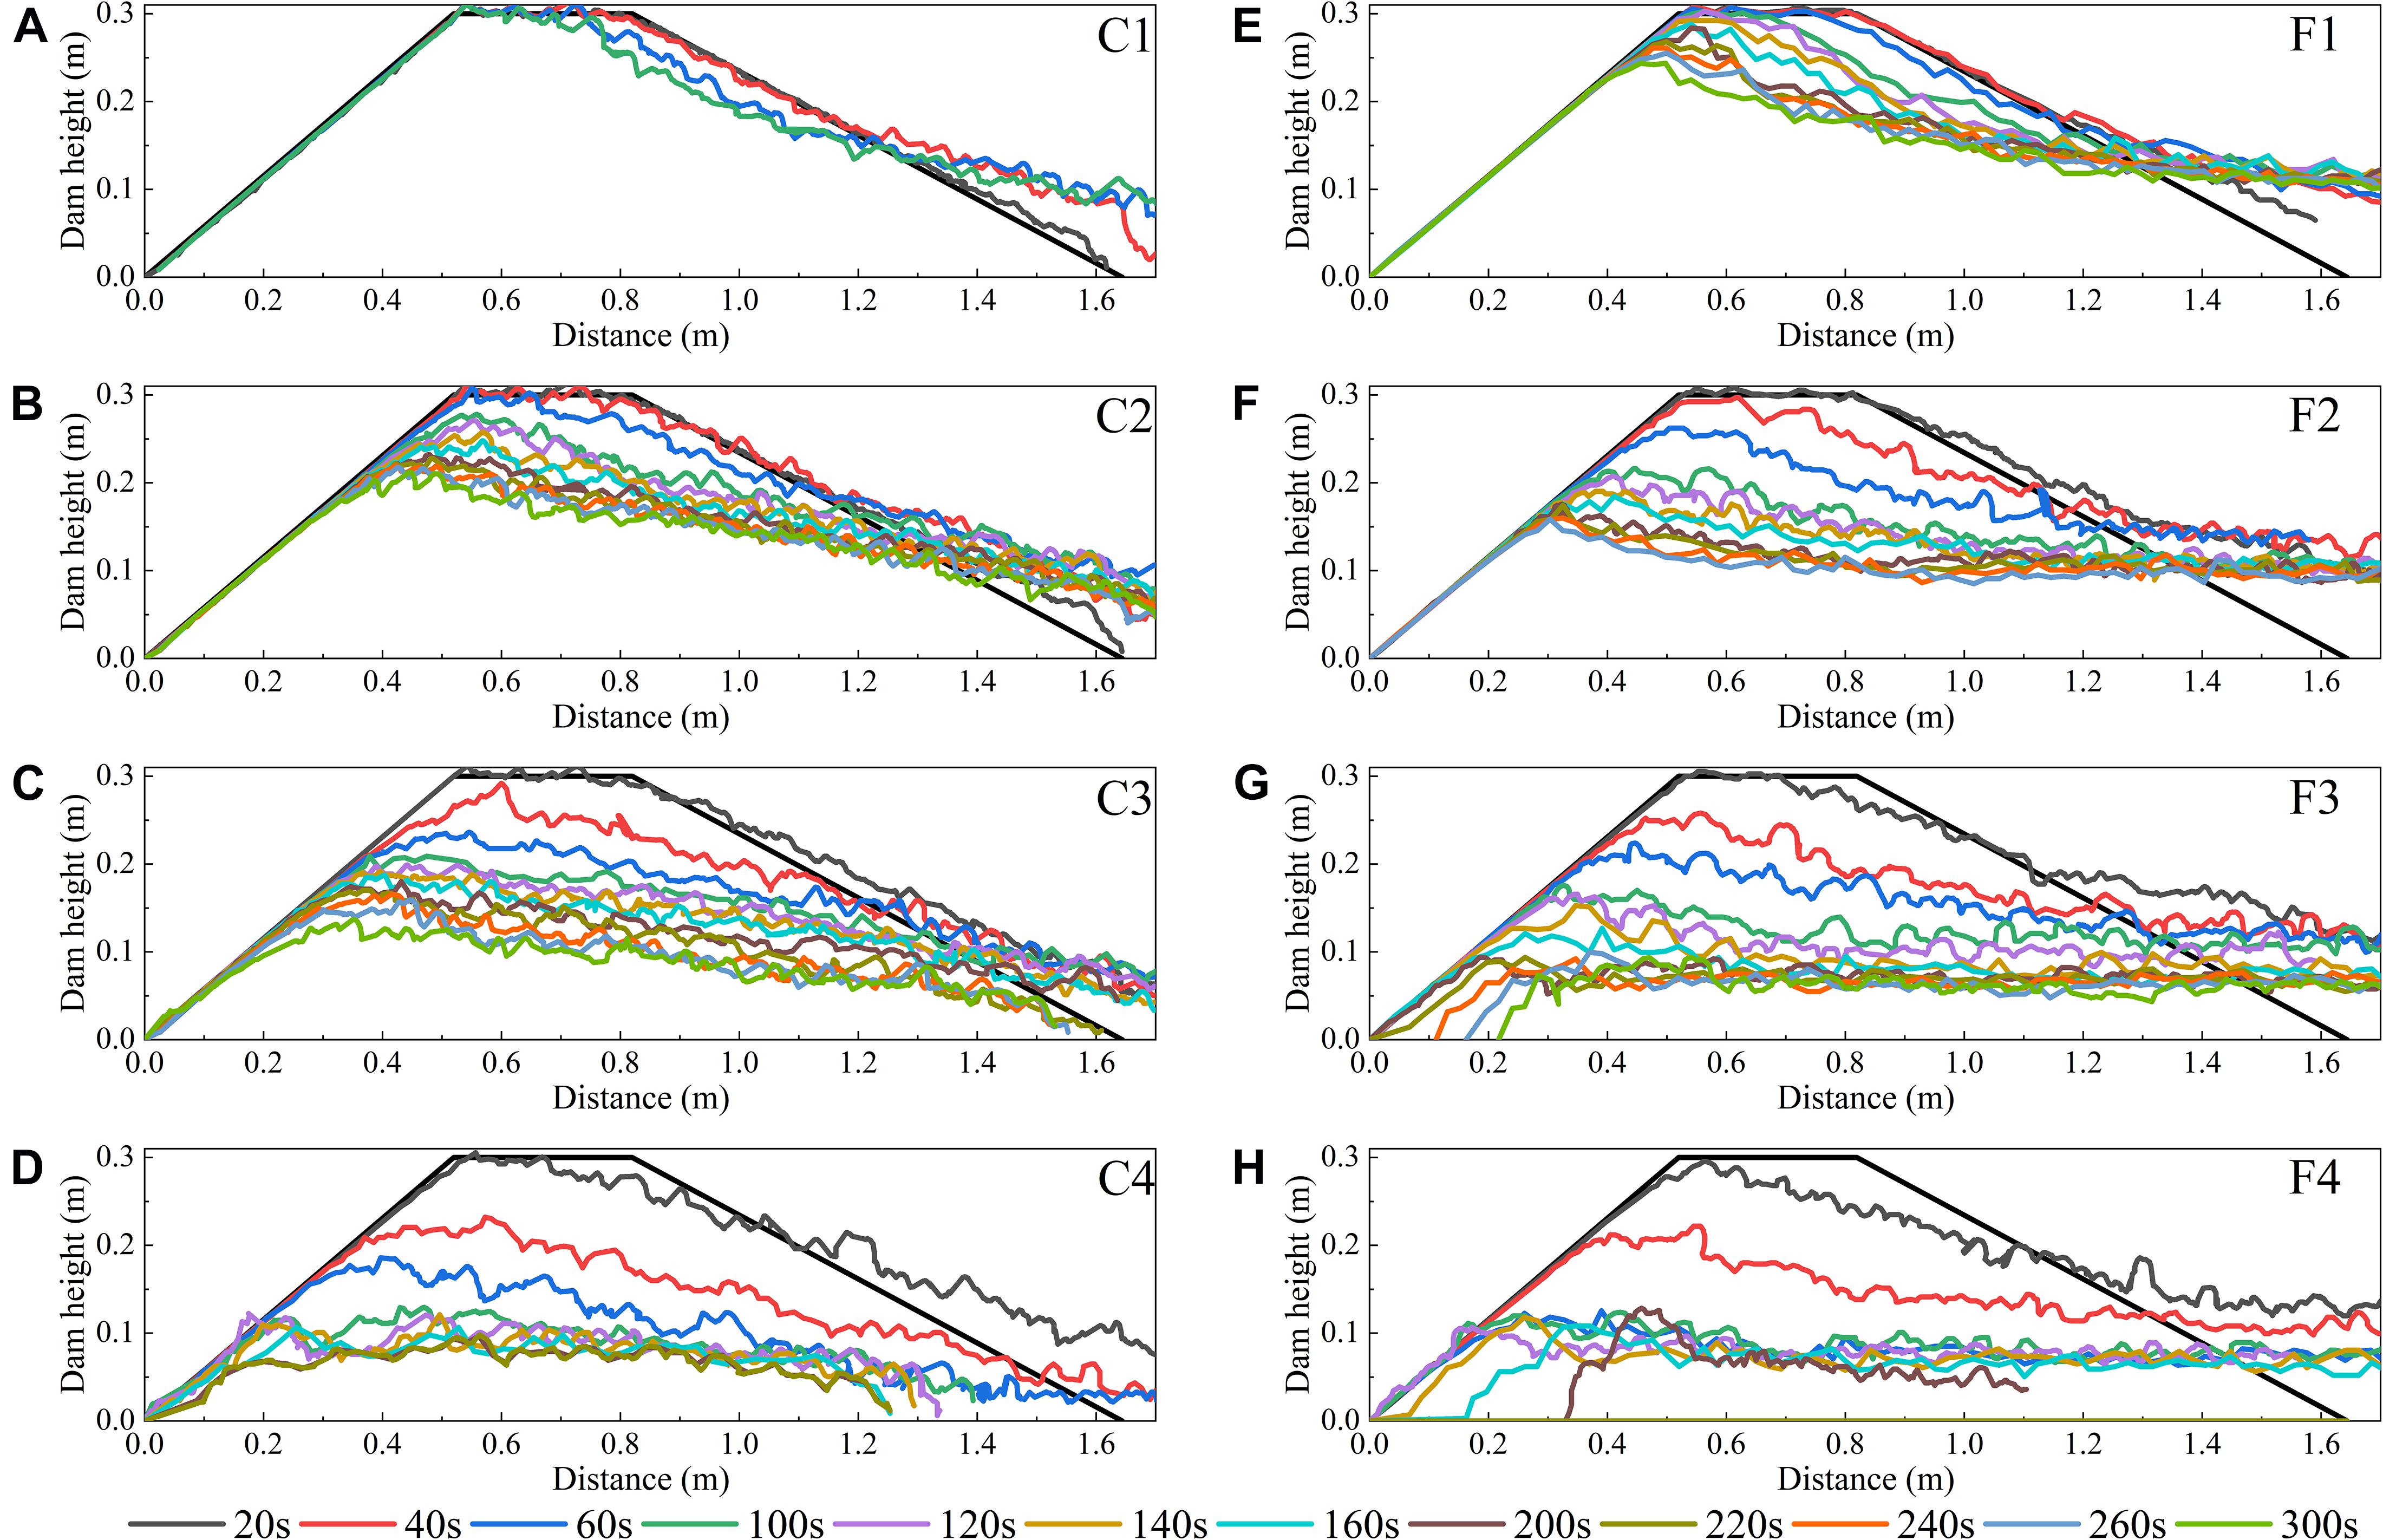
Figure 9. Breach morphology evolution processes of landslide dams along the longitudinal direction. (A) scenario C1; (B) scenario C2; (C) scenario C3; (D) scenario C4; (E) scenario F1; (F) scenario F2; (G) scenario F3, and (H) scenario F4.
As shown in Figures 9B–H, for scenarios with overtopping-induced dam breaching, the head-cut erosion is the main phase of the dam breaching process. With the increase of inflow discharge, the duration of the surface flow erosion phase and the backward erosion phase continues to decrease. The increase in the inflow can significantly increase the erosion capacity of the breach flow so that the erosion point quickly develops to the upstream dam crest. With the evolution of the failure process, the dam morphology gradually transforms into a triangle, and the downstream slope gradually slows down. It can be observed from Figure 9 that the inflow discharge and the dam material can significantly affect the downstream slope angle. With the increase of the inflow discharge, the carrying capacity of the breach flow increases, so that the dam material can be carried to a farther place and the downstream slope is slowed down. Also, the erosion is directly related to the particle size, that is, the erosion resistance of fine particles is much lower than that of coarse particles. Therefore, under the same inflow conditions, the head-cut effect of the unsize coarse-grained dam material is more significant than that of the wide size range fine-grained dam material, and the downstream dam slope angle is also significantly slower than that of the wide size range fine-grained dam material.
Evolution of the Landslide Dam Height
Figure 10 shows the evolution process of the landslide dam height and the residual dam height of each scenario. It can be seen that one of the typical effects of inflow discharge on the landslide dam breach is to reduce the residual height of the dam. With the increase of the inflow discharge, the erosion capacity of the breach flow is continuously enhanced and causes more dam body failure. Under the same inflow conditions, the residual dam height of the wide size range fine-grained dam material is always lower than that of the unsize coarse-grained dam material, which indicates that the existence of fine particles reduces the erosion resistance of the landslide dam. On the one hand, this phenomenon is due to the existence of fine particles that reduces the porosity inside the dam body and reduces the drainage capacity of seepage; on the other hand, the erosion resistance of fine particles is lower than that of coarse particles. This also explains the phenomenon that there are still residues in scenario C4 and the dam body has completely failed in scenario F4.
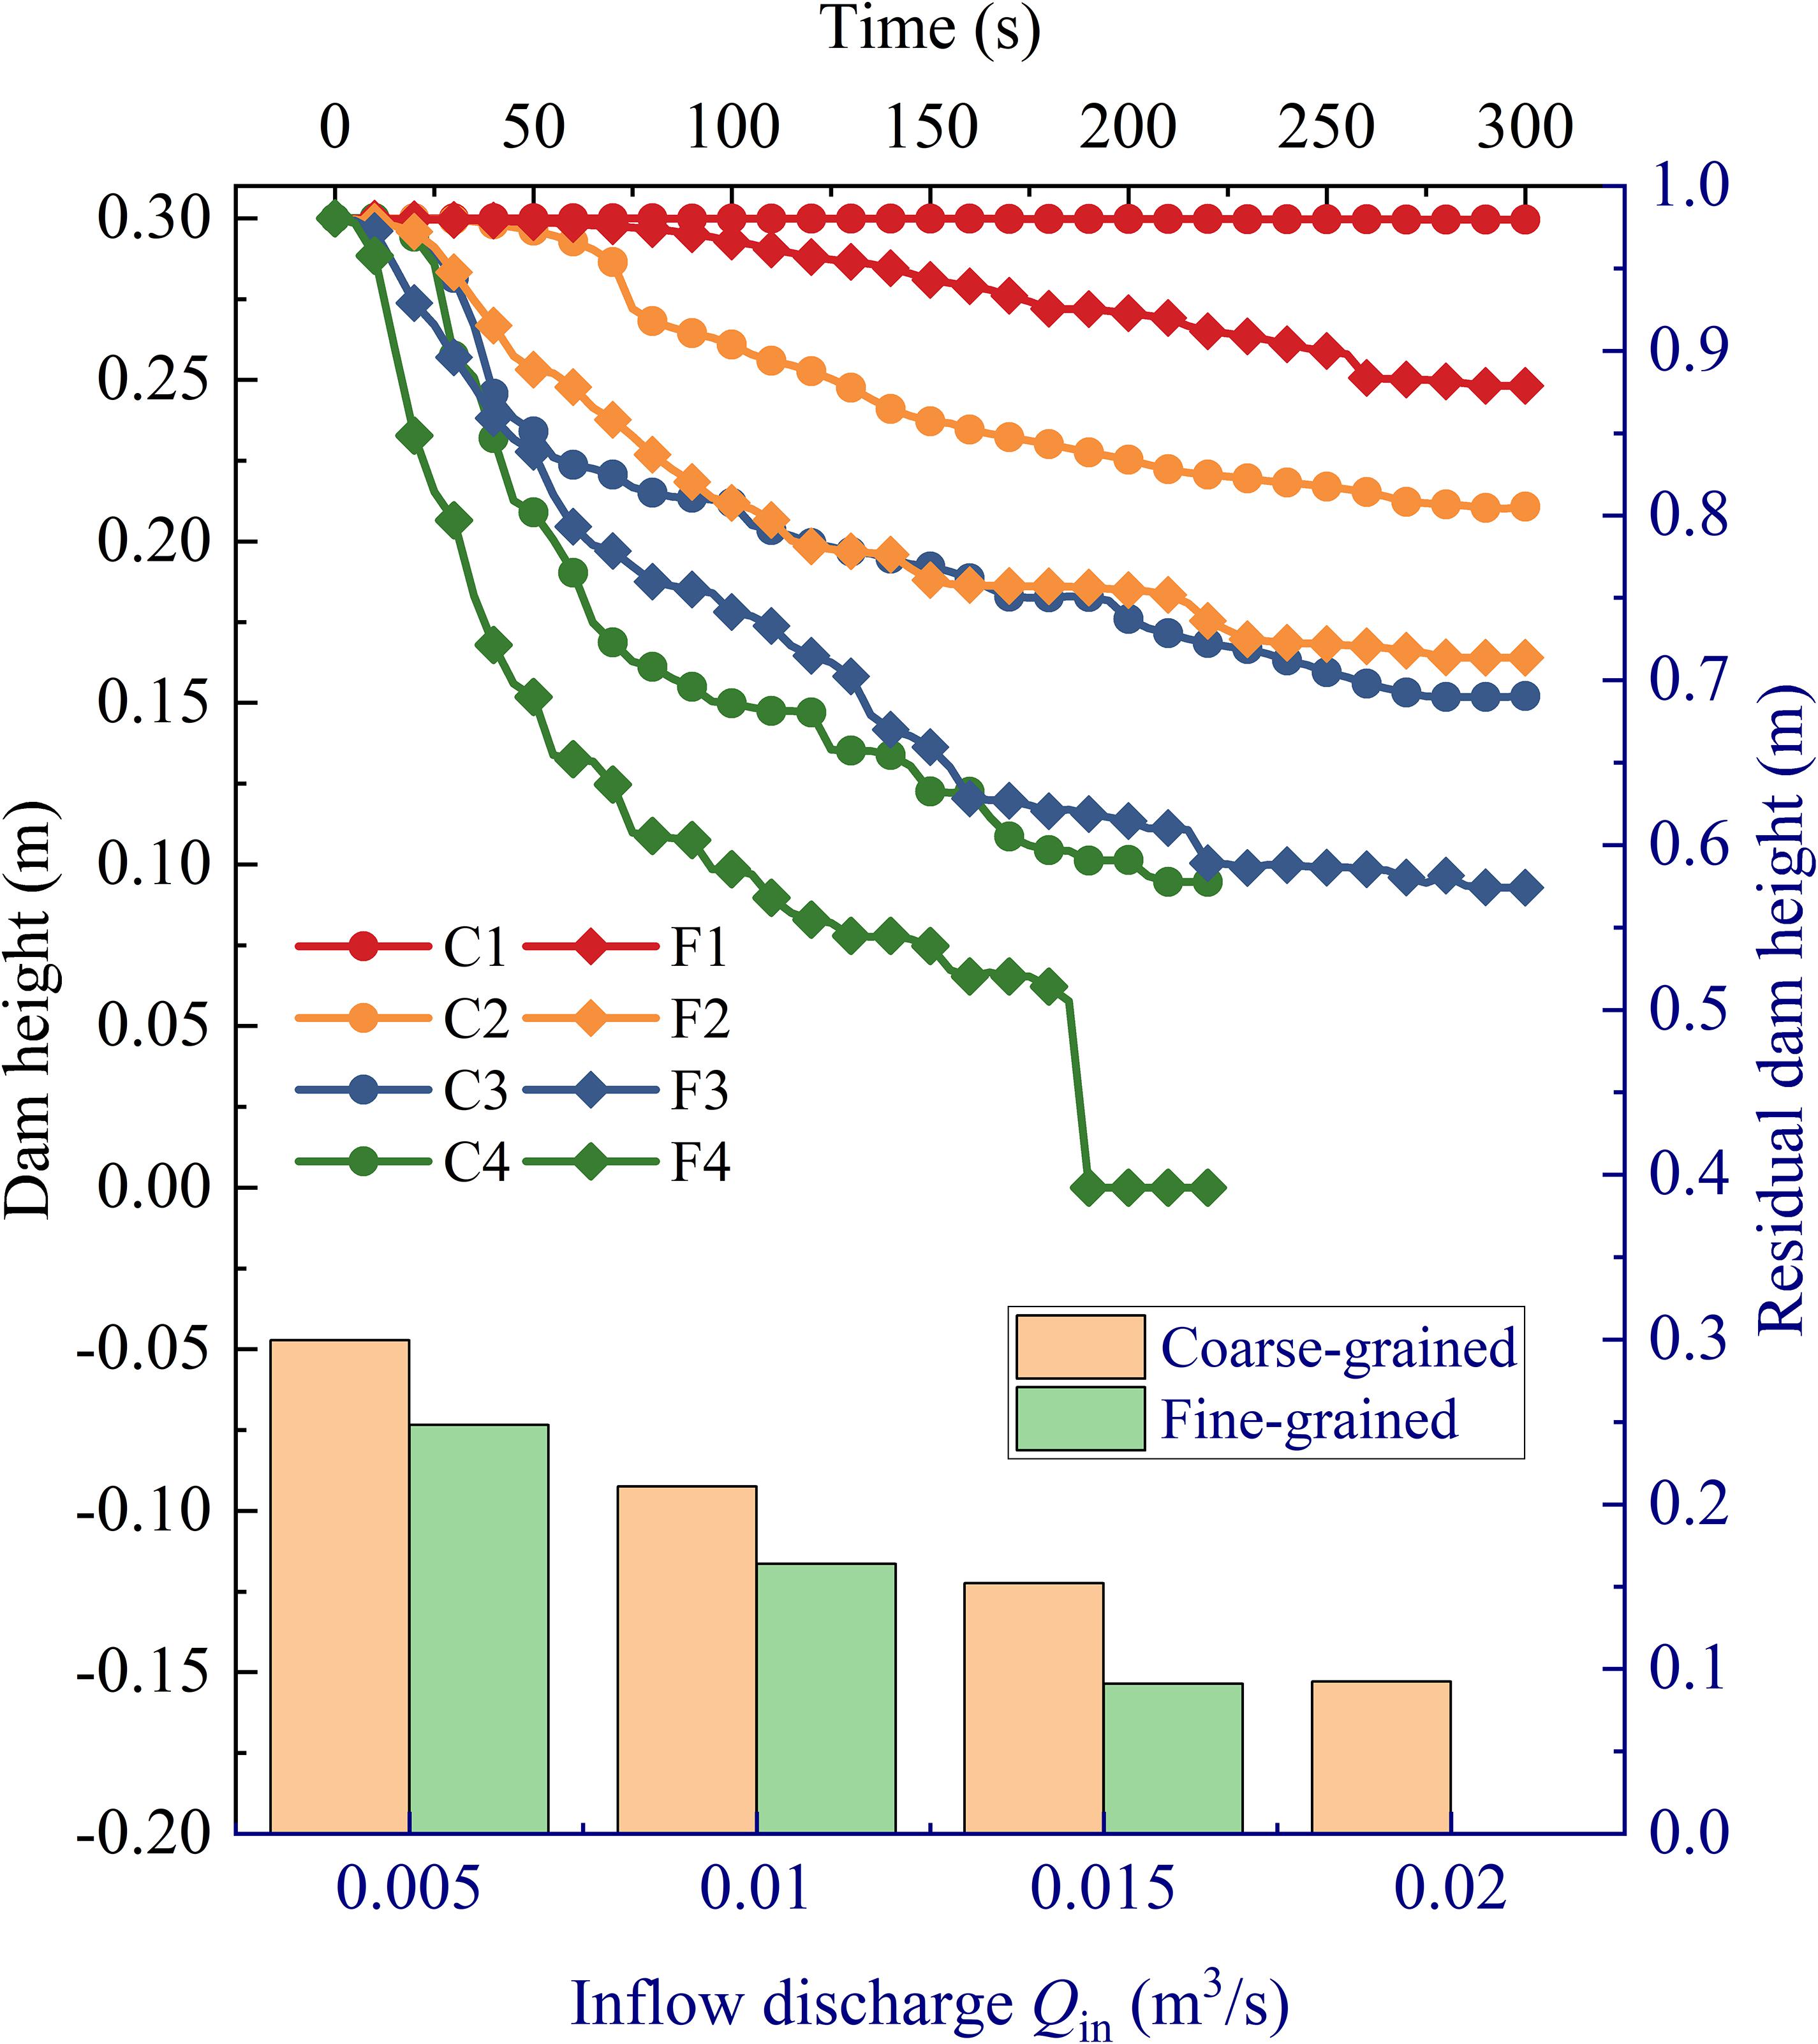
Figure 10. Evolution process of the landslide dam height and the residual dam height of each scenario. The solid lines under black coordinates represents the change of dam height over time, and the histogram under blue coordinates represents a comparison of the residual dam height.
Discussion
Erosion Process at the Dam Crest
To further research the breach process of the landslide dam, the dam height reduction rate ε is defined as the loss of dam height per unit time, and is used to quantify the erosion rate at the dam crest:
The time series of dam height reduction rates in each scenario is shown in Figure 11. It is shown that the dam height reduction rate fluctuates with time. In fact, the experiment proposed by Jiang et al. (2016) also confirmed the multi-peak phenomenon of the erosion rate, which supports the reliability of our simulation. The incipient velocity of fine particles is much lower than that of coarse particles. Therefore, the fine particles are taken away first, while the coarse particles are more difficult to be eroded. The failure at the dam crest is dominated by the small-scale collapse (Zhou et al., 2019). This is mainly caused by the loss of fine particles and the erosion of the breach flow and would lead to the rapid increase of the dam height reduction rate in a short time. With the increase of the inflow discharge, the local activation of the dam crest becomes more frequent and more intense, which makes the dam height reduction rate fluctuate more intensely. Besides, with the same inflow discharge, the height reduction rate of wide size range fine-grained granular dams fluctuates more frequently than unsize coarse-grained granular dams, but the peak point of height reduction rate of unsize coarse-grained granular dams is higher than that of wide size range fine-grained granular material dams. This indicates that the activation scale of the unsize coarse-grained granular dam is larger than that of the wide size range fine-grained granular dam, and the number of activation is less than that of the wide size range fine-grained granular dam. The fluctuations in each scenario continue to decay over time. This is due to the continuous decrease of the storage capacity of the barrier lake and the gradual formation of the coarse layer. It is increasingly difficult for the breach flow to cause activation of the dam. For scenario F4, a significant rise in the dam height reduction rate is observed at the end of the breach, which is due to the overall failure of the residual dam.
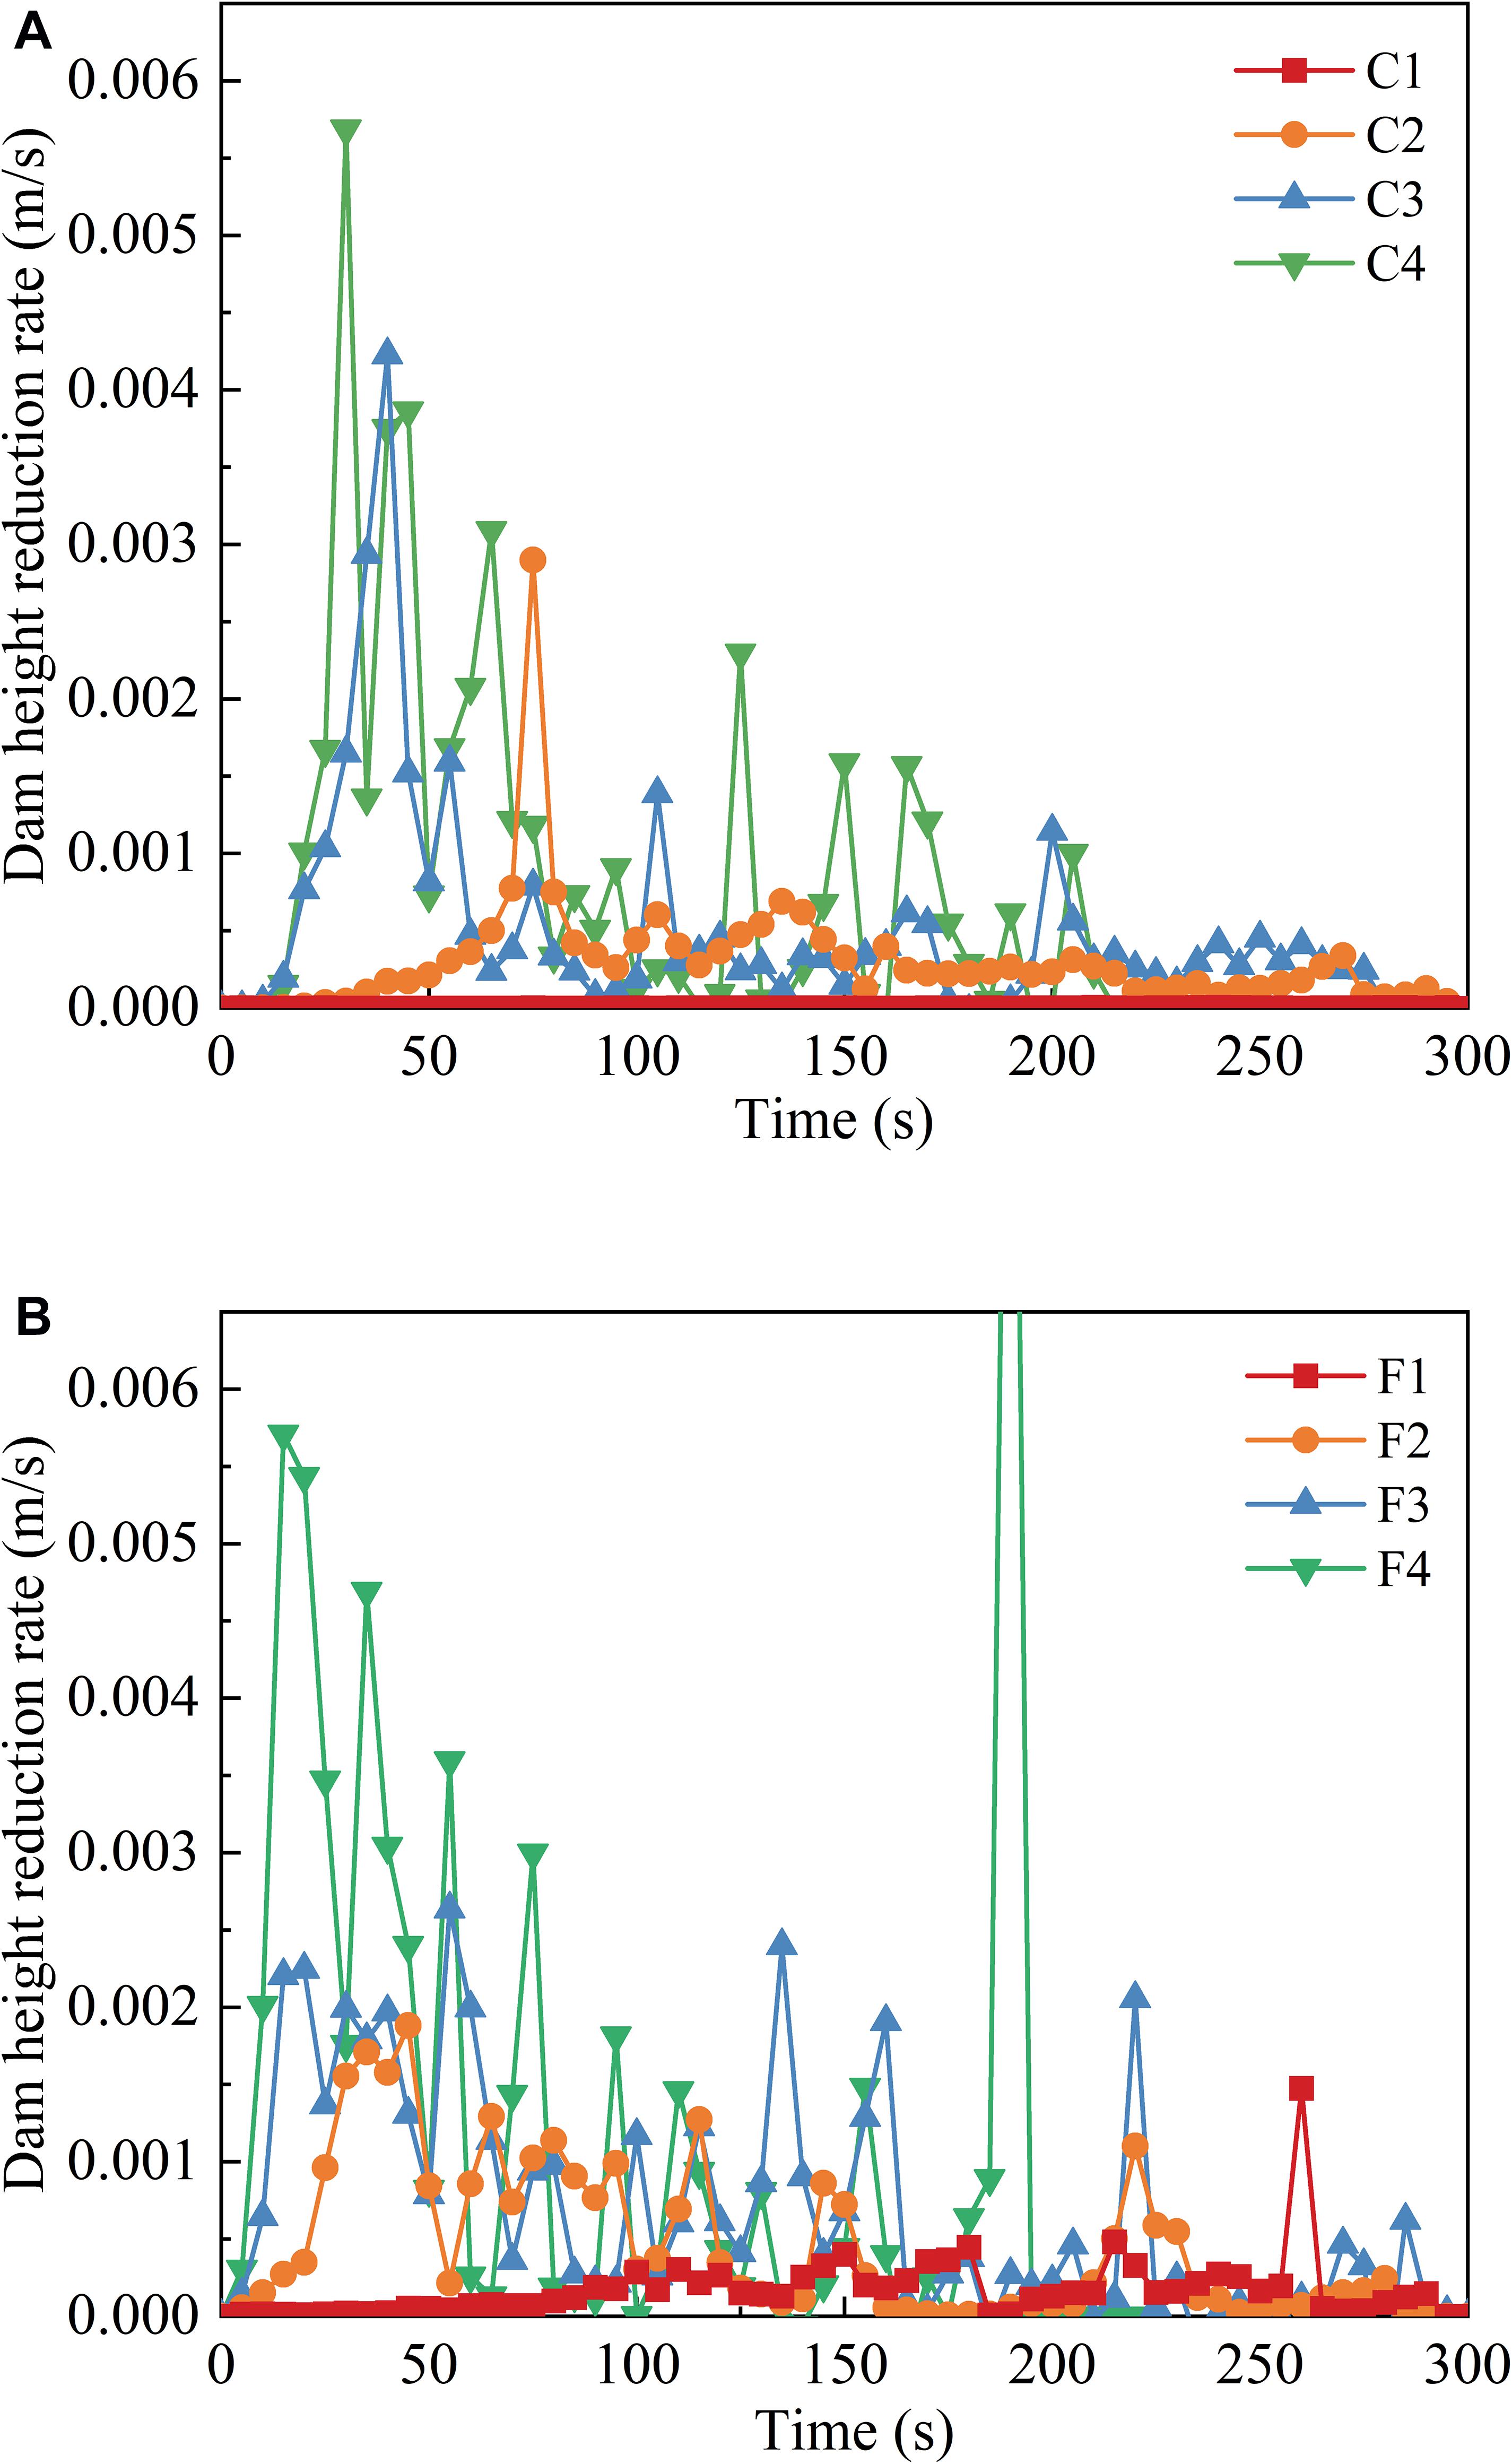
Figure 11. Evolution process of the dam height reduction rate: (A) for unsize coarse-grained landslide dams; (B) for wide size range fine-grained landslide dams.
Application and Limitation
Apparently, the landslide dam breach is a coupling sequence of breach flow and landslide dam (Zhong et al., 2018). In this study, the proposed improved coupled DEM-CFD method is innovatively used to simulate the longitudinal breach process of landslide dams. The advantage of DEM is allowed to model loose landslide dam material through discontinuous particles. The improved coupled DEM-CFD method cannot only fully consider the soil-water coupling mechanism, but also reproduce the development process of breach flow with free water surface evolution, which is conducive to understanding the landslide dam breach mechanism.
Although dimensionless parameters have been used to guide the design of the model configuration, the landslide dam breach mechanism from this research is inevitably constrained by the spatial and time scales. This is mainly due to the limitation of current computational efficiency, which also leads to the landslide dam materials used in this research are still distributed in a relatively narrow range. A landslide dam on-site can contain a wide range of sediment sizes, from clay, sand to gravel (Costa and Schuster, 1988; Korup, 2002), and would lead to a dramatic increase of the particle number in the DEM modeling. In this research, the influence of cohesive clay on the dam breaching process is ignored, so the results inevitably bear uncertainty. Despite these uncertainties and limitations, the landslide dam breach mechanism as illustrated in this research still offers valuable insights for the understanding of disaster evolution. Further research on this topic will be the improvement of calculation speed by Message Passing Interface (MPI) parallelization and comprehensive analyses of the landslide dam breach process based on real cases.
Conclusion
In this work, the improved coupled DEM-CFD method is developed to simulate the landslide dam breach process. Besides, a virtual sphere model is proposed to overcome the computational instability caused by the particle size close to the mesh size. The longitudinal breach process of the landslide dam is simulated with different dam materials and inflow discharges, the breaching phases of landslide dams are proposed according to the dam morphological evolution, and the breach characteristics are revealed from both macroscopic and microcosmic scales.
The simulation shows that the landslide dam breach process can be identified as four phases: surface flow erosion, backward erosion, head-cut erosion, and water and sediment rebalance or complete breach. This is different from the classification based on hydrological characteristics (Zhou et al., 2019), but it can better reflect the characteristics of the longitudinal morphological evolution of the landslide dam. The normal contact force, tangential contact force and particle-fluid interaction force during the breach process have been evaluated. During the surface flow erosion, the particle-fluid interaction force increases due to the appearance of the overtopping flow. In addition, the rotation trend of particles caused by the breach flow leads to an increase in the normal contact force. The head-cut erosion is the main breach phase of the landslide dam, and the obvious increases in the breach flow velocity at the dam crest is captured in this stage. This can accelerate the dam breach and cause a rapid decrease in the normal contact force, tangential contact force and particle-fluid interaction force. The failure at the dam crest in the head-cut erosion phase is dominated by small-scale collapse and leads to the dam height reduction rate fluctuates with time. From the view of energy, the total energy of the landslide dam continues to attenuate with the continuous loss of dam material during the breach process. The inflow discharge can significantly increase the erosion capacity of the breach flow, thereby accelerating the dam breaching and significantly reducing the residual landslide dam height. The presence of fine particles can slow down the downstream slope during the breach process and reduce the residual dam height.
Data Availability Statement
The original contributions presented in the study are included in the article/supplementary material, further inquiries can be directed to the corresponding author/s.
Author Contributions
D-YL: methodology, investigation, and writing-original draft. D-FZ and T-KN: conceptualization, supervision, funding acquisition, writing-review, and editing. HW and Y-QS: validation and visualization. All authors contributed to the article and approved the submitted version.
Funding
This research was supported by the National Natural Science Foundation of China (42077272, 51879036, and 51579032). We gratefully acknowledge this support.
Conflict of Interest
HW was employed by the company Zhejiang Huadong Construction Corporation Limited.
The remaining authors declare that the research was conducted in the absence of any commercial or financial relationships that could be construed as a potential conflict of interest.
References
Anderson, T. B., and Jackson, R. (1967). Fluid mechanical description of fluidized beds: equations of motion. Ind. Eng. Chem. Fundam. 6, 527–539. doi: 10.1021/i160024a007
ASCE/EWRI Task Committee on Dam/Levee Breaching (2011). Earthen embankment breaching. J. Hydraul. Eng. 137, 1549–1564. doi: 10.1061/(asce)hy.1943-7900.0000498
Bovis, M. J., and Jakob, M. (2000). The July 29, 1998, debris flow and landslide dam at capricorn creek, mount meager volcanic complex, southern coast mountains, British Columbia. Can. J. Earth. Sci. 37, 1321–1334. doi: 10.1139/e00-042
Cao, Z., Yue, Z., and Pender, G. (2011). Landslide dam failure and flood hydraulics. Part I: experimental investigation. Nat. Hazards 59, 1003–1019. doi: 10.1007/s11069-011-9814-8
Casagli, N., Ermini, L., and Rosati, G. (2003). Determining grain size distribution of the material composing landslide dams in the Northern Apennines: sampling and processing methods. Eng. Geol. 69, 83–97. doi: 10.1016/S0013-7952(02)00249-1
Chang, D.-S., and Zhang, L.-M. (2010). Simulation of the erosion process of landslide dams due to overtopping considering variations in soil erodibility along depth. Nat. Hazards Earth. Syst. Sci. 10, 933–946. doi: 10.5194/nhess-10-933-2010
Chang, D.-S., Zhang, L.-M., Xu, Y., and Huang, R.-Q. (2011). Field testing of erodibility of two landslide dams triggered by the 12 May Wenchuan earthquake. Landslides 8, 321–332. doi: 10.1007/s10346-011-0256-x
Chen, S.-C., Lin, T.-W., and Chen, C.-Y. (2015). Modeling of natural dam failure modes and downstream riverbed morphological changes with different dam materials in a flume test. Eng. Geol. 188, 148–158. doi: 10.1016/j.enggeo.2015.01.016
Costa, J. E., and Schuster, R. L. (1988). The formation and failure of natural dams. Geol. Soc. Am. Bull. 100, 1054–1068. doi: 10.1130/0016-76061988100<1054:TFAFON<2.3.CO;2
Cundall, P. A., and Strack, O. D. L. (1980). A discrete numerical model for granular assemblies. Geotechnique 30, 331–336. doi: 10.1680/geot.1980.30.3.331
Dai, F.-C., Lee, C.-F., Deng, J.-H., and Tham, L.-G. (2006). The 1786 earthquake-triggered landslide dam and subsequent dam-break flood on the Dadu River, southwestern China. Geomorphology 73, 277–278. doi: 10.1016/j.geomorph.2005.06.011
Dang, C., Cheng, Z., and Liu, J. (2008). Model test of debris flow dam break (in Chinese). J. Catastrophology 23, 15–19.
Davies, T. R., Manville, V., Kunz, M., and Donadini, L. (2007). Modeling landslide dambreak flood magnitudes: case study. J. Hydraul. Eng. 133, 713–720. doi: 10.1061/(asce)0733-94292007133:7(713)
Dhungana, P., and Wang, F. (2020). Relationship between seepage water volume and total suspended solids of landslide dam failure caused by seepage: an experimental investigation. Geoenvironmental Disasters 7:13. doi: 10.1186/s40677-020-0144-6
Di Felice, R. (1994). The voidage function for fluid-particle interaction systems. Int. J. Multiph. Flow 20, 153–159. doi: 10.1016/0301-9322(94)90011-6
Hirt, C. W., and Nichols, B. D. (1981). Volume of fluid (VOF) method for the dynamics of free boundaries. J. Comput. Phys. 39, 201–225. doi: 10.1016/0021-9991(81)90145-5
Ibrahim, A., and Meguid, M. A. (2020). Coupled flow modelling in geotechnical and ground engineering: an overview. Int. J. Geosynth. Gr. Eng. 6:39. doi: 10.1007/s40891-020-00223-0
Jiang, X. (2019). Laboratory experiments on breaching characteristics of natural dams on sloping beds. Adv. Civ. Eng. 2019:5064093. doi: 10.1155/2019/5064093
Jiang, X., Cui, P., Wang, Z., and Heng, W. (2016). Experiments investigation on longitudinal breaching of natural dam. J. Sichuan. Univ. 48, 38–44. doi: 10.15961/j.jsuese.2016.04.006
Jiang, X., Wörman, A., Chen, P., Huang, Q., and Chen, H. (2020). Mechanism of the progressive failure of non-cohesive natural dam slopes. Geomorphology 363:107198. doi: 10.1016/j.geomorph.2020.107198
Kloss, C., Goniva, C., Hager, A., Amberger, S., and Pirker, S. (2012). Models, algorithms and validation for opensource DEM and CFD-DEM. Prog. Comput. Fluid. Dyn. 12, 140–152. doi: 10.1504/PCFD.2012.047457
Korup, O. (2002). Recent research on landslide dams-A literature review with special attention to New Zealand. Prog. Phys. Geogr. 26, 206–235. doi: 10.1191/0309133302pp333ra
Korup, O. (2004). Geomorphometric characteristics of New Zealand landslide dams. Eng. Geol. 73, 13–35. doi: 10.1016/j.enggeo.2003.11.003
Li, D., Nian, T., Wu, H., Wang, F., and Zheng, L. (2020). A predictive model for the geometry of landslide dams in V-shaped valleys. Bull. Eng. Geol. Environ. 79, 4595–4608. doi: 10.1007/s10064-020-01828-5
Li, L., and Zhang, G. (2018). A unified formula of sediment incilient velocity on slope (in Chinese). J. Yangtzw. River. Sci. Res. Inst. 35, 13–17.
Li, Y., Hu, W., Wasowski, J., Zheng, Y.-S., and McSaveney, M. (2021). Rapid episodic erosion of a cohesionless landslide dam: insights from loss to scour of Yangjia Gully check dams and from flume experiments. Eng. Geol. 208:105971. doi: 10.1016/j.enggeo.2020.105971
Link, J. M., Cuypers, L. A., Deen, N. G., and Kuipers, J. A. M. (2005). Flow regimes in a spout-fluid bed: a combined experimental and simulation study. Chem. Eng. Sci. 60, 3425–3442. doi: 10.1016/j.ces.2005.01.027
Nian, T., Wu, H., Chen, G., Zheng, D. F., Zhang, Y. J., Li, D. Y., et al. (2018). Research progress on stability evaluation method and disaster chain effect of landslide dam (in Chinese). Chin. J. Rock. Mech. Eng. 37, 1796–1812. doi: 10.13722/j.cnki.jrme.2017.1655
Nian, T., Wu, H., Li, D., Zhao, W., Takara, K., Zheng, D. F., et al. (2020). Experimental investigation on the formation process of landslide dams and a criterion of river blockage. Landslides 17, 2547–2562. doi: 10.1007/s10346-020-01494-4
Nian, T., Wu, H., Takara, K., Dongyang, L., and Zhang, Y. (2021). Numerical investigation on the evolution of landslide-induced river blocking using coupled DEM-CFD. Comput. Geotech. 134:104101. doi: 10.1016/j.compgeo.2021.104101
Ouyang, C., An, H., Zhou, S., Wang, Z., Su, P., Wang, D., et al. (2019). Insights from the failure and dynamic characteristics of two sequential landslides at Baige village along the Jinsha River, China. Landslides 16, 1397–1414. doi: 10.1007/s10346-019-01177-9
Peng, M., and Zhang, L.-M. (2012). Breaching parameters of landslide dams. Landslides 9, 13–31. doi: 10.1007/s10346-011-0271-y
Rubinow, S. I., and Keller, J. B. (1961). The transverse force on a spinning sphere moving in a viscous fluid. J. Fluid. Mech. 11, 447–459. doi: 10.1017/S0022112061000640
Saffman, P. G. (1965). The lift on a small sphere in a slow shear flow. J. Fluid. Mech. 22, 385–400. doi: 10.1017/S0022112065000824
Sattar, A. M. A. (2014). Gene expression models for prediction of dam breach parameters. J. Hydroinformatics 16, 550–571. doi: 10.2166/hydro.2013.084
Schuster, R. L., and Costa, J. E. (1986). “Perspective on Landslide Dams,” in Landslide Dams: Processes, Risk, and Mitigation. Proceedings of a Session in Conjunction with the ASCE Convention, ed. R. L. Schuster (New York, NY: ASCE), 1–20.
Shen, D., Shi, Z., Peng, M., Zhang, L. M., and Jiang, M. (2020). Longevity analysis of landslide dams. Landslides 17, 1797–1821. doi: 10.1007/s10346-020-01386-7
Shi, Z.-M., Zheng, H.-C., Yu, S.-B., Peng, M., and Jiang, T. (2018). Application of CFD-DEM to investigate seepage characteristics of landslide dam materials. Comput. Geotech. 101, 23–33. doi: 10.1016/j.compgeo.2018.04.020
Utili, S., Zhao, T., and Houlsby, G. T. (2015). 3D DEM investigation of granular column collapse: evaluation of debris motion and its destructive power. Eng. Geol. 186, 3–16. doi: 10.1016/j.enggeo.2014.08.018
Wang, F., Dai, Z., Okeke, C. A. U., Mitani, Y., and Yang, H. (2018). Experimental study to identify premonitory factors of landslide dam failures. Eng. Geol. 232, 123–134. doi: 10.1016/j.enggeo.2017.11.020
Wang, G., Wang, Y., Liu, L., and Wang, D. (2015). Reviewed on barrier dam and simulation on dam breach (in Chinese). Yellow River. 37, 1–7. doi: 10.3969/j.issn.1000-1379.2015.09.001
Wu, H., Nian, T., Chen, G., Zhao, W., and Dongyang, L. (2020). Laboratory-scale investigation of the 3-D geometry of landslide dams in a U-shaped valley. Eng. Geol. 265:105428. doi: 10.1016/j.enggeo.2019.105428
Xiangang, J., Jiahua, H., Yunwei, W., Zhipan, N., Fenghui, C., Zuyin, Z., et al. (2018). The influence of materials on the breaching process of natural dams. Landslides 15, 243–255. doi: 10.1007/s10346-017-0877-9
Xu, Q., Fan, X.-M., Huang, R.-Q., and Westen, C. V. (2009). Landslide dams triggered by the Wenchuan Earthquake, Sichuan Province, south west China. Bull. Eng. Geol. Environ. 68, 373–386. doi: 10.1007/s10064-009-0214-1
Zhang, K., Wang, Z.-Y., Liu, H.-X., and Yu, G.-A. (2011). Effect of knickpoint development in controlling the stability of the landslide dam(in Chinese). Mt. Res. 29, 474–482. doi: 10.16089/j.cnki.1008-2786.2011.04.008
Zhang, L., Xiao, T., He, J., and Chen, C. (2019). Erosion-based analysis of breaching of Baige landslide dams on the Jinsha River, China, in 2018. Landslides 16, 1965–1979. doi: 10.1007/s10346-019-01247-y
Zhao, J., and Shan, T. (2013). Coupled CFD-DEM simulation of fluid-particle interaction in geomechanics. Powder Technol. 239, 248–258. doi: 10.1016/j.powtec.2013.02.003
Zhao, T., Dai, F., and Xu, N. (2017). Coupled DEM-CFD investigation on the formation of landslide dams in narrow rivers. Landslides 14, 189–201. doi: 10.1007/s10346-015-0675-1
Zhao, T., Houlsby, G. T., and Utili, S. (2014). Investigation of granular batch sedimentation via DEM–CFD coupling. Granul. Matter. 16, 921–932. doi: 10.1007/s10035-014-0534-0
Zhong, Q., Chen, S., and Shan, Y. (2020). Prediction of the overtopping-induced breach process of the landslide dam. Eng. Geol. 274:105709. doi: 10.1016/j.enggeo.2020.105709
Zhong, Q., Wu, W., Chen, S., and Wang, M. (2016). Comparison of simplified physically based dam breach models. Nat. Hazards 84, 1385–1418. doi: 10.1007/s11069-016-2492-9
Zhong, Q.-M., Chen, S.-S., Mei, S.-A., and Cao, W. (2018). Numerical simulation of landslide dam breaching due to overtopping. Landslides 15, 1183–1192. doi: 10.1007/s10346-017-0935-3
Zhou, G. G.-D., Zhou, M., Shrestha, M. S., Song, D., Choi, C. E., Cui, K. F. E., et al. (2019). Experimental investigation on the longitudinal evolution of landslide dam breaching and outburst floods. Geomorphology 334, 29–43. doi: 10.1016/j.geomorph.2019.02.035
Keywords: landslide dam, dam breaching, DEM-CFD, volume of fluid, erosion process
Citation: Li D-y, Zheng D-f, Wu H, Shen Y-q and Nian T-k (2021) Numerical Simulation on the Longitudinal Breach Process of Landslide Dams Using an Improved Coupled DEM-CFD Method. Front. Earth Sci. 9:673249. doi: 10.3389/feart.2021.673249
Received: 27 February 2021; Accepted: 12 April 2021;
Published: 29 April 2021.
Edited by:
Jia-wen Zhou, Sichuan University, ChinaReviewed by:
Qiming Zhong, Nanjing Hydraulic Research Institute, ChinaTao Zhao, Brunel University London, United Kingdom
Copyright © 2021 Li, Zheng, Wu, Shen and Nian. This is an open-access article distributed under the terms of the Creative Commons Attribution License (CC BY). The use, distribution or reproduction in other forums is permitted, provided the original author(s) and the copyright owner(s) are credited and that the original publication in this journal is cited, in accordance with accepted academic practice. No use, distribution or reproduction is permitted which does not comply with these terms.
*Correspondence: De-feng Zheng, ZGVmZW5nemhlbmdAbG5udS5lZHUuY24=; Ting-kai Nian, dGtuaWFuQGRsdXQuZWR1LmNu