 Ruiyu Zhao
 Bin Chen
 Xiangde Xu
- State Key Laboratory of Severe Weather, Chinese Academy of Meteorological Sciences, Beijing, China
Evidence has indicated an overall wetting trend over the Three-Rivers Headwater Region (TRHR) in the recent decades, whereas the possible mechanisms for this change remain unclear. Detecting the main moisture source regions of the water vapor and its increasing trend over this region could help understand the long-term precipitation change. Based on the gauge-based precipitation observation analysis, we find that the heavy precipitation events act as the main contributor to the interannual increasing trend of summer precipitation over the TRHR. A Lagrangian moisture tracking methodology is then utilized to identify the main moisture source of water vapor over the target region for the boreal summer period of 1980–2017, with focus particularly on exploring its change associated with the interannual trend of precipitation. On an average, the moisture sources for the target regions cover vast regions, including the west and northwest of the Tibetan Plateau by the westerlies, the southwest by the Indian summer monsoon, and the adjacent regions associated with the local recycling. However, the increased interannual precipitation trend over the TRHR could be largely attributed to the enhanced moisture sources from the neighboring northeastern areas of the targeted region, particularly associated with the heavy precipitation events. The increased water vapor transport from the neighboring areas of the TRHR potentially related to the enhanced local hydrological recycling over these regions plays a first leading role in the recent precipitation increase over the TRHR.
Introduction
The Three-Rivers Headwater Region (TRHR), located at the high-altitude region of the Tibetan Plateau (TP), acts as the “Asian water tower” (Immerzeel et al., 2010; Xu et al., 2014; Yao et al., 2017), which supplies considerable water for many Asian major rivers, including the Yellow, Yangtze, and Lantscang (as shown in Figure 1A). The TRHR is considered to be more vulnerable to extreme weather events since it is under the influences of the South Asian monsoon, East Asian monsoon, and mid-latitude westerlies (Xi et al., 2018; Sun et al., 2019).
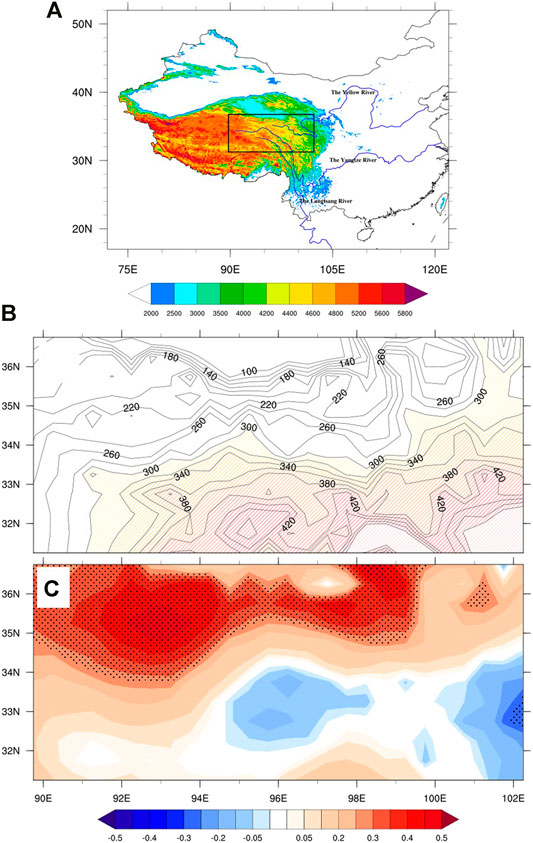
FIGURE 1. (A) The topographical distribution (color shaded, unit in m) with the height exceeding 2000 m. (B) The climatology of the summer seasonal mean (June, July, and August) precipitation during the period of 1980–2017 over the TRHR (unit in mm). The shaded area represents precipitation exceeding 330 mm; (C) The trend of annual summer precipitation over the TRHR calculated from the gauge-based precipitation from 1980 to 2017 (unit in mm yr−1). The observed station precipitation data are based on the gridded daily precipitation observation data with a spatial resolution of 0.25° × 0.25°.
During the past decades, the whole TRHR was getting wetter under the global climate change (Li et al., 2010; Gao et al., 2014). The annual precipitation overall shows an increasing trend, even though the precipitation in the TRHR exhibits spatial heterogeneity (Liang et al., 2013; Yi et al., 2013; Tong et al., 2014; Sun et al., 2018). In this context, the exploration of the nature of long-term trend and reasons behind increasing precipitation over the TRHR has become a hotspot of the academic community because of its societal ramifications ( Yang et al., 2014; Wang et al., 2018; Gao et al., 2019).
Generally, a large amount of water vapor supply has been regarded as a priority for precipitation formation (Gimeno et al., 2012; Wang et al., 2018). Knowledge about the origin of water vapor that produces the rainfall over a target region could promote a better understanding of the long-term precipitation trend (Stohl and James 2004; Gimeno et al., 2012; Wang et al., 2018). It can be speculated that the increased precipitation in the TRHR could be associated with more water vapor supply, from either the internal sources or external moisture origins (Gao et al., 2014). The identification of the moisture origins in the TRHR and its change thereby merit further exploration.
Based on the above consideration, two questions will be discussed in this study: 1) What is the relative importance of different categories of precipitation that contributed to the long-term changes of summer precipitation over the TRHR? 2) What is the relationship between the change in moisture sources and the interannual trend of summer precipitation in the TRHR?
Data and Methods
Data
The daily observed rainfall data with a spatial resolution of 0.25° × 0.25° across mainland China are derived from more than 2,400 gauge stations by the National Meteorological Information Center of the China Meteorological Administration (NMIC/CMA). These observed precipitation data have been extensively utilized to explore the characteristics of the precipitation multi-scale spatiotemporal variation over the vast East Asian monsoon region (Shen et al., 2010; Zhang et al., 2021).
To conduct the Lagrangian modeling, the European Center for Medium-Range Weather Forecasts reanalysis (ERA)–Interim data are adopted as the meteorological fields to force the Lagrangian model. The meteorological fields contained in the ERA-Interim data are in the 60 hybrid model levels from the surface layer to 0.1 hPa, at a spatial resolution of 0.75° × 0.75° and 6-hour time step. Further details of ERA-Interim can be found in the reference section (Dee et al., 2011).
Lagrangian Model and its Configuration
The FLEXPART model (FLEXIBLE PARTicle dispersion model) version V9.0 was used to carry out the multiyear simulations to produce the datasets for further moisture source diagnosis. This Lagrangian model has been widely utilized for a large amount of research on air mass and water vapor transport, particularly for the identification of moisture sources ( Sodemann et al., 2008; Drumond et al., 2011; Drumond et al., 2019; Gimeno et al., 2012; Sun and Wang, 2014).
To start with, the model divides the whole column atmosphere over the Asian monsoon region (−15–60°N and 0–160°E) into approximately 2 million air parcels of constant mass (roughly equals 1.12 × 1,012 kg), which are advected freely by the three-dimensional winds during the simulation. The model integrates from 15 April to 15 September for each boreal summer. Eventually, a 6-hourly Lagrangian simulation output dataset, including three-dimensional positions, specific humidity, and temperature, is then constructed for each air parcel for the period of 1980–2017.
Method for Water Vapor Source Diagnosis
Considering that the high values of long-term summer precipitation trend are mainly located in the northwestern TRHR (Figure 1C), the target region is defined as the area within 32.5°N–36°N and 80.5°E–92.5°E. To estimate the source of the water vapor, all air parcels that reached the target region in each time interval (6 h) during the modeling period are first selected and then tracked backward in time of 10 days, which approximately equals to the residence time of the water vapor in the atmosphere (Numaguti, 1999). A database of trajectories entering into this target region is then constructed first. Thus, the changes in the specific humidity (q) along each air particle within the time step (t) can be expressed as e−p = m (dq/dt), where m is the mass of the individual air particle and (e−p) is the evaporation-minus-precipitation. By adding (e−p) for all the particles over the entire atmospheric column for all the resident air parcels, we obtained the surface fresh water flux (E−P), where E and P are the rates of evaporation and precipitation, respectively. We track (E−P) from the target region backwards in time along the trajectories. The sources of water vapor are recognized as the regions in which the evaporation exceeds the precipitation, that is, (E−P)> 0. Then, the moisture source fields from all backward air parcels are linearly interpolated to a regular grid with 1.0° × 1.0° spatial resolution. Eventually, the climatology of well-resolved 6-hourly trajectory-based moisture uptake fields for the TRHR is constructed.
Definition of Extreme Precipitation Indices
In this study, eight extreme precipitation indices of ETCCDI (Expert Team on Climate Change Detection and Indices) were selected to characterize the precipitation anomalies over the TRHR (Table 1), which are defined and utilized commonly as the precipitation indices to study the extreme precipitation events (Karl, 1999; Peterson et al., 2001; Sillmann et al., 2013).
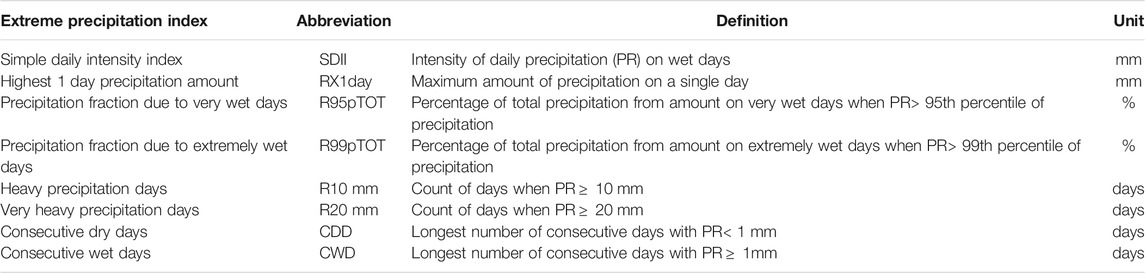
TABLE 1. Definition of extreme precipitation indices.
Results and Discussion
The Interannual Trend of Summer Precipitation Over the TRHR
The climatological seasonal mean of summer precipitation over the TRHR calculated from the NMIC/CMA dataset for the period of 1980–2017 is shown in Figure 1B. It is not surprising that the distributions of the precipitation are less spatially uniform over this region due to its large spatial extent of a high-elevation terrain. The values of precipitation decrease from the southeast to northwest over the TRHR. This spatial pattern of summer rainfall reflects that the precipitation over the TRHR is mainly modulated by the water vapor conveyed by the low-latitudinal atmospheric flows associated with the Indian and Eastern Asian summer monsoon (Yao et al., 2013; Pan et al., 2018; Lai et al., 2021).
The corresponding interannual trend of precipitation over the TRHR is shown in Figure 1C. It is worth noting that a wide range of the south–southeast TRHR shows a negative trend, indicating that precipitation over these regions decreased for the past decades. However, the TRHR shows a general wetting trend, with the positive values mainly located north of 34°N, particularly in the northwestern TRHR, illustrating a significant increase in precipitation. Taking the TRHR as a whole region, the summer precipitation over the target region is increased due to the contribution from the northwestern part (as shown in Figure 1C, black dots). This interannual precipitation trend of the “south-drier and north-wetter” spatial pattern is consistent with the wetting trend in the TRHR, which have been demonstrated in previous studies, for example, by Yi et al. (2013) and Liu et al. (2019).
The Association of Interannual Trend With the Precipitation Intensity Anomalies
To further understand the characteristics of interannual trend of precipitation over the TRHR, we computed the time series of the extreme precipitation indices for the period of 1980–2017, together with the corresponding interannual precipitation (Figure 2). In general, most indices exhibited an increasing trend during the past decades. There are six indices (SDII, RX1day, R99Ptot, R10mm, R20mm, and CWD), which agree with the variation of regional summer precipitation in the TRHR on an interannual scale, with the correlation coefficient between each index and regional average precipitation being 0.658, 0.543, 0.628, 0.814, 0.628, and 0.549, respectively. Note that the variation of consecutive dry days (CDDs), which exhibits a small decreasing trend, is obviously in contrary to the variation of summer precipitation. This result is similar to the work by Xi et al. (2018), in which they argued that the consecutive dry days in the TRHR have been declining significantly in the past 50 years, with a decadal variability of 4.5 days per 10 years.
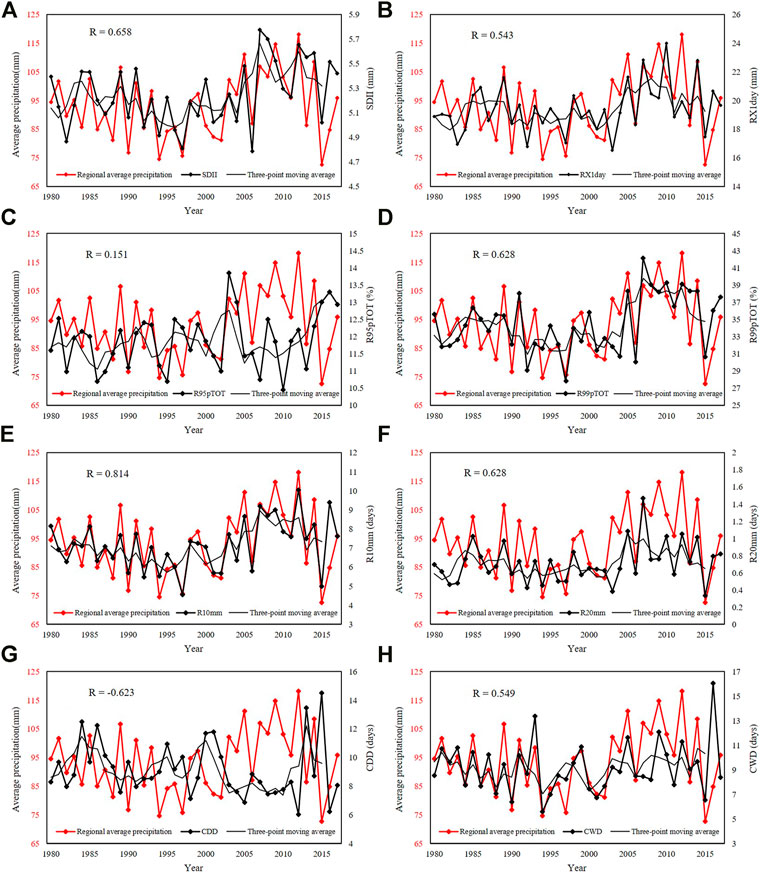
FIGURE 2. The interannual variation of the eight extreme precipitation indices (A) SDII; (B) RX1 days; (C) R95dTOT; (D) R99pTOT; (E) R10mm; (F) R20mm; (G) CDD; and (H) CWD; the meaning of abbreviation for the six indices is shown in Table 1, together with the regional mean precipitation over the TRHR. The correlation coefficient between each index and the regional average precipitation is shown in the left corner, and seven indices have passed the 0.05 significance level except for the precipitation fraction due to wet days (R95pTOT).
It is noteworthy that, on the interannual scale, the daily intensity index (SDII), precipitation fraction due to extremely wet days (R99pTOT), and very heavy precipitation days (R20mm) are closely correlated with the summer rainfall, with the correlation coefficients being 0.658, 0.628, and 0.628 (Figures 2A,D,F), respectively. In particular, the correlation coefficient between the heavy precipitation days and the summer mean precipitation in the TRHR reaches the highest value of 0.814 (Figure 2E). These results indicate that the interannual trend of summer precipitation over the TRHR may be related to the variation in the intensity and frequency of heavy and extreme precipitation events. In other words, the increase in the heavy and extreme heavy precipitation is potentially playing a critical role in the increasing summer mean rainfall.
To further demonstrate the impacts of changes in the intensity of precipitation events on the interannual trend of summer precipitation, we divided the precipitation events into four categories based on their daily values, namely, drizzle, little rain, moderate rain, and heavy rain (Table 2). We calculated the correlation coefficient, on the interannual scale, between the precipitation days of each category and the summer mean precipitation over the TRHR. Note that the annual precipitation is only positively correlated with days of heavy rain (PR
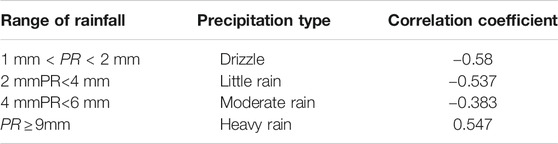
TABLE 2. Correlation coefficient between precipitation intensity and the four categories of precipitation events on the interannual scale.
Summer Seasonal Mean of Evaporative Moisture Sources and its Long-Term Trend
Figure 3A exhibits the climatology of the summer seasonal mean moisture uptakes, that is, integrated (E - P)> 0 of days 1–10, together with the vertically integrated water vapor flux (vector). This result shows the average of all gains of moisture over the previous 10 days prior to reaching the TRHR. It can be found that those regions with the largest values, that is, the most influential moisture origins are largely located in India and its northwestern areas. This result partly agrees with previous researches by Sun and Wang (2014) and Chen et al. (2016), indicating that the moisture contribution from the adjacent regions could play a critical role in the water vapor supply and the remote moisture uptake from oceanic areas could be precipitated out during their period of transport. The regions over the Arabian Sea, the northern India, and even the tropical Indian Ocean are ranked as the second moisture source. It can be deduced that this spatial pattern of the moisture sources is consistent with the pattern of water vapor transport (Figure 3A, vector), indicating that the atmospheric vapor reaching the TRHR is mainly shaped by the Indian summer monsoon and the westerlies (Yao et al., 2013; Pan et al., 2018).
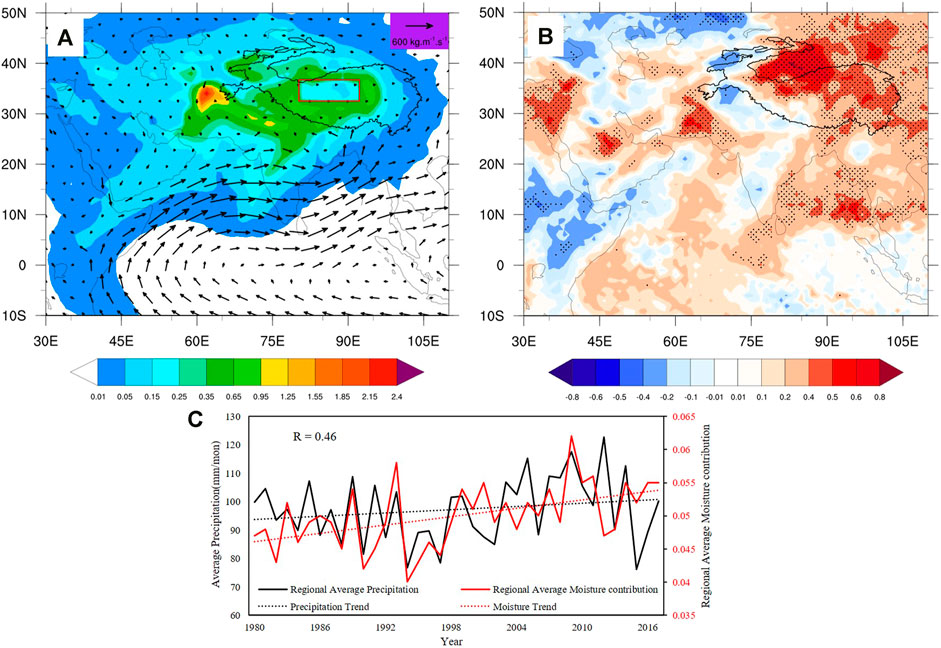
FIGURE 3. (A) Horizontal spatial distribution of the climatological (1980–2017) integrated moisture source contribution, that is, the Lagrangian E-P diagnosed (E - P)> 0 of days 1–10 for the TRHR (units: millimeter per day). The vector indicates the vertically integrated water vapor flux derived from the ERA-Interim (JJA, 1980–2017, vector, in kgm−1 s−1). The target region for the water sources diagnosis is defined as the continental areas within the red rectangular box (32.5°N–36°N and 80.5°E–92.5°E. (B) The interannual trend of the moisture contribution in the THRR for the period of 1980–2017. The dotted areas indicated the regions that exceeded the 0.05 significance level with the Student’s t test. (C) Time series of interannual regional average moisture sources (red) and the regional average summer mean precipitation (black) in the TRHR. The dot lines indicate the long-term trend, respectively.
Note that the objective of this study was to identify the moisture sources of external water vapor reaching the TRHR; thus, only those air parcels penetrating the target region in each time interval (6 h) during the boreal summer are selected and then were tracked backward for 10 days to diagnose the moisture sources, which gave rise to a sharp discontinuity of moisture sources contribution at the edges of the target region box. However, a fraction of selected air parcels could return and reside in the target region by backward tracking, due to the influence of complicated local atmospheric circulations. These multi-boundary–crossing air parcels with increased humidity will result in the target region itself as a contributor, but with less significance.
The variation of the regional summer precipitation and moisture contribution represents a good consistency on the interannual scale (Figure 3C). Both the precipitation and moisture contribution show a similar trend, with turning points from decreasing to increasing occurring in the middle and late 1990s (1995). The Pearson correlation coefficient is 0.46, with a significance level above 0.05. This result shows that the moisture contribution for the precipitation could capture the variation of precipitation, which in turn indicates that the exploration on the variability of moisture sources could reveal the underlying mechanism of the regional precipitation evolution.
The interannual trend of moisture sources over the TRHR is illustrated in Figure 3B, with the dotted areas indicating the regions with a trend exceeding the 0.05 significance level with the Student’s t test. The areas with positive values cover vast regions, including but not limited to southern Asia, the Arabian Sea, the Bay of Bengal, the northern India, and the vast areas of the Indian Ocean. However, the region that exhibits a significant increase in the trend is mainly centered on the adjacent regions to the TRHR itself, where contributions from the targeted west–northeastern TRHR increased the most in intensity.
Above results emphasize the importance of the local water vapor recycling, particularly in the surrounding area on the northwest side of the TRHR and the Tibetan Plateau. It has been evidenced that the strengthening of the local water vapor recycling process may correlate with the evapotranspiration over the TRHR, which in turn facilitated the growth of vegetation (Gan et al., 2020). Studies have further pointed out that the enhancement of the westerlies over the mid-latitude may be one reason for the continuous increase in moisture around the northwestern side of the plateau ( Liao et al., 2018). Thus, we can deduce that the neighboring west–northeastern region supplies a large amount of extra moisture for increased precipitation, with the increased moisture contribution from the ocean playing a secondary role, although the water vapor from this region has a strong correlation with the interannual variation of precipitation in the TRHR (Chen et al., 2012; Zhang et al., 2019).
Interannual Trend Comparison for Different Categories of Precipitation Events
We have demonstrated that the interannual trend of summer rainfall over the TRHR could be largely attributed to the enhancement of the heavy and extreme precipitation events, both in frequency and intensity. However, a question remains to be elucidated: Do the areas with larger values of the interannual trend for the moisture contribution for summer mean precipitation coincide spatially with that for the heavy precipitation events?
To address this question, we utilized different percentiles as thresholds to categorize the precipitation events based on the daily observed regional precipitation. The details on the threshold selection and their corresponding magnitude of daily rainfall are listed in Table 3. The moisture sources for the different category precipitation events are calculated individually (Figure not shown). The moisture sources for the different category precipitation events show a similar spatial pattern, which is analogous to that for the summer mean precipitation, with a large amount of moisture originating from the vaster regions, such as the Central Asia, Indian Peninsula, the Bay of Bengal, and to the northwest of target region. However, differences exist among the different types of precipitation events. For example, the cross-equatorial moisture transport from the Indian Ocean is getting more significant for the heavy and extreme, comparing to the light and moderate (shown in Supplementary Figure S2). Further examination of the differences in the moisture sources for five categories of precipitation is beyond the scope of the present study.

TABLE 3. Determination of five precipitation types.
Figure 4 shows the interannual trend of the moisture contribution, which is the same as Figure 3B, but corresponds to the five predefined category precipitation events. Obviously, the spatial distributions of the interannual trend for the moisture uptake vary significantly among the five categories of precipitation events. For the dry days, the long-term trend is less significant. For other types of precipitation events (i.e., the light, moderate, heavy, and extremely heavy), the interannual trend gets higher and higher. With the strength of precipitation intensity, the moisture contribution from the remote moisture sources originating from the tropical to subtropical Arabian Sea corridor gets more significant, which means that the external regions as the moisture uptake fields play an important role in the enhancement of rainfall. However, when we compare the results shown in Figure 3B to that in Figure 4, it is easy to find that the spatial pattern of the interannual trend in the moisture contribution by the heavy rainfall events coincides roughly with that for the overall moisture contribution, with the majority of the positive high-value areas centered over the areas neighboring the TRHR, including the northeastern and western parts of the Tibetan Plateau. This result affirms again that the heavy but not the extreme rainfall events play a first leading role in the increased interannual trend in the summer mean precipitation in the target region.
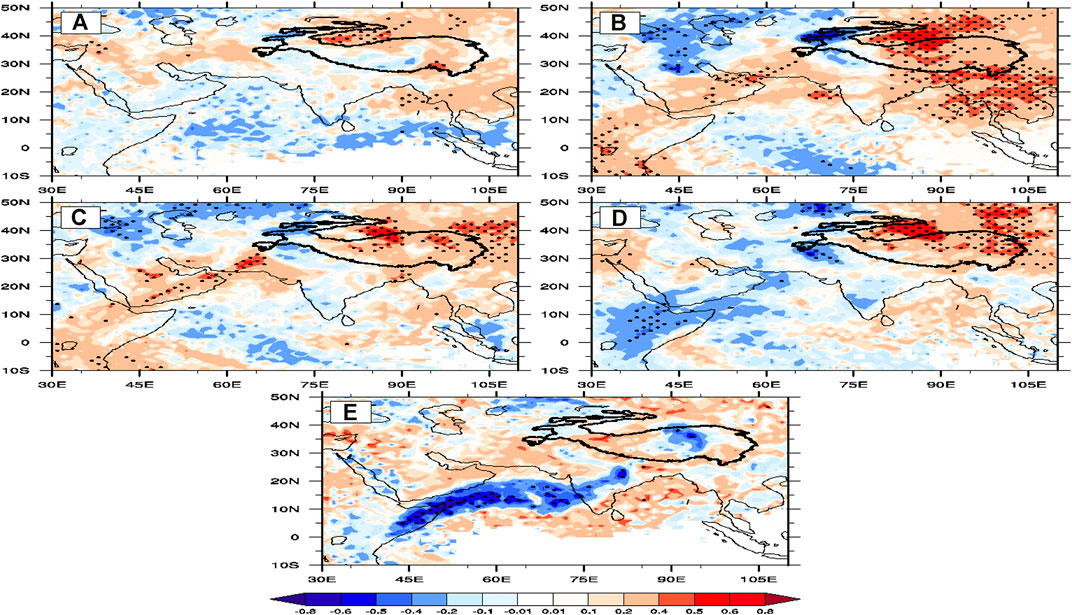
FIGURE 4. Distribution for the interannual trend of the Lagrangian E-P diagnosed moisture sources contribution of the five category precipitation events for (A) dry, (B) light, (C) moderate, (D) heavy, and (E) extremely heavy, respectively. The dotted regions are significant at the 95% confidence level.
For a specific region, the trend of the moisture uptakes contribution to the rainfall events could be impacted by two factors: 1) the increases in large-scale water vapor transport and 2) the enhancement of local evaporation over the source origins (Gimeno et al., 2012). As shown in Figure 4, except for the relatively small contribution from the remote moisture sources, the increase of water vapor for the heavy rainfall events from the adjacent northwestern land areas are particularly significant, indicating the importance of the local recycling process of the plateau itself to the interannual trend of heavy precipitation over the TRHR.
Conclusion
During the recent decades, the Three-Rivers Headwater Region (TRHR) experiences an overall wetting trend, whereas the reasons it behind remain elusive. In order to shed some light on this issue, we examined the association of interannual trend of the summer mean precipitation with the anomalies in the intensity of precipitation. We also identified the remote evaporative moisture uptakes contributed to the rainfall over the TRHR during a summer period of 38 years (1980–2017), with focus particularly on the association of moisture sources with the variability in precipitation intensity. The main results of the present study could be summarized as follows:
1) The results show that the TRHR has been getting wetter during the recent decades, especially with the obvious increasing precipitation in the northwest of the TRHR. The interannual variation of the observed summer precipitation agrees well with the integrated diagnosed moisture sources, indicating that the changes of precipitation could be well captured by the moisture sources.
2) The moisture sources for the TRHR cover vast regions, including but not limited to the west and northwest of the Tibetan Plateau by the westerlies, and that from the southwest by the Indian summer monsoon. Compared to the contribution of oceanic moisture sources, the terrestrial moisture supply is more important. Also, the increased interannual precipitation trend over the TRHR could be largely attributed to the enhanced moisture sources from the neighboring northeastern areas of the target region.
3) Further analysis shows that enhanced moisture contribution highly resemble the heavy precipitation events. Thus, the enhanced water vapor transport conveyed by the heavy precipitation events from the neighboring areas of the TRHR, which is largely associated with the intensified land surface evaporation or local hydrological recycling over these regions, in combination with enhanced transport from low-latitude oceanic regions, play a critical role in supplying vapor for the recent summer rainfall increase over the TRHR.
The results of this research shed some light on the characteristics of the rainfall and underlying mechanisms associated with its interannual trend. However, due to the complexity of the land surface conditions and atmospheric circulations over the target area, the relationship between the changes in the atmospheric moisture uptakes and atmospheric circulations over the TRHR is elusive, which invites further studies.
Data Availability Statement
The raw data supporting the conclusions of this article will be made available by the authors, without undue reservation.
Author Contributions
BC designed the research. RZ and XX performed the data analysis, prepared all figures, and led the writing of the article. All the authors discussed the results and commented on the article. All authors contributed to the article and approved the submitted version.
Funding
This research is supported by the National Natural Science Foundation of China (Grant Nos. 91937301), the National Key Research and Development Program on Monitoring, Early Warning and Prevention of Major Natural Disaster (2018YFC1506001), S&T Development Fund of CAMS (2020KJ017 and 2021KJ021), the Open Research of the State Key Laboratory of Severe Weather, Chinese Academy of Meteorological Sciences (2019LASW-A04) and the second pilot project of the Second Tibetan Plateau Comprehensive Scientific Research Project (I07-T01-2018-06/06-JH).
Conflict of Interest
The authors declare that the research was conducted in the absence of any commercial or financial relationships that could be construed as a potential conflict of interest.
Publisher’s Note
All claims expressed in this article are solely those of the authors and do not necessarily represent those of their affiliated organizations, or those of the publisher, the editors and the reviewers. Any product that may be evaluated in this article, or claim that may be made by its manufacturer, is not guaranteed or endorsed by the publisher.
Supplementary Material
The Supplementary Material for this article can be found online at: https://www.frontiersin.org/articles/10.3389/feart.2021.674037/full#supplementary-material
References
Chen, B., and Xiang-De, X. (2016). Spatiotemporal Structure of the Moisture Sources Feeding Heavy Precipitation Events over the Sichuan Basin. Int. J. Climatol 36, 3446–3457. doi:10.1002/joc.4567
Chen, B., Xu, X.-D., Yang, S., and Zhang, W. (2012). On the Origin and Destination of Atmospheric Moisture and Air Mass over the Tibetan Plateau. Theor. Appl. Climatol 110 (3), 423–435. doi:10.1007/s00704-012-0641-y
Dee, D. P.Coauthors (2011). The ERA-Interim Reanalysis: Configuration and Performance of the Data Assimilation System. Q. J. Roy Meteorol. Soc 137, 553–597. doi:10.1002/qj.828
Drumond, A., Nieto, R., and Gimeno, L. (2011). On the Contribution of the Tropical Western Hemisphere Warm Pool Source of Moisture to the Northern Hemisphere Precipitation through a Lagrangian Approach. J. Geophys. Res. 116, D00Q04. doi:10.1029/2010jd015397
Drumond, A., Stojanovic, M., Nieto, R., Vicente-Serrano, S. M., and Gimeno, L. (2019). Linking Anomalous Moisture Transport and Drought Episodes in the IPCC Reference Regions. Bull. Amer. Meteorol. Soc. 100, 1481–1498. doi:10.1175/bams-d-18-0111.1
Gan, H. H., Jin, X. M., Zhang, X. C., and Zhu, X. Q. (2020). Temporal and Spatial Distribution of Evapotranspiration in Three-Rivers Headwater Region. Geoscience. doi:10.19657/j.geoscience.1000-8527.2020.075 (in chinese)
Gao, J., Yao, T., Masson-Delmotte, V., Steen-Larsen, H. C., and Wang, W. (2019). Collapsing Glaciers Threaten Asia's Water Supplies. Nature 565, 19–21. doi:10.1038/d41586-018-07838-4
Gao, Y., Cuo, L., and Zhang, Y. (2014). Changes in Moisture Flux over the Tibetan Plateau during 1979-2011 and Possible Mechanisms. J. Clim. 27, 1876–1893. doi:10.1175/JCLI-D-13-00321.1
Gimeno, L.Coauthors (2012). Oceanic and Terrestrial Sources of continental Precipitation. Rev. Geophys. 50 (5), 3647–3649. doi:10.1029/2012rg000389
Immerzeel, W. W., van Beek, L. P. H., and Bierkens, M. F. P. (2010). Climate Change Will Affect the Asian Water Towers. Science 328, 1382–1385. doi:10.1126/science.1183188
Karl, T. R., Nicholls, N., and Ghazi, A. (1999). CLIVAR/GCOS/WMO Workshop on Indices and Indicators for Climate Extremes Workshop Summary. Climatic Change 42 (1), 3–7. doi:10.1007/978-94-015-9265-9_2
Lai, H.-W., Chen, H. W., Kukulies, J., Ou, T., and Chen, D. (2021). Regionalization of Seasonal Precipitation over the Tibetan Plateau and Associated Large-Scale Atmospheric Systems. J. Clim. 34 (7), 2635–2651. doi:10.1175/jcli-d-20-0521.1
Li, L., Yang, S., Wang, Z. X., Zhu, X., and Tang, H. (2010). Evidence of Warming and Wetting Climate over the Qinghai-Tibet Plateau. Arctic, Antarctic, Alpine Res. 42, 449–457. doi:10.1657/1938-4246-42.4.449
Liang, L., Li, L., Liu, C., and Cuo, L. (2013). Climate Change in the Tibetan Plateau Three Rivers Source Region: 1960-2009. Int. J. Climatol. 33, 2900–2916. doi:10.1002/joc.3642
Liao, Q., Xiao, T. G., and Jin, R. H. (2018). Analysis on Inter-annual Variation of East Asian Subtropical Westerly Jet. J. Chengdu Univ. Inf. Technol. 33 (01), 68–77. doi:10.16836/j.cnki.jcuit.2018.01.013
Liu, X. Q., Wu, Z. Z., Liu, Y. S., Zhao, X. Z., Rui, Y., and Zhang, J. (2019). Spatial-temporal Characteristics of Precipitation from 1960 to 2015 in the Three River’ Headstream Region, Qinghai, China. ACTA GEOGRAPHIC SINICA 74 (9). (In Chinese). doi:10.11821/dlxb201909008
Numaguti, A. (1999). Origin and Recycling Processes of Precipitating Water over the Eurasian Continent: Experiments Using an Atmospheric General Circulation Model. J. Geophys. Res. 104, 1957–1972. doi:10.1029/1998jd200026
Pan, C., Zhu, B., Gao, J., Kang, H., and Zhu, T. (2018). Quantitative Identification of Moisture Sources over the Tibetan Plateau and the Relationship between thermal Forcing and Moisture Transport. ClimDynam, 1–16. doi:10.1007/s00382-018-4130-6
Peterson, T. C., Folland, C., Gruza, G., Hogg, G., Mokssit, A., and Plummer, N. (2001). Report on the Activities of the Working Group on Climate Change Detection and Related Rapporteurs 1998-2001, World Meteorological Organization Rep. Geneva, Switzerland: WCDMP-47, WMO-TD 1071, 143.
Shen, Y., Xiong, A., Wang, Y., and Xie, P. (2010). Performance of High-Resolution Satellite Precipitation Products over China. J. Geophys. Res. 115, D02114. doi:10.1029/2009JD012097
Sillmann, J., Kharin, V. V., Zhang, X., Zwiers, F. W., and Bronaugh, D. (2013). Climate Extremes Indices in the CMIP5 Multimodel Ensemble: Part 1. Model Evaluation in the Present Climate. J. Geophys. Res. Atmos. 118, 1716–1733. doi:10.1002/jgrd.205020310.1002/jgrd.50203
Sodemann, H., Schwierz, C., and Wernli, H. (2008). Interannual Variability of Greenland winter Precipitation Sources: Lagrangian Moisture Diagnostic and North Atlantic Oscillation Influence. J. Geophys. Res. 113, D03107. doi:10.1029/2007jd008503
Sun, B., and Wang, H. (2019). Enhanced Connections between Summer Precipitation over the Three-River-Source Region of China and the Global Climate System. Clim. Dyn. 52 (5), 3471–3488. doi:10.1007/s00382-018-4326-9
Sun, B., and Wang, H. (2018). Interannual Variation of the spring and Summer Precipitation over the Three River Source Region in China and the Associated Regimes. J. Clim. 31, 7441–7457. doi:10.1175/JCLI-D-17-0680.1
Sun, B., and Wang, H. (2014). Moisture Sources of Semiarid Grassland in China Using the Lagrangian Particle Model FLEXPART. J. Clim. 27, 2457–2474. doi:10.1175/jcli-d-13-00517.1
Tong, L., Xu, X., Fu, Y., and Li, S. (2014). Wetland Changes and Their Responses to Climate Change in the "Three-River Headwaters" Region of China since the 1990s. Energies 7 (4), 2515–2534. doi:10.3390/en7042515
Wang, X., Pang, G., and Yang, M. (2018). Precipitation over the Tibetan Plateau during Recent Decades: a Review Based on Observations and Simulations. Int. J. Climatol 38, 1116–1131. doi:10.1002/joc.5246
Xi, Y., Miao, C., Wu, J., Duan, Q., Lei, X., and Li, H. (2018). Spatiotemporal Changes in Extreme Temperature and Precipitation Events in the Three-Rivers Headwater Region, china. J. Geophys. Res. Atmos. 123, 5827–5844. doi:10.1029/2017jd028226
Xu, X., Zhao, T., Lu, C., Guo, Y., Chen, B., Liu, R., et al. (2014). An Important Mechanism Sustaining the Atmospheric “Water tower” over the Tibetan Plateau. Atmos. Chem. Phys. 14, 11287–11295. doi:10.5194/acp-14-11287-2014
Yang, K., Wu, H., Qin, J., Lin, C., Tang, W., and Chen, Y. (2014). Recent Climate Changes over the Tibetan Plateau and Their Impacts on Energy and Water Cycle: A Review. Glob. Planet. Change 112, 79–91. doi:10.1016/j.gloplacha.2013.12.001
Yao, T. D., Xue, Y. K., Chen, D. L., Chen, F. H., Thompson, L., Cui, P., et al. (2017). Recent Third Pole’s Rapid Warming Accompanies Cryospheric Melt and Water Cycle Intensification and Interactions between Monsoon and Environment: Multi-Disciplinary Approach with Observation, Modeling and Analysis. B Am. Meteorol. Soc. 100 (3), 423–444. doi:10.1175/bams-d-17-0057.1
Yao, T., Masson-Delmotte, V., Gao, J., Yu, W., Yang, X., Risi, C., et al. (2013). A Review of Climatic Controls on δ18O in Precipitation over the Tibetan Plateau: Observations and Simulations. Rev. Geophys. 51, 525–548. doi:10.1002/rog.20023
Yi, X., Li, G., and Yin, Y. (2013). Spatio-temporal Variation of Precipitation in the Three-River Headwater Region from 1961 to 2010. J. Geogr. Sci. 23, 447–464. doi:10.1007/s11442-013-1021-y
Zhang, L., Li, X., Zheng, D., Zhang, K., Ma, Q., Zhao, Y., et al. (2021). Merging Multiple Satellite-Based Precipitation Products and Gauge Observations Using a Novel Double Machine Learning Approach. J. Hydrol. 594, 125969. doi:10.1016/j.jhydrol.2021.125969
Keywords: heavy precipitation, interannual trend, Three-Rivers headwater region, moisture sources, climate change
Citation: Zhao R, Chen B and Xu X (2021) Intensified Moisture Sources of Heavy Precipitation Events Contributed to Interannual Trend in Precipitation Over the Three-Rivers-Headwater Region in China. Front. Earth Sci. 9:674037. doi: 10.3389/feart.2021.674037
Received: 28 February 2021; Accepted: 25 May 2021;
Published: 26 July 2021.
Edited by:
Ming Luo, Sun Yat-Sen University, ChinaReviewed by:
Ronald Kwan Kit Li, The Chinese University of Hong Kong, ChinaQiang Liu, Beijing Normal University, China
Copyright © 2021 Zhao, Chen and Xu. This is an open-access article distributed under the terms of the Creative Commons Attribution License (CC BY). The use, distribution or reproduction in other forums is permitted, provided the original author(s) and the copyright owner(s) are credited and that the original publication in this journal is cited, in accordance with accepted academic practice. No use, distribution or reproduction is permitted which does not comply with these terms.
*Correspondence: Bin Chen, Y2hlbmJpbkBjbWEuZ292LmNu