 Eugene Rozanov1,2,3*
 Tatiana Egorova1,2
 Luca Egli1Arseniy Karagodin-Doyennel1,2
 Timofei Sukhodolov1,2,3Herbert Schill1Rene Stübi4Julian Gröbner1
- 1Physikalisch-Meteorologisches Observatorium Davos World Radiation Centre, Davos, Switzerland
- 2Institute for Atmospheric and Climate Science, Swiss Federal Institute of Technology Zurich, Zurich, Switzerland
- 3Faculty of Physics, Saint Petersburg State University, Saint Petersburg, Russia
- 4Federal Office of Meteorology and Climatology, MeteoSwiss, Payerne, Switzerland
The study investigates the representativeness of the total column ozone (TCO) measurements from the ground-based instruments located at the Arosa/Davos stations in Switzerland to analyze the global ozone layer behavior in the past and future. The statistical analysis of the satellite and model data showed a high correlation of the ground-based TCO data with the near-global and northern hemisphere annual mean TCO for the 1980–2018 period. Addition of the Arosa/Davos TCO data as a proxy to the set of standard explanatory variables for multiple linear regression analysis allows estimating the TCO behavior from 1926 up to the present day. We demonstrate that the real-time measurements and high homogeneity level of the Arosa/Davos TCO time series are also beneficial for quick estimates of the future ozone layer recovery.
Introduction
The local point ground-based measurements of atmospheric quantities are important as a part of global networks (e.g., Fioletov et al., 2008) and can also be used for the validation of satellite data (e.g., Loew et al., 2017) if they are representative of the time and space over the respective satellite footprint. The representativeness in this sense (Nappo et al., 1982) characterizes how the local measurements reflect the actual conditions in the adjacent location in time and space. This quantity can be estimated using different statistical approaches such as the Fourier transform, structure, or correlation functions (Nappo et al., 1982). For example, correlation analysis was applied by Schwarz et al. (2017) to address the representativeness of the local point measurement of the surface solar irradiance and their applicability for the satellite measurement validation. For some cases, the local point measurements provide unique data, which are not supported by a noticeable amount of other observation points. The exploitation of these data for the global analysis requires either pronounced homogeneity of the measured quantity over different instruments and periods or good representativeness of the measurements for the longer time or larger spatial scales. A classic example of this problem is the connection of the local climate parameters retrieved from the tree rings with the wider territory. Büntgen et al. (2017) used the correlation analysis and showed that the local tree ring data characterize well the temperature anomalies over most of Western Europe. Another example is the measurement of the long-lived species concentration from Jungfraujoch (e.g., Rinsland et al., 2012). In this case, the high spatial homogeneity of the long-lived species distributions justifies the application for the analysis of the halogen-containing ozone-depleting substances’ global trends. The time series of continuous total column ozone measurements over Arosa (latitude 46.7833°N, longitude 9.6667°E) since 1926 is one of a couple of unique data sets (Brönnimann et al., 2003) covering the early 20th century when anthropogenic hODS (halogen-containing ozone-depleting species) emissions were absent and the possible ozone and climate change can be caused by solar activity and anthropogenic emissions of greenhouse gases and tropospheric ozone precursors (Egorova et al., 2018). The knowledge of the past ozone trends is useful for understanding the background state of the ozone layer during the periods not disturbed by anthropogenic hODS. The modeling of climate change during this period is difficult because the connection between the solar spot number and solar irradiance has not been robustly established yet. Our model experiments (Egorova et al., 2018) suggested that solar irradiance forcing should be much higher during the early 20th century (and on centennial timescales in principle) than commonly accepted to successfully simulate the observed climate warming. This hypothesis can be supported or denied by the comparison of the simulated and observed total ozone over Arosa reflecting solar UV changes during the considered period (Egorova et al., 2020). Therefore, it will be interesting to compare the simulated and observed historical total ozone trends to investigate whether the Arosa time series are representative of the regional and global scales.
Even more interesting and important problem is the expected ozone recovery in the future related to the limitation of hODS emissions introduced by the Montreal Protocol and its Amendments (MPA). The current and projected states of the ozone recovery have been recently discussed by Solomon et al. (2016), Kuttippurath and Nair (2017), Pazmiño et al. (2018), Kuttippurath et al. (2018), and Dhomse et al. (2018). Although the recovery is already foreseen in the upcoming decades, a continuous evaluation of the current and future TCO and other species behavior remains very important to discover potential problems or apply additional measures to meet the declared aims of the MPA limitations.
Usually, the analysis of the ozone recovery state is slow due to the necessity to carefully evaluate and homogenize different sources of data (e.g., Ball et al., 2018; SPARC/IO3C/GAW et al., 2019), while the continuous point measurements can be a good tracker of the current situation. However, further analysis is necessary to establish how the local point measurements (like the Arosa/Davos TCO time series) can be applied for a fast diagnosis of the ozone recovery progress on a global scale. This investigation will be based on the reanalysis of the already available model results (Egorova et al., 2021; Sukhodolov et al., 2021) to determine ozone evolution until the end of the 21st century. Based on different realistic scenarios, these model results will be used to address the potential for detecting a future ozone recovery with the TCO data set obtained at Arosa/Davos and determine the timeframe required to statistically significantly establish the ozone recovery progress.
Thus, in the present study, we analyze the TCO time series over Arosa/Davos to establish its representativeness for the validation of satellite data and TCO behavior for other locations and space/timescales, retrieval of the global-scale ozone behavior in the past (1926–1980), and applicability of the Arosa/Davos data for the fast diagnosis of the future ozone layer recovery.
Data Description
Arosa/Davos Total Column Ozone Time Series
The longest continuous total column ozone time series worldwide started in 1926 at the Lichtklimatisches Observatorium Arosa, Switzerland. Since 2010, simultaneous measurements at Arosa and in the nearby valley of Davos have been ongoing, to support the transfer of the instrumentation to the Physikalisch-Meteorologisches Observatorium Davos and World Radiation Center (PMOD/WRC) at Davos (Stübi et al., 2017; Stübi et al., 2020). Figure 1 illustrates the TCO evolution during the measurement period as well as the exploited set of the instruments.
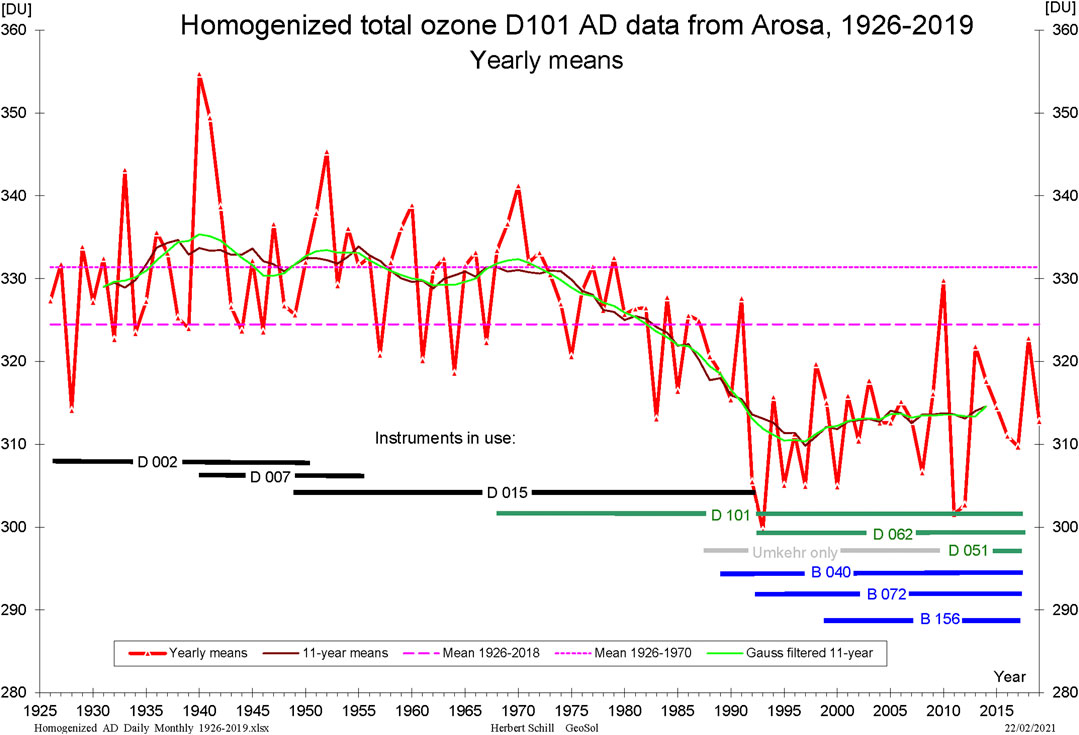
FIGURE 1. Homogenized total column ozone from Arosa, 1926 to 2019. The four Dobson spectroradiometers D002, D007, D015, and D101 have been used to produce this time series for the measurement period.
Due to a timespan of over 90 years, the Arosa/Davos time series is a unique data set of worldwide importance to the climate community and specifically, to the international ozone community. Stratospheric ozone depletion over midlatitudes was first observed using the total column ozone time series over Arosa due to its long measurement period extending back to pre-ozone depletion conditions, its high intrinsic homogeneity, and quality (Staehelin, 1998a; Staehelin, 1998b; Staehelin et al., 2018). As discussed by Staehelin et al. (2018) and Gröbner et al. (2021), the Arosa/Davos total ozone time series requires continuous efforts to homogenize the measurements across different instruments and periods to produce the required level of uncertainty to be used for the assessment of ozone changes and observe the eventual recovery of the ozone layer.
Ozone Multi-Sensor Reanalysis
The applicability of the Arosa/Davos TCO for the validation of satellite sensors is evaluated using ozone multi-sensor reanalysis version 2 (hereafter MSR2, van der A, et al., 2015) product available for download from http://www.temis.nl/protocols/O3global.html. The MSR2 data set contains long-term (1970–2019) total column ozone records constructed using the chemistry-transport model and assimilation of all available satellite and ground-based observations with Brewer and Dobson instruments. The result is represented as 6-hourly global ozone columns with 0.5 × 0.5 degrees horizontal resolution and forecast error fields and can be applied for case studies and trend analyses.
Historical Ozone Time Series
The evaluation of the Arosa/Davos TCO time series representativeness of the historical TCO evolution on the global scales is performed using HISTOZ.1.0 data set (Brönnimann et al., 2013). This data set consists of monthly mean data with about 4 × 4 degrees horizontal resolution and is based on a combination of the chemistry-climate model (CCM) simulations with the assimilation of historical ground-based TCO measurements performed at different stations including Arosa. The level of the Arosa data contribution is difficult to estimate, but it should not be crucial due to model domination on a global scale. The CCM runs are driven by relevant external forcing of climate processes such as solar and volcanic effects, greenhouse gases, ozone-depleting substances, sea surface temperatures, and quasi-biennial oscillation.
Atmosphere-Ocean-Aerosol-Chemistry-Climate Model SOCOL (Modeling Tool)
The evaluation of the Arosa/Davos TCO time series applicability for the fast analysis of the future global ozone recovery is performed using the results of the Atmosphere-Ocean-Aerosol-Chemistry-Climate Model (AOACCM) SOCOLv4.0 (hereafter SOCOLv4; Sukhodolov et al., 2021) runs in the framework of the SPARC CCMI initiative aimed at the projection of the TCO behavior until the end of the 21st century (Dhomse et al., 2018). These model results, which are based on one realistic scenario, are used here to address the potential for detecting a future ozone recovery using the data set obtained at Arosa/Davos with current and potentially new instrumentation. The data sets for the model SOCOLv4.0 are available by request from the corresponding author.
Regression Analysis and Proxy Data
For the evaluation of the TCO behavior on different time and space scales, we apply multiple linear regression analysis (hereafter MLR). The time series of the TCO (in DU) as a function of time (t) for every considered quantity is represented as:
In this version, the MLR model uses six explanatory variables. The applied routine considers the main drivers of the ozone layer variability such as solar irradiance (S), stratospheric aerosol loading (SA), El-Nino Southern oscillation (ENSO), quasi-biennial oscillation (QBO) at 30 and 50 hPa levels, and linear trend component reflecting greenhouse gases (GHG) increase. The solar irradiance variability is represented by the solar F10.7 index extracted from NASA/GSFC’s OMNI data set through OmniWeb (https://omniweb.gsfc.nasa.gov/form/dx1.html) or the CMIP6 forcing data set (Matthes et al., 2017) for the 1,850–2,100 period. The QBO is represented by the tropical zonal wind speed variability at 30 and 50 hPa levels. These data for 1953–2020 are available from the Freie Universität Berlin (http://www.geo.fu-berlin.de/en/met/ag/strat/produkte/qbo). For the past (before 1953), the QBO index from Brönnimann et al. (2007) is used. Starting from 2020, the QBO index is extracted from the equatorial zonal winds generated by the SOCOLv4.0 model. For the analysis, we use the ENSO 3.4 index which is available for the period 1850–2020 from the PSL NOAA website (https://psl.noaa.gov/gcos_wgsp/Timeseries/Data). The ENSO index for the future is calculated from the ocean temperature field used by the model SOCOLv4.0 for the simulations of the future ozone levels. Stratospheric aerosol loading for 1850–2020 was extracted from the CMIP6 data set (ftp://iacftp.ethz.ch/pub_read/luo) described by Kovilakam et al. (2020). The values of SA for the future period are kept constant at the 2020 level. The sensitivity coefficients (A, B, C, D, E, F, and G) are calculated using standard function REGRESS from the IDL package (https://www.l3harrisgeospatial.com/docs/regress.html). To remove the residual autocorrelation, a Cochrane–Orcutt procedure (Cochrane and Orcutt, 1949) is used in an iterative way. The sensitivity coefficients can be calculated for any grid cell as it was also done by Karagodin-Doyennel et al. (2021) or for any defined area such as global or hemispheric mean. Different time resolutions can be used; however, for the monthly mean, the input data should be de-seasonalized first. In this work, we mostly apply MLR for annual mean data.
Total Column Ozone Evolution During the Satellite Era
Representativeness of the Arosa/Davos Total Column Ozone for the Validation of Satellite Data
To evaluate the representativeness of the Arosa/Davos TCO for the validation of satellite data, we calculate the correlation coefficient and absolute difference between the monthly mean TCO at the Arosa/Davos site and MSR2 data for the closest grid cell (centered at 47°N, 9.5°E) over the 1980–2018 period. The results are illustrated in Figure 2.
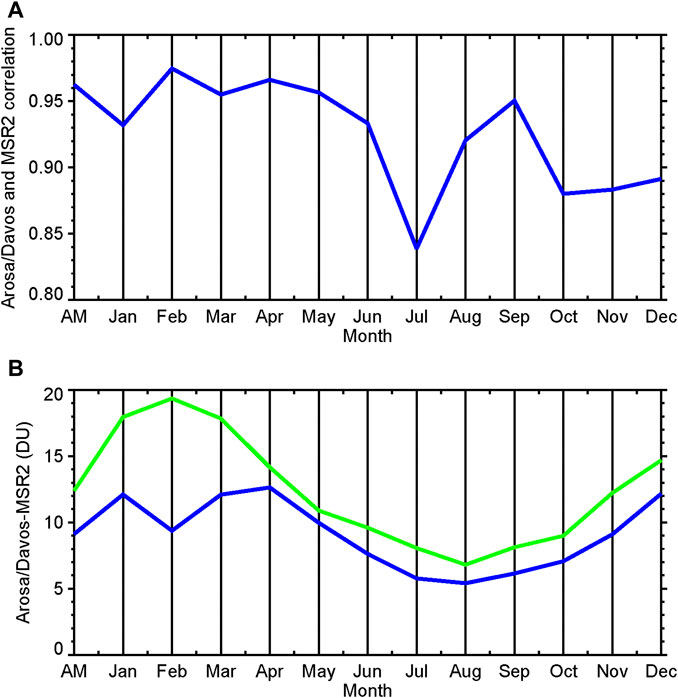
FIGURE 2. The correlation coefficient (A) and absolute difference (B) between the monthly mean total column ozone at Arosa and Davos sites and MSR2 data for the closest grid cell. The green line shows MSR2 data uncertainty. AM stands for annual mean.
The obtained correlations exceed 0.90 for eight months and 0.85 for 3 months. The lowest correlations occur in July (0.84) and during the early cold season (October–November). The deviations of up to 12 DU are larger than the uncertainties of the separate satellite data of 1% (around 3 DU) and are therefore due to the uncertainties of the MSR2 data set. The obtained results suggest that the Arosa/Davos TCO can be used for the validation of the satellite data for most of the months. However, some special attention should be paid to the validation of TCO during July and from October to December. The reasons for such an inhomogeneity are not clear and are probably related to some peculiarities of the observation conditions during these periods, i.e., meteorology. In the annual mean case, the correlation reaches 0.96.
Representativeness of the Arosa/Davos Total Column Ozone for Other Locations
To assess the representativeness of the Arosa/Davos TCO for other locations over the globe, we calculate correlation coefficients between the evolution of monthly mean TCO during the 1980–2019 period over Arosa/Davos and the other regions. The results for January, May, and the annual mean are shown in Figure 3. January and May are used because these months represent dynamically opposite conditions in the stratosphere.
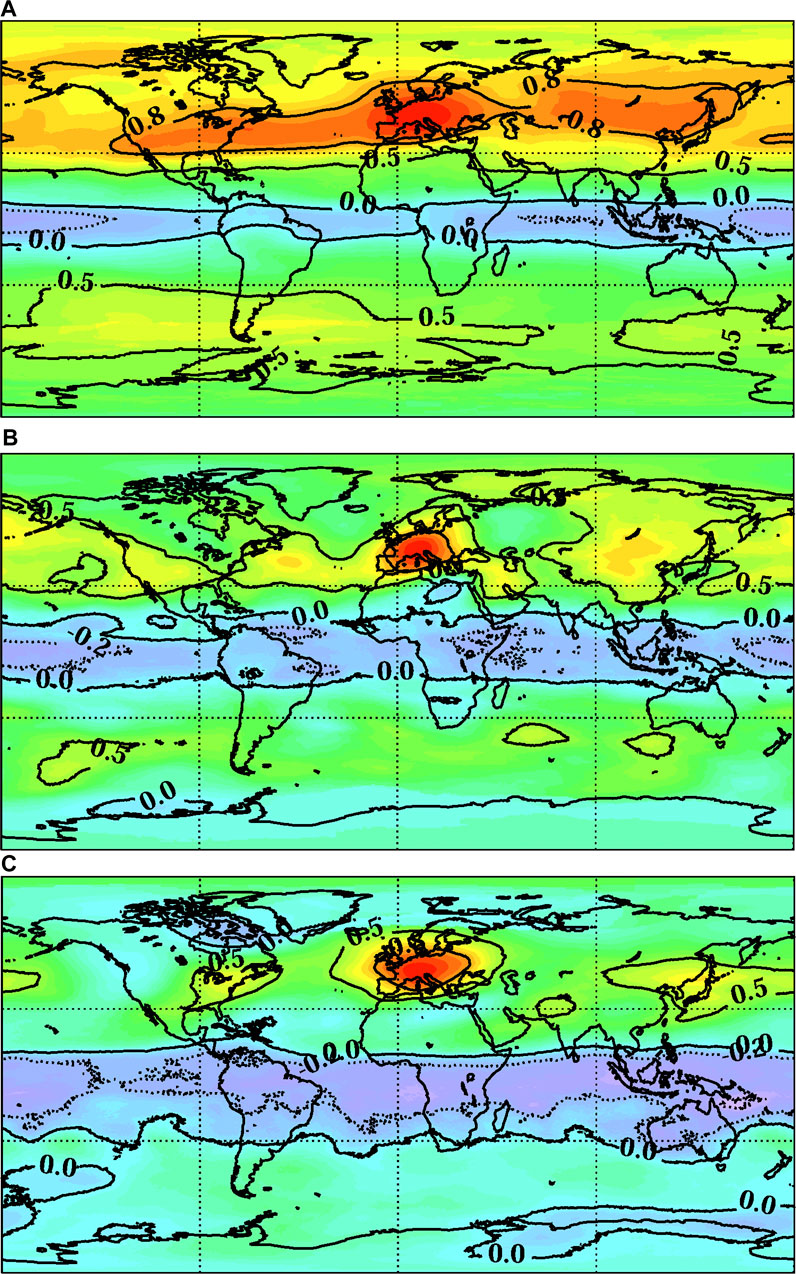
FIGURE 3. Correlation coefficients between the TCO over Arosa/Davos and other locations for the annual mean (A), January (B), and May (C).
During January (A), the TCO behavior at Arosa/Davos is rather close to the other European locations with correlations exceeding 0.8. This is explained by similar dynamical and chemical conditions over the areas adjacent to the Arosa/Davos location. More than 0.5 correlation is also observed for some other locations such as Eastern US, Russian Far East, China, and Japan. These areas are close to the location of the stratospheric ozone intrusion in the vicinity of Aleutian stratospheric high and further westward transport. However, the correlation is almost completely broken over the tropospheric high-pressure system over Siberia and Azorean islands. Tight correlation is kept for Europe in May; however, the area with the correlation exceeding 0.5 is extended and covers almost all northern middle latitudes. It reflects the shift from dynamically to chemically controlled conditions which are rather similar along latitudinal belts.
Correlation with the southern hemisphere remains very low in both months. The annual mean data reveal very good representativeness (the correlation coefficient exceeds 0.8) of the Arosa/Davos TCO for the northern and partially for the southern middle latitudes. The correlation for the tropical total ozone behavior is very small (less than 0.5 for all seasons and annual mean) and anticorrelated (negative correlation coefficient) around the equator. The sign of the correlation is not surprising because elevated total ozone over the midlatitudes is driven by the transport from the tropical lower stratosphere, and intensified transport would lead to an increase in midlatitudes and a decrease in the tropics. However, the correlation strength is different because over the middle northern latitudes in January transport processes dominate, while over the tropics, other forcing mechanisms (e.g., chemistry or convection) can also play a role.
Figure 4 illustrates the correlations between the Arosa/Davos TCO evolution during the considered 1980–2019 period and the hemispheric, the near-global (60°S-60°N), and the global mean total ozone. For the southern hemisphere, the correlation is calculated using values shifted by 6 months to get comparable seasons with the northern hemisphere. In general, the correlation in the southern hemisphere is low for all months and reaches only 0.6 for the annual mean values.
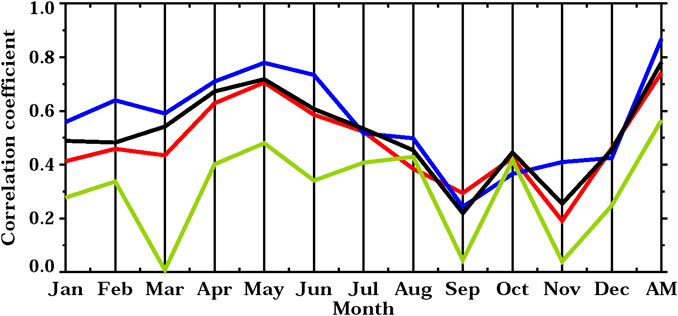
FIGURE 4. Correlation coefficients between the TCO over Arosa/Davos and near-global (red line), northern hemisphere (blue line), southern hemisphere (green line), and the global (black line) means.
The closest correlation to the Arosa/Davos TCO is observed during the winter/spring period for the northern hemisphere. The correlations with near-global and global means for this period are only slightly weaker. During the summer/fall period, the correlation drops to 0.4 and less. This seasonal behavior can be explained by different mechanisms dominating the ozone amount. The correlation is high during dynamically active periods when westerly transport connects Central Europe with hemispheric values. The low correlation takes place during dynamically quiet periods when the total ozone is mostly defined by chemical processes. The annual mean correlation is higher reaching 0.8 for the global and northern hemispheres and 0.6 for the southern hemisphere means. High correlation with annual mean values can be explained by similar mechanisms defining the TCO behavior on a global scale and over the northern midlatitudes. From the presented analyses, we can conclude that the Arosa/Davos TCO is a good proxy for global, near-global, or northern hemisphere mean total ozone and less so for the tropical and southern regions.
Using Arosa/Davos Total Column Ozone Data for the Reconstruction of the Global or Hemispheric Mean Total Column Ozone Behavior for the Recent Past
From the correlation analysis presented earlier, it follows that the Arosa/Davos TCO should well represent the annual mean values for the northern hemisphere and near-global means. Figure 5 illustrates the annual mean Arosa/Davos TCO evolution from 1979 to 2018 in comparison with the data averaged over the northern hemisphere and near-global mean.
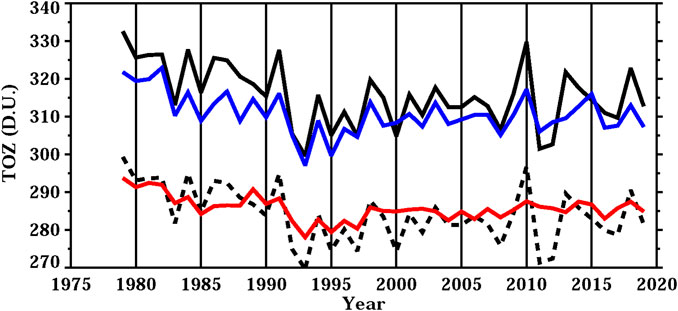
FIGURE 5. Annual mean TCO evolution from Arosa/Davos TCO measurements (black lines), near-global (red line), and northern hemisphere (blue line) means from the MSR2 data. The black dashed line shows Arosa/Davos TCO scaled by 0.9. The correlation coefficients are 0.74 for the near-global and 0.87 for the northern hemisphere means.
Figure 5 shows that the Arosa/Davos TCO evolution almost exactly coincides with the northern hemisphere mean showing steady ozone depletion until 1995 and rather flat evolution afterward. However, during 1983–1991, the local Arosa TCO measurements slightly overestimate the northern hemisphere mean and do not fully reproduce the interannual variability, and from 2011 to 2015, the Arosa time series shows much higher and shifted in time variability. As can be expected, the Arosa/Davos TCO is about 10% higher and much more variable than the near-global mean showing strong spikes in 1993 (after Mt. Pinatubo eruption due to a hemispheric asymmetry of the ozone signal (Aquila et al., 2013)) and 2011 (when the northern polar vortex was rather strong and persistent during the cold season (Hu and Xia, 2013)). The correlation coefficient between the near-global (northern hemisphere) means and Arosa/Davos TCO is 0.74 (0.87).
To understand the potential for the improvement of these quantities, we applied MLR analysis to the TCO variability during the recent past (1979–2018) and calculated sensitivity coefficients for all introduced earlier (see Regression Analysis and Proxy Data) independent proxies. The coefficients are calculated using the data for this period because of the availability of the satellite observations for considered regions (near-global and northern hemisphere means). The MLR analysis was applied to the quantities such as near-global and hemispheric means but not to all grid cells separately. Then we compared the observed near-global and northern hemisphere mean TCO with the reconstruction based on these proxies. The results are presented in Figures 6, 7 for the northern hemisphere and near-global means, respectively.
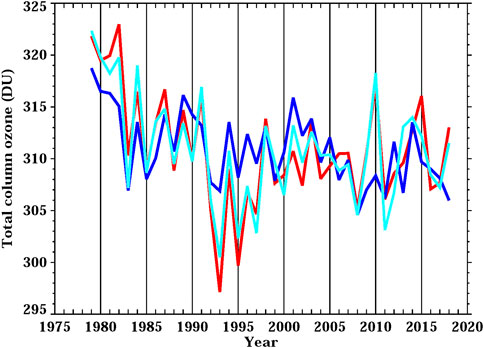
FIGURE 6. Evolution of the northern hemisphere mean TCO obtained from the MSR2 data (red line) and retrieved from proxies without (blue line) and with Arosa/Davos TCO as an additional proxy (light blue line). The correlation coefficients are 0.64 and 0.94 for the cases without and with Arosa/Davos TCO.
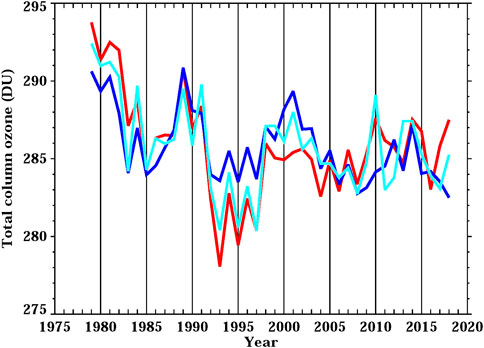
FIGURE 7. Evolution of near-global TCO obtained from the MSR2 data (red line) and retrieved from proxies without (blue line) and with Arosa/Davos TCO as an additional proxy (light blue line). The correlation coefficients are 0.68 and 0.89 for the cases without and with Arosa/Davos TCO.
The evolution of TCO averaged over the northern hemisphere retrieved from the set of explanatory variables described in Regression Analysis and Proxy Data agrees reasonably well (correlation coefficient is 0.64) with the reference data from MSR2. The contributions to the reconstructed TCO standard deviation are made by the trend component (2.0 DU), stratospheric aerosol loading (1.8 DU), solar irradiance (1.7 DU), quasi-biennial oscillation (QBO) at 50 (1.3 DU) and 30 hPa (0.9 DU) levels, and El-Nino southern oscillation (1.1 DU). However, the TCO decrease from 1980 to 1990 is not as pronounced as in MSR2 data. Moreover, the TCO depletion just after the Mt. Pinatubo eruption and high TCO in 2010 are not well captured. To improve the agreement, we add the H*TCO-AD(t) term, where TCO-AD(t) is Arosa/Davos total ozone data to the MLR formulation is the Regression Analysis and Proxy Data and recalculated all sensitivities. The utilization of the Arosa/Davos TCO time series as an additional proxy for the MLR analysis helps improve the agreement of the reconstructed and observed TCO behavior during these periods and increases the correlation from 0.64 to 0.94. Even though the Arosa/Davos TCO time series is not fully independent from other explanatory variables, its inclusion as an additional MLR proxy is justified by the absence of its strong correlation with other proxies (not shown). For example, the highest correlation of the Arosa/Davos data with ENSO is about 0.2.
Similar conclusions can be drawn for the near-global TCO. As in the previous case, using the Arosa/Davos TCO as an additional MLR proxy increases the correlation coefficient from 0.68 to 0.89 and improves the TCO behavior during several crucial periods (e.g., after major volcanic eruptions). The presented results allow considering the Arosa/Davos TCO data for the reconstruction of the past and future ozone trends.
Historical and Future Total Column Ozone Evolution
Historical Total Column Ozone Evolution
Availability of both the historical Arosa TCO and the proxy data allows reconstructing the evolution of TCO for the 1926–1980 period using the sensitivity coefficients obtained with MLR from the data for the 1980–2018 period. The obtained results are presented together with the HISTOZ data (Brönnimann et al., 2013) in Figures 8, 9 for the northern hemisphere and near-global means. The results for the northern hemisphere look rather surprising: HISTOZ TCO tends to rise until 1970 showing some variability related to the dynamics of the climate system. Similar variability is visible in the reconstructed data, but TCO evolution from MLR without Arosa has an obvious negative tendency dropping from 325 DU to 315 DU in 1980. This trend is explained by a generally negative trend of the TCO during the period used for MLR calculations and gives suspicious results (negative correlation) in comparison with HISTOZ. The application of the Arosa TCO as an additional proxy improves the correlation with HISTOZ. However, the analyzed period, in this case, is characterized by some TCO increase from 1926 to 1940 followed by rather flat behavior afterward.
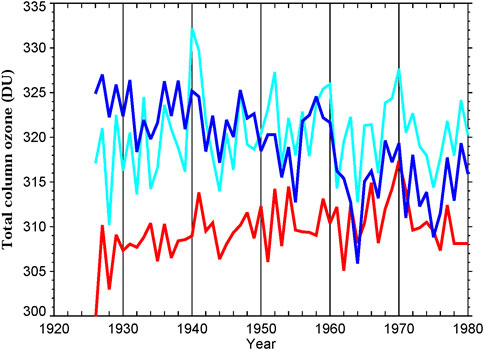
FIGURE 8. Evolution of the northern hemisphere mean TCO obtained from the HISTOZ data set (red line) and retrieved from proxies without (blue line) and with Arosa/Davos TCO as an additional proxy (light blue line). The correlation coefficients with HISTOZ data are −0.13 and 0.49 for the cases without and with Arosa/Davos TCO.
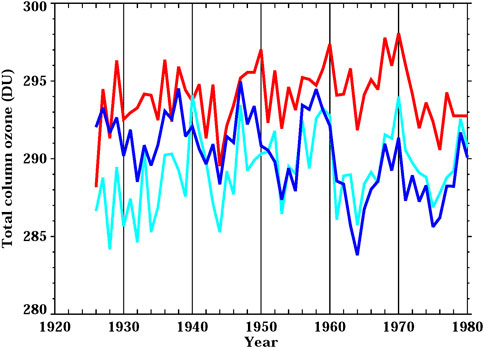
FIGURE 9. Evolution of the near-global mean TCO obtained from the HISTOZ data set (red line) and retrieved from proxies without (blue line) and with Arosa/Davos TCO as an additional proxy (light blue line). The correlation coefficients with HISTOZ data are 0.31 and 0.56 for the cases without and with Arosa/Davos TCO.
All data sets represent TCO decline after the Mt. Agung eruption in 1963, but the depletion is much more pronounced in the reconstruction based on the standard set of proxies. The situation is different for the near-global mean data. While HISTOZ TCO has the same tendencies as in the previous case, such as an increase from 1926 to 1970 and some depletion afterward, TCO evolution from MLR without Arosa has no negative trend and a higher correlation (0.31) with HISTOZ. The TCO evolution reconstructed using the Arosa data correlates much better (0.56) with HISTOZ and reveals a positive trend from 1926 to 1960. After 1960, two reconstructions show almost identical ozone depletion after the Mt. Agung eruption in 1963 and further drop after 1970, which can be related to the increasing of hODS emissions. The obtained results demonstrate that the past evolution of annual mean TCO can be successfully reproduced using MLR analysis amended by available local TCO measurements.
It is interesting to note that the positive TCO trend from 1926 to 1940 obtained by Egorova et al. (2020) using the CCM SOCOL-MPIOM driven by strong solar forcing is also visible in the reconstructed data. This fact can be interpreted as a support for a strong solar forcing (up to 4 W/m2 in total solar irradiance from 1900 to 1940) during the early 20th century discussed also in Egorova et al. (2018).
Future Total Column Ozone Evolution
The applicability of such an approach for the analysis of the ozone layer behavior in the future can be assessed using simulations with chemistry-climate models. The northern hemisphere and near-global mean TCO evolution during 2000–2094 simulated with the model SOCOLv4 and reconstructed from the proxies are presented in Figures 10, 11. For this analysis, Arosa/Davos data for the future were extracted from the model simulations. The reconstructed TCO for the northern hemisphere correlates extremely well (correlation coefficient 0.82) with the model data. The 1980 level (about 320 DU; see Figures 6, 8) is reached around 2040 in both data sets. However, the TCO increase after 2040 is more pronounced in the reconstruction data. It means that the climate change related to TCO super-recovery is more pronounced in the local data over the northern midlatitudes (see Figure 4 from Zubov et al., 2013). The large variability is mostly related to ENSO events because other proxies do not have enhanced variability in the future. In the global mean data (see Figure 11), the correlation is also high (0.81), and the reconstructed TCO behavior mostly follows the model data. The recovery to the 1980 level (293 DU; see Figure 9) is reached by a little bit earlier than in the northern hemisphere mean, presumably due to a strong El-Nino event in 2035. Of course, in the real atmosphere, this event will not strictly coincide with the model, but anyway, the recovery will be reached after 2035. The presented results suggest that annual mean TCO data from Arosa/Davos together with other proxies can serve as a good indicator of the ozone recovery in the future.
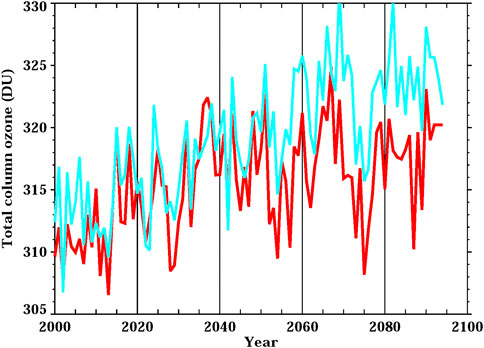
FIGURE 10. Evolution of the northern hemisphere mean TCO obtained from the model SOCOLv4 (red line) and retrieved from proxies with Arosa/Davos TCO as an additional proxy (light blue line). The correlation coefficient between reconstruction and the model SOCOLv4 is 0.82.
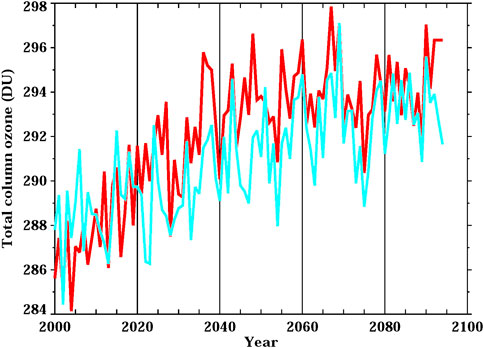
FIGURE 11. Evolution of the near-global mean TCO obtained from the model SOCOLv4 (red line) and retrieved from proxies with Arosa/Davos TCO as an additional proxy (light blue line). The correlation coefficient between reconstruction and the model SOCOLv4 is 0.81.
Summary
We consider the representativeness of the total column ozone (TCO) measurements at Arosa/Davos stations for the TCO fields in different time and space scales. We show that the local measurements correlate and agree well with the satellite data obtained for a larger (100 × 100 km) footprint for all months with slightly lower success in July. The Arosa/Davos TCO time series correlate extremely well even with a much larger area covering all Western Europe for most of the seasons with a lower correlation from July to December. A very strong correlation (more than 0.8) of the Arosa/Davos TCO with the northern middle latitudes is obtained for the annual mean data. The correlation between near-global (60°S-60°N) and northern hemispheric mean is about 0.8 for the annual mean data. The application of the Arosa/Davos TCO time series as an additional proxy for the MLR-based TCO reconstruction improves its quality. The reconstructed near-global and northern hemisphere mean TCO behavior during recent times (1980–2020) reproduce observation data with reasonable absolute error and correlation exceeding 0.85. We conclude that the Arosa/Davos total column ozone data are more representative for the northern midlatitudes, northern hemisphere, and global mean. For the other latitudes, the representativeness is limited and works only under certain conditions such as the cold season.
The reconstructed historical (1926–1980) TCO behavior agrees with a much more complicated approach based on the CCM modeling and data assimilation (HISTOZ; Brönnimann et al., 2013) with a correlation of about 0.5. It should be noted that the reconstructed TCO possesses a positive trend from 1926 to 1940 discussed by Egorova et al. (2020) and observable in HISTOZ data. This should be studied further to understand the implication of the obtained results for the assessment of the solar forcing magnitude in the past. The reconstruction of the future TCO behavior is more complex and can only be done using model simulations. We used the TCO from 2000 to 2100 simulated with the model SOCOLv4 using CCMI scenarios for the primary climate and chemistry forcing mechanisms. We show that the reconstructed TCO using MLR and Arosa/Davos TCO data gives reasonable accuracy predicting total ozone recovery years and general behavior of the TCO in the future. It should be pointed out, however, that our reconstructions overestimate the northern hemisphere mean TCO increase after 2045. This conclusion makes it possible to apply future Arosa/Davos TCO measurements with the other necessary proxies to diagnose the future ozone layer recovery.
Data Availability Statement
The raw data supporting the conclusions of this article will be made available by the authors, without undue reservation.
Author Contributions
ER designed, prepared, and wrote down the initial draft; JG, HS, RS, and LE provided and described the Arosa/Davos data; TS, TE, and AK-D provided and described CCM SOCOL data. All co-authors contributed to the editing and improving the initial draft.
Funding
This research was partly funded by the MeteoSwiss GAW-CH project INFO3RS, 123001926. ER, TE, TS, and AK-D were also supported by the Swiss National Science Foundation under grants CRSII2-147659 (FUPSOL-II) and 200020_182239 (POLE). Numerical simulations were performed on the ETH Zürich cluster EULER. The calculations with the AOACCM SOCOLv4.0 were supported by a grant from the Swiss National Supercomputing Centre (CSCS) under projects S-901 (ID 154) and S-1029 (ID 249).
Conflict of Interest
The authors declare that the research was conducted in the absence of any commercial or financial relationships that could be construed as a potential conflict of interest.
Acknowledgments
We thank Brönnimann for providing total ozone data from the HISTOZ data set.
References
Aquila, V., Oman, L. D., Stolarski, R., Douglass, A. R., and Newman, P. A. (2013). The Response of Ozone and Nitrogen Dioxide to the Eruption of Mt. Pinatubo at Southern and Northern Midlatitudes. J. Atmos. Sci. 70, 894–900. doi:10.1175/JAS-D-12-0143.1
Ball, W. T., Alsing, J., Mortlock, D. J., Staehelin, J., Haigh, J. D., Peter, T., et al. (2018). Evidence for a Continuous Decline in Lower Stratospheric Ozone Offsetting Ozone Layer Recovery. Atmos. Chem. Phys. 18, 1379–1394. doi:10.5194/acp-18-1379-2018
Brönnimann, S., Annis, J. L., Vogler, C., and Jones, P. D. (2007). Reconstructing the Quasi-Biennial Oscillation Back to the Early 1900s. Geophys. Res. Lett. 34, L22805. doi:10.1029/2007GL031354
Brönnimann, S., Bhend, J., Franke, J., Flückiger, S., Fischer, A. M., Bleisch, R., et al. (2013). A Global Historical Ozone Data Set and Prominent Features of Stratospheric Variability Prior to 1979. Atmos. Chem. Phys. 13, 9623–9639. doi:10.5194/acp-13-9623-2013
Brönnimann, S., Staehelin, J., Farmer, S. F. G., Cain, J. C., Svendby, T., and Svenøe, T. (2003). Total Ozone Observations Prior to the IGY. I: A History. Q.J.R. Meteorol. Soc. 129, 2797–2817. doi:10.1256/qj.02.118
Büntgen, U., Krusic, P. J., Verstege, A., Sangüesa-Barreda, G., Wagner, S., Camarero, J. J., et al. (2017). New Tree-Ring Evidence from the Pyrenees Reveals Western Mediterranean Climate Variability since Medieval Times. J. Clim. 30 (14), 5295–5318. doi:10.1175/JCLI‐D‐16‐0526.1
Cochrane, D., and Orcutt, G. H. (1949). Application of Least Squares Regression to Relationships Containing Auto-Correlated Error Terms. J. Am. Stat. Assoc. 44 (245), 32–61. doi:10.1080/01621459.1949.10483290
Dhomse, S. S., Kinnison, D., Chipperfield, M. P., Salawitch, R. J., Cionni, I., Hegglin, M. I., et al. (2018). Estimates of Ozone Return Dates from Chemistry-Climate Model Initiative Simulations. Atmos. Chem. Phys. 18, 8409–8438. doi:10.5194/acp-18-8409-2018
Egorova, T., Rozanov, E., Arsenovic, P., Peter, T., and Schmutz, W. (2018). Contributions of Natural and Anthropogenic Forcing Agents to the Early 20th Century Warming. Front. Earth Sci. 6, 206. doi:10.3389/feart.2018.00206
Egorova, T., Rozanov, E., Arsenovic, P., and Sukhodolov, T. (2020). Ozone Layer Evolution in the Early 20th Century. Atmosphere 11, 169. doi:10.3390/atmos11020169
Egorova, T., Sukhodolov, T., Karagodin-Doyennel, A., and Rozanov, E. (2021). Ozone Evolution from 1980 to 2100 Simulated with the Atmosphere-Ocean-Aerosol-Chemistry-Climate Model SOCOLv4.0. Atm. Chem. Phys. in preparation. doi:10.5194/gmd-2021-35
Fioletov, V. E., Labow, G., Evans, R., Hare, E. W., Köhler, U., McElroy, C. T., et al. (2008). Performance of the Ground-Based Total Ozone Network Assessed Using Satellite Data. J. Geophys. Res. 113, D14313. doi:10.1029/2008JD009809
Gröbner, J., Schill, H., Egli, L., and Stübi, R. (2021). Consistency of Total Column Ozone Measurements between the Brewer and Dobson Spectroradiometers of the LKO Arosa and PMOD/WRC Davos. Atmos. Meas. Tech. Discuss. in review. doi:10.5194/amt-2020-497
Hu, Y., and Xia, Y. (2013). Extremely Cold and Persistent Stratospheric Arctic Vortex in the winter of 2010-2011. Chin. Sci. Bull. 58, 3155–3160. doi:10.1007/s11434-013-5945-5
SPARC/IO3C/GAW (2019). “SPARC/IO3C/GAW Report on Long-Term Ozone Trends and Uncertainties in the Stratosphere,” in SPARC Report No. 9, GAW Report No. 241. Editors I. Petropavlovskikh, S. Godin-Beekmann, D. Hubert, R. Damadeo, B. Hassler, and V. Sofieva. WCRP-17/2018. doi:10.17874/f899e57a20b
Karagodin-Doyennel, A., Rozanov, E., Kuchar, A., Ball, W., Arsenovic, P., Remsberg, E., et al. (2021). The Response of Mesospheric H2O and CO to Solar Irradiance Variability in Models and Observations. Atmos. Chem. Phys. 21, 201–216. doi:10.5194/acp-21-201-2021
Kovilakam, M., Thomason, L. W., Ernest, N., Rieger, L., Bourassa, A., and Millán, L. (2020). The Global Space-Based Stratospheric Aerosol Climatology (Version 2.0): 1979-2018. Earth Syst. Sci. Data 12, 2607–2634. doi:10.5194/essd-12-2607-2020
Kuttippurath, J., Kumar, P., Nair, P. J., and Pandey, P. C. (2018). Emergence of Ozone Recovery Evidenced by Reduction in the Occurrence of Antarctic Ozone Loss Saturation. Npj Clim. Atmos. Sci. 1, 42. doi:10.1038/s41612-018-0052-6
Kuttippurath, J., and Nair, P. J. (2017). The Signs of Antarctic Ozone Hole Recovery. Sci. Rep. 7, 585. doi:10.1038/s41598-017-00722-7
Loew, A., Bell, W., Brocca, L., Bulgin, C. E., Burdanowitz, J., Calbet, X., et al. (2017). Validation Practices for Satellite-Based Earth Observation Data across Communities. Rev. Geophys. 55, 779–817. doi:10.1002/2017RG000562
Matthes, K., Funke, B., Andersson, M. E., Barnard, L., Beer, J., Charbonneau, P., et al. (2017). Solar Forcing for CMIP6 (v3.2). Geosci. Model. Dev. 10, 2247–2302. doi:10.5194/gmd-10-2247-2017
Nappo, C. J., Caneill, J., Furman, R., Gifford, F., Kramer, M. L., Kaimal, J. C., et al. (1982). The Workshop on the Representativeness of Meteorological-Observations, June 1981, Boulder, Colorado. Bull. Am. Meteorol. Soc. 63, 761–764.
Pazmiño, A., Godin-Beekmann, S., Hauchecorne, A., Claud, C., Khaykin, S., Goutail, F., et al. (2018). Multiple Symptoms of Total Ozone Recovery inside the Antarctic Vortex during Austral spring. Atmos. Chem. Phys. 18, 7557–7572. doi:10.5194/acp-18-7557-2018
Rinsland, C. P., Mahieu, E., Demoulin, P., Zander, R., Servais, C., and Hartmann, J.-M. (2012). Decrease of the Carbon Tetrachloride (CCl4) Loading above Jungfraujoch, Based on High Resolution Infrared Solar Spectra Recorded between 1999 and 2011. J. Quantitative Spectrosc. Radiative Transfer 113 (11), 1322–1329. doi:10.1016/j.jqsrt.2012.02.016
Schwarz, M., Folini, D., Hakuba, M. Z., and Wild, M. (2017). Spatial Representativeness of Surface-Measured Variations of Downward Solar Radiation. J. Geophys. Res. Atmos. 122 (13), 13,319–13,337. doi:10.1002/2017JD027261
Solomon, S., Ivy, D. J., Kinnison, D., Mills, M. J., Neely, R. R., and Schmidt, A. (2016). Emergence of Healing in the Antarctic Ozone Layer. Science 353, 269–274. doi:10.1126/science.aae0061
Staehelin, J., Kegel, R., and Harris, N. R. P. (1998b). Trend Analysis of the Homogenized Total Ozone Series of Arosa (Switzerland), 1926-1996. J. Geophys. Res. 103, 8389–8399. doi:10.1029/97JD03650
Staehelin, J., Renaud, A., Bader, J., McPeters, R., Viatte, P., Hoegger, B., et al. (1998a). Total Ozone Series at Arosa (Switzerland): Homogenization and Data Comparison. J. Geophys. Res. 103, 5827–5841. doi:10.1029/97JD02402
Staehelin, J., Viatte, P., Stübi, R., Tummon, F., and Peter, T. (2018). Stratospheric Ozone Measurements at Arosa (Switzerland): History and Scientific Relevance. Atmos. Chem. Phys. 18, 6567–6584. doi:10.5194/acp-18-6567-2018
Stübi, R., Schill, H., Klausen, J., Vuilleumier, L., Gröbner, J., Egli, L., et al. (2017). On the Compatibility of Brewer Total Column Ozone Measurements in Two Adjacent Valleys (Arosa and Davos) in the Swiss Alps. Atmos. Meas. Tech. 10, 4479–4490. doi:10.5194/amt-10-4479-2017
Stübi, R., Schill, H., Maillard Barras, E., Klausen, J., and Haefele, A. (2020). Quality Assessment of Dobson Spectrophotometers for Ozone Column Measurements before and after Automation at Arosa and Davos. Atmos. Meas. Tech. Discuss. in review. doi:10.5194/amt-2020-441
Sukhodolov, T., Egorova, T., Stenke, A., Ball, W. T., Brodowsky, C., Chiodo, G., et al. (2021). Atmosphere-Ocean-Aerosol-Chemistry-Climate Model SOCOLv4.0: Description and Evaluation. Geosci. Model. Dev. Discuss. in review. doi:10.5194/gmd-2021-35
van der A, R. J., Allaart, M. A. F., and Eskes, H. J. (2015). Extended and Refined Multi Sensor Reanalysis of Total Ozone for the Period 1970-2012. Atmos. Meas. Tech. 8, 3021–3035. doi:10.5194/amt-8-3021-2015
Keywords: Arosa/Davos, total column ozone, trends, representativeness, regression analysis
Citation: Rozanov E, Egorova T, Egli L, Karagodin-Doyennel A, Sukhodolov T, Schill H, Stübi R and Gröbner J (2021) Representativeness of the Arosa/Davos Measurements for the Analysis of the Global Total Column Ozone Behavior. Front. Earth Sci. 9:675084. doi: 10.3389/feart.2021.675084
Received: 02 March 2021; Accepted: 26 May 2021;
Published: 17 June 2021.
Edited by:
Guihua Wang, Fudan University, ChinaReviewed by:
Weiwei Fu, University of California, Irvine, United StatesJayanarayanan Kuttippurath, Indian Institute of Technology Kharagpur, India
Copyright © 2021 Rozanov, Egorova, Egli, Karagodin-Doyennel, Sukhodolov, Schill, Stübi and Gröbner. This is an open-access article distributed under the terms of the Creative Commons Attribution License (CC BY). The use, distribution or reproduction in other forums is permitted, provided the original author(s) and the copyright owner(s) are credited and that the original publication in this journal is cited, in accordance with accepted academic practice. No use, distribution or reproduction is permitted which does not comply with these terms.
*Correspondence: Eugene Rozanov, ZS5yb3phbm92QHBtb2R3cmMuY2g=