 Yun Tian
 Yong Wu
 Hongtao Li
 Bangzheng Ren
 Hao Wang
- 1College of Environment and Civil Engineering, Chengdu University of Technology, Chengdu, China
- 2State Key Laboratory of Geohazard Prevention and Geoenvironment Protection, Chengdu, China
The dynamic failure mechanism of horizontally layered dangerous rock during earthquakes is complex and only few studies have addressed the combination of particle flow code (PFC) meso-level failure mechanism and mechanical analysis. Based on fracture mechanics and material mechanics we establish a calculation method for the interlayer load and stability coefficient of horizontal layered dangerous rock during strong earthquakes. The method was applied for calculating the stability of a horizontally layered dangerous slope along a highway in the Sichuan Province (China) during earthquakes as a case study. Using a 3D particle flow simulation technology, a PFC3D model of horizontal layered dangerous rock was established. Its dynamic stability, failure mode and Hilbert-Huang 3D time-frequency characteristics are analyzed, and the results of the simulation are largely consistent with the time of the dangerous rock failure as estimated by our new calculation method. Our study documents that as the seismic acceleration gradually increases, the stability coefficient of the rock block fluctuates more violently and the stability coefficient gradually decreases. The stability coefficient of the rock block decreases fastest between 5 and 6 s and the reduction in the stability coefficient is between 0.12 and 0.25. Before the seismic acceleration reaches the maximum, the dangerous rock blocks on the two main controlling structures collapse and get destroyed. 25 s after the earthquake, the failure mode of the dangerous rock is collapse-slip-rotation. We show that earthquakes with frequencies of 0–10 and 250 Hz have the strongest destructive effect on the stability of the horizontally layered dangerous rocks.
Introduction
Seismic treatment of stratified dangerous rock slopes is a major geotechnical engineering challenge, frequently encountered in the construction of highways, railways, water conservancy, and other local infrastructure (Chen, 2001). A layered dangerous rock slope refers to a rock mass steep cliff or slope that is formed with multiple sets of weak and structural planes. The rock slope may become unstable or destroyed through gravity, earthquakes, and fracture water pressure. Like landslides, mudslides, land subsidence, desertification, karst, and other landscape shaping processes, dangerous rock collapses have become more prominent in recent years as one major type of geological disaster that poses a major threat to human life and property. In China dangerous rock collapses frequently occur at slopes along the Three Gorges Reservoir and along highways in seismic active zones of the Sichuan Province and other mountainous areas (Chen et al., 2015). However, the destruction of dangerous rock slopes is a global rock mechanics and geological hazard problem.
Horizontally layered rock slopes are the most common type of dangerous rock slopes and occur worldwide. They often contain a large number of horizontal and vertical joints that constitute zones of structural surfaces in the slope. Under the cutting of the dominant structure plane and the layer, the slope may be disrupted into many rock blocks, causing a more complex definition of the failure mode of such layered rock slope. The distribution and development of the structural planes and their mechanical properties control the strength, deformation, and stability of the slope. Due to the depth of the weathered rock cavity and the penetration of potential structural planes, earthquakes may cause collapse and destruction of dangerous rock masses. The damage caused by horizontally layered rock slopes was particularly significant in the 2008 Wenchuan earthquake. A magnitude 7.0 earthquake that occurred in 2017 in the Jiuzhaigou County (northern Sichuan Province) caused an economic loss of about 114.46 million through the destruction of dangerous rocks.
In recent years new models that combine fracture mechanics and material mechanics were developed to account for the complexity of rock masses. Chen et al. (2006) and Chen and Tang (2007) combined the rock mass structure theory with the limit equilibrium theory and considered different loading conditions, causing sliding, toppling, and falling rock slopes and established stability calculation methods for the three types of dangerous rock slopes. Based on fracture mechanics and material mechanics, Wang et al. (2017) established a calculation method for the interlayer load and stability coefficient of a complex gently inclined rock slope. However, the dynamic law and failure mode of horizontally layered dangerous rock slope during strong earthquakes was not considered in these studies. Alejandro et al. (2010) analyzed the failure mechanism of layered slopes based on engineering geological analysis and field investigations. Havaej and Stead (2016) considered the brittleness and damage characteristics of the rocks and analyzed the failure mechanism of the layered rock slope based on the method of numerical simulation. Aydan (2016) and Massey et al. (2017) determined the failure mode and mechanism of rock slopes under earthquake action through model tests and numerical simulations.
The particle flow code (PFC) enables the simulation of the behavior of dangerous rock slopes with complex mechanical models. Castro-Filgueira et al. (2020) used three-dimensional particle flow code (PFC3D) to study the triaxial test simulation of complete and cracked granite and calibrated the accuracy of the parameters. Salmi and Hosseinzadeh (2015) used empirical and numerical methods to jointly evaluate the stability of slopes. Based on the fracture mechanics theory, Chen et al. (2016) used the PFC2D method to evaluate the stability of crack propagation in a single dangerous rock. Tang et al. (2013) studied the mechanism of the Caoling large-scale landslide in 1941 based on two-dimensional particle flow code (PFC2D). He et al. (2016) studied the dynamic response and the instability process of dangerous rocks in Wangxia (Yangtze River, China), and successfully simulated the failure process of the slidable dangerous rocks using the PFC2D method, thus verifying its feasibility. Hu et al. (2017) applied the artificial synthetic rock mass technology of the PFC2D to study the failure mode of rock slopes with horizontal intermittent joints under different combinations of joint spacing length and joint spacing during earthquakes.
The simulation of the dynamic response of dangerous rocks to variable external forces (e.g., earthquakes) was limited to two dimensions, so far. However, the horizontally layered dangerous rock slope is a complex mechanical model, and the interaction between the longitudinal particles in the three-dimensional direction will directly affect the failure mechanism of the slope. Therefore, it is essential to use three-dimensional particle flow code (PFC3D) numerical simulations to study horizontally layered dangerous rocks (Potyondy and Cundall, 2004; Camones et al., 2013). In the present study we link fracture mechanics and Newton’s second law with the PFC3D method. The dynamic response of the horizontally layered dangerous rocks to external forces is further analyzed through the Hilbert–Huang transformation (HHT) for time-frequency characteristics. The results of HHT can directly reflect the time, sequence, and dynamic process of rock collapse. In addition, the dynamic failure mechanism and dynamic response of horizontally stratified rock slope under strong earthquakes can be observed. Our study documents the feasibility and advantage of 3D discrete element simulation over 2D models to characterize the dynamic failure of horizontally stratified rock slopes.
Methods and Case Study
Mechanical Mechanism Analysis
Influence of Seismic Wave Direction
Seismic destruction of dangerous rocks is frequently considered to result from horizontal seismic forces of transverse waves (Yuan et al., 2018). However, the propagation velocities of seismic transverse waves and longitudinal waves are related, and they have different effects on the stability of dangerous rock slopes under different degrees of weathering. The seismic forces influence the stability of dangerous rocks and the failure mode under the coupling of shear and longitudinal waves has amplifying effect on the stability with the probability of both acting at the same point being limited (Zhang et al., 2014; Huang et al., 2017). According to the “Code for Seismic Resistance of Highway Engineering” (China Communications Road and Bridge Technology Co., Ltd, 2013), seismic activity in the Sichuan Province is characterized by the influence of longitudinal wave vertical earthquakes. Based on a specification on dangerous rock slope of the Sichuan Duwen Highway, the transverse and longitudinal waves are divided, and combined with the equation for calculating the stability of the dangerous rock (Chen et al., 2009a). In the slope consisting of sandstone on the top and mudstone at the base that is exposed along the highway (Figure 1) as a case study for our new model. The slope model shows a rock cavity at the base with a length of 10.31 m (the penetration rate is 62.5%) that is caused by weathering (Figure 1). According to the specification of Chen et al. (2009a), the studied slope of dangerous rock is ascribed to the falling damage group. The stability calculation method of different weathering degree of dangerous rock with seismic transverse and longitudinal waves is obtained to judge the effective seismic wave corresponding to different models.
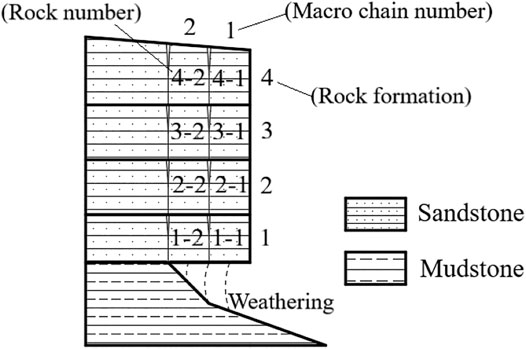
FIGURE 1. Horizontally layered dangerous rock slope model.
The calculation model for falling dangerous rocks under shear waves is shown in Figure 2A. Px is the seismic inertial force in the x direction (kN), Py is the seismic inertial force in the y direction (kN), Gw is the weight of the dangerous rock mass (kN), Q is the water pressure on the rock fissure (kN), and AB is the length of the structural surface, h0 is the vertical distance from the center of gravity to the bottom of the model (m). The stability factor is defined as:
In Eq. 1m is the mass of the rock block (kg); γw is the bulk density of fissure water (kN/m3); ax is the shear wave seismic acceleration (m/s2); c is the cohesion of dangerous rock (MPa); φ is the angle of internal friction (°) and β (°) the inclination angle, e is the depth of the cracks that have been destroyed (m); H is the vertical height of the rock mass (m).
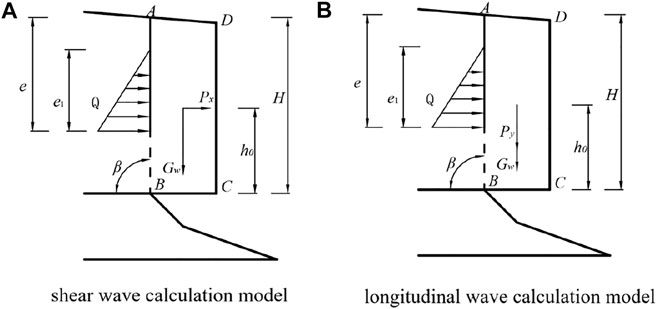
FIGURE 2. Slope calculation model.
The calculation model of dangerous rock under longitudinal wave seismic force is shown in Figure 2B. The equation for the stability coefficient of dangerous rock under longitudinal wave vertical seismic force is similar to Eq. 1 but with ay as longitudinal wave seismic acceleration (m/s2):
In the following we integrate the data of the horizontally layered dangerous rock slope of Sichuan Duwen Highway into the equation of the stability coefficient under the action of transverse and longitudinal waves. The effective value of seismic acceleration is calculated by taking the maximum value in the first 25 s of the measured longitudinal U-D wave seismic acceleration time history curve of the Wolong Wenchuan (Sichuan) earthquake in 2008 (Figure 3). The calculation parameters are summarized in Table 1 with flk as the standard value of tensile strength of sandstone (MPa) and fok as the standard value of tensile strength of mudstone (MPa).
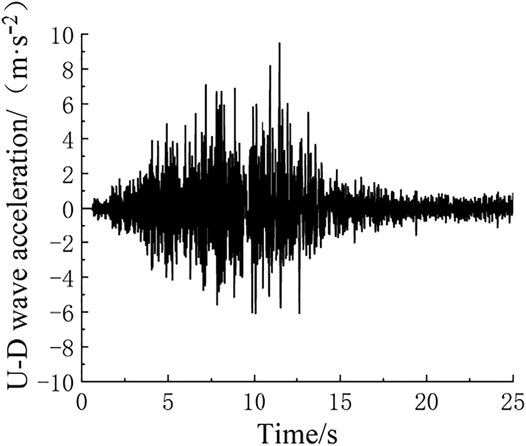
FIGURE 3. Longitudinal U-D wave curve of the 2008 Wolong Wenchuan earthquake.
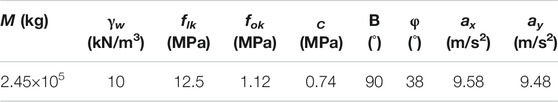
TABLE 1. Model calculation parameters.
The calculation indicates a stability coefficient of 1.80 under shear waves and a stability coefficient of 0.92 under longitudinal waves for the studied slope. The lower coefficient documents that the longitudinal seismic wave is the main factor for the failure of the slope. Consequently, our new model predominantly considers the effect of the longitudinal waves. Since longitudinal waves are the main effect in earthquakes, it is assumed that the model only considers the effects of longitudinal waves. The finding of the longitudinal waves as main factor for slope failure is fundamental for the subsequent simulation of the seismic action combined with particle flow and therefore improves the efficiency of the modelling.
Derivation of Seismic Stability Coefficient Equation
Multiple sets of joints may occur in complex dangerous horizontal layered rock slope, and each set of joints is formed by the combined action of multiple micro-chains and macro-chains. The slope is fragmented into rock blocks by vertical structural planes and lateral rock layers, making the failure mode of complex layered rock slopes different from that of single rock slopes with only one set of joints. Based on our conclusion from the stability coefficient calculation, we focus on the effect of longitudinal seismic waves to analyze the stability of horizontally layered dangerous rocks under earthquakes.
We follow the equation for dangerous rock of Tian et al. (2020a) that defines a dangerous rock model with n macroscopic chains and m rock layers. Linking this equation with constraints from fracture mechanics, material mechanics, and dynamics calculation methods (Chen et al., 2009b), we define the time history equation of the stability coefficient of the mn# rock block under the continuous earthquake action as follows:
In Eq. 3KIC(t) is the fracture toughness of the structural plane and K’‘emn(t) is the joint stress intensity factor under the longitudinal seismic wave. In Eq. 4, Eq. 5 θ’‘0mn(t) is the fracture angle under the longitudinal seismic wave, K″Ⅰmn the type I stress intensity factor under the longitudinal seismic wave and K’‘Iimn the type II stress intensity factor under the longitudinal seismic wave.
Interlayer Load Under Earthquake Action
As observed in most layered rock slopes, we postulate in our model that adjacent rock layers are in contact with each other. Considering that each layer of rock interacts with each other, the mth layer of rock mass is used for analysis. In the rock layer contact geometry model (Figure 4) Hm is the layer height of the rock block m in the y direction, and Lm is the width of the rock block m in the x direction. Adjacent layers m-1 and m+1 are defined analogously. Am and Am-1 are contact points between the individual blocks and τ is the friction between individual layers.
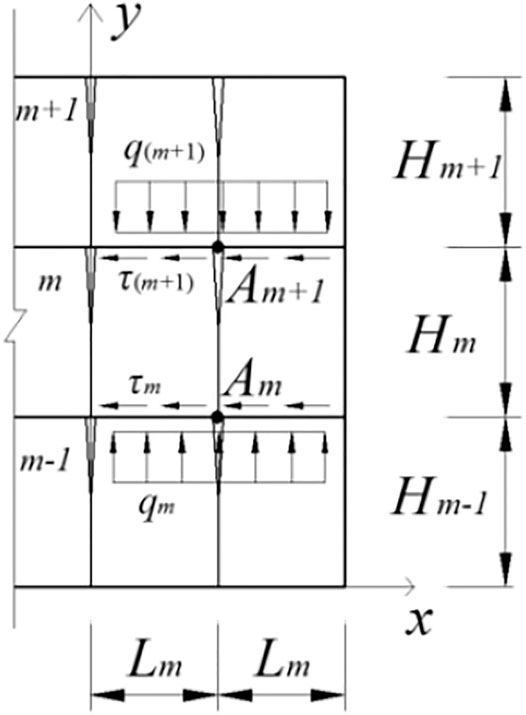
FIGURE 4. Geometric model of interlayer interaction in a rock mass.
According to the deflection equation, the total deflection of a layer rock m under the action of its own weight as well as upper and lower rock masses is defined as:
The friction between layers is defined as:
In Eq. 6, y″m1 is the deflection of layer m under the action of weight, earthquake and pressure of the overlying layer m+1; y″m2 is the deflection of the rock layer m supported by the underlying rock layer m-1; M is the bending moment of the adjacent rock block; q″m+1 is the interlayer load, γ is the bulk density of the fractured water, m is the mass of the rock block, ay(t) is the longitudinal seismic acceleration, E is the elastic modulus, and Im is the moment of inertia.
According to the principle of equal deflection of the contact section of adjacent rock layers, it follows for a number i of rock layers:
The interlayer load can be obtained by Eq. 6, Eq. 7, Eq. 8
Case Study
We selected a slope of dangerous rocks near the Provincial Highway 205 in Beichuan County (Sichuan Province, China) as a case study (Figure 5A) for testing our new model. The slope is dominated by sandstone overlying mudstone at the base of the sequence and comprises four rock layers and two vertical structural planes. Following to the chain law in the China Academy of Aviation (1981) we define the outer rock chain as No. 1 chain, and the inner rock chain as No. 2 chain (Figures 1, Figure 5B). Like in the calculation of the stability coefficients, we selected the maximum value in the first 25 s of the measured longitudinal U-D wave seismic acceleration time history curve of the Wenchuan earthquake (Figure 3).
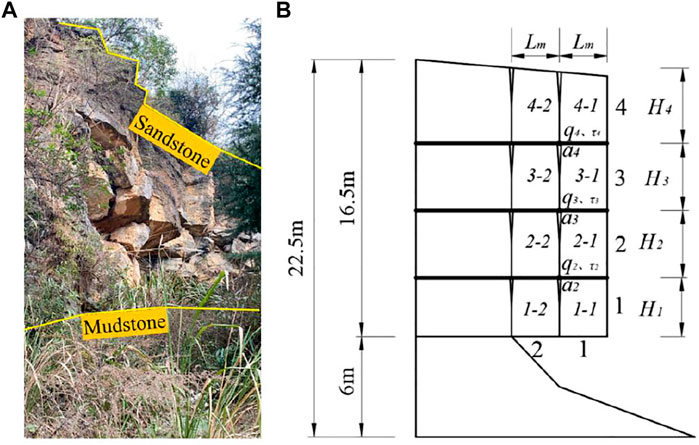
FIGURE 5. (A) Photograph of the studied slope at the Provincial Highway 205 and (B) geometry of model four slope.
Implementing Eq. 6, Eq. 7, Eq. 8, the deflection equation is constrained as:
Simplifying Eq. 9 yields:
The load between each layer is:
Among them:
Applying the data from Table 2 in the dangerous rock Eq. 10 and considering the interlayer load, the time history curve of the stability coefficient of the dangerous rock block is calculated (Figure 6). The structural plane of the rock block is fractured for stability coefficients <1.0 (critical red line in Figure 6). We here consider the effect of earthquake time history. Due to the large seismic fluctuations, seismic forces in the opposite direction will affect the rock block, resulting in an instantaneous increase in the stability of the rock block. Different from the law of stability decay under statics, this fluctuation phenomenon will speed up the expansion of the main control structure. Considering the earthquake as a dynamic load, the interlayer load also becomes a dynamic interlayer load after initiation of the earthquake. The time history curves indicate that each rock block will fluctuate with the fluctuation of the longitudinal seismic wave during the earthquake (Figure 6). The shape of the fluctuation curve of the stability coefficient is similar for the rock blocks, but the caving time is different (Figures 6A–H). At the beginning of the earthquake the stability coefficient of the dangerous rock fluctuates rather widely. From the perspective of attenuation, the stability coefficient of each rock block gradually decreases with time (Figure 6I). The maximum fluctuation range of the stability coefficient of the dangerous rock overlaps with the maximum acceleration between 5–15 s of the Wenchuan earthquake wave (Figure 3). The highest stability coefficient calculated by our new method is at 10.95 s after the beginning of the earthquake. The minimum stability coefficient increases from bottom to top of the slope (rock block 1–1: 0.745, rock block 1–2: 0.788, rock block 2–1: 0.798, rock block 2–2: 0.807, rock block 3–1: 0.993, rock block 3–2: 0.945, rock block 4–1: 0.987, rock block 4–2: 0.962). The data indicate that the rock block 1–1 in the bottom layer has the greatest vulnerability of failure whereas the third layer rock block 3–1 is most resistant. Considering the interlayer load effect and seismic dynamics, the systematic of the failure of each dangerous rock is obviously different and depends on the position of the respective block in the slope. The timing of the intersection between the stability coefficient and the critical line is variable but most rock blocks collapse before reaching the maximum vibration acceleration.
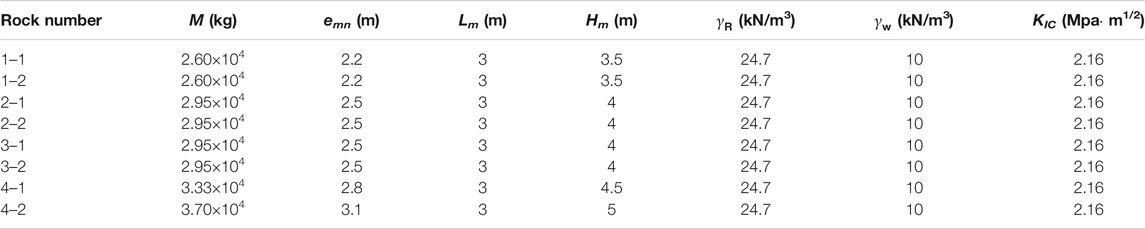
TABLE 2. Field slope calculation parameters.

FIGURE 6. (A–H) Time-history curve of seismic stability coefficient (I) and attenuation.
Therefore, we extracted the lower sector (0–12 s) of the stability coefficient versus time curves from Figure 6A–H, and plotted the eight stability coefficient attenuation curves as shown in Figure 6I. The stability coefficient attenuation curves clearly illustrate the decreasing stability coefficient of the rock blocks from top to bottom of the slope and with elapsing time after beginning of the earthquake (caving time). The stability coefficient of rock block 1–1 falls below the critical value already after ca. 2 s, indicating that rock block 1–1 will be destroyed at first. Thereafter, rock block 1–2 will be destroyed after 3 s. The two rock blocks from the bottom are destroyed at first as supporting forces from underlying rocks are lacking (related to the geometry of the model). The internal rock blocks have the largest bending moment and the largest interlayer load. Consequently, rock blocks 2–1 and 2–2 the from the second layer will collapse after 4.7 and 4.8 s, respectively. The blocks from the first two layers will be destroyed sequentially from the outside (blocks 1–1 and 2–1) to the interior of the slope (blocks 1–2 and 2–2). The rock block 4–2 will fail after ca. 6 s, followed by rock block 3–2 that will collapse after ca. 8 s. The blocks of the uppermost two layers are destroyed in a way that the internal structural plane penetrates from top to bottom and from the interior to the outside. The rock blocks 4–1 and 3–1 will be destroyed after 9.5 and 10.9 s, respectively, subsequently to the destruction of adjacent internal rock blocks. The strongest decrease of the stability coefficient occurs between 5 and 6 s for all blocks, and the maximum attenuation value is 0.3 (distributed in rock block 4–2). Thereafter, all curves smoothly decline. The data document that at least the dangerous rock blocks of the 1st and 2nd chain have all been collapsed prior to the maximum of the seismic acceleration at ca. 12 s (Figure 3).
The results indicate that our refined calculation method for the stability coefficient of dangerous rock under the influence of interlayer load and seismic dynamics can reasonably characterize the failure mechanism and caving time of dangerous rock slopes.
Results and Discussion
PFC Meso-parameter Calibration
In PFC, the Smooth-Joint Contact Model is used to simulate the contact model of the rock structure surface. The meso-parameters can be directly replaced and assigned by DFN (Discrete Fracture Network). A DFN is a collection of fractures. DFN is used as a structural plane simulation method that allows the estimation of mesoscopic parameters of the joint plane (Lei and Qing, 2015; Bian et al., 2018; Tian et al., 2020b). Through trial and adjustment, the sandstone and mudstone of the studied slope are calibrated, and the constrained meso parameters are summarized in Table 3.

TABLE 3. Mesoscopic parameters.
PFC Dangerous Rock Failure Mode Results
Based on previous studies on stratified dangerous rock slopes, the horizontally stratified dangerous rock slope of Duwen Highway is used to establish a horizontally stratified dangerous rock slope model using PFC3D (Figure 7). In the PFC model artificial synthetic rock mass (SRM) technology is applied to establish the rock joint surface. The boundary condition of the seismic model adopts the viscous boundary, and integrates the seismic wave data of the Wenchuan earthquake (Figure 3).
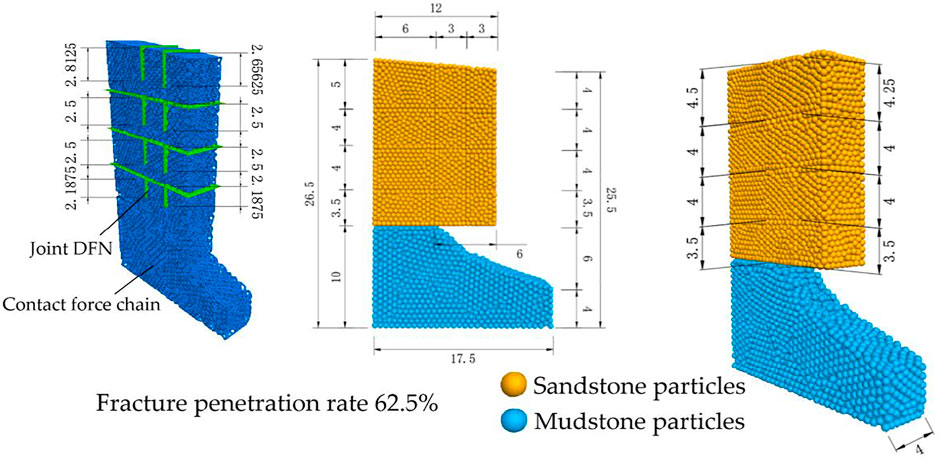
FIGURE 7. 3D particle flow model.
According to on-site monitoring data, the model has a crack penetration rate of 62.5% in the main control structure and a rock cavity depth of 6 m (Figure 7). A 25 s earthquake longitudinal wave is again applied in the model. The modelled destruction process is shown in Figure 8. Within 0–2 s of the evolution the slope is relatively stable, without significant evidence for deformation and failure. After 2.5 s the structural surface of the 1–1 rock block breaks down and starts to collapse (Figure 8A). The caving failure time is between 2 and 2.5 s (the calculation result in the third section Case analysis is 2.1 s). After 3 s the structural surface of the adjacent rock block 1–2 becomes fractured (Figure 8B). However, due to compression through the overlying rock mass, the rock joint model has not been completely fractured (partial fracture), and block 1–2 does not collapse at this time. We here define, the fracture time of the structural plane as the caving time of the dangerous rock, and following this, the caving time of block 1–2 is ca. 3 s (the calculation result in the third section is 2.92 s, see below). After 5 s the 1–1 block collides with the mudstone base (Figure 8C). In addition, the 2–1 rock block becomes fragmented from the rock pile and starts to fall. At the same time, the adjacent block 2–2 suffered initial structural plane fracture (partial fracture). However, just like the 1–2 block, the block 2–2 does not collapsed at this time, and its structural surface forms a partial penetration surface with the stress being concentrated between the second layer and the third layer of the No. 2 inner macro chain. We here preliminarily estimate a caving time between 4 and 5 s for the blocks 2–1 and 2–2, and according to the movement of the blocks, it evident that the caving failure time of block 2–1 must predate that of block 2–2 (consistently the calculation result in the third section is 4.75 s for 2–1 and 4.84 s for 2–2). As the seismic force gradually increases, compression of blocks 2–2 and 1–2 at the bottom on the upper rock mass continued to increase. After 8 s, the tensile strength of the 4–2 and 3–2 rock mass structural surface contact reaches the maximum. As a result, the rock fractures and tends to slide downward (Figure 8D). At the same time, the falling 2–1 and 1–1 blocks collide. We conclude a caving failure time between ca. 6 and 8 s for the 4–2 and 3–2 blocks (the calculation result in the third section is 6.07s for 4–2 and 7.98 s for 3–2). After 11s, the 3–1 block starts to collapse (Figure 8E) with a caving failure time between 10 and 11 s (the calculation result in the third section is 10.9s). Within 11–25 s, the joint model of the top rock strata began to fracture (Figure 8F). The blocks 4–1 and 4–2 rotate and become destroyed. The downward pressure causes the blocks 1–2, 2–2, and 3–2 to follow the mudstone slope. The entire surface becomes affected by a sliding failure.
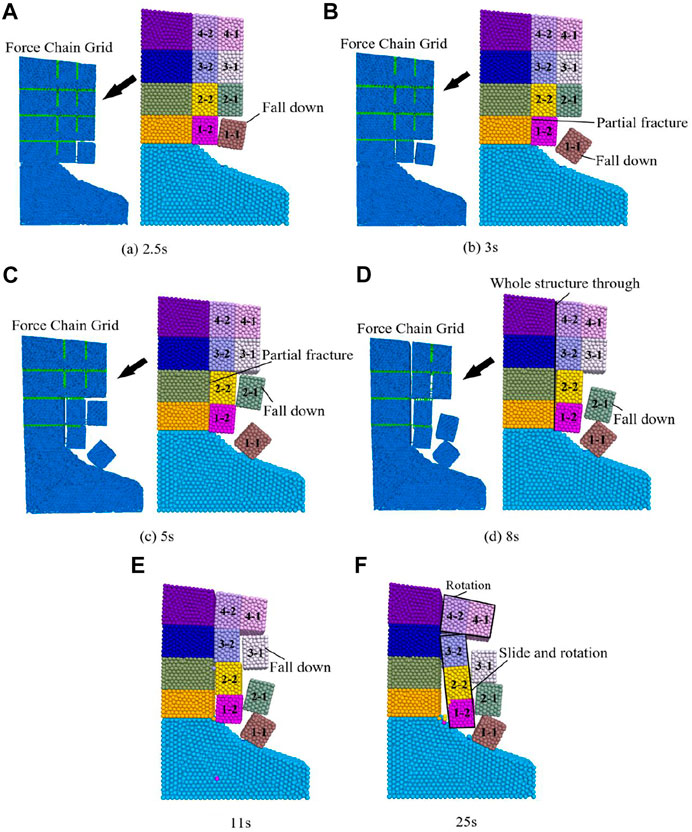
FIGURE 8. Diagram of the failure process of dangerous rocks.
In our simulation the interlayer load of the top rock mass during the earthquake is low, and the bottom rock mass has an upward stabilizing effect. The bending effect of the rock mass structural plane on the external macro chain No. 1 is small. Therefore, the 4–1 rock block did not fall in the PFC simulation, and its failure is controlled by the failure of the adjacent block 4–2.
To sum up, for the given penetration rate of 62.5% and a mudstone cavity depth of 6 m the horizontal layered dangerous rock slope is more severely damaged under the action of 25 s longitudinal earthquake wave. The destruction time is concentrated between 2 and 12 s, and the failure mode is fall-slip-rotation destruction.
Caving Time Analysis
The coordination number is defined in geotechnical engineering as the average contact number of particles (Jiang and Hu, 2010; Li and Wang, 2013), and is calculated as coordination number = 2 times the number of particles in contact/number of particles. Consequently, the coordination number reflects the physical properties such as the friction coefficient and elastic modulus of the contact model between particles. Based on the failure process (Figure 8), the specific caving sequence and strength attenuation of the rock block can be further refined by the coordination number. We monitor the particle coordination value of each model in the unit of rock block, and constrain the time history curve (Figure 9A). The modelled coordination values are between 6 and 11 (Figure 9A). The variation of the coordination number decreases with ongoing duration of the earthquake, as the stability of the slope gradually decreases. The slope model has a large attenuation of the coordination number in the anti-failure time period, and the coordination number largely fluctuates in the interval of strong earthquake intensity (8–15 s). The coordination value of each rock block tends to be stable prior to structural plane failure and again after the failure. Therefore, the structural plane attenuation of a rock mass during an earthquake is related to the intensity of the earthquake. The 2–1 rock block has the largest attenuation of the coordination number during the earthquake. Starting from 2 s, the coordination number decreases from 9.5 to 6.1. The decrease is related to large local fragmentation and destruction at ca. 5 s (Figure 8C). The coordination number decrease of the remaining rock blocks is between 0.6 and 2.5. The attenuation of the coordination number gets weakened with increasing elevation in the slope, with the uppermost rock blocks 4–1 and 4–2 yielding the lowest decreases of 0.6 and 1.2. The attenuation trend of the coordination number is consistent with the failure mode (Figure 8), thus confirming the specific caving time of each rock block in each model from the perspective of numerical simulation.
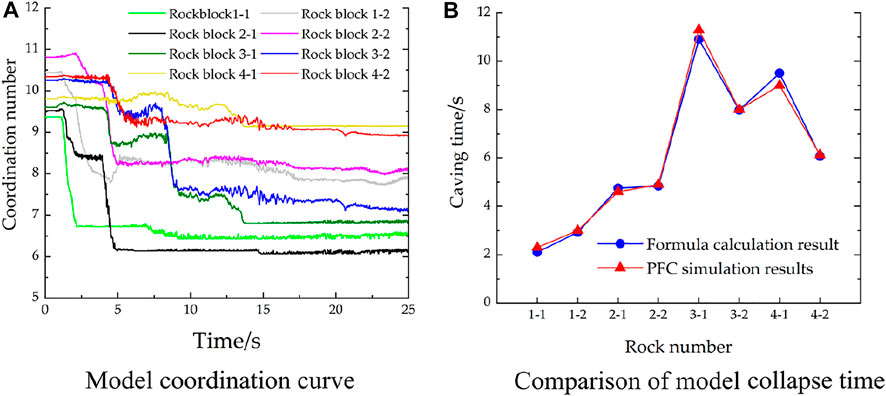
FIGURE 9. (A) Coordination number and (B) destruction time.
Combining fracture mechanics and Newton’s second law can completely obtain the dynamic stability of the dangerous rock and the caving time of the dangerous rock. In order to verify the reliability of the equation, and to affirm the rationality of the PFC method for this type of slope simulation, we compare the caving time of the dangerous rock obtained by the simulation with the value calculated from the seismic stability coefficient equation (Figure 9B). The diagram indicates an increase of the caving time from bottom to top in the slope. However, after a maximum defined by the 3–1 block the caving time generally decreases. The diagram documents that the caving time estimated from the PFC simulation is consistent with the data calculated from the stability coefficient equation, thus proving the rationality of the modelling and the numerical method.
Hilbert-Huang Time-Frequency Characteristic Analysis
Vibration Signal HHT Result
Hilbert-Huang Transform (HHT) is generally used to analyze the time-frequency characteristics of the acceleration histories obtained from the PFC3D simulations. Therefore, we apply HHT three-dimensional signal processing technology to analyze the slope vibration frequency during PFC simulation (Tian et al., 2020a). The HHT calculation results are obtained from the vibration acceleration during PFC simulation by the Hilbert transform. The steps are as follows:
1) Application of Empirical Mode Decomposition (EMD) to decompose complex signals into a finite number of intrinsic mode functions (IMF).
2) Calculation of Hilbert transformation on each intrinsic mode function component to obtain the instantaneous frequency and amplitude of each IMF component over time. The Hilbert transformation on the component c(t) is defined as:
c(t) is the modal component; H the Hilbert spectrum and p the Cauchy principal value.
The equation for the calculation of the analytical signal z(t) is:
The amplitude function can be obtained from the equation:
and the phase function from:
The instantaneous frequency is calculated from the equation:
After applying the Hilbert transformation to each IMF component H becomes:
where Re means take the real part. The Hilbert spectrum can be obtained by expressing the above equation as a function of time domain and frequency domain. The Hilbert energy spectrum is constrained by integrating the square of the amplitude against time:
where E is the Hilbert energy spectrum.
The Hilbert energy spectrum expresses the energy accumulated by each frequency in the entire time length.
We select the rock blocks of the internal macro chain No. 2 in the dangerous rock model (Figure 5B) as the vertical object in the calculation (1–2 block, 2–2 block, 3–2 block, 4–2 block). The basal blocks (1–1 block, 1–2 block) are used as the horizontal object. The HHT transform is used to obtain the HHT three-dimensional time-frequency diagram including time domain, frequency domain and amplitude (Figure 11). The instantaneous Fourier dominant frequency corresponding to the obtained maximum amplitude is extracted (Figure 10). The instantaneous dominant frequencies of the modelled rock blocks during the earthquake occur below 10 Hz. The main frequency is increasing from the external macro chain two to the internal macro chain 1, and as the elevation increases, the main frequency significantly increases from 1.3 to 8.3 Hz in the internal macro chain 2.
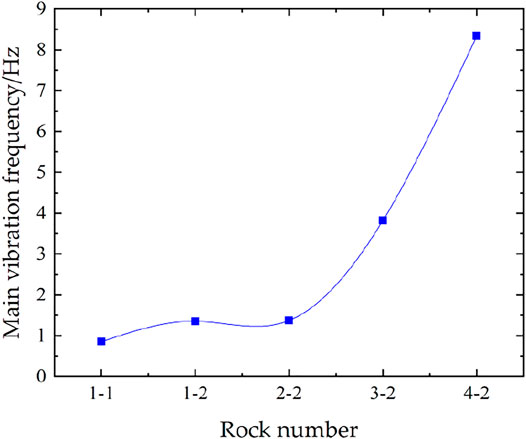
FIGURE 10. Instantaneous Fourier frequency change graph.
The comparison of the caving time calculated from the HHT main peak and the PFC caving time generally shows a close correspondence for each rock block (Figure 11A), documenting the applicability of the HHT three-dimensional time-frequency diagrams. Some minor variations of blocks 1–1 and 1–2 are related to collision between the rock blocks. In the 25 s seismic wave, the maximum vibration amplitude of the main peak of the bottom rock block 1–1 is 11.5 m/s2, and the maximum vibration amplitude of the main peak of the rock block 4–2 from the top of the slope is 33.2 m/s2 (Figures 11B–F). The data indicate an effect of the elevation on the maximum vibration amplitude of the main peak. The main frequency bands of rock blocks occur between 0 and 160 Hz. The frequency band increases from 0 to 30 Hz to 0–160 Hz from block 1–1 to block 4–2, indicating that also the width of the frequency band is related to the elevation of the block. Each rock mass exhibits high-frequency amplitude fluctuations, ranging from 0 to 12 m/s2. Multiple main peaks mainly occur in the 1–2 block (Figure 11C). The detected five main peaks indicate a large dynamic response of this block.
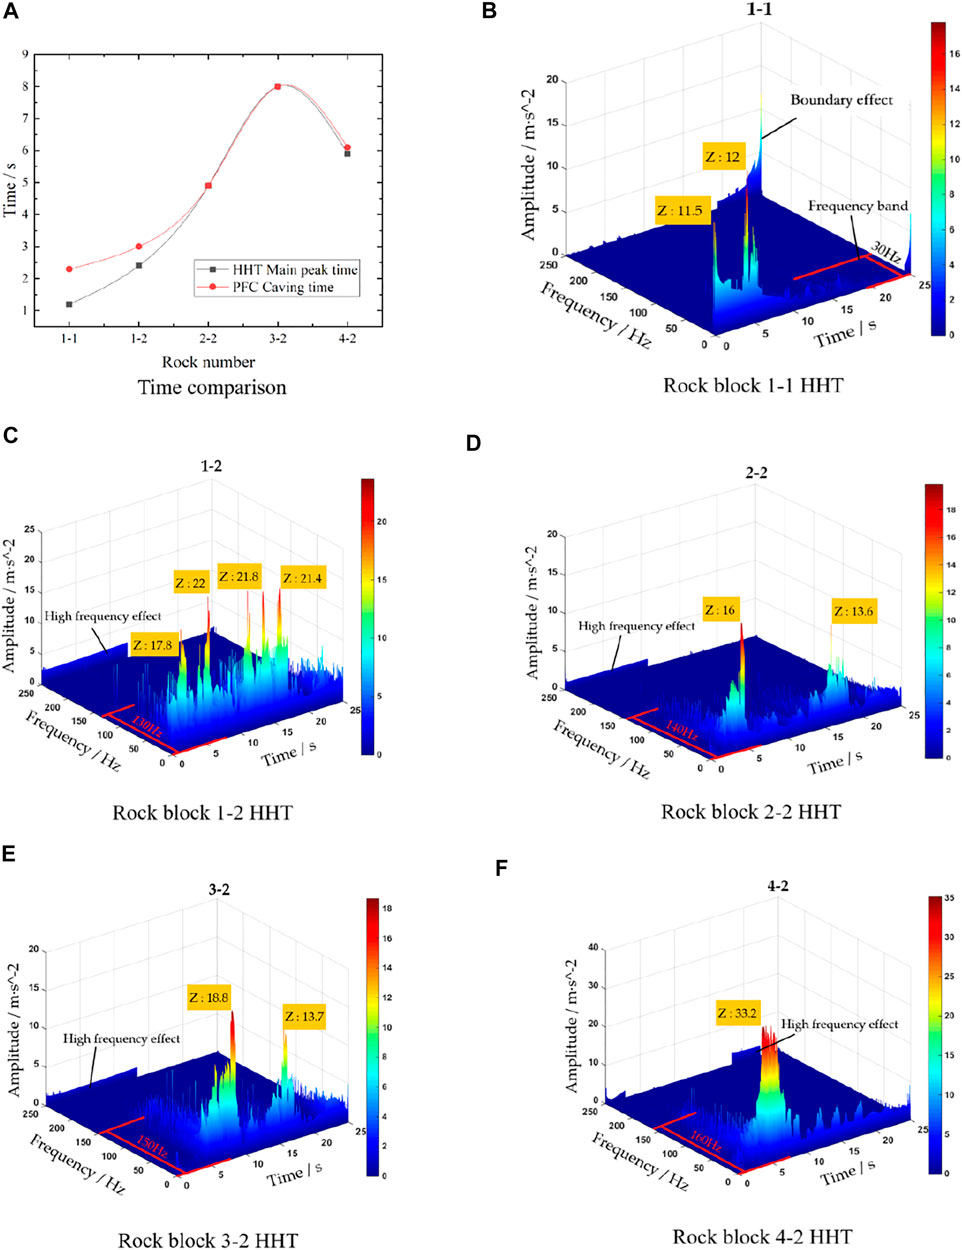
FIGURE 11. HHT Time-frequency spectra.
The diagrams indicate that during strong earthquakes, due to the existence of the elevation amplification effect, the dynamic response of the dangerous rock is intensified, the possibility of interaction increases, and the frequency bands of the dangerous rock slope will be widened. At the same time, high-frequency effects also appear, and the signal wave of the bottom rock layer will have multiple main peaks. Based on our new data we recommend that in earthquake disaster protection projects the structural surface cracks between individual rock blocks should be treated with more care to avoid amplitude energy fluctuation caused by the mutual vibration of the rock blocks. In addition, the stability control of the single dangerous rock should be strengthened. For a model with a crack penetration rate of 62.5% on the structural plane the resonance effect of 0–160 Hz should be considered during earthquakes. Especial attention should be paid to the impact of low-frequency (0–10 Hz) and high-frequency (250 Hz) earthquakes on the failure of slopes consting of horizontally layered dangerous rocks.
Conclusion
Based on fracture mechanics and material mechanics we have established a novel calculation method for the interlayer load and stability coefficient of horizontal layered dangerous rocks during strong earthquakes. The method can not only reveal the stability attenuation law of horizontally layered rock slopes, but also constrain the timing and the complete evolution of failure of individual rock blocks during earthquakes.
Application of the new method to the case study, a slope of dangerous horizontally layered rocks that is exposed along the Provincial Highway 205 in Sichaun (China), shows that with ongoing duration of the 2008 Wenchuan earthquake the stability coefficients of the individual rock blocks gradually decrease and the dangerous rock blocks already collapse prior to the maximum of the seismic acceleration.
A three-dimensional horizontal layered rock slope model, using PFC3D, was established to simulate the failure of the studied slope. The results of the simulation are basically consistent with the calculated data and document a fall-slip-rotation failure of the slope during the earthquake.
Based on our HHT three-dimensional time-frequency analysis, we recommend to treat structural surface cracks between the rock blocks with more care in earthquake disaster protection projects. Moreover, we propose to pay more attention to the impact of low- (0–10 Hz) and high-frequency (250 Hz) earthquakes on the destruction of slopes of dangerous rocks.
Our current simulations and calculations only consider the effects of longitudinal seismic waves. To simulate earthquake damages more precisely further refinement, implementing transversal waves, is required.
Data Availability Statement
The original contributions presented in the study are included in the article/Supplementary Material, further inquiries can be directed to the corresponding authors.
Author Contributions
Write, YT; Modification, YT and YW; Simulation analysis, YT, HL, BR, and HW; Formula derivation, YT and YW; HHT analysis, YT. All authors have read and agreed to the published version of the manuscript.
Funding
This work was financially supported by Guizhou Province Geological Hazard Comprehensive Prevention System Construction 2018 Fund Project (Qiancaijian (2018) No.426). Sichuan Province Science and Technology Planning Project (2021JDZH0030): Demonstration of integrated application of low-discharge treatment technology for rural domestic sewage pollutants in typical areas.
Conflict of Interest
The authors declare that the research was conducted in the absence of any commercial or financial relationships that could be construed as a potential conflict of interest.
Publisher’s Note
All claims expressed in this article are solely those of the authors and do not necessarily represent those of their affiliated organizations, or those of the publisher, the editors and the reviewers. Any product that may be evaluated in this article, or claim that may be made by its manufacturer, is not guaranteed or endorsed by the publisher.
Acknowledgments
The authors are grateful for the help during the experimental work provided by the State Key Laboratory of Geohazard Prevention and Geoenvironment Protection and thank YW (Chengdu University of Technology) for his support of the study. The authors would like to express their gratitude to EditSprings (https://www.editsprings.com/) for the expert linguistic services provided.
References
Alejano, L. R., Gómez-Márquez, I., and Martínez-Alegría, R. (2010). Analysis of a Complex Toppling-Circular Slope Failure. Eng. Geology. 114, 93–104. doi:10.1016/j.enggeo.2010.03.005
Aydan, Ö. (2016). Large Rock Slope Failures Induced by Recent Earthquakes. Rock Mech. Rock Eng. 49 (8), 2503–2524. doi:10.1007/s00603-016-0975-3
Bian, K., Liu, J., and Hu, X. J. (2018). Research on Failure Mode and Dynamic Response of Rock Slopes with Intermittent Joints and Intermittent Joints under Earthquake Action. Rock Soil Mech. 39, 3029–3037. doi:10.16285/j.rsm.2017.0056
Camones, L. A. M., Vargas, E. d. A., de Figueiredo, R. P., and Velloso, R. Q. (2013). Application of the Discrete Element Method for Modeling of Rock Crack Propagation and Coalescence in the Step-Path Failure Mechanism. Eng. Geology. 153, 80–94. doi:10.1016/j.enggeo.2012.11.013
Castro-Filgueira, U., Alejano, L. R., and Ivars, D. M. (2020). Particle Flow Code Simulation of Intact and Fissured Granitic Rock Samples. J. Rock Mech. Geotechnical Eng. 12, 960–974. doi:10.1016/j.jrmge.2020.01.005
Chen, H.-k., and Tang, H.-m. (2007). Method to Calculate Fatigue Fracture Life of Control Fissure in Perilous Rock. Appl. Math. Mech. 28, 643–649. doi:10.1007/s10483-007-0509-1
Chen, H. K., Tang, H. M., and Wang, L. F. (2009a). Theory and Application of Dangerous Rock Collapse Evolution. Beijing: Science Press.
Chen, H. K., Tang, H. M., and Zhu, H. (2006). Research on Duration for Perilous Rock to Form. WSEAS Trans. Appl. Theor. Mechanic 1, 169–173.
Chen, H. K., Xian, X. F., and Tang, H. M. (2009b). Calculation Method of Fracture Mechanics of Dangerous Rock Stability. J. Chongqing Univ. 32, 434–452.
Chen, P. Y., Zeng, H. B., and Shi, H. P. (2016). Particle Flow Fracture Mechanics Method for Evaluating the Stability of Dangerous Rock. J. Nat. Disasters 25, 87–95. doi:10.13577/j.jnd.2016.0310
Chen, W., Xu, Z. M., and Liu, W. L. (2015). Research on Mechanical Model and Failure Mechanism of Different Weathered Dangerous Rock. Geomechanics 36, 195–204. doi:10.16285/j.rsm.2015.01.027
Chen, Z. J. (2001). Research on Modeling Theory and Key Technology of Safety Monitoring for Layered Rock Slope Engineering. Nanjing, China: He Hai University.
China Communications Road and Bridge Technology Co., Ltd (2013). Seismic Code for Highway Engineering. Beijing: Office of the Ministry of Transport.
Havaej, M., and Stead, D. (2016). Investigating the Role of Kinematics and Damage in the Failure of Rock Slopes. Comput. Geotechnics 78 (9), 181–193. doi:10.1016/j.compgeo.2016.05.014
He, X., Zhao, P., and Du, C. L. (2016). Based on PFC2D Numerical Simulation of the Failure Process of the Dangerous Rock Slope. J. Nat. Disasters 25, 167–173. doi:10.13577/j.jnd.2016.0620
Hu, X. J., Bian, K., and Li, P. C. (2017). Particle Flow Simulation of Seismic Dynamic Failure Process of Horizontal Thick Layered Rock Slope. J. Rock Mech. Eng. 36, 2156–2168. doi:10.13722/j.cnki.jrme.2017.0145
Huang, X. F., Zhang, Y. B., and Zhao, X. Q. (2017). Preliminary Discussion on the Movement Characteristics of Dangerous Rock Collapse under Earthquake Conditions. Rock Soil Mech. 38, 583–592. doi:10.16285/j.rsm.2017.02.035
Jiang, J. M., and Hu, H. J. (2010). Numerical Simulation of Triaxial Shear Test of Dense and Loose Granulates under Constant Suction by Discrete Element Method. J. Cent. South Univ. (Natural Sci. Edition) 41, 2350–2359.
Lei, X., and Qing, W. R. (2015). Shear Failure Mechanism of Infilling Rock Joints and its PFC Simulation. Appl. Mech. Mater. 723, 317–321. doi:10.4028/www.scientific.net/AMM.723.317
Li, H., and Wang, L. H. (2013). Study on Mechanism of Soil Arching Effect in Pile-Supported Embankment Based on PFC. Roadbed Eng. 171, 53–57.
Massey, C., Della Pasqua, F., Holden, C., Kaiser, A., Richards, L., Wartman, J., et al. (2017). Rock Slope Response to Strong Earthquake Shaking. Landslides 14 (1), 249–268. doi:10.1007/s10346-016-0684.-810.1007/s10346-016-0684-8
Potyondy, D. O., and Cundall, P. A. (2004). A Bonded-Particle Model for Rock. Int. J. Rock Mech. Mining Sci. 41, 1329–1364. doi:10.1016/j.ijrmms.2004.09.011
Salmi, E. F., and Hosseinzadeh, S. (2015). Slope Stability Assessment Using Both Empirical and Numerical Methods: a Case Study. Bull. Eng. Geol. Environ. 74, 13–25. doi:10.1007/s10064-013-0565-5
Tang, C.-L., Hu, J.-C., Lin, M.-L., Yuan, R.-M., and Cheng, C.-C. (2013). The Mechanism of the 1941 Tsaoling Landslide, Taiwan: Insight from a 2D Discrete Element Simulation. Environ. Earth Sci. 70, 1005–1019. doi:10.1007/s12665-012-2190-1
Tian, Y., Wang, L.-f., Jin, H.-h., Xia, Y.-c., Zeng, B., and Zhang, C. S. (2020a). Failure Mechanism of Horizontal Layered Rock Slope under the Coupling of Earthquake and Weathering. Adv. Civil Eng. 2020, 1–19. doi:10.1155/2020/8825440
Tian, Y., Wang, L., Jin, H., and Zeng, B. (2020b). Dynamic Response of Seismic Dangerous Rock Based on PFC and Dynamics. Adv. Civil Eng. 2020, 1–19. doi:10.1155/2020/8846130
Wang, L. F., Tang, H. M., Tang, F., and Ye, S. Q. (2017). Failure Mechanism of Gently Inclined Layered Rock Slope with Complex Structural Plane. Chin. J. Geotechnical Eng. 39, 2253–2260. doi:10.11779/CJGE201712014
Yuan, W., Zheng, C. C., and Wang, W. (2018). Research on Evaluation Method of Earthquake Bending and Collapse of Dangerous Rock Mass Based on Cantilever Theory. Eng. Sci. Tech. 50, 233–239. doi:10.15961/j.jsuese.201700910
Keywords: earthquake, dangerous rock, fracture mechanics, Newton’s second law, particle flow code, Hilbert–Huang transformation
Citation: Tian Y, Wu Y, Li H, Ren B and Wang H (2021) Earthquake Dynamic Failure Mechanism of Dangerous Rock Based on Dynamics and PFC3D. Front. Earth Sci. 9:683193. doi: 10.3389/feart.2021.683193
Received: 25 March 2021; Accepted: 15 July 2021;
Published: 15 September 2021.
Edited by:
Faming Huang, Nanchang University, ChinaReviewed by:
Qi Yao, China Earthquake Administration, ChinaZheng-yi Feng, National Chung Hsing University, Taiwan
Copyright © 2021 Tian, Wu, Li, Ren and Wang. This is an open-access article distributed under the terms of the Creative Commons Attribution License (CC BY). The use, distribution or reproduction in other forums is permitted, provided the original author(s) and the copyright owner(s) are credited and that the original publication in this journal is cited, in accordance with accepted academic practice. No use, distribution or reproduction is permitted which does not comply with these terms.
*Correspondence: Yun Tian, MzAzNzYxOTg0QHFxLmNvbQ==; Yong Wu, eXd1QGNkdXQuZWR1LmNu