 Yulin Su1,2,3Guangzhi Rong1,2,3Yining Ma1,2,3Junwen Chi4
 Xingpeng Liu1,2,3*Jiquan Zhang1,2,3*Tiantao Li5,6
- 1School of Environment, Northeast Normal University, Changchun, China
- 2Institute of Natural Disaster Research, Northeast Normal University, Changchun, China
- 3Key Laboratory for Vegetation Ecology, Ministry of Education, Changchun, China
- 4School of Information Science and Technology, Northeast Normal University, Changchun, China
- 5College of Environment and Civil Engineering, Chengdu University of Technology, Chengdu, China
- 6State Key Laboratory of Geohazard Prevention and Geo Environment Protection, Chengdu University of Technology, Chengdu, China
Chain disasters often cause greater casualties and economic losses than single disasters. It plays an important role in the prevention and control to draw the susceptibility map and hazard map of geological hazards. To the best of our knowledge, the existing models are not suitable for the study of earthquake–geological disaster chains. Therefore, this study aims to establish a DNN model suitable for the study of earthquake–geological disaster chains. Firstly, nine key factors affecting geological disasters were selected and multi-source data sets were established based on geological disaster points in the study area. Secondly, the DNN model is trained to calculate the susceptibility of landslides and is discussed with the Support Vector Machine (SVM) model, Logistic Regression (LR) model, and Random Forest (RF) model. Finally, verify with the ROC curve. The verification results show that the DNN model has the highest accuracy among the proposed models. It is suitable for drawing geological hazard susceptibility maps and hazard maps. Therefore, it is proved that the model can be applied for the prediction of chain disasters and is a promising tool for geological hazard assessment.
1 Introduction
Geological disasters are one of the major natural disasters in China (Yu and Cheng, 2013). The occurrence of geological disasters is not independent; rather, their formation and activity process have a chain phenomenon (Fan et al., 2019). The occurrence of a main disaster often leads to a series of secondary disasters. This phenomenon is called the disaster chain. The secondary disasters caused by earthquakes can be categorized into mountain disasters, social disasters, economic disasters, and ecological environment disasters (Pourghasemi et al., 2012). Major secondary disasters induced by earthquakes are as follows (Table 1). The disaster chain can be divided into causal chain, homologous chain, mutually exclusive chain, and even row chain. A causal chain disaster only directly or indirectly causes another disaster. A homogeneous disaster chain is a series of disasters that are induced by the same cause and occurring in the same area simultaneously. Chain disasters will drive gradually enlarged accumulation of disasters, leading to more serious damage than a single disaster (Liu and He, 2018). For example, a magnitude 9.0 earthquake in Sumatra, Indonesia in 2004 triggered a huge tsunami across the Indian Ocean, claiming 232,000 deaths. In fact, the number of deaths due to the tsunami far exceeded that due to the earthquake (Rajendran et al., 2005; Tsuji, 2006). In another example, Hurricane Katrina in the United States in 2005 caused large-scale floods and killed thousands of people (Fritz et al., 2007). Similarly, the 2011 Fukushima earthquake in Japan resulted in a tsunami and a leak in a nuclear power plant, killing tens of thousands of people (Shi et al., 2010). Therefore, research from the chain perspective would facilitate prevention and reduction of risks with chain disasters (Zhou et al., 2015; Fan et al., 2019; Wang et al., 2020b; Liu et al., 2020).
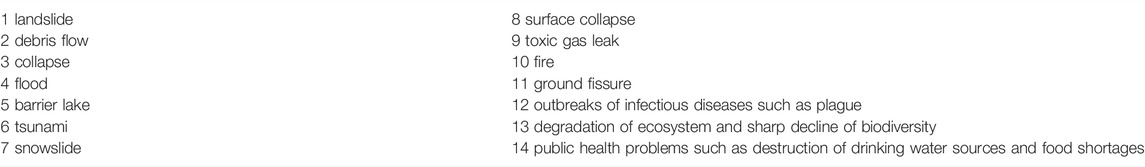
TABLE 1. The potential secondary disasters caused by earthquakes.
As a destructive natural disaster, most of the losses in an earthquake are caused by its chain disaster. The earthquake disaster chain is one of the four major disaster chains (Shi, 2002). The magnitude eight earthquake in Wenchuan, China on May 12, 2008, is a typical earthquake–geological disaster chain. The earthquake caused tens of thousands of large-scale landslides and collapses, killing more than 80,000 people. More than 100,000 km2 of land was destroyed. Then, it was followed by two heavy rainstorms, which increased the probability of mudslides and floods. Meanwhile, landslides blocked the rivers to form barrier lakes, part of the landslide dam collapsed, and the flood caused serious damage downstream (Xu et al., 2009; Kumar et al., 2017; Singh, 2020). Therefore, it is very important to assess the hazard of earthquake disaster chain for comprehensive disaster risk management.
At present, deep learning has been widely used in various fields due to its powerful self-learning function. Based on unsupervised learning methods, it can optimize training data based on feature learning. Compared with the traditional neural network model, the deep learning model has more layers of structure, stronger learning ability, and stronger ability to express the characteristics of research objects than traditional methods. Therefore, it has the potential applications in natural disaster spatial modeling and prediction (Liu and Wu, 2015; Wang et al., 2020a; Wu et al., 2020; Fang et al., 2021). Plenty of studies have applied machine learning models to produce reliable susceptibility maps (Singh and Kumar, 2017; Singh and Kumar, 2018; Hussain et al., 2019). At present, Bayesian network models, Convolutional Neural Network (CNN) models (Wang et al., 2019b), Logistic Regression (LR) models (Bui et al., 2016), Decision Trees (Hong et al., 2018), Support Vector Machines (SVMs) (Wang et al., 2019a; Deb et al., 2020; Mansaray et al., 2020; Mohebbi Tafreshi et al., 2020), and Random Forests (RFs) (Kim et al., 2018; Mansaray et al., 2020; Sahin, 2020) are often used for geological disaster risk assessment. However, most of the existing models describe a single disaster and cannot fully describe the structure and probability of chain disasters. Therefore, a model suitable for earthquake–geological disaster chains was established by using deep learning in this study. To verify the reliability of the model, this model was compared with several advanced machine learning technologies. As a case study, the susceptibility and hazard of geological disasters in Mao County area are evaluated, and the receiver operating characteristics (ROC), Kappa index, and various statistical evaluation indicators are used to assess and verify the optimality of the model established in this study.
2 Study Area and Data
2.1 Study Area
Mao County is located in the northwestern part of Sichuan Province, the southeastern edge of the Qinghai-Tibet Plateau in the southeastern part of the Aba Tibetan and Qiang Autonomous Prefecture, and the upper reaches of the Minjiang River. The total area is 3,885.6 km2, the annual mean temperature is 11.2°C, the annual precipitation is 490.7 mm, the sunshine duration is 1,557 1°h, and the total population is 110,000 people. Most of Maoxian peaks are about 4,000 m above sea level; the terrain is dominated by alpine valleys, and they are located in the Longmenshan fault zone. Due to numerous mountains and valleys, strong neotectonics movement, and frequent and destructive disasters such as earthquakes, landslides, collapses, and mudslides, the complex disaster-generating environment and the distribution pattern of disaster-bearing bodies have made the regional characteristics of the symbiosis of multiple disasters increasingly apparent. The geographical location of Maoxian County is shown in Figure 1.
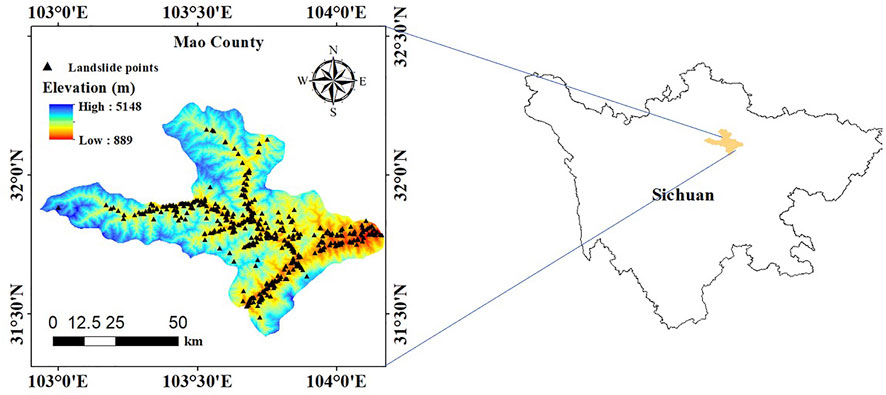
FIGURE 1. The location and geological disaster points of Mao County, China.
2.2 Longmenshan Fault Zone
The Longmenshan fault zone is a northeast–southwest trending fault zone, 500°km long and about 50–70°km wide. It belongs to an important transitional zone of terrain, climate, soil, vegetation, and biodiversity in China (Verberne et al., 2010). It is formed by the eastward extrusion of the Qinghai-Tibet Plateau and the blocking of the South China Plate. The geological structure and evolutionary history are quite complex. The surface topography and rock properties are completely different in various sections, with strong segmentation characteristics (Ran et al., 2010), including three main fault zones: the Longmenshan-Houshan fault zone, also known as the Wenchuan-Maowen fault; the Longmenshan main central fault zone, also known as Yingxiu-Beichuan fault; and the Longmenshan-Qianshan fault zone, also known as Guanxian-Pengxian fault (Lichun et al., 2013). The Longmenshan fault zone is an earthquake-hazard zone, with all three main stems at risk of earthquakes of magnitude seven and above. The Wenchuan earthquake in 2018 occurred in the middle section of the Longmenshan fault zone, which was severely damaged after the earthquake (Lei and Zhao, 2009) (Figure 2). (Fault zone data come from the China Seismological Network Center.)
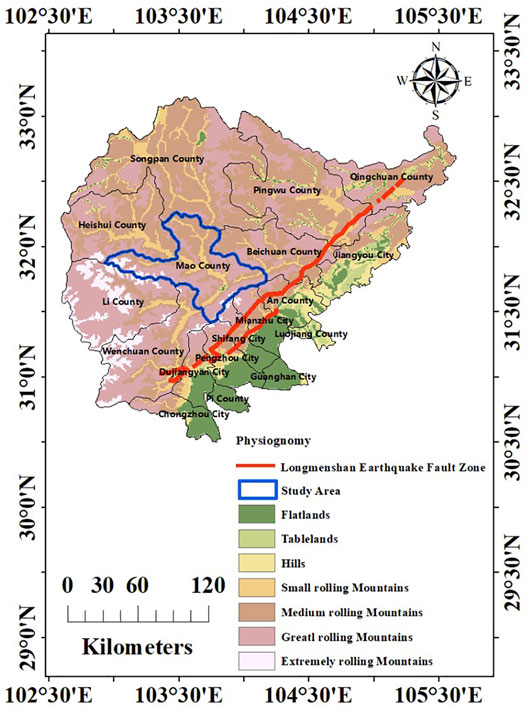
FIGURE 2. Longmenshan fault zone.
2.3 Data
This study considered eight impact factors, namely, six topographic factors (elevation, slope, aspect, plane curvature, profile curvature, land use type, and distance from fault line), a geological factor (lithology), and a meteorological factor (annual mean rainfall). The 30-m-resolution digital elevation model (DEM) was used to extract the topographical factors in this study. Geological seismic factors come from the websites of the China Earthquake Administration and China Geological Administration. The specific description of these control factors is as follows (Figure 3).
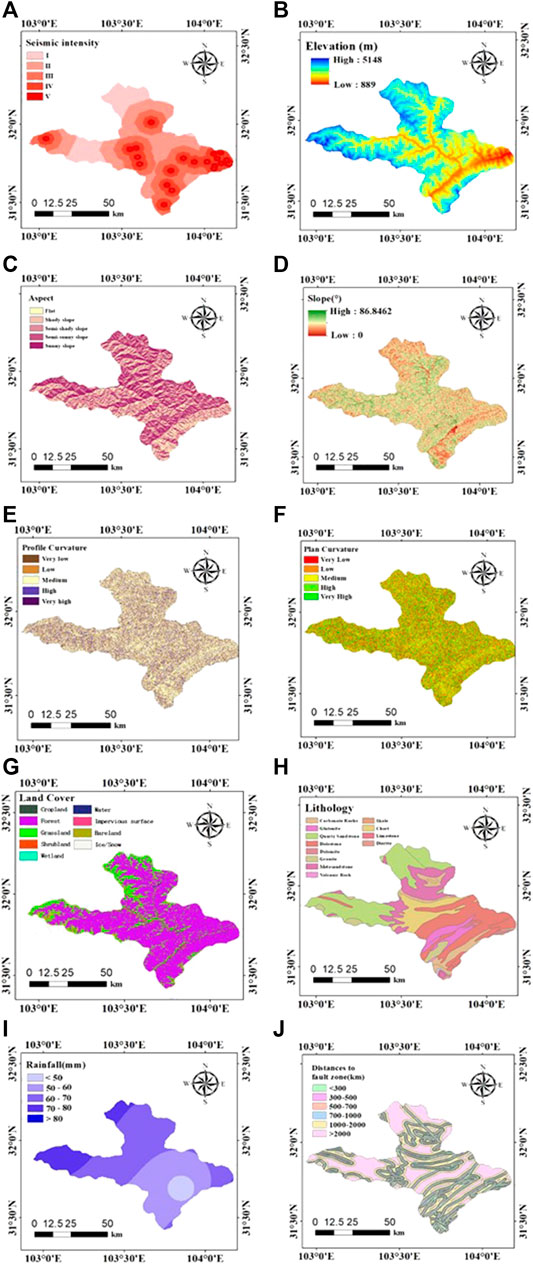
FIGURE 3. Thematic maps of key factors. (A) Seismic intensity, (B) elevation (C) aspect, (D) slope, (E) profile curvature, (F) plane curvature, (G) land cover, (H) lithology (I) rainfall, and (J) distance to fault zone.
Earthquake intensity refers to the intensity and influence of ground motions caused by earthquakes and is an important inducing factor in the chain of earthquake–geological disasters. Based on 153 isoseismal data and statistical analysis, the intensity
Assuming that an earthquake with a magnitude of 6.0 on the Richter scale occurs in the demonstration area, Eq. 1 can be rewritten as a function of the seismic intensity
Based on Eq. 1 and Eq. 2, the seismic intensity map of the study area in case of an earthquake with a magnitude of 6.0 on the Richter scale can be obtained (Figure 3).
Elevation is strongly affected by earthquakes, and high altitudes affected by earthquakes may produce relatively strong vibrations and are prone to geological disasters such as landslides. The DEM data used in this study come from the ASTER-GDEM digital elevation data jointly developed by Japan’s METI and the United States’ NASA. The DEM data with a precision of 30 m are obtained and processed by ArcGIS to obtain terrain data such as slope, aspect, and curvature.
The difference in the aspect of the slope will lead to different precipitation, sunlight, vegetation distribution, and the degree of weathering of the slope (Dai and Lee, 2002; Pourghasemi et al., 2012). The aspect direction is divided into flat (−1°–0°), shade (0°–45°, 315°–360°), semi-shady slope (45°–90°, 270°–315°), semi-sun slope (90°–135°, 225°–270°), sunny slope (135°–225°), and flat slope 5 grades. Slope describes the degree of inclination of the slope. Due to gravity, steep slopes are more prone to geological disaster (Xu and Xu, 2012).
The curvature reflects the complexity of the terrain. Plane curvature is the degree to which the curve deviates from a straight line, and the profile curvature is essentially the rate of change of the ground slope. A positive curvature means that the slope is convex outward, a negative curvature means that the slope is concave inward, and a zero value means a straight slope (Xu et al., 2014).
Different types of land cover will also cause differences in hydraulic parameters such as mineral composition, structural structure, density, porosity, seismic strength, and permeability coefficient (Pham et al., 2016). According to the ratio of count of disasters to area of disasters in each land use type, classify them; the first category: cropland and water; the second category: shrubland and impervious surface; and the third category: forest, grassland, bare land, and land cover types that do not exist in the study area: wetland, tundra, and snow/ice.
Lithology is one of the commonly used geological factors. Some rocks have high seismic strength and some are relatively brittle. A total of 12 strata of different lithologies are distributed in the study area, which are divided into six categories: carbonate, shale, sandy rock, granite, slate, and volcanic rock. The lithology map and geochronometer map were digitized from geological maps obtained from the China Geology Survey. Faults control the formation and development of landslides and geological processes near the faults are more active. The distance to faults were calculated by using spatial shortest distance method.
Rainfall is one of the important factors that induce geological disaster. The complex pores and cracks in the landslide provide channels for water. The pore pressure causes changes in the seismic strength of the rock and soil, which affects the stability of the slope. The rainfall data were downloaded at the China Meteorological Data Service Center and the annual average rainfall data are averages from 1981 to 2018. To quantify the above influencing factors of earthquake disaster chains, the classification system of these influencing factors is listed in Table 2.
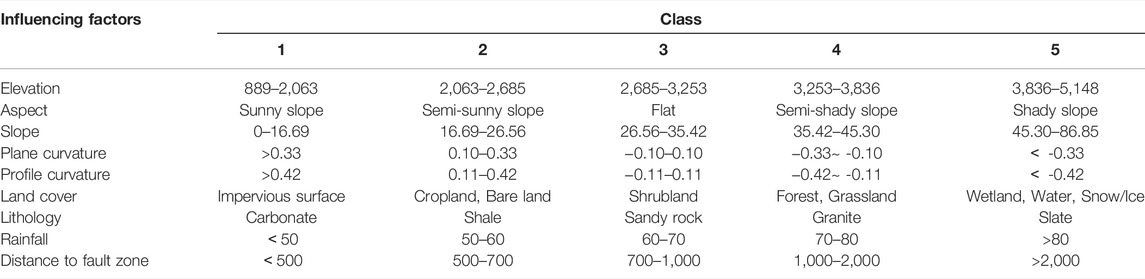
TABLE 2. The classification of each influencing factor value.
Aiming to establish the hazard model of earthquake disaster chains, the study firstly established a 30 m * 30 m grid net in the study area and classified the data set into binary categories, that is, disasters have occurred and no disasters have occurred. The assigned value of geological disasters that have occurred is “1”, and the value of non-occurring disasters is “0”. Then, the continuous variables of each factor feature are re-divided and recorded in the attribute table of each grid net, and the reclassified method of natural breaks is used to classify them to construct the multi-source data set of earthquake disaster chain. We extracted 4,753,899 pieces of data from the study area. If the whole area of geohazards is used as positive samples, it will produce serious spatial autocorrelation; therefore, each geohazard needs to be represented by one point (Dou et al., 2020). It is known that there are 427 geological disaster points caused by earthquakes, namely, 106 unstable slopes, 89 collapse disasters, 181 landslide disasters, and 51 debris flow disasters. An equal number of 427 non-hazardous points are randomly selected from the data set, and the disaster points are used as a sample set. Select 70% of the sample set as the training set and 30% of the test set.
3 Methods
3.1 System Components of the Earthquake Disaster Chains
The earthquake disaster chain in the study area is mainly composed of earthquake–collapse–landslide–debris flow. There are some correlations between them, and the relationship is shown in Table 3.
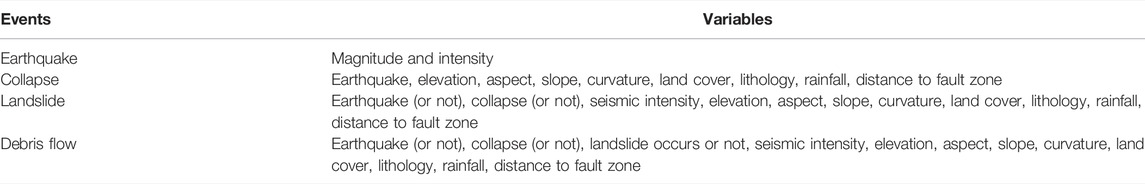
TABLE 3. Variables of earthquake disaster chains.
3.2 Deep Learning Method and Comparison Algorithms
In this study, a total of four classifiers, namely, Deep Neural Network (DNN), SVM, RF, and LR, are selected for comparison. Integrate all the samples of disasters into a data set to model the entire chain of geological disasters. Use Python programming environment, Tensorflow, Matlab 7.11, and ArcGIS 10 for analysis (Figure 4).
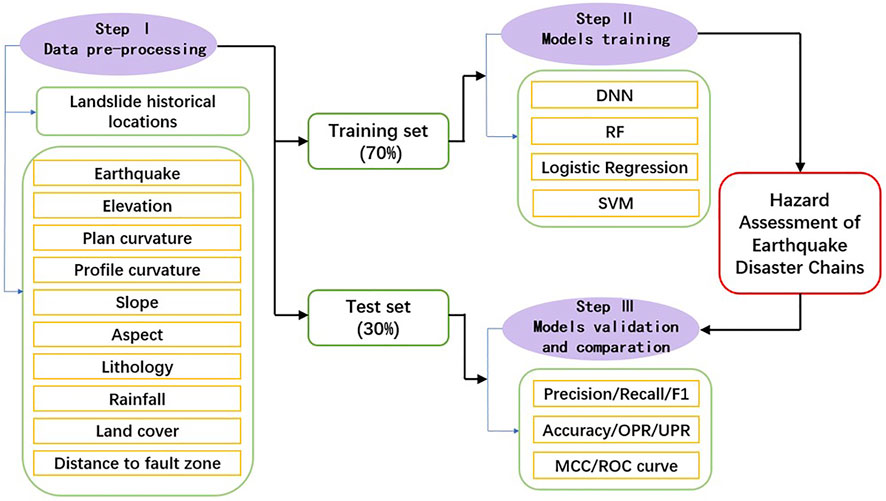
FIGURE 4. Flow chart of this paper.
3.2.1 Deep Neural Network (DNN) Model
DNN can be understood as a neural network with many hidden layers; it can also be called multi-layer perceptron (MLP). A typical neural network model usually contains three layers, namely, the input layer, the hidden layer, and the output layer (Wang et al., 2009), which is composed of several Restricted Boltzmann Machine (RBM) models. RBM is an available stochastic neural network. When the first layer of RBM model is trained, the result is used as the input layer of the next layer of RBM model to continue training, and so on, until the final result is obtained. Compared with the traditional neural network, the DNN model can contain multiple hidden layers, which can enhance the expressive ability of the model; the neurons in the output layer can also have more than one output, and can have multiple outputs, so that the model can be flexibly applied to classification return. The model parameter settings in this experiment are shown in Table 4. The other three models all use the default parameters of the Sklearn (Scikit-Learn) module. DNNs can play an important role in risk assessment due to their strong nonlinear learning and fitting capabilities (Lecun et al., 2015).
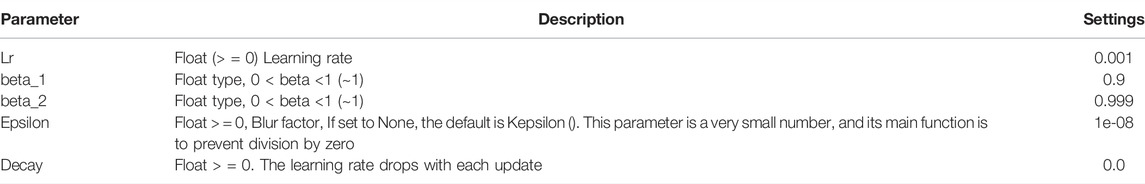
TABLE 4. DNN model hyper-parameter setting table.
3.2.2 Random Forest (RF) Model
RF refers to a classification model that uses multiple decision trees as classifiers to train and predict samples. The basic principle is to use bootstrap resampling technology to randomly select a certain number of samples from the original training samples to generate a new training sample set, repeat this, and then generate multiple completely independent decisions based on the selected new training samples tree classifier, and these combined decision trees are RF models (Youssef et al., 2016; Chen et al., 2017b). The RF model has the advantage of processing high-dimensional samples and does not need to reduce the latitude.
3.2.3 Logistic Regression (LR) Model
The LR model is a multivariate regression method, a supervised multivariate statistical learning method mainly used to classify samples; its purpose is to find the best-fitting model, a set of independent parameters to describe the existent or non-existent relationship (Chen et al., 2017a).
3.2.4 Support Vector Machines (SVM) Model
SVM is a machine learning method based on statistical learning theory that transforms original input space into a higher-dimensional feature space to find an optimal separating hyperplane (Abe, 2001; Kavzoglu and Colkesen, 2009). It is mainly used to solve data classification problems in the field of pattern recognition. It shows many unique advantages in solving small sample, nonlinear, and high-dimensional pattern recognition, and can be extended to other machine learning problems such as function fitting.
3.3 Model Evaluation
Model evaluation is an absolutely essential component in the development of hazard assessment of earthquake disaster chains (Pourghasemi et al., 2012). In order to evaluate the overall performance of the three geological hazard susceptibility models, the true positive (TP), false positive (FP), true negative (TN), and false negative (FN) are chosen as the statistical basis, and use Precision, Recall, F1 value, Accuracy, the overprediction rate (OPR), the unpredicted presence rate (UPR), Matthews correlation coefficient (MCC), and receiver operating characteristic (ROC) curve methods to verify the accuracy of the model (Rong et al., 2020).
The
Accuracy is the proportion that the model can correctly classify all positive and negative samples, which can be estimated using Eq. 6:
OPR, also called the commission error, is the proportion of the wrongly classified disaster grids identified by the model:
UPR is the proportion that the model fails to classify correctly in the actual disaster point grid, which is calculated using Eq. 8:
MCC can evaluate a binary classification model. The MCC formula is as follows:
The range of MCC values is from −1 to 1. The larger the value, the more accurate the model.
The ROC curve is a common method for evaluating landslide prediction models (Bui et al., 2016). It is plotted based on the “Sensitivity” and the “1 − Specificity,” which helps to indicate the quality of the probabilistic prediction system (Akgun, 2012), and it has been used for this study:
The model performance can be indicated by calculating the area under the curve (AUC). The threshold for AUC values is 0.5–1. The closer it is to one, the more accurate is the model (Alatorre et al., 2011).
3.4 Geological Disaster Hazard Assessment Model
Geological disaster hazard assessment model is established as follows:
where
4 Results
In the environment of python 3.7, this study firstly uses the graded factor levels in the database as input data for the DNN model, and uses the extracted control factor information to train and test the DNN model. Then, based on the training data obtained by the DNN model, the geological disaster sensitivity value of each grid point is obtained through ArcGIS, and the Natural Breaks approach is used to divide it into five categories, as shown in Figure 5. The areas with very high susceptibility of geological hazard in red are concentrated near the locations with high earthquake intensity. This is the same as we expected (Figure 5).
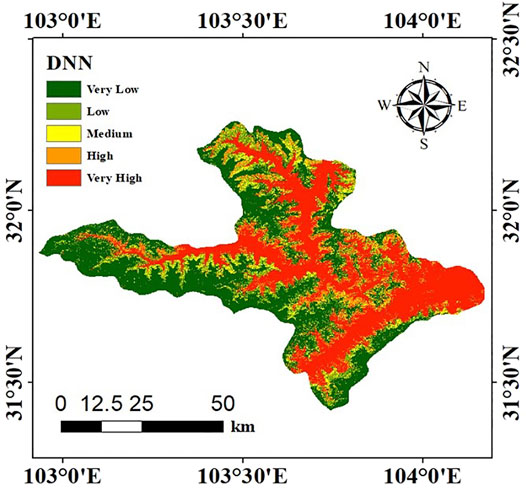
FIGURE 5. Geological disaster susceptibility map.
According to Eq. 12, the hazard assessment of earthquake disaster chain maps is shown in Figure 6. High-risk areas of geological disasters are mainly concentrated near the fault zone. The higher the seismic intensity is, the stronger the geological activity is. What is more, it has a higher risk of geological disasters.
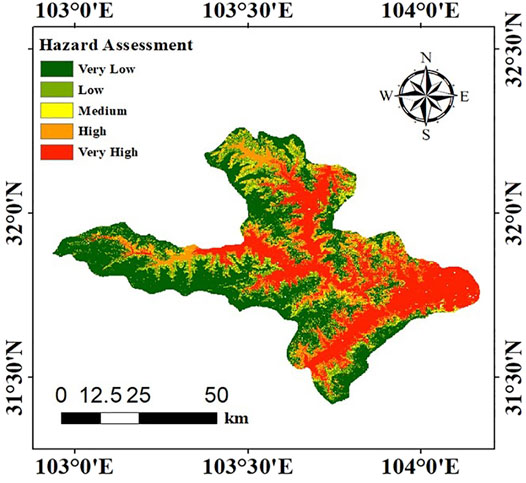
FIGURE 6. The hazard map of geological disaster.
5 Discussion
In order to verify the model, this study chooses a variety of evaluation methods based on TP, TN, FP, and FN to evaluate different models. TP is the data in which the predicted value and actual value obtained by the model are both positive samples. FP is the data whose predicted value obtained by the model is a positive sample and the actual value is a negative sample. TN is the data in which the predicted value and actual value obtained by the model are both negative samples. FN is the data whose predicted value obtained by the model is the negative sample and actual value is the positive sample. Get their values through statistics. Table 5 shows the multiple validation indexes of DNN, RF, LR, and SVM models.
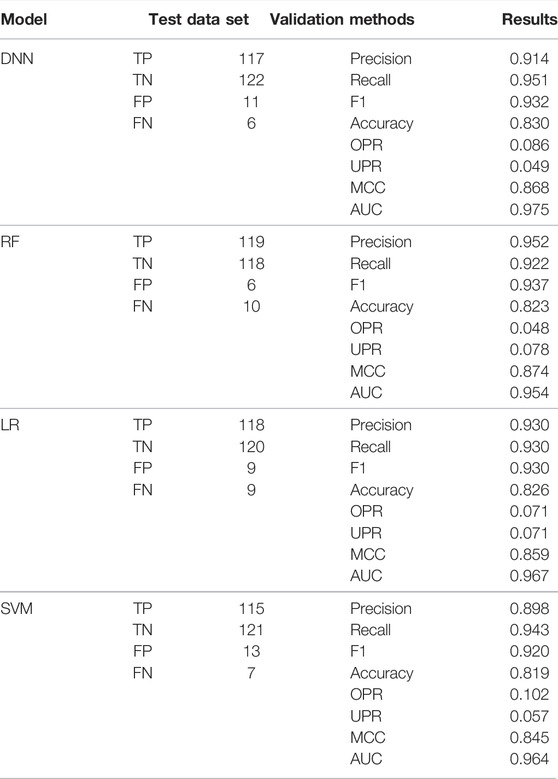
TABLE 5. Model validation results using multiple methods.
From the results, several models generally have higher prediction effects, especially the DNN model. The higher the precision, the better the model predicts negative samples. A higher recall value proves that the model has a better prediction effect on negative samples. The MCC coefficient is an indicator of the comprehensive performance of the model. So, the DNN model is more sensitive to the prediction of non-landslide points. Figure 7 shows the ROC curves of the four models. The DNN model has the highest AUC value, followed by LR, SVM, and RF.
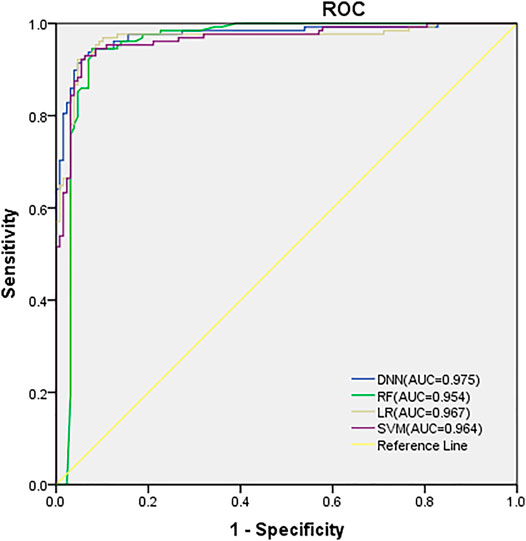
FIGURE 7. The ROC curve of the four models.
The formation of geological disasters is a very complex process, which is influenced by several topographic conditions and environmental factors. A geological hazard map is of great significance to the spatial analysis of geological hazards.
This study proposes a DNN model suitable for the earthquake–geological disaster chain, which evaluates the risk of geological disasters in Maoxian County. According to the visual analysis of the disaster risk map of the earthquake–geological disaster chain, the places with high risk of geological disasters are concentrated. It is near the fault zone and is mainly affected by earthquakes. The higher the seismic intensity, the stronger the geological activity and the more likely that geological disasters will occur.
The properties and applicability of these models need to be validated and evaluated by different perspectives and methods. It can be seen from the data in Table 4 that the model is very effective in predicting positive and negative samples, especially for negative samples. This article discusses and compares the DNN model created in this article with the other three commonly used models. From the results, it can be seen that the AUC values of the four models are DNN, LR, SVM, and RF, and the accuracy of the DNN model created in this article (Accuracy = 0.830, AUC = 0.975) is higher than that of the other three models, which proves that this model has good performance. It is suitable for the chain of geological disasters induced by earthquakes and provides good ideas for future prevention and early warning.
6 Conclusion
Geological disasters are one of the most common natural disasters. Collapses, landslides, and debris flows are the three most important types. This study proposes a hazard assessment model suitable for the earthquake–geological disaster chain. The model is created by DNN, and ArcGIS is used to generate the earthquake–geological disaster chain susceptibility map and the hazard map. Through the observation of the hazard map of the earthquake disaster chain, it is found that the high-risk area is mainly located in the location with high earthquake intensity and close to the fault zone. This article also lists three commonly used models, RF, SVM, and LR, for comparison, and the results show that the accuracy AUC value of the DNN model is higher than the other three. It shows that the model is suitable for the study of the earthquake–geological disaster chain. It performs well and plays an important role in the prediction of potential landslides in the future. Besides, it can provide a decision-making basis for landslide warning and prevention.
Author Contributions
Conceptualization, YS and XL; Data curation, YS and GR; Formal analysis, YS and JC; Funding acquisition, JZ and TL; Methodology, YS and GR; Writing—original draft, YS; Writing—review and editing, YS and YM. All authors have read and agreed to the published version of the manuscript.
Funding
This work was supported by the National Key R and D Program of China (2018YFC1508804); the Key Scientific and Technology Program of Jilin Province (20170204035SF); the Key Scientific and Technology Research and Development Program of Jilin Province (20180201033SF); the Key Scientific and Technology Research and Development Program of Jilin Province (20180201035SF); and the National Natural Science Foundation for Youth of China (41907238).
Conflict of Interest
The authors declare that the research was conducted in the absence of any commercial or financial relationships that could be construed as a potential conflict of interest.
Publisher’s Note
All claims expressed in this article are solely those of the authors and do not necessarily represent those of their affiliated organizations, or those of the publisher, the editors, and the reviewers. Any product that may be evaluated in this article, or claim that may be made by its manufacturer, is not guaranteed or endorsed by the publisher.
Acknowledgments
The authors are thankful to the reviewers for their useful suggestions.
References
Abe, S. (2001). “Support Vector Machines for Pattern Classification,” in Proceedings of the International Joint Conference on Neural Networks, 7535–7543.
Akgun, A. (2012). A Comparison of Landslide Susceptibility Maps Produced by Logistic Regression, Multi-Criteria Decision, and Likelihood Ratio Methods: a Case Study at İzmir, Turkey. Landslides 9 (1), 93–106. doi:10.1007/s10346-011-0283-7
Alatorre, L. C., Sánchez-Andrés, R., Cirujano, S., Beguería, S., and Sánchez-Carrillo, S. (2011). Identification of Mangrove Areas by Remote Sensing: The ROC Curve Technique Applied to the Northwestern Mexico Coastal Zone Using Landsat Imagery. Remote Sensing 3 (8), 1568–1583. doi:10.3390/rs3081568
Tien Bui, D., Tuan, T. A., Klempe, H., Pradhan, B., and Revhaug, I. (2016). Spatial Prediction Models for Shallow Landslide Hazards: a Comparative Assessment of the Efficacy of Support Vector Machines, Artificial Neural Networks, Kernel Logistic Regression, and Logistic Model Tree. Landslides 13 (2), 361–378. doi:10.1007/s10346-015-0557-6
Chen, W., Pourghasemi, H. R., and Zhao, Z. (2017a). A GIS-Based Comparative Study of Dempster-Shafer, Logistic Regression and Artificial Neural Network Models for Landslide Susceptibility Mapping. Geocarto Int. 32 (4), 367–385. doi:10.1080/10106049.2016.1140824
Chen, W., Shirzadi, A., Shahabi, H., Ahmad, B. B., Zhang, S., Hong, H., et al. (2017b). A Novel Hybrid Artificial Intelligence Approach Based on the Rotation forest Ensemble and Nave Bayes Tree Classifiers for a Landslide Susceptibility Assessment in Langao County, China. Geomatics Nat. Hazards Risk 8 (2), 1955–1977. doi:10.1080/19475705.2017.1401560
Dai, F., and Lee, C. (2002). Landslide Characteristics and Slope Instability Modeling Using GIS, Lantau Island, Hong Kong. Geomorphology 42 (3), 213–228. doi:10.1016/s0169-555x(01)00087-3
Deb, D., Deb, S., Chakraborty, D., Singh, J. P., Singh, A. K., Dutta, P., et al. (2020). Aboveground Biomass Estimation of an Agro-Pastoral Ecology in Semi-arid Bundelkhand Region of India from Landsat Data: a Comparison of Support Vector Machine and Traditional Regression Models. Geocarto Int, 1–16. doi:10.1080/10106049.2020.1756461
Dou, J., Yunus, A. P., Merghadi, A., Shirzadi, A., and Pham, B. T. (2020). Different Sampling Strategies for Predicting Landslide Susceptibilities Are Deemed Less Consequential with Deep Learning. Sci. Total Environ. 720, 137320. doi:10.1016/j.scitotenv.2020.137320
Fan, X., Scaringi, G., Korup, O., West, A. J., Westen, C. J., Tanyas, H., et al. (2019). Earthquake‐Induced Chains of Geologic Hazards: Patterns, Mechanisms, and Impacts. Rev. Geophys. 57 (2), 421–503. doi:10.1029/2018rg000626
Fang, Z., Wang, Y., Duan, G., and Peng, L. (2021). Landslide Susceptibility Mapping Using Rotation Forest Ensemble Technique with Different Decision Trees in the Three Gorges Reservoir Area, China. Remote Sensing 13 (2), 238. doi:10.3390/rs13020238
Fritz, H. M., Blount, C., Sokoloski, R., Singleton, J., Fuggle, A., Mcadoo, B. G., et al. (2007). Hurricane Katrina Storm Surge Distribution and Field Observations on the Mississippi Barrier Islands. Estuarine Coastal Shelf Sci. 74 (1-2), 12–20. doi:10.1016/j.ecss.2007.03.015
Huang, Y., and Cheng, H. (2013). The Impact of Climate Change on Coastal Geological Disasters in Southeastern China. Natural Hazards 65 (1), 377–390. doi:10.1007/s11069-012-0370-7
Hong, H., Liu, J., Bui, D. T., Pradhan, B., Acharya, T. D., Pham, B. T., et al. (2018). Landslide Susceptibility Mapping Using J48 Decision Tree with AdaBoost, Bagging and Rotation Forest Ensembles in the Guangchang Area (China). Catena 163, 399–413. doi:10.1016/j.catena.2018.01.005
Hussain, G., Singh, Y., Singh, K., and Bhat, G. M. (2019). Landslide Susceptibility Mapping along National Highway-1 in Jammu and Kashmir State (India). Innov. Infrastruct. Solut. 4 (1), 59. doi:10.1007/s41062-019-0245-9
Kavzoglu, T., and Colkesen, I. (2009). A Kernel Functions Analysis for Support Vector Machines for Land Cover Classification. Int. J. Appl. Earth Obs. Geoinf. 11 (5), 352–359. doi:10.1016/j.jag.2009.06.002
Kim, J. C., Lee, S., and Jung, H. S. (2018). Landslide Susceptibility Mapping Using Random forest and Boosted Tree Models in Pyeong-Chang, Korea. Geocarto Int. 33 (9), 1000–1015. doi:10.1080/10106049.2017.1323964
Kumar, M., Rana, S., Pant, P. D., and Patel, R. C. (2017). Slope Stability Analysis of Balia Nala Landslide, Kumaun Lesser Himalaya, Nainital, Uttarakhand, India. J. Rock Mech. Geotechn. Eng. 9 (1), 150–158. doi:10.1016/j.jrmge.2016.05.009
Lecun, Y., Bengio, Y., and Hinton, G. (2015). Deep Learning. Nature 521 (7553), 436–444. doi:10.1038/nature14539
Lei, J., and Zhao, D. (2009). Structural Heterogeneity of the Longmenshan Fault Zone and the Mechanism of the 2008 Wenchuan Earthquake (Ms 8.0). Geochem. Geophys. Geosystems 10 (10), 1–17. doi:10.1029/2009gc002590
Lichun, C., Yongkang, R., Hu, W., Yanbao, L. I., Xinquan, M. A., Geology, I. O., et al. (2013). The Lushan M_S7.0 Earthquake and Activity of the Southern Segment of the Longmenshan Fault Zone. Chin. Sci. Bull. 58, 3475–3482. doi:10.1007/s11434-013-6009-6
Liu, W., and He, S. (2018). Dynamic Simulation of a Mountain Disaster Chain: Landslides, Barrier Lakes, and Outburst Floods. Nat. Hazards 90, 757–775. doi:10.1007/s11069-017-3073-2
Liu, A., and Wu, C. (2015). Research on Risk Assessment Method of Disaster Chain Based on Complex Network. Syst. Eng. Theory Pract. 35 (2), 466–472.
Liu, W., Ju, N., Zhang, Z., Chen, Z., and He, S. (2020). Simulating the Process of the Jinshajiang Landslide-Caused Disaster Chain in October 2018. Bull. Eng. Geol. Environ. 79 (1), 2189–2199. doi:10.1007/s10064-019-01717-6
Mansaray, L. R., Wang, F. M., Kanu, A. S., and Yang, L. B. (2020). Evaluating Sentinel-1A Datasets for rice Leaf Area index Estimation Based on Machine Learning Regression Models. Geocarto Int., 1–11. doi:10.1080/10106049.2020.1773545
Mohebbi Tafreshi, G., Nakhaei, M., and Lak, R. (2020). Subsidence Risk Assessment Based on a Novel Hybrid Form of a Tree-Based Machine Learning Algorithm and an index Model of Vulnerability. Geocarto Int, 1–23. doi:10.1080/10106049.2020.1841835
Pham, B. T., Bui, D. T., Prakash, I., and Dholakia, M. B. (2016). Evaluation of Predictive Ability of Support Vector Machines and Naive Bayes Trees Methods for Spatial Prediction of Landslides in Uttarakhand State (India) Using GIS. J. Geomatics 10 (1), 71–79.
Pourghasemi, H. R., Mohammady, M., and Pradhan, B. (2012). Landslide Susceptibility Mapping Using index of Entropy and Conditional Probability Models in GIS: Safarood Basin, Iran. Catena 97 (15), 71–84. doi:10.1016/j.catena.2012.05.005
Rajendran, K., Rajendran, C. P., and Earnest, A. (2005). The Great Sumatra-Andaman Earthquake of 26 December 2004. Curr. Sci. 88 (1), 11–12.
Ran, Y., Chen, L., Jie, C., Hu, W., Chen, G., Yin, J., et al. (2010). Paleoseismic Evidence and Repeat Time of Large Earthquakes at Three Sites along the Longmenshan Fault Zone. Tectonophysics 491 (1-4), 141–153. doi:10.1016/j.tecto.2010.01.009
Rong, G., Alu, S., Li, K., Su, Y., Zhang, J., Zhang, Y., et al. (2020). Rainfall Induced Landslide Susceptibility Mapping Based on Bayesian Optimized Random Forest and Gradient Boosting Decision Tree Models-A Case Study of Shuicheng County, China. Water 12 (11), 3066. doi:10.3390/w12113066
Sahin, E. K. (2020). Comparative Analysis of Gradient Boosting Algorithms for Landslide Susceptibility Mapping. Geocarto Int. 2020, 1–25. doi:10.1080/10106049.2020.1831623
Shen, X., and Cao, L. (2017). Tree-Species Classification in Subtropical Forests Using Airborne Hyperspectral and LiDAR Data. Remote Sens. Basel 9 (11), 1180. doi:10.3390/rs9111180
Shi, P., Shuai, J., Chen, W., and Lu, L. (2010). Study on Large-Scale Disaster Risk Assessment and Risk Transfer Models. Int. J. Disaster Risk Sci. 1 (2), 1–8. doi:10.3974/j.issn.2095-0055.2010.02.001
Shi, P. (2002). Theory on Disaster Science and Disaster Dynamics. J. Nat. Disasters 11 (3), 1–9. doi:10.1007/s11769-002-0026-8
Singh, K., and Kumar, V. (2017). Landslide hazard Mapping along National highway-154A in Himachal Pradesh, India Using Information Value and Frequency Ratio. Arabian J. Geosci. 10 (24), 1–18. doi:10.1007/s12517-017-3315-3
Singh, K., and Kumar, V. (2018). Hazard Assessment of Landslide Disaster Using Information Value Method and Analytical Hierarchy Process in Highly Tectonic Chamba Region in Bosom of Himalaya. J. Mt. Sci. 15 (4), 808–824. doi:10.1007/s11629-017-4634-2
Singh, K. (2020). Road-cut Slope Stability Assessment along Himalayan National Highway NH-154A, India. J. Geol. Soc. India 96 (5), 491. doi:10.1007/s12594-020-1587-9
Sun, J. (2009). Vibration Isolation for Large Vertical Storage Tanks:theory, Method, test[M]. Science Press.
Tsuji, Y., Tanioka, Y., Matsutomi, H., Nishimura, Y., Kamataki, T., Murakami, Y., et al. (2006). Damage and Height Distribution of Sumatra Earthquake-Tsunami of December 26, 2004, in Banda Aceh City and its Environs. J. Disaster Res. 1 (1), 103–115. doi:10.20965/jdr.2006.p0103
Verberne, B. A., He, C., and Spiers, C. J. (2010). Frictional Properties of Sedimentary Rocks and Natural Fault Gouge from the Longmen Shan Fault Zone, Sichuan, China. Bull. Seismol. Soc. America 100 (5B), 2767–2790. doi:10.1785/0120090287
Wang, C. Z., Chen, G. J., Tan, R. Z., and Wen, L. K. (2009). Preliminary Study on the Secondary Mountain Disaster Chains Induced by Wenchuan Earthquake. J. Sichuan Univ. 41 (S1), 84–88.
Wang, Y., Duan, H., and Hong, H. (2019a). A Comparative Study of Composite Kernels for Landslide Susceptibility Mapping: A Case Study in Yongxin County, China. Catena 183, 1–12. doi:10.1016/j.catena.2019.104217
Wang, Y., Fang, Z., and Hong, H. (2019b). Comparison of Convolutional Neural Networks for Landslide Susceptibility Mapping in Yanshan County, China. Sci. Total Environ. 666 (MAY 20), 975–993. doi:10.1016/j.scitotenv.2019.02.263
Wang, Y., Fang, Z., Wang, M., Peng, L., and Hong, H. (2020a). Comparative Study of Landslide Susceptibility Mapping with Different Recurrent Neural Networks. Comput. Geosci. 138, 104445. doi:10.1016/j.cageo.2020.104445
Wang, Y., Shu, Z., and Li, Y. (2020b). Research of Slope Disaster Chain-Stage and Evolvement Rules. IOP Conf. Ser. Earth Environ. Sci. 455 (1), 012076. doi:10.1088/1755-1315/455/1/012076
Wu, J., Tang, T., Chen, M., Wang, Y., and Wang, K. (2020). A Study on Adaptation Lightweight Architecture Based Deep Learning Models for Bearing Fault Diagnosis under Varying Working Conditions. Expert Syst. Appl. 160, 113710. doi:10.1016/j.eswa.2020.113710
Xu, C., and Xu, X. (2012). Controlling Parameter Analyses and hazard Mapping for Earthquake-Triggered Landslides: an Example from a Square Region in Beichuan County, Sichuan Province, China. Arabian J. Geosci 6 (10), 3827–3839. doi:10.1007/s12517-012-0646-y
Xu, Q., Fan, X.-M., Huang, R.-Q., and Westen, C. V. (2009). Landslide Dams Triggered by the Wenchuan Earthquake, Sichuan Province, South West China. Bull. Eng. Geol. Environ. 68 (3), 373–386. doi:10.1007/s10064-009-0214-1
Xu, C., Shyu, J. B. H., and Xu, X. (2014). Landslides Triggered by the 12 January 2010 Port-Au-Prince, Haiti, Mw = 7.0 Earthquake: Visual Interpretation, Inventory Compiling, and Spatial Distribution Statistical Analysis. Nat. Hazards Earth Syst. Sci. 14 (7), 1789–1818. doi:10.5194/nhess-14-1789-2014
Youssef, A. M., Pourghasemi, H. R., Pourtaghi, Z. S., and Al-Katheeri, M. M. (2016). Landslide Susceptibility Mapping Using Random forest, Boosted Regression Tree, Classification and Regression Tree, and General Linear Models and Comparison of Their Performance at Wadi Tayyah Basin, Asir Region, Saudi Arabia. Landslides 13 (5), 839–856. doi:10.1007/s10346-015-0614-1
Yu, H., and Cheng, H. (2013). The Impact of Climate Change on Coastal Geological Disasters in southeastern China. Nat. Hazards 65 (1), 377–390.
Keywords: hazard assessment, earthquake disaster chains, geological disasters, deep neural networks (DNN) model, machine learning
Citation: Su Y, Rong G, Ma Y, Chi J, Liu X, Zhang J and Li T (2022) Hazard Assessment of Earthquake Disaster Chains Based on Deep Learning—A Case Study of Mao County, Sichuan Province. Front. Earth Sci. 9:683903. doi: 10.3389/feart.2021.683903
Received: 22 March 2021; Accepted: 27 December 2021;
Published: 17 May 2022.
Edited by:
Hong Haoyuan, University of Vienna, AustriaReviewed by:
Yingying Tian, Institute of Geology, ChinaKanwarpreet Singh, Chandigarh University, India
Muto Francesco, University of Calabria, Italy
Copyright © 2022 Su, Rong, Ma, Chi, Liu, Zhang and Li. This is an open-access article distributed under the terms of the Creative Commons Attribution License (CC BY). The use, distribution or reproduction in other forums is permitted, provided the original author(s) and the copyright owner(s) are credited and that the original publication in this journal is cited, in accordance with accepted academic practice. No use, distribution or reproduction is permitted which does not comply with these terms.
*Correspondence: Xingpeng Liu, TGl1eHA5MTJAbmVudS5lZHUuY24=; Jiquan Zhang, WmhhbmdqcTAyMkBuZW51LmVkdS5jbg==