 Alain Royer1,2*
 Ghislain Picard3Céline Vargel1,2,3Alexandre Langlois1,2
 Isabelle Gouttevin4
 Marie Dumont4
- 1Centre d’Applications et de Recherches en Télédétection (CARTEL), Université de Sherbrooke, Sherbrooke, QC, Canada
- 2Centre d’Études Nordiques, Québec, QC, Canada
- 3UGA, CNRS, Institut des Géosciences de l’Environnement (IGE), UMR 5001, Grenoble, France
- 4Univ. Grenoble Alpes, Université de Toulouse, Météo-France, CNRS, CNRM, Centre d’Études de la Neige, Grenoble, France
The impact of high latitude climate warming on Arctic snow cover and its insulating properties has key implications for the surface and soil energy balance. Few studies have investigated specific trends in Arctic snowpack properties because there is a lack of long-term in situ observations and current detailed snow models fail to represent the main traits of Arctic snowpacks. This results in high uncertainty in modeling snow feedbacks on ground thermal regime due to induced changes in snow insulation. To better simulate Arctic snow structure and snow thermal properties, we implemented new parameterizations of several snow physical processes—including the effect of Arctic low vegetation and wind on snowpack—in the Crocus detailed snowpack model. Significant improvements compared to standard Crocus snow simulations and ERA-Interim (ERAi) reanalysis snow outputs were observed for a large set of in-situ snow data over Siberia and North America. Arctic Crocus simulations produced improved Arctic snow density profiles over the initial Crocus version, leading to a soil surface temperature bias of −0.5 K with RMSE of 2.5 K. We performed Crocus simulations over the past 39 years (1979–2018) for circumpolar taiga (open forest) and pan-Arctic areas at a resolution of 0.5°, driven by ERAi meteorological data. Snowpack properties over that period feature significant increase in spring snow bulk density (mainly in May and June), a downward trend in snow cover duration and an upward trend in wet snow (mainly in spring and fall). The pan-Arctic maximum snow water equivalent shows a decrease of −0.33 cm dec−1. With the ERAi air temperature trend of +0.84 K dec−1 featuring Arctic winter warming, these snow property changes have led to an upward trend in soil surface temperature (Tss) at a rate of +0.41 K dec−1 in winter. We show that the implemented snowpack property changes increased the Tss trend by 36% compared to the standard simulation. Winter induced changes in Tss led to a significant increase of 16% (+4 cm dec−1) in the estimated active layer thickness (ALT) over the past 39 years. An increase in ALT could have a significant impact on permafrost evolution, Arctic erosion and hydrology.
Introduction
Snow plays a crucial role in the climate system. Snow cover on the ground can increase average surface albedo from 30 to 50% (Cohen and Rind, 1991) and, by its insulation effects, exerts a strong influence on soil temperatures (Meredith et al., 2019). Snowpack thus affects the total energy balance at the Earth’s surface (Stocker et al., 2013), and its seasonality has a strong impact on the climate system. The evolution of the climate system observed in recent decades (Portner et al., 2019; Mudryk et al., 2018; Mudryk et al., 2020a; Mudryk et al., 2020b) implied a decrease in the extent of the snow cover; Mudryk et al. (2018) showed that this decrease can be directly related to the increase in surface temperatures, and future climate change will very likely generate the same trend (Callaghan et al., 2011; Brutel-Vuilmet et al., 2013; Portner et al., 2019). These trends are more pronounced in high northern latitudes where warming is stronger (Screen and Simmonds, 2010; Overland et al., 2019) owing to a variety of strong positive feedbacks (Serreze and Barry, 2011). Pulliainen et al. (2020) showed that over the last 40 years, while snow mass has decreased by 4% per decade across North America, the trend has remained negligible across Eurasia. Both continents exhibit high regional variability, mainly driven by variable regional warming and precipitation rates. The positive feedback effects of increased snow fall can counter the negative feedback effect of warming. Climate models typically show little change or decrease annual maximum snow water equivalent (SWE) over higher latitudes in response to warming as the influence of a shorter snow cover season is offset by increases in winter snowfall (Räisänen, 2008; Brown and Mote, 2009). However, few studies have analyzed the spatial and temporal evolution of snowpack properties occurring in response to the observed trends in SWE and snow cover duration. Particularly over higher latitudes, snowpack thermal properties exert a major influence on the ground thermal regime (Royer et al., 2021).
It appears that most current snow evolution models fail to represent some main traits of Arctic snowpacks, including highly sophisticated multilayered snow models such as the French Crocus or the Swiss SNOWPACK models. In these models, several important uncertainties arise in their representation of wind-induced densification, the effect of low vegetation (dwarf shrubs, sedges) on snow compaction and metamorphism, snowpack thermal conductivity and water vapor flux transfer within the snowpack. These five critical processes in Arctic snowpacks are closely interrelated and directly linked to climatic and soil conditions.
Barrere et al. (2017) found significant errors in the simulations of vertical density profiles using the Crocus snow model. The simulated snow density at the bottom layer of the snowpack appears too high because it is generated by snow settling. Also, the density at the top layer is too low relative to observations, since the Crocus model underestimates the effect of wind forming high-density surface layers, known as wind slabs.
The density, microstructure (grain size) and thermal conductivity of the vertical structure of Arctic snow cover do not appear to be well parametrized, given that neither water vapor fluxes from the ground, nor snow-low vegetation interactions are represented. Both of these effects lead to low density at the bottom (Sturm and Benson, 1997; Derksen et al., 2014; Domine et al., 2018; Domine et al., 2019). Heat and moisture exchanges between the atmosphere and the ground through the snow are mainly governed by the snowpack’s temperature gradient. This alters the conditions of snow metamorphism, which may lead to the formation of large snow crystals known as depth hoar, mostly at the base of the snowpack (Colbeck et al., 1993; Sturm and Benson, 1997; Domine et al., 2016b). These depth hoar layers form under large temperature gradients that drive large upward water vapor fluxes. These layers are responsible for most of the thermal insulation properties of snowpacks in the Arctic (Zhang et al., 1996). The temperature gradient, especially at the beginning of the snow season, is affected by soil moisture, as greater moisture maintains the soil at 0 °C longer, allowing large temperature gradients to persist and favoring depth hoar formations (Domine et al., 2018). The water vapor transport was not addressed since thermally-induced vertical diffusion and convection of water vapor is numerically and mathematically challenging and was not physically modeled (see Jafari et al., 2020; Fourteau et al., 2021).
Vegetation characteristics also affect snow properties. Dwarf shrubs or sedges enhance snow depth through trapping effects, which modify the thermal gradient (e.g., Sturm et al., 2001; Marsh et al., 2010; Paradis et al., 2016; Busseau et al., 2017). Basal intertwined twigs within the snowpack can preserve voids within the aerated layer. Protected from wind erosion and compaction, these lead to increased temperature gradients. Heat exchanges conducted through twigs could also enhance snow metamorphism (Sturm and Holmgren, 1994). All these conditions promote the development of depth hoar within the basal layers of the snowpack (Sturm et al., 2001; Domine et al., 2016a; Gouttevin et al., 2018; Royer et al., 2021).
Lastly, the insulating power of the snowpack on the underlying ground is linked to the effective thermal snow conductivity profile (keff_z) and to snow depth. This parameter is difficult to measure (i.e., Calonne et al., 2011; Riche and Schneebeli, 2013; Calonne et al., 2014). It can be estimated by statistical models, mainly as function of density (e.g., Yen, 1981; Sturm et al., 1997; Domine et al., 2011), and that may include an anisotropy parameter (Löwe et al., 2013). However, these models are not always able to account for changes in metamorphism and snow microstructure and are another source of uncertainties (Calonne et al., 2014).
The challenge here is thus to know if, in general, the combined effects of wind slabs and changes in snow microstructure due to low vegetation will lead to increased or decreased snow cover insulation and therefore to ground warming or cooling. We hypothesize that a modification that simplifies a detailed multilayered snow model will change bulk snow thermal conductivity estimates, resulting in an improved evolution of the soil temperature (Sturm et al., 1997; Zhang, 2005; Domine et al., 2016b; Domine et al., 2019; Barrere et al., 2017; Gouttevin et al., 2018).
The objective of this paper is to propose simplified adaptations to a multilayered snow evolution model and to quantify the thermal impact of snow cover variability on ground temperature, induced by 39 years of climate changes. In this study, we modified the proven and reliable SURFEX-Crocus snowpack evolution model developed for the Alpine snowpack (Vionnet et al., 2012). The model modifications were focused on snow physical processes related to wind, as proposed by Barrere et al. (2017), and to vegetation effects on snowpack, as proposed by Gouttevin et al. (2018). We then assessed how a more realistic snow vertical stratigraphy affects soil temperature simulations in Arctic. Using this improved snow model, we investigated how climate evolution with a significant warming observed over the past 39 years, impacts Arctic snow cover. We then analyzed the induced changes in soil temperature and active layer thickness trends.
Data and Methods
Data
The locations of the in-situ data used to evaluate our simulations with the improved parametrization of the SURFEX-Crocus snow model are shown in Figure 1. They combine snow cover observations (datasets from Brown et al., 2019Bulygina et al., 2011 and references sites described in Table 1) and soil temperature observations (datasets from multiple sources described in Table 2). We distinguish the Arctic region, defined as the area above the treeline, from the subarctic taiga region, defined here as the open forest area (maximum 40% forest cover). Both Arctic and open forest areas combined constitute the pan-Arctic area. For the evaluation, we filtered the observations by excluding the sites with an elevation difference of more than 100 m between the elevation model used in Crocus simulations (Global DEM, 1996) and the elevation of the measurement site. For snow cover observations, this resulted in a total of 119 sites in Canada, with 10 sites above the treeline, and 80 sites in Siberia, with 27 above the treeline. For soil temperature observations, we ended up with 10 sites in North America, including six above the treeline, and 23 sites in Siberia, including three above the treeline (Figure 1).
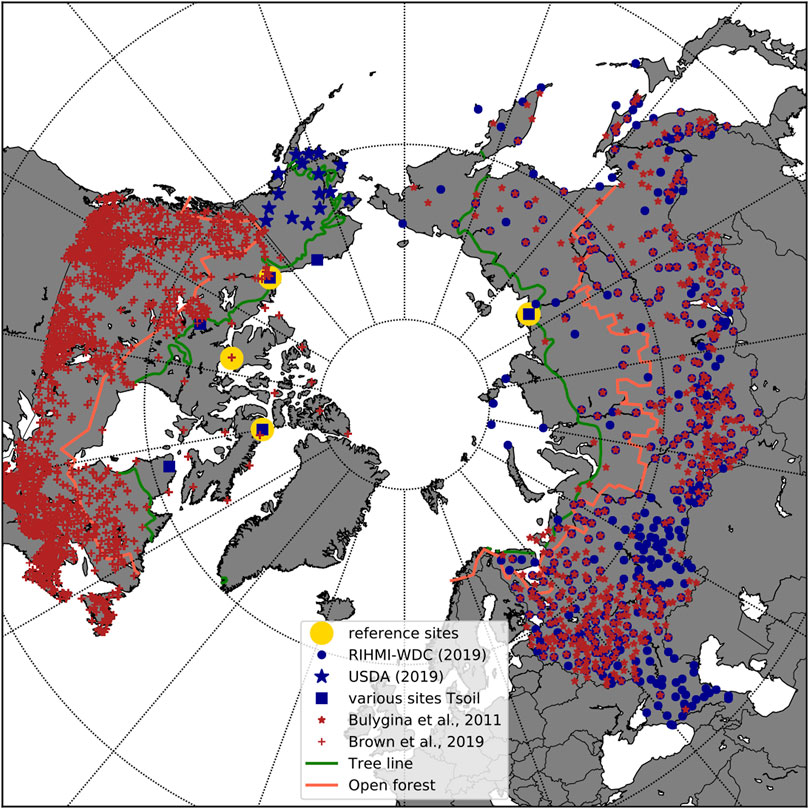
FIGURE 1. In-situ data map of soil temperature observations from different sources (blue), snowpack observations (red) and reference sites used to evaluate the simulations (yellow). The reference sites (yellow points) are described in Tables 1, 2, and networks of blue points in Table 2.
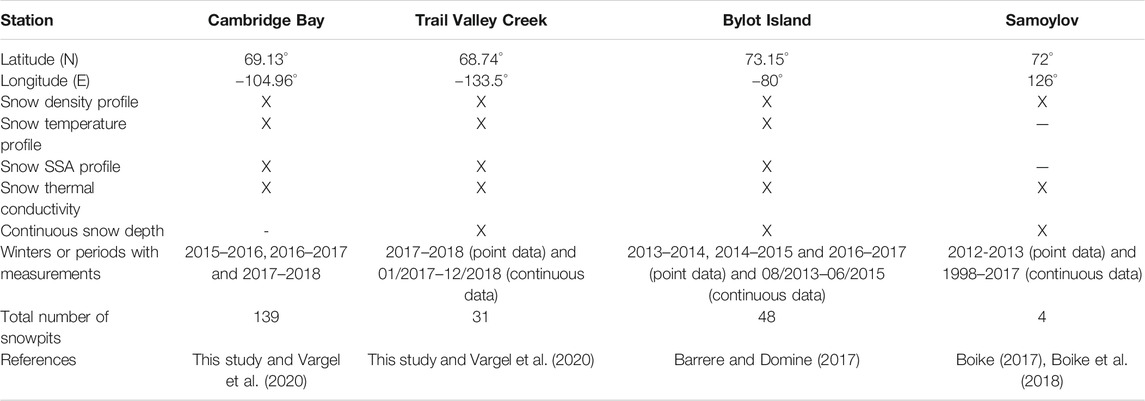
TABLE 1. Description and data availability at the four reference sites.
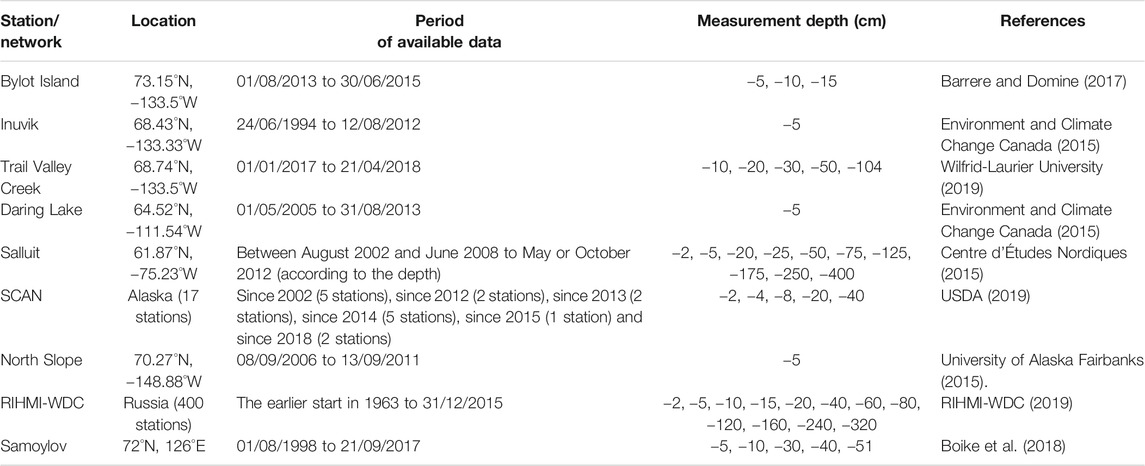
TABLE 2. Global soil temperature datasets description.
Reference Sites for Snow Observations
To evaluate the model, we used a set of detailed observations from four different reference stations with detailed snow measurements (Table 1). Three stations are located in northern Canada (Trail Valley Creek, Cambridge Bay and Bylot Island) and one in northern Siberia (Samoylov). At all these stations, detailed and spatially dispersed snow profiles are available during the winter, with measurements of snow properties (density, temperature, specific surface area (SSA) and thermal conductivity; Table 1). We also used continuous measurements of snow depth at Bylot Island and Samoylov.
Global Observations
Continuous multi-year in-situ observations of snow cover and soil temperature from different sources are also used in this study (Figure 1; Table 2). The first source of snow cover observations is from Environment and Climate Change Canada (Brown et al., 2019). This dataset includes snow depth, SWE and snow bulk density observations from 1951 to 2016. Observations are provided biweekly. The second source of data is the Russian Research Institute for Hydrometeorological Information – World Data Center (RIHMI-WDC, http://meteo.ru/). It is composed of 517 measurement stations over Russia (Bulygina et al., 2011; Brun et al., 2013). This dataset provides snow depth, snow water equivalent and snow density measurements since 1966, recorded every 10 days in winter and every 5 days during intense snow melt periods.
The soil temperature observations are from multiple sources (Table 2). In Canada, we used data from five different research stations (Bylot Island, Inuvik, Trail Valley Creek, Daring Lake, and Salluit). In Alaska, we used data from the SCAN network (17 stations) and North Slope station. In Siberia, we used data from the RIHMI-WDC for 400 stations, in addition to detailed Samoylov data.
SURFEX/ISBA-Crocus Configuration
We used the Météo-France SURFEX/ISBA-Crocus V8.1 multi-layered snowpack model (Vionnet et al., 2012), which uses the optical diameter (physically linked to SSA) of snow grain as a prognostic variable (Carmagnola et al., 2014). The evolution of the snowpack depends on energy and mass transfer between the atmosphere and the snow cover and between the snow cover and the ground below. The interaction between the Soil Biosphere and Atmosphere model (ISBA) within the SURface EXternalisée modeling platform (SURFEX-ISBA) allows Crocus to interact with a detailed layered ground. In our simulations, ground from 0 to 12 m deep was divided into 14 constant layers. We chose to use ERA-Interim (ERAi) meteorological reanalysis data (Berrisford et al., 2011; Dee et al., 2011) from the European Center for Medium-Range Weather Forecast (ECMWF) as meteorological forcing for our simulations over the period they were available, 1979–2018.
Experimental Design and Evaluation Methodology
To better reproduce the observed Arctic snowpack characteristics, we implemented new simplified parameterizations of several physical and phenomenological processes, described in detail below and summarized in Table 3. We then describe the methodology for evaluating the modified Crocus AC compared to the standard Crocus version (Crocus Std) and for analyzing the impacts of these changes on the sub-snow soil temperature.
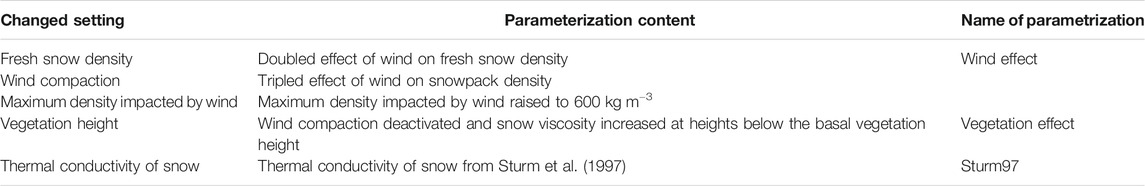
TABLE 3. Summary of modified parametrizations in the “Arctic Crocus” (AC) simulations.
Experimental Design
The implemented parameterizations for simulations of improved Arctic snow density stratification were suggested by Barrere et al. (2017) and Gouttevin et al. (2018). Five physical processes, which are well described in these references, were changed. These include modifications in fresh snow density parametrization; changes to wind-induced compaction; a new limit of the density impacted by the wind; settings of simplified snow-vegetation interaction and a modified density-based parametrization for snow thermal conductivity.
• Fresh snow density: Crocus adds fresh snow to the snowpack during snowfalls. The physical properties of this new snow depend on near-surface meteorological conditions, following Eq. 1 (Vionnet et al., 2012).
The fresh snow density (
Assuming the wind effect is underestimated in Crocus simulations for the Arctic region, we tested different factors to increase
• Wind compaction: Snowpack density (
where
As with fresh snow density, we observed that wind compaction effect on snow density is underestimated in the standard version of Crocus, and we tested different values for
• Maximum density impacted by wind: Equation 2 uses the parameter
• Vegetation height: Arctic snowpacks usually exhibit a specific strong density stratification. Due to the strong wind conditions that are common in Arctic regions, hard wind slabs form on the top of the snowpack. At the bottom of the snowpack however, the presence of shrubs or other basal vegetation may act as a trap that prevents wind erosion and wind compaction from increasing the density of snow (Domine et al., 2016a). Furthermore, depth hoar snow type, with a low density, develops at the bottom when there is a high temperature gradient between the cold atmosphere and the warmer soil, which typically occurs in Arctic and open forest conditions over most of the winter (Akitaya, 1967; Akitaya, 1975; Marbouty, 1980). An important water vapor flux is induced which leads to the formation of large, cup shape crystals (Sturm and Benson 1997). It also leads to an upwards migration of water vapor within the snowpack, contributing to lower snow densities close to the snow-ground interface. In Crocus AC, we relied solely on the vegetation trapping effect, which has the same effect on density profiles (but not grain size), to simulate realistic snow density profiles, following Gouttevin et al. (2018). To account for this effect, the proposed approach is to deactivate wind compaction and increase snow viscosity under the vegetation. We therefore needed to prescribe a mean basal vegetation height as an input for Crocus simulations, that was considered constant. We used the Ecoclimap database (Masson et al., 2003) to compute such a variable, picking only the Arctic vegetation types. Figure 2 shows the resulting vegetation height over our study area, used to compute snow processes. A first order comparison with some pictures taken in summer at the four reference sites (Trail Valley Creek (Grünberg and Boike, 2019), Cambridge Bay, Bylot Island and Saymolov) and an ancillary bioclimatic Arctic vegetation map (Raynolds et al., 2019) showed satisfactory concordance between the calculated values and actual vegetation height observations.
• Thermal conductivity of snow: In the Std parametrization of Crocus, the thermal conductivity of snow is computed as a function of density according to Yen (1981). Calonne et al. (2011) showed that the Sturm et al. (1997) formulation exhibits better results for Arctic snow. We hence implemented in AC the Sturm et al. (1997) snow thermal conductivity formulation (Eq 4):
where
The simulations with the modified model are here after named Arctic Crocus (AC) simulations and compared to standard Crocus (Std) simulations.
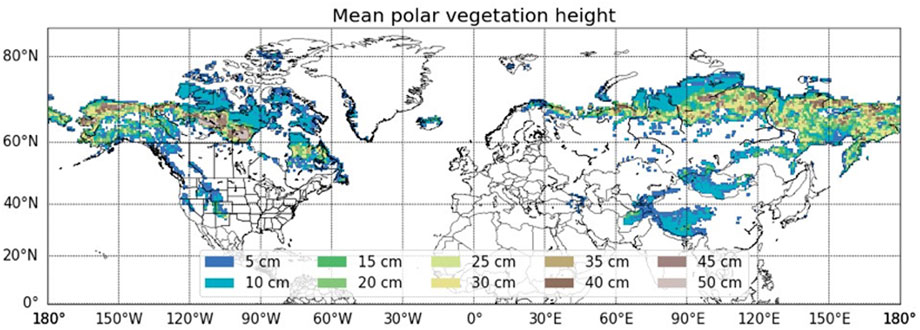
FIGURE 2. Vegetation height prescribed as input for Crocus simulations.
Evaluation Methodology
From four different reference Arctic sites (Table 1), we first evaluated and optimized our proposed model adaptations in the modified Crocus model (Crocus AC) against a set of in-situ detailed stratigraphy observations of snow microstructure, defined by density and grain specific surface area (SSA) profiles. As the scarcity of detailed snow stratigraphies limits spatial and temporal validation, the optimized adaptations were then analyzed with bulk parameters, such as bulk density and snow depth, over a significantly larger set of snow survey data. Even if improved bulk density does not necessarily mean a better density profile and the implied changes in soil temperature, the aim of this experiment was also to compare soil temperature simulations from Crocus AC and Std models with in-situ measurements.
In a third part, we looked at the temporal evolution of snow and soil properties through yearly and monthly trend calculations for the 39 years of simulation and averaged over both considered areas: taiga (open forest zone) and Arctic zone (above tree line) (see Figure 1). However, because the implemented modifications in snow physical processes were optimized for Arctic snow, we restrict the results analysis to the Arctic zone. For density evolution analysis, we used both bulk values for the whole snowpack, and for the snowpack split into two layers. The bottom layer value was defined as the bulk density value for the snow between the ground and 50% of the snow height, and the top layer value was defined as the bulk density value for the snow above 50% of the snow height.
In order to assess the impact of changes in Arctic snow properties on soil temperature, we compared the results from the two versions, using unmodified Crocus (Crocus Std) as reference runs and Crocus AC with the modified Arctic snow properties. No other factors were changed. The changes in snow water equivalent (SWE), soil temperature and active layer thickness trends were assessed.
In the discussion, we performed a specific analysis to better quantify the direct effect of snowpack changes on ground temperature (at the surface below the snow and at −1.25 m depth). We compared Crocus AC runs with control AC simulations forced with prescribed constant snowpack over the 39 years at the Samoylov site in Siberia. This experiment highlights the cumulative effect of snow variability on ground temperature over the analysis period (AC runs) in relation to the impact of constant snowpack (control AC runs).
Lastly in the discussion section, we compared snow and soil temperature trends from Crocus AC simulations with ERA-Interim outputs and with literature analysis (SWE trends).
Results
Model Improvement Analysis
Snow Evaluation Using In-Situ Data
The greatest improvements are observed for Arctic snow layer density and snow depth using the modified Arctic Crocus snow parametrization. Figure 3A illustrates the wind and vegetation effect on snow density stratigraphy. The modifications related to wind allow the top of the snowpack to reach higher density values that are closer to the observations (above 350 kg m–3). Increasing the maximum density reached by drifting snow helps to reduce the underestimation in upper layers simulated by Crocus Std. and adaptations related to vegetation allows the bottom density of the snowpack to reach lower density values (between 200 and 300 kg m−3). This mimics the behavior of low depth hoar layer density observed in Arctic areas (Sturm and Benson, 1997; Domine et al., 2018), as discussed in detail by Gouttevin et al. (2018). Note that shallow layers (10–15 cm) of low-density (150 kg m−3) on top snowpack were simulated, that could result from time distribution of reanalysis precipitation adjusted to match with Crocus simulation time step. Such an “Arctic drizzle” effect in the reanalysis could lead to continuous small precipitation amounts that keeps a low-density fresh snow at the surface layer.
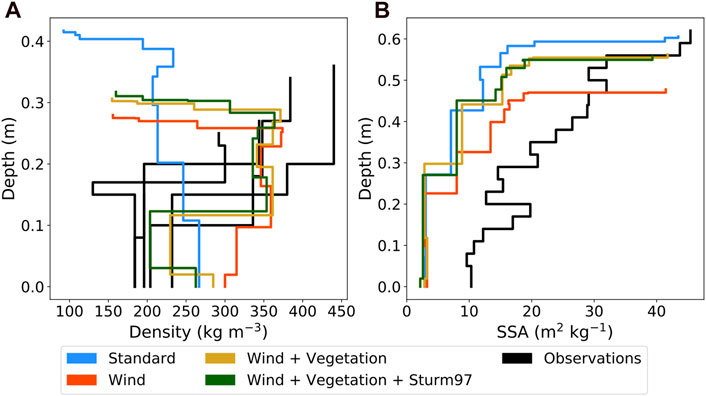
FIGURE 3. Vertical profiles of snow density at Cambridge Bay, on May 10, 2017 (A), and of SSA at Trail Valley Creek, on March 22, 2018 (B). Observed (black) and simulated with standard parametrizations of Crocus (blue), Wind parametrization (orange), Wind and Vegetation parametrizations (yellow) and Wind, Vegetation and Sturm97 parametrizations (green) (see Table 3 for parametrization definition, and Table 1 for data and site references).
For mean snow density compared at the four reference sites, the RMSE of AC simulations are better (−6%) than those of Std simulations but have a higher mean bias (Table 4). This observed high bias stems from significant error compensation with a positive bias at two sites (TVC and Bylot Island) and a negative bias for the two other sites (CB and Samoylov). The vertical profiles of grain size, which decreases from the large grain size at the bottom (SSA < 10 m2 kg−1) to smaller grain size in the top layers (SSA > 20–25 m2 kg−1) (Figure 3B), are also generally slightly improved with AC simulations. This is probably due to changes in wind effect over fresh snow and snow conductivity parametrization, which affect snow grain size. Snow grain size results agree with observations from Derksen et al. (2014), Barrere (2018), Vargel et al. (2020) and Royer et al. (2021).
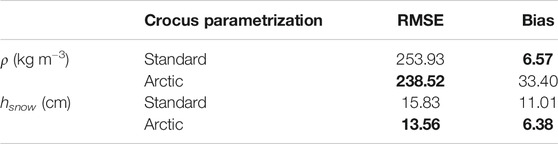
TABLE 4. Root mean square error (RMSE) and mean bias for the four detailed validation sites above the tree line, for bulk snow density (ρ) and snow depth (hsnow). Best results are highlighted in bold.
Table 4 compares AC to Std simulations at the four reference sites (see Table 1) for snow density and snow depth variables. For the bulk density analysis, even if the absolute differences between simulations appears relatively low, the main finding is that the simulated Arctic snow density stratigraphy, higher density at the surface and lower density in the basal layers, fit better with the typical observed Arctic snowpack.
The model analysis in this section, based on a limited but detailed set of test sites over a short time period (Table 1), aims primarily to assess improvements in snowpack properties. The model evaluation for the whole period is presented in the next section and based on a much larger number of points spread over the entire study area.
Evaluation With Global and Long-Term Observations
To analyze the Crocus simulations, we also used different long-term continuous observations of snow cover properties (depth and density) and soil surface temperature (described in Global Observations and Table 2) for both Arctic and open forest areas. The AC parametrization allows better results than the Std parametrization above the treeline (Arctic area) for the three considered variables (Table 5). The mean density bias in the Arctic is 8.0 kg m−3, which represents 3% of the mean observation (268.5 kg m−3). The total density RMSE is 67.3 kg m−3, which represents 25% of the mean observation. The mean snow depth bias in the Arctic is 3.2 cm, which represents 17% of the mean observation (19.1 cm). The relative improvements in Arctic snow depth are significant (−52% for bias and −23% for RMSE). In open forest regions (subarctic area), Std simulations are better for snow density and snow depth (Table 5). The snow depth RMSE of 16.2 cm represents 84% of the mean observations. In the following (Evolution of Snow Properties and Soil Temperature Over the Past 39 years, Active Layer Thickness Trend and Discussion), the analysis will remain focused on the Arctic area, although the maps show the entire area.
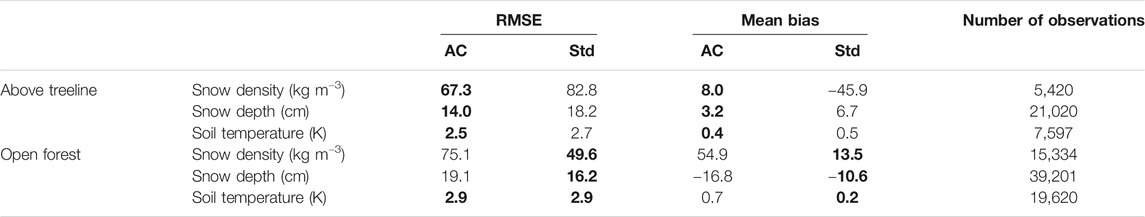
TABLE 5. RMSE and mean bias obtained with the simulations using the Arctic parametrization (AC) of Crocus compared to the standard parametrization (Std) for the above treeline area (Arctic) and open forest area (taiga). Best results are highlighted in bold.
For the simulated soil temperatures, both parametrizations show the same error, but one should note that there are fewer validation points in the Arctic for soil temperature measurements than for other variables. Overall, the AC simulations provide significantly improved results for Arctic snow cover properties when compared to Std simulations.
The spatial distribution of AC simulation deviations from in-situ measurements is shown in Figure 4 for snow bulk density and in Figure 5 for snow depth. The most significant errors in snow density bias (Figure 4A) and RMSE (Figure 4B) are all in the open forest region, primarily in Quebec, but with a few points in central Siberia and in Canada's Northwest Territories.
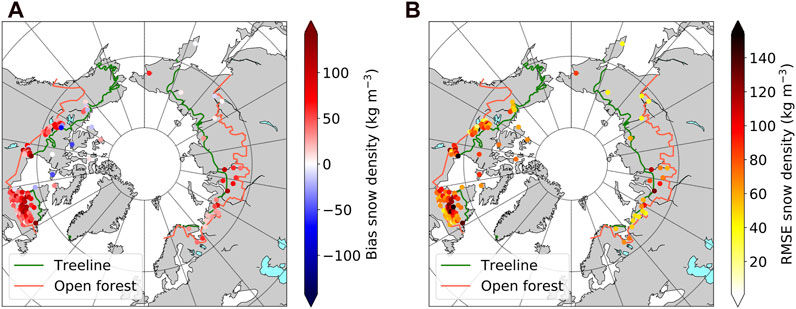
FIGURE 4. Snow bulk density mean bias (simulations - observations) (A) and root mean square error (B) for the 39 years of simulation.
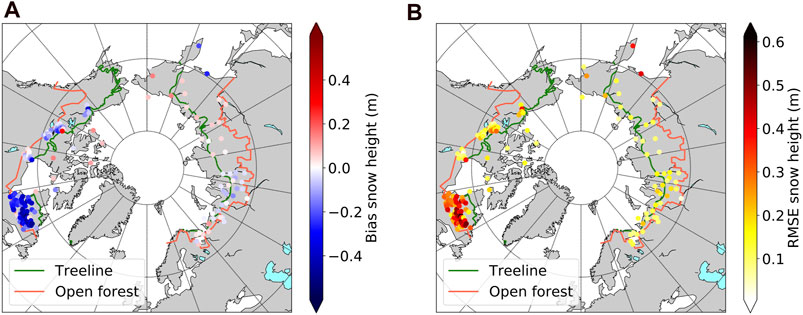
FIGURE 5. Same as Figure 4 but for snow depth.
The spatial distribution of snow depth bias (Figure 5A) and RMSE (Figure 5B) also shows higher deviation in the open forest area than in the Arctic, with an underestimation (negative bias) over Quebec, in eastern Canada. In contrast, we observed a slight positive bias in Siberia. Snow depth RMSE over Quebec is also higher than over Siberia. However, the high spatial variability of snow depth (Derksen et al., 2014; Brown et al., 2019) makes it very difficult to evaluate the model with representative statistics when comparing reanalysis-forced simulations to point observations.
The distribution of soil surface temperature bias shows contrasting behavior in Siberia, with a slight positive bias in its western region (0.2 K), while its eastern region shows more important overestimations in the simulations of up to 2.1 K. In North America, the errors are low. Overall, the mean Arctic soil surface temperature errors remains below 2.5 K using the AC simulations (Table 5).
In conclusion, as expected, this comparison of the simulations against in-situ measurements appears to show that the Arctic zone is where the results of the Arctic Crocus simulations are the best compared to the Std simulations (Table 5). In the following, we have therefore limited the analysis of snow and ground temperature evolution to the Arctic zone (above the treeline).
Evolution of Snow Properties and Soil Temperature Over the Past 39 years
Snow Cover Property Trends
For the period 1979 to 2018 over the Arctic zone, Figure 6 synthesizes the monthly evolution of the studied mean snow variables: snow depth (SD) (Figure 6A), snow cover duration (SCD) (Figure 6B), bottom layer density (Figure 6C), top layer density (Figure 6D), bulk density (Figure 6E) and percentage of days with liquid water content in snowpack (Figure 6F). Figure 7 illustrates the spatial distribution of the trends for selected variables and months. The Arctic snow depth trends are significant for the month of June (−0.11 cm year−1) (Figure 6A), and very likely linked to snow melt during the warmest months. The observed significant decrease in SCD (Figure 6B) reflects an earlier spring melt (May and June) and a later accumulation in autumn (September and October) due to higher air temperatures (strong correlation coefficients between air temperature and SCD with R2 up to −0.7, depending on the month). These results are in agreement with previous studies (see Brown et al., 2019; Portner et al., 2019; Mudryk et al., 2015; Mudryk et al., 2020a; Mudryk et al., 2020b).
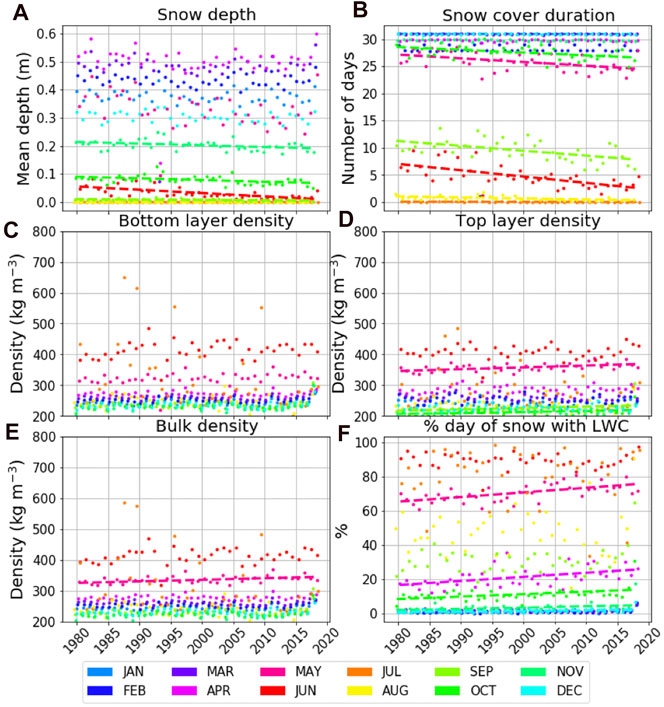
FIGURE 6. Arctic-mean evolution of snow depth (A), snow cover duration (B), bottom layer density (C), top layer density (D), bulk density (E), percentage of days with liquid water in snowpack (F), for each month (colors) between August 1979 and July 2018. Linear regressions are plotted only for p-values lower than 0.05.
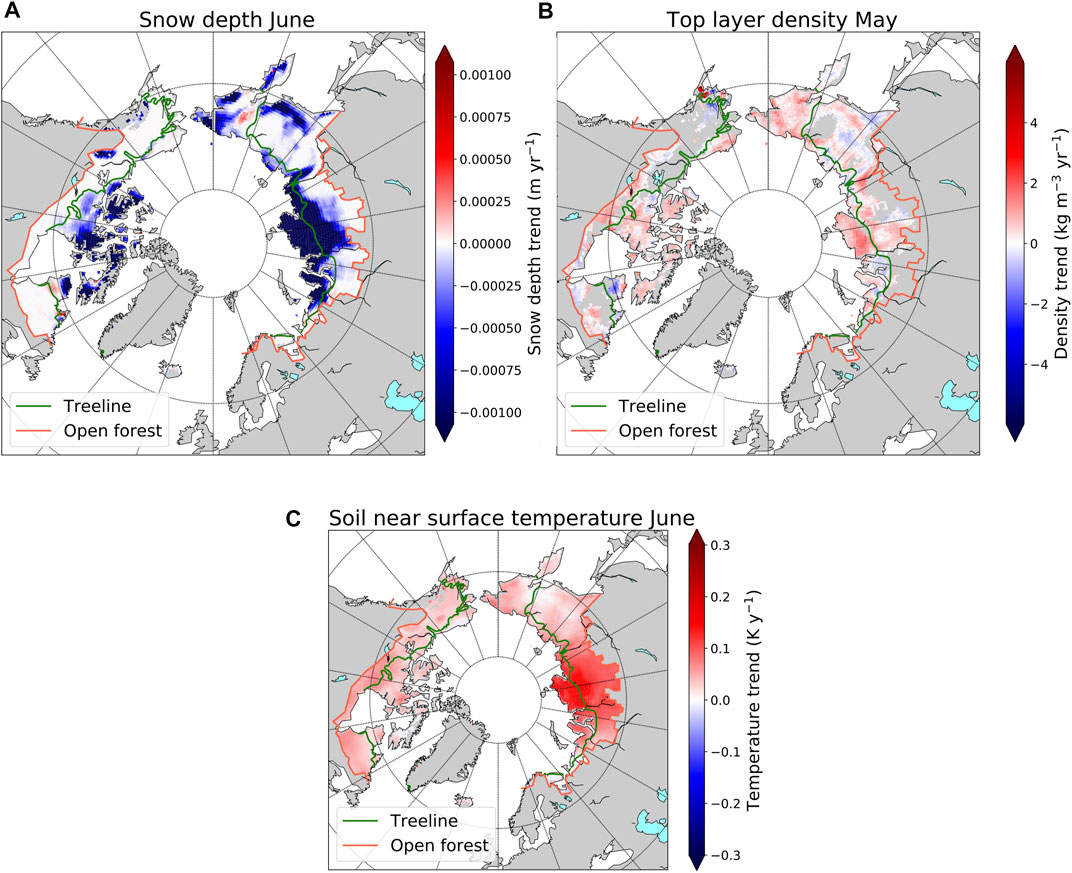
FIGURE 7. Spatial distribution of trends between 1979 and 2018 of snow depth in June (A), top layer density in May (B), and soil near surface temperature in June (C).
We analyzed the snow melt trends by the number of days (%) with non-zero liquid water content values in the snowpack (Figure 6F). Results show a significant increase in the number of days with wet snowpack in the months of April, May and September. In spring, this increase can likely be explained by increased air temperature (correlations in May between LWC and Ta around 0.3), whereas for September, Ta and rainfall both explain this increase (correlations of 0.42 and 0.39, respectively).
More innovative is the trend analysis of the mean snowpack density (bulk) (Figure 6E). This included the top and bottom layers, which were computed by splitting the snowpack into two halves. Simulating a multi-layered snowpack allows us to separate the evolution of wind slab snow in the top layer from the bottom layer snow, which is mainly composed of depth hoar. Density trends show a significant statistical increase over the 95th percentile in spring (May) for top layer density (0.58 kg m−3 year−1) (Figure 6D) and bulk density (0.51 kg m−3 year−1) (Figure 6E) and fall periods for top layer density (September and October, respectively with rates of +0.45 kg m−3 year−1 and +0.34 kg m−3 year−1) (Figure 6D). Changes in top layer density, appearing mainly during melting and rainfall events, are not significant during cold months of the year. Such changes could have been inferred from changes in windspeed, modifying wind crusts occurrence or hardness. However, ERAi surface wind does not exhibit any significant change over the winters from 1979 to 2018 (Torralba et al., 2017), explaining the absence of significant changes in top-layer snow winter snow densities.
We also looked at the trend in winter maximum snow water equivalent (SWEmax) reached in the Arctic each year over the 1979–2018 period. Based on the standard Crocus simulations, there is no statistically significant trend, while for AC simulations, SWEmax follows a significant decreasing trend of −0.33 cm dec−1 (p-value of 0.05). This global negative trend agrees with available evidence suggesting that SWEmax has decreased over pan-Arctic land areas over the past ∼20 years, despite the large uncertainty and variability in trend magnitude observed across regions (Park et al., 2013; Brown et al., 2017). This trend is discussed in the last section (SWE Trends Analysis) in the frame work on SWEmax trend analysis performed with other datasets using different models, reanalysis or observations.
In summary, the main finding here is that the Arctic snowpack change is strongly impacted by the spring, early summer and fall warming seen in ERAi data (see Figure 8), leading to a more pronounced melting period and consequently a significant increase in density, of the order of 5 kg m−3 per decade in spring. Such increases were reported by Brown et al. (2019) based on in-situ measurements over Canada, but the amplitude was slightly higher, at +6.6 kg m−3 per decade. Increasing density has important consequences for the insulating potential of the snowpack, specifically the combined effect of reduced snow cover duration and of higher thermal conductivity of wet snow, and thus on the ground temperature regime, as discussed in the next section.
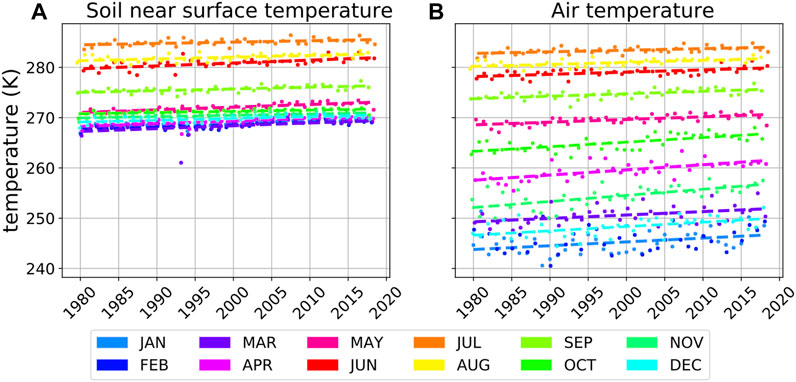
FIGURE 8. Arctic mean soil near surface temperature (A) and air temperature from ERA-Interim (B) evolution between 1979 and 2018 for each month of year (colors). Regression is plotted only for p-values lower than 0.05.
Spatial distributions of trends of all these parameters between 1979 and 2018 were analyzed, highlighting spatial variability. This is illustrated in Figure 7 for three cases: spatial distribution of snow depth trends in June (Figure 7A), top layer density trends in May (Figure 7B) and soil surface temperature in June (Figure 7C, discussed in next section). A large spatial variability in trend strength can be heighted. Snow depth evolution in June shows global decreasing trend with a repetition more marked decreasing trend over Eurasia above the treeline (Arctic region). The top layer density exhibits a stronger increase pattern in Eurasia compared to North America, in agreement with Park et al. (2013). It is likely that the increasing trend of snow melt and liquid precipitation in May (Figure 6F) drives the top layer density trend (Figure 7B) of the Arctic snowpack.
Soil Temperature Trends
The near-surface soil temperature (Tss, in the model at −0.5 cm depth), derived from the AC simulation was analyzed with monthly trend in Figure 8 and spatial variability trend in June in Figure 7C. Figure 8A shows that the Tss trends significantly increase for each month over the Arctic area between 1979 and 2018. Tss increases according to air temperature warming (ERAi Ta) used as input for the simulations (Figure 8B). The highest Ta increase rates appear in November (1.21 K dec−1) and in April (1.02 K dec−1). However, Tss trends differ from Ta trends according to the season. Table 6 summarizes the trends derived from standard and Arctic Crocus simulations and compared to ERAi Ta outputs for the fall (September, October), the winter (November to March), the spring (April, May), the summer (June to August) and the annual period. Clearly, the winter AC Tss trend (+0.41 K dec−1) is significantly higher than the Std trend (+0.32 K dec−1) (Table 6). For each month from November to March, the relative change in Tss trend (AC-Std) is more pronounced during winter months (except for February, not explained). The relative differences are respectively of 53% (N), 59% (D), 59% (J), −6% (F), and 27% (M), with an overall winter relative difference of 38%. For the AC simulations, the strongest Tss increase rates are observed in March (+0.57 K dec−1). Increases in insulation properties of snow could explain the simulated winter increase of ground-surface temperature under the snow. During the transition periods, two opposite snow effects occur depending on the snow amount and snow cover duration (SCD).
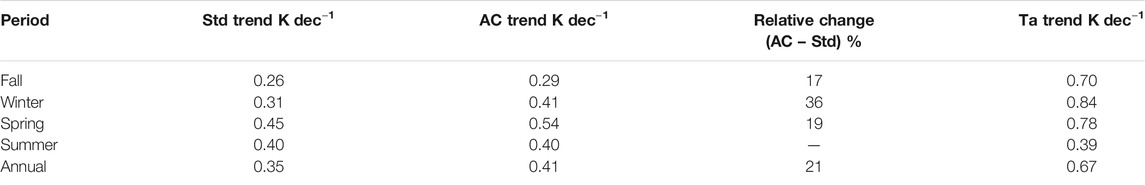
TABLE 6. Trends of near-surface soil temperature (Tss), derived from the standard (Std) and Arctic (AC) simulations and of near-surface air temperature (Ta) from ERA-Interim outputs between 1979 and 2018 over the Arctic area. Winter is defined as November to March, spring as April and May, fall as September and October and summer as June to August.
These modifications impact the ground temperature differently depending on the period. In the fall, a shorter SCD can cool the ground and offset an increased insulation effect. In the spring, a shorter SCD generally warms the ground (Park et al., 2015; Domine et al., 2019). Results show that both in fall and spring, Tss increase trends are stronger for AC simulation than that for Std, except for September (same trend of +0.34 K dec−1) (Table 6). AC Tss trends are of +0.24, +0.54, +0.53 K dec−1 respectively for October, April and May, compared to +0.18, +0.43 and +0.47 for Std simulations. The analysis of the direct impact of snow on ground temperature is further assessed in the discussion. For the summer period (JJA), Tss trends for both Crocus versions and also for Ta trends are similar (0.4 K dec−1) (Table 6). The global increase Tss trend shows significant spatial variability (Figure 7C for the month of June) with a stronger increase in Siberia, particularly in the northernmost Taimyr Peninsula in Central Siberia.
Active Layer Thickness Trend
High latitude warming leads to permafrost degradation by deepening the seasonally thawed soil surface layer above permafrost, defined as the “active layer”. Thawing of permafrost can lead to substantial changes in hydrologic, biogeophysical and ecosystem processes (Portner et al., 2019). The thawed active layer thickness (ALT) reached over a year is the result of summer soil temperature changes and winter snow cover property changes (Zhang, 2005). Moreover, expansion of tundra shrub cover (Myers-Smith et al., 2015; Paradis et al., 2016) linked to the summer air temperature increase alters the snow density and wetness with impacts on snow thermal conductivity (Domine et al., 2016a). Over time, the consequences of cumulative heat transfer in the soil from these effects could accelerate the soil warming and active layer thickening processes. The proposed new Arctic Crocus model allows us to better take into account snow and vegetation effects on soil temperature.
ISBA outputs provide a relatively detailed layered description of the soil (Masson et al., 2003; Le Moigne et al., 2009), enabling the estimation of the annual thawing ground layer thickness on top of frozen soil (permafrost). The continuous simulations over 39 years also allow us to analyze its dynamics over time. Here, ALT was computed as the maximum depth reached by the 0° isotherm at the accuracy of the model layers’ nodes during the year starting in August and ending the following July. Despite the inherent uncertainty induced by the different thicknesses of the numerical soil layers in the Crocus model, the relative time evolution of this parameter can be used as a relevant index to analyze the cumulative effect of Arctic warming as well as snow cover change on ground thermal state including vegetation effects.
The estimated mean Active Layer Thickness (ALT) values over the whole Arctic area significantly increase from 94 to 109 cm (+16% over 39 years), with a mean trend of +4 cm per decade (p-value of 2.04 × 10⁻⁵, R2 of 0.31) (Figure 9). The ALT trend from the Std Crocus simulations is not statistically significant (not shown). We compared our results with Circumpolar Active Layer Monitoring Network data (CALM, 2021) showing a relative Active Layer Thickness (ALT) increase of 22% from 1996 to 2020, corresponding to a trend of 4.89 cm per decade. The years considered are those with more than 50 annual measurement points. This trend estimate is consistent with the Crocus AC trend results of 4 cm per decade, even if Crocus absolute ALT values (100 cm) are somewhat higher than the overall CALM average (62 cm) or for example to the mean Alaskan thaw depth of 50 cm or to northern Siberia’s average ALT of 60 cm (Letterly, 2018). These differences may be due to the way ALT Crocus was calculated using ISBA soil layers. This trend may also be related with the very high spatial variability of ALT values (coefficient of variation of CALM data of Standard Deviation/mean = 35%), as ground thermal regime strongly varies across regions and sites (Shiklomanov et al., 2012; Park et al., 2013; Dobinski, 2020) and according to soil composition. The depth of the active layer can range from half a meter in warmer, ice-rich environments to a few meters in bedrock and the coldest permafrost regions. Improved analysis of simulated ALT values, which also depend upon ISBA soil parametrization (out of the scope of this paper), would require further study over Arctic areas.
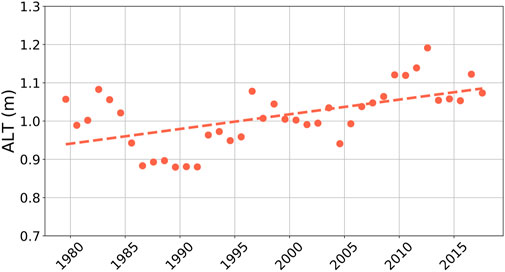
FIGURE 9. Mean Arctic active layer thickness (ALT) evolution between 1979 and 2018 over the permafrost circumpolar area. The dotted line is the regression line (statistically significant).
Moreover, the Arctic-wide increasing trend derived from the AC simulations (Figure 9) is consistent with recent simulations based on the Community Land Model 4.5 driven by the Climate Research Unit-National Centers for Environmental Prediction (CRUNCEP) atmospheric dataset. The latter produced a mean global ALT trend of +7.1 cm decade−1 over the 1979–2009 period (Guo and Wang, 2017). In comparison, observed regional trends from current permafrost measurement sites, which generally have at least a ten-year data record, put the Arctic ALT increase at 4.5–6.5 cm decade−1 (e.g., Aalto et al., 2018: global map; Yi et al., 2018 in Northern Alaska; Etzelmüller et al., 2011 in Svalbard; Christiansen et al., 2010 in Scandinavia; Biskaborn et al., 2015).
It is therefore an interesting result to demonstrate that modified simulations of Arctic Crocus with improved snowpack properties yield a better mean ALT trend over the last 39 years than the Std Crocus model.
Discussion
Effect of Snow on Soil Temperature Evolution
We analyzed the direct effect of snowpack changes on both soil surface temperatures under the snow and temperature at −1.25 m depth. For this purpose, we performed a control simulation with the AC model over the 39 years at the Samoylov site in Siberia by prescribing a constant snowpack (Ctrl simulation). We forced each day of the simulation with the corresponding AC snowpack simulation of this day-of-year derived from the same winter 1979–1980. The SWE maximum values over the years are thus constant in the Ctrl simulation compared to the AC simulation, with all other inputs the same (Figure 10C). Compared to available surface temperature (Tss) observations at this site over the winter period (DJFM), the AC simulated Tss values are closer (mean bias of 11.47 K) than the Std simulated values (mean bias of 13.64 K, not shown here). Ctrl simulated values, however, show better results compared to AC simulated values (mean bias of 7.93 K) (Figure 10A). Soil temperatures exhibit statistically significant mean differences between AC and Ctrl simulations, and are generally colder for the Ctrl simulation than for the AC simulation (Figure 10A). For soil surface temperatures (Tss), the mean difference is ∆(Tss) (AC-Ctrl) = 3.52 ± 2.16 K, while, for temperatures at −1.25 m deep (T−1.25), the difference is higher: ∆(T−1.25) (AC-Ctrl) = 5.59 ± 1.39 K. These differences are explained by the effect of temporal variability in the snowpack properties. In general, for this case study, the higher the SWE, the lower the temperatures (Figure 10A), because the denser snowpack predicted by AC insulates the soil less than in the Ctrl simulation. Moreover, these differences in soil temperatures could also be explained by the differences in snow cover duration (SCD). Figure 10B shows the SCD difference between AC and Ctrl simulations over the period from March (year i-1) to March (year i), i.e., during the period between the preceding winter and the winter studied. We found that the mean AC SCD is slightly higher than that of Ctrl SCD: ∆(SCD) (AC-Ctrl) = 4.4 ± 11 days. As Tss decreases when SCD increases (not shown, significant correlation with R2 = −0.26), the simulated longer AC SCD could lead to soil cooling, and partly counterbalance the soil warming observed for AC (Figure 10A) because of the higher simulated SWE at Samoylov.
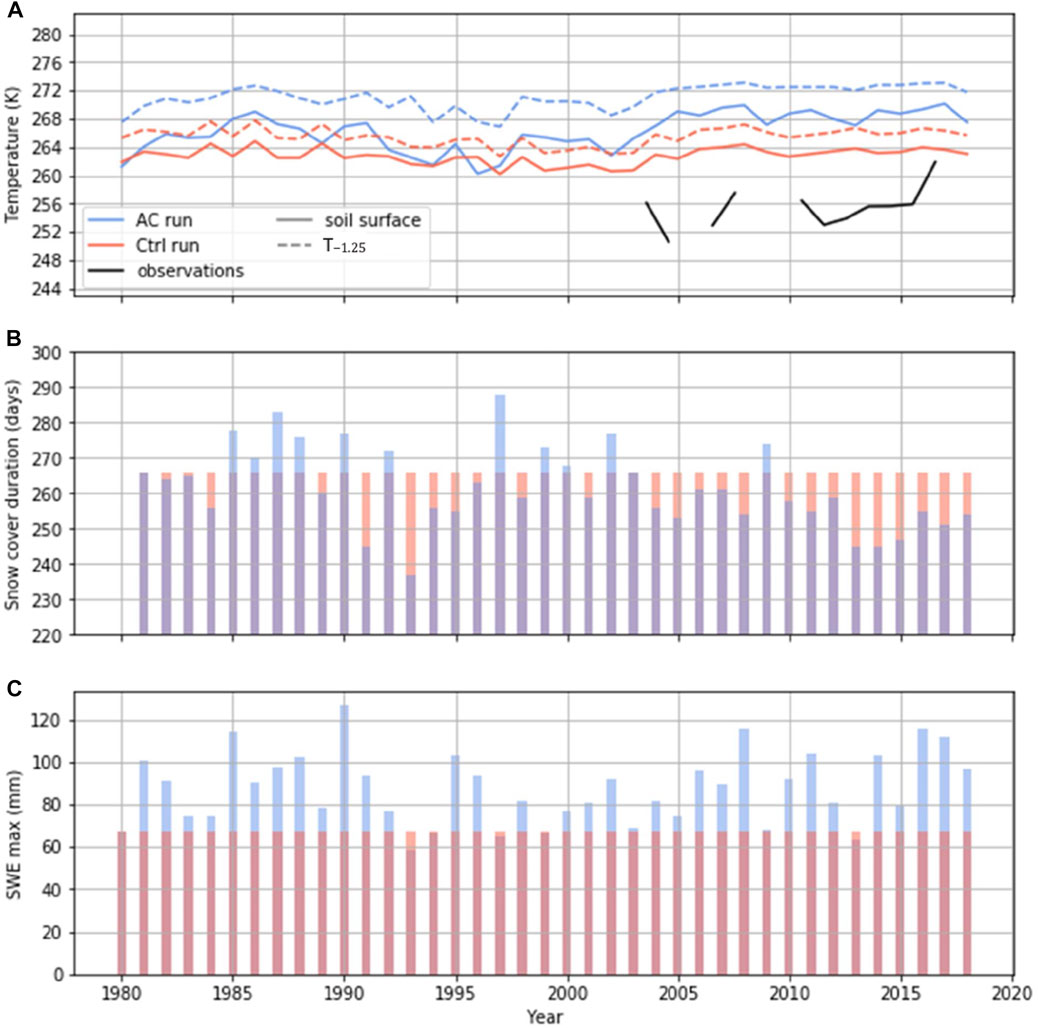
FIGURE 10. Mean soil surface temperature (solid line) and soil temperature at −1.25 m deep (dashed line) over winter (December, January, February and March) at the Samoylov site for Arctic Crocus (AC) simulations (blue), control (Ctrl) simulation and observation (black) (A), snow cover duration in days for AC simulation (blue) and Ctrl simulation with constant snow (orange) (B) and maximum of snow water equivalent (SWE) for AC simulation (blue) and Ctrl with constant snow (orange) (C).
Regarding the impact of warming air temperature over the last 39 years, Ctrl simulations do not show significant trends for both Tss and T−1.25. However, it is interesting to note that, in AC simulations, the increasing trend of T−1.25 (0.75 K decade−1) is lower than that of Tss (1.23 K decade−1). This likely points to an effect over years of snowpack variation on Tss compared to less sensitive deeper soil temperature change. In conclusion, the comparison with the control Arctic Crocus simulation using a constant snowpack (all else being equal) to the Arctic Crocus simulations provides a good illustration of the impact of the changes in snowpack (SWE and duration) on both soil surface temperature (warmer with the AC simulation) and deeper soil temperatures.
Comparison of Snow and Soil Temperature Data With ERA-Interim Outputs
ERA-Interim (ERAi) reanalysis provided the primary atmospheric variables we used to drive both Std and AC simulations. The surface air temperature trend (Ta) over the Arctic (60–90°N, land areas without Greenland) calculated with ERAi for the period 1979–2018 is 0.67 K dec−1 (Table 6), in agreement with the measured value of the land-surface Ta trend of 0.71 K dec−1 for the same period (trend based on the anomalies relative to the 1961–1990 means from the new most recent HadCRUT5 dataset obtained from the Climate Research Unit (University of East Anglia) and Met Office, https://www.metoffice.gov.uk/hadobs/hadcrut5). The reanalysis also includes snow variables that are prognosticated by Crocus, such as SWE and soil temperatures. In order to evaluate the added value of considering a multilayered snow model, we compared the snow variables from AC outputs to ERAi outputs over the Arctic area and the whole period. AC simulations of SWE give better results than the ERAi data compared to observations, with a mean bias of −7.19 mm (RMSE = 56.29 mm) for AC and −72.86 mm (RMSE = 136.18 mm) for ERAi. SWE data from AC are also far better correlated to observations (R2 = 0.80) than ERAi is (R2 = 0.09). Balsamo et al. (2015) partly explained the moderate performance of SWE simulations from ERAi by the lack of snow data assimilation without regular continuous in-situ snowpack observations, likely limiting the quality of the meteorological forcing. The ERAi snow physics model is also simpler than that in Crocus, which may explain the better results obtained with Crocus with the same ERAi forcing.
Soil temperatures simulations at −15 cm also better compare to in-situ observations with AC (2.5 K in bias and 6.9 K in RMSE) than with ERAi (−3.7 K in bias and 9.6 K in RMSE). The correlation between observations and simulations are, however, similar here (0.70 for both Crocus and ERAi), as both models reproduce the annual variability, but ERAi data are generally significantly too cold over the Arctic.
SWE Trends Analysis
In this section, as SWE is a key variable in climate change impact, our results on SWE trends from Crocus Std and AC simulations are put in the context of results from other sources, though it is clear that SWE trends are strongly influenced by atmospheric forcing that drive the snow or climate models, as well as depend on the areas studied.
Our results on SWEmax trend (see end of Snow Cover Property Trends) are consistent with regional observations in northern Canada (Mudryk et al., 2018; Brown et al., 2019) and in Russia (Bulygina et al., 2011). Table 7 summarizes the SWEmax trend values over circumpolar land area reported by different studies from several data sources. The slope of the SWEmax trend using Crocus AC above treeline appears slightly lower than those for 60–90°N areas, likely due to the more northern covered area. However, there is a consensus on the decreasing trend in SWEmax within the range of −0.29 and −0.60 cm dec−1. Even if the time periods for trend calculations are not exactly the same in these studies (Table 7), the variability between data sources is an issue, as outlined by Mudryk et al. (2015), Brown et al. (2017) and Mortimer et al. (2020). An updated analysis over the 1981–2020 period calculated using a blended dataset from four product confirms that the trend in Arctic SWEmax is decreasing by −2.6 ± 1.8%, a 10% decrease since 1981 (Mudryk et al., 2020a,b).
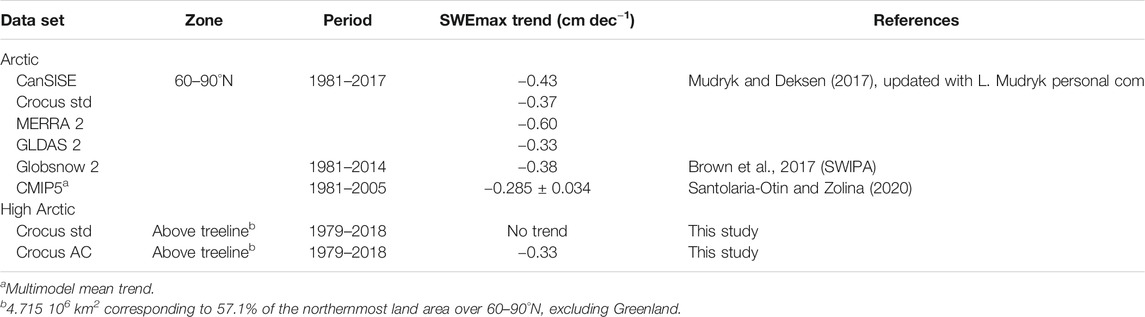
TABLE 7. Summary of Arctic trends in snow water equivalent (cm decade−1) estimated at the time of the winter maximum (SWEmax) for different gridded datasets covering a period of at least 25 years. CanSISE is an observation-based ensemble of gridded daily SWE products from satellite retrievals (Globsnow 2), land surface assimilation systems (GLDAS 2), physical snow models (Crocus v7), and reanalyses (MERRA2 and ERAi) (see Mudryk et al., 2015). CanSISE trend was estimated from the NSIDC CanSISE version 2 dataset (Mudryk and Deksen, 2017) updated for this study.
Conclusion
The new parametrization implemented in the SURFEX-Crocus (V 8.1) snow model allows us to produce improved simulations of Arctic snow properties and soil temperature evolution between 1979 and 2018 compared to those obtained from the standard (Std) version of the model. A better, albeit simple, consideration of wind and vegetation effects on snow density leads to more realistic vertical density profiles and snow depth values for the above-treeline Arctic snowpack. Simulations using this new Arctic Crocus parametrization (AC) driven by ERA-interim (ERAi) meteorological reanalysis are significantly more consistent with in-situ Arctic snowpack measurements than simulations produced with the Std version of the model, notably in terms of soil temperatures, snowpack variables and their respective trends. A reliable simulation of snow structure in Crocus-like models is essential also for satellite assimilation (Larue et al., 2018).
Over the whole circumpolar Arctic area, the new simulation results allow new analyses to be made on snow cover property changes (snow depth, snow cover duration, snow density, snow water equivalent and snow liquid water content) and soil temperatures at different depths. It reveals that the Arctic snowpack has changed over the past 39 years mainly during the melt (April to June) and accumulation (September to October) periods, generating wetter snow of higher density. Moreover, the observed warming leads to a decrease in snow cover duration, yielding in spring increase energy absorption by the snow-free surface.
With the currently observed increase in air temperatures, the consequent changes in the snowpack simulated using the improved AC model are a decrease in maximum snow water equivalent (−33 cm dec−1), a decrease in snow depth and snow cover duration in spring, and an increase in snow density in fall and spring. Overall, the strength of the near-surface temperature Tss trends from Std and AC simulations in winter shows that changes in the snowpack parametrization results in a higher Tss rate for AC (0.41 K dec−1) than Std (0.31 K dec−1). As expected, we show that the winter Tss trend is lower than the winter air temperature (Ta) trend (+0.84 K dec−1), while in summer, both trends are similar (+0.40 K dec−1). The main finding of the snowpack change is that the annual cumulative effect of soil warming remains quite significant, revealing a strong increase in the active layer thickness (ALT) (+16%) over the past 39 years. These outcomes are in agreement with in-situ observations, while the standard Crocus simulations do not show such ground thermal evolution.
The magnitude of these changes is, of course, dependent on the accuracy of the meteorological forcing data used (ERAi reanalysis in this case). The simulated ground temperature values also depend on the soil model used (here ISBA) (see Burke et al., 2020), but the conclusions on trend changes as a result of changes in only snowpack evolution processes remain valid. Better snow model parametrization and snow model simulations constrained by satellite snow observations (Helmert et al., 2018) could improve the analysis. Further research is needed as the observed trends in snow cover and soil temperature could have important consequences in hydrology (modified runoff, increased erosion) (Liljedahl et al., 2016; Andersen et al., 2020), biogeochemistry (increased soil respiration and carbon release in the atmosphere) (Gouttevin et al., 2012; Schuur et al., 2015Turetsky et al., 2019), ecosystems (increased growing and over a longer active period) (Myers-Smith et al., 2015; Seddon et al., 2016; Perreault et al., 2017) and thus in climate feedbacks.
Data Availability Statement
The raw data supporting the conclusions of this article will be made available by the authors, without undue reservation.
Author Contributions
AR, GP and CV designed the study. CV carried out the simulations. All authors contributed to the interpretation of the results. AR and CV took the lead in writing the manuscript. All authors provided critical feedback and helped shape the research, analysis and manuscript.
Funding
This work was made possible thanks to the financial support of the Natural Sciences and Engineering Research Council of Canada (NSERC), the Polar Knowledge Canada, the Quebec government's fund: Fond du Québec Recherche Nature et Technologie and the French-Quebec collaborative program (Samuel de Champlain). We gratefully acknowledge the logistical support we received for field campaigns at Cambridge Bay, Nu (Canadian High Arctic Research Station) and at Trail Valley Creek (TVC), NWT (P. Marsh, Wilfrid Laurier University). The TVC experiment was carried out in collaboration with Environment and Climate Change Canada. Marie Dumont is partly funded by ANR JCJC EBONI grant (ANR-16-CE01-0006). Marie Dumont has also received funding from the European Research Council (ERC) under the European Union’s Horizon 2020 research and innovation programme (grant agreement No 949516, IVORI). IGE and CNRM-CEN are part of Labex OSUG@2020 (ANR-10-LABX-0056).
Conflict of Interest
The authors declare that the research was conducted in the absence of any commercial or financial relationships that could be construed as a potential conflict of interest.
Acknowledgments
We thank the data providers for the Bylot Island site (Florent Domine and Mathieu Barrere, Université Laval) and for the Samoylov site (Julia Boike), as well as the national agencies cited in Table 2. Florent Domine also provided useful comments on a preliminary version of this paper. We also thank Lawrence Mudryk, Environment and Climate Change Canada, for his contribution to the SWE trend analysis, and Nicolas Marchand, Université de Sherbrooke, for data processing. Lastly, we thank the Centre d’Étude de la Neige, Météo-France, at Grenoble, France, for their key support in the development of the SURFEX-Crocus snow model (Samuel Morin and Matthieu Lafaysse). Finally, we thank the two reviewers for their valuable comments which improved the manuscript.
References
Aalto, J., Karjalainen, O., Hjort, J., and Luoto, M. (2018). Statistical Forecasting of Current and Future Circum-Arctic Ground Temperatures and Active Layer Thickness. Geophys. Res. Lett. 45 (10), 4889–4898. doi:10.1029/2018gl078007
Akitaya, E. (1967). “Some Experiments on the Growth of Depth Hoar,” in Proceedings of the Conference of Physics of Snow and Ice, (Sapporo1967), 713–723.
Akitaya, E. (1975). “Studies on Depth Hoar,” in Snow Mechanics (Proceedings of a Symposium Held at Grindelwald, April 1974). (IAHS Pub. 114, Nye, J).
Andresen, C. G., Lawrence, D. M., Wilson, C. J., McGuire, A. D., Koven, C., Schaefer, K., et al. (2020). Soil Moisture and Hydrology Projections of the Permafrost Region - a Model Intercomparison. The Cryosphere 14, 445–459. doi:10.5194/tc-14-445-2020
Balsamo, G., Albergel, C., Beljaars, A., Boussetta, S., Brun, E., Cloke, H., et al. (2015). ERA-Interim/Land: a Global Land Surface Reanalysis Data Set. Hydrol. Earth Syst. Sci. 19 (1), 389–407. doi:10.5194/hess-19-389-2015
Barrere, M. (2018). Evolution couplée de la neige, du pergélisol et de la végétation arctique et subarctique. PhD thesis. Université Grenoble Alpes et Université Laval.
Barrere, M., and Domine, F. (2017). Snow, Soil and Meteorological Data at Bylot Island for Simulating the Permafrost thermal Regime and Evaluating Output of the SURFEXv8 Land Surface Scheme, v. 1.0 (1979–2015). Nordicana D29. doi:10.5885/45460CE-9B80A99D55F94D95
Barrere, M., Domine, F., Decharme, B., Morin, S., Vionnet, V., and Lafaysse, M. (2017). Evaluating the Performance of Coupled Snow Soil Models in SURFEXv8 to Simulate the Permafrost thermal Regime at a High Arctic Site. Geoscientific Model. Develop. 10 (9), 3461. doi:10.5194/gmd-10-3461-2017
Berrisford, P., Dee, D., Poli, P., Brugge, R., Fielding, K., Fuentes, M., et al. (2011). The ERA-Interim Archive Version 2.0, ERA Report Series 1. Reading, UK: ECMWF, shin eld park.
Biskaborn, B. K., Lantuit, H., Dressler, A., Lanckman, J.-P., Johannsson, H., Romanovsky, V., et al. (2015). Quality Assessment of Permafrost thermal State and Active Layer Thickness Data in GTN-P. GeoQuébec 2015, Québec. Circumpolar Active Layer Monitoring Network-CALM. Available at: http://www2.gwu.edu/∼calm/.
Boike, J. (2017). Hourly Meteorology and Snow Height at Samoylov Met-Station (2012-08-01-2013-06-30). doi:10.1594/PANGAEA.879341
Boike, J., Nitzbon, J., Anders, K., Grigoriev, M. N., Bolshiyanov, D. Y., Langer, M., et al. (2018). Soil data at station Samoylov (2002–2018, level 1, version 1), link to archive. PANGAEA. In supplement to: Boike, J. et al. (2019): A 16-year record (2002–2017) of permafrost, active layer, and meteorological conditions at the Samoylov Island Arctic permafrost research site, Lena River Delta, northern Siberia). Earth Syst. Sci. Data 11, 261–299.
Brown, R. D., Fang, B., and Mudryk, L. (2019). Update of Canadian Historical Snow Survey Data and Analysis of Snow Water Equivalent Trends, 1967–2016: Research Note. Atmosphere Ocean, 1–8.
Brown, R. D., and Mote, P. W. (2009). The Response of Northern Hemisphere Snow Cover to a Changing Climate*. J. Clim. 22, 2124–2145. doi:10.1175/2008jcli2665.1
Brown, R., Schuler, D., Bulygina, O., Derksen, C., Luojus, K., Mudryk, L., et al. (2017). “Arctic Terrestrial Snow,” in Snow, Water, Ice and Permafrost in the Arctic (SWIPA), Arctic Monitoring and Assessment Program (AMAP) (Oslo, Norway), 25–64.
Brun, E., Vionnet, V., Boone, A., Decharme, B., Peings, Y., Valette, R., et al. (2013). Simulation of Northern Eurasian Local Snow Depth, Mass, and Density Using a Detailed Snowpack Model and Meteorological Reanalyses. J. Hydrometeorology 14 (1), 203–219. doi:10.1175/jhm-d-12-012.1
Brutel-Vuilmet, C., Ménégoz, M., and Krinner, G. (2013). An Analysis of Present and Future Seasonal Northern Hemisphere Land Snow Cover Simulated by CMIP5 Coupled Climate Models. The Cryosphere 7 (1), 67–80. doi:10.5194/tc-7-67-2013
Bulygina, O. N., Groisman, P. Y., Razuvaev, V. N., and Korshunova, N. N. (2011). Changes in Snow Cover Characteristics over Northern Eurasia since 1966. Environ. Res. Lett. 6 (4), 045204. doi:10.1088/1748-9326/6/4/045204
Burke, E. J., Zhang, Y., and Krinner, G. (2020). Evaluating Permafrost Physics in the Coupled Model Intercomparison Project 6 (CMIP6) Models and Their Sensitivity to Climate Change. The Cryosphere 14, 3155–3174. doi:10.5194/tc-14-3155-2020
Busseau, B. C., Royer, A., Langlois, A., and Domine, F. (2017). Analysis of Snow-Vegetation Interactions in the Low Arctic – Subarctic Transition Zone (north-eastern Canada). Phys. Geogr. doi:10.1080/02723646.2017.1283477
Callaghan, T. V., Johansson, M., Brown, R. D., Groisman, P. Y., Labba, N., Radionov, V., et al. (2011). The Changing Face of Arctic Snow Cover: A Synthesis of Observed and Projected Changes. Ambio 40 (Suppl. 1), 17–31. doi:10.1007/s13280-011-0212-y
CALM (2021). Data Base of the Circumpolar Active Layer Monitoring Network. CALM: Long-Term Observations of the Climate Active Layer Permafrost System. Available at: https://www2.gwu.edu/∼calm/.
Calonne, N., Flin, F., Geindreau, C., Lesaffre, B., Rolland du Roscoat, S., and Rolland du Roscoat, S. (2014). Study of a Temperature Gradient Metamorphism of Snow from 3-D Images: Time Evolution of Microstructures, Physical Properties and Their Associated Anisotropy. The Cryosphere 8, 2255–2274. doi:10.5194/tc-8-2255-2014
Calonne, N., Flin, F., Morin, S., Lesa re, B., du Roscoat, S. R., and Geindreau, C. (2011). Numerical and experimental investigations of the effective thermal conductivity of snow. Geophys. Res. Lett. 38 (23), L23501. doi:10.1029/2011gl049234
Carmagnola, C. M., Morin, S., Lafaysse, M., Domine, F., Lesaffre, B., Lejeune, Y., et al. (2014). Implementation and Evaluation of Prognostic Representations of the Optical Diameter of Snow in the SURFEX/ISBA-Crocus Detailed Snowpack Model. The Cryosphere 8 (2), 417–437. doi:10.5194/tc-8-417-2014
Centre d’Études Nordiques (2015). Réseau SILA. Available at: http://www.cen.ulaval.ca/silatempsreel.php.
Christiansen, H. H., Etzelmüller, B., Isaksen, K., Juliussen, H., Farbrot, H., Humlum, O., et al. (2010). The thermal State of Permafrost in the Nordic Area during the International Polar Year 2007-2009. Permafrost Periglac. Process. 21 (2), 156–181. doi:10.1002/ppp.687
Cohen, J., and Rind, D. (1991). The Effect of Snow Cover on the Climate. J. Clim. 4 (7), 689–706. doi:10.1175/1520-0442(1991)004<0689:teosco>2.0.co;2
Colbeck, S. C. (1993). The Vapor Diffusion Coefficient for Snow. Water Resour. Res. 29 (1), 109–115. doi:10.1029/92wr02301
Dee, D. P., Uppala, S. M., Simmons, A. J., Berrisford, P., Poli, P., Kobayashi, S., et al. (2011). The ERA-Interim Reanalysis: Configuration and Performance of the Data Assimilation System. Q.J.R. Meteorol. Soc. 137 (656), 553–597. doi:10.1002/qj.828
Derksen, C., Lemmetyinen, J., Toose, P., Silis, A., Pulliainen, J., and Sturm, M. (2014). Physical Properties of Arctic versus Subarctic Snow: Implications for High Latitude Passive Microwave Snow Water Equivalent Retrievals. J. Geophys. Res. Atmos. 119 (12), 7254–7270. doi:10.1002/2013jd021264
Domine, F., Barrere, M., and Morin, S. (2016a). The Growth of Shrubs on High Arctic Tundra at Bylot Island: Impact on Snow Physical Properties and Permafrost thermal Regime. Biogeosciences 13 (23), 6471–6486. doi:10.5194/bg-13-6471-2016
Domine, F., Barrere, M., and Sarrazin, D. (2016b). Seasonal Evolution of the Effective thermal Conductivity of the Snow and the Soil in High Arctic Herb Tundra at Bylot Island, Canada. The Cryosphere 10 (6), 2573–2588. doi:10.5194/tc-10-2573-2016
Domine, F., Belke-Brea, M., Sarrazin, D., Arnaud, L., Barrere, M., and Poirier, M. (2018). Soil Moisture, Wind Speed and Depth Hoar Formation in the Arctic Snowpack. J. Glaciol. 64 (248), 990–1002. doi:10.1017/jog.2018.89
Domine, F., Bock, J., Morin, S., and Giraud, G. (2011). Linking the Effective thermal Conductivity of Snow to its Shear Strength and Density. J. Geophys. Res. 116, F040272011. doi:10.1029/2011JF002000
Domine, F., Picard, G., Morin, S., Barrere, M., Madore, J.-B., and Langlois, A. (2019). Major Issues in Simulating Some Arctic Snowpack Properties Using Current Detailed Snow Physics Models: Consequences for the thermal Regime and Water Budget of Permafrost. J. Adv. Model. Earth Syst. 11 (1), 34–44. doi:10.1029/2018ms001445
Environment and Climate Change Canada (2015). Display and Download Climate Data from ECCC. Available at: https://www.canada.ca/en/environment-climate-change/services/climate-change/canadian-centre-climate-services/display-download.html.
Etzelmüller, B., Schuler, T. V., Isaksen, K., Christiansen, H. H., Farbrot, H., and Benestad, R. (2011). Modeling the Temperature Evolution of Svalbard Permafrost during the 20th and 21st century. The Cryosphere 5 (1), 67–79. doi:10.5194/tc-5-67-2011
Fourteau, K., Domine, F., and Hagenmuller, P. (2021). Macroscopic Water Vapor Diffusion Is Not Enhanced in Snow. The Cryosphere 15, 389–406. doi:10.5194/tc-15-389-2021
Global, D. E. M. (1996). Global Topographic 30 Arc-Second Digital Elevation Model (GTOPO30). Earth Resour. Observation Sci. (Eros) Cent. USGS. doi:10.5066/F7DF6PQS
Gouttevin, I., Langer, M., L We, H., Boike, J., Proksch, M., and Schneebeli, M. (2018). Observation and Modelling of Snow at a Polygonal Tundra Permafrost Site: Spatial Variability and thermal Implications. The Cryosphere 12 (11), 3693. doi:10.5194/tc-12-3693-2018
Gouttevin, I., Menegoz, M., Domine, F., Krinner, G., Koven, C., Ciais, P., et al. (2012). How the Insulating Properties of Snow Affect Soil Carbon Distribution in the continental Pan-Arctic Area. J. Geophys. Res. Biogeosciences 117, G02020. doi:10.1029/2011jg001916
Grünberg, I., and Boike, J. (2019). Vegetation Map of Trail Valley Creek, Northwest Territories. Canada: PANGAEA. doi:10.1594/PANGAEA.904270
Guo, D., and Wang, H. (2017). Simulated Historical (1901–2010) Changes in the Permafrost Extent and Active Layer Thickness in the Northern Hemisphere. J. Geophys. Res. Atmospheres 122, 12,285–12,295. doi:10.1002/2017JD027691
Helmert, J., Şensoy Şorman, A., Alvarado Montero, R., De Michele, C., de Rosnay, P., Dumont, M., et al. (2018). Review of Snow Data Assimilation Methods for Hydrological, Land Surface, Meteorological and Climate Models: Results from a COST HarmoSnow Survey. Geosciences 8, 489. doi:10.3390/geosciences8120489
Jafari, M., Gouttevin, I., Couttet, M., Wever, N., Michel, A., Sharma, V., et al. (2020). The Impact of Diffusive Water Vapor Transport on Snow Profiles in Deep and Shallow Snow Covers and on Sea Ice. Front. Earth Sci. 8, 249. doi:10.3389/feart.2020.00249
Larue, F., Royer, A., De Sève, D., Roy, A., Picard, G., Vionnet, V., et al. (2018). Simulation and Assimilation of Passive Microwave Data Using a Snowpack Model Coupled to a Calibrated Radiative Transfer Model over Northeastern Canada. Water Resour. Res. 54 (7), 4823–4848. doi:10.1029/2017wr022132
Le Moigne, P., Boone, A., Calvet, J., Decharme, B., Faroux, S., Gibelin, A., et al. (2009). Surfex Scientific Documentation. Météo-France, Toulouse, France: Note de centre (CNRM/GMME).
Letterly, A. (2018). Report on Permafrost and Frozen Ground Assessments. Available at: http://globalcryospherewatch.org/assessments/permafrost/.
Liljedahl, A. K., Boike, J., Daanen, R. P., Fedorov, A. N., Frost, G. V., Grosse, G., et al. (2016). Pan-arctic Ice-Wedge Degradation in Warming Permafrost and its Influence on Tundra Hydrology. Nat. Geosci 9 (4), 312–318. doi:10.1038/ngeo2674
Löwe, H., Riche, F., and Schneebeli, M. (2013). A general treatment of snow microstructure exemplified by an improved relation for thermal conductivity. Cryosphere 7, 1473–1480. doi:10.5194/tc-7-1473-2013
Marbouty, D. (1980). An Experimental Study of Temperature-Gradient Metamorphism. J. Glaciol. 26, 303–312. doi:10.3189/s0022143000010844
Marsh, P., Bartlett, P., MacKay, M., Pohl, S., and Lantz, T. (2010). Snowmelt Energetics at a Shrub Tundra Site in the Western Canadian Arctic. Hydrol. Process. 24, 3603–3620. doi:10.1002/hyp.7786
Masson, V., Champeaux, J.-L., Chauvin, F., Meriguet, C., and Lacaze, R. (2003). A Global Database of Land Surface Parameters at 1-km Resolution in Meteorological and Climate Models. J. Clim. 16 (9), 1261–1282. doi:10.1175/1520-0442-16.9.1261
Meredith, M., Sommerkorn, M., Cassotta, S., Derksen, C., Ekaykin, A., Hollowed, A., et al. (2019). “Polar Regions,” in IPCC Special Report on the Ocean and Cryosphere in a Changing Climate. Editors H.-O. Pörtner, D. C. Roberts, V. Masson-Delmotte, P. Zhai, M. Tignor, E. Poloczanskaet al. Available at: https://www.ipcc.ch/srocc/chapter/chapter-3-2/.
Mortimer, C., Mudryk, L., Derksen, C., Luojus, K., Brown, R., Kelly, R., et al. (2020). Evaluation of Long-Term Northern Hemisphere Snow Water Equivalent Products. The Cryosphere 14, 1579–1594. doi:10.5194/tc-14-1579-2020
Mudryk, L., Elias-Chereque, A., Brown, R., Derksen, C., Luojus, K., and Decharme, B. (2020a). “Terrestrial Snow Cover,” NOAA Arctic Report Card 2020. Editors R. L. Thomas, J. Richyer-Menge, and M. L. Druckenmiller, 28–34. doi:10.25923/p6ca-v923
Mudryk, L. R., and Derksen, C. (2017). CanSISE Observation-Based Ensemble of Northern Hemisphere Terrestrial Snow Water Equivalent, Version 2. Boulder: Colorado USA. NASA National Snow and Ice Data Center Distributed Active Archive Center. doi:10.5067/96ltniikJ7vd
Mudryk, L. R., Derksen, C., Howell, S., Laliberté, F., Thackeray, C., Sospedra-Alfonso, R., et al. (2018). Canadian Snow and Sea Ice: Historical Trends and Projections. The Cryosphere 12 (4), 1157–1176. doi:10.5194/tc-12-1157-2018
Mudryk, L. R., Derksen, C., Kushner, P. J., and Brown, R. (2015). Characterization of Northern Hemisphere Snow Water Equivalent Datasets, 1981-2010. J. Clim. 28 (20), 8037–8051. doi:10.1175/jcli-d-15-0229.1
Mudryk, L., Santolaria-Otín, M., Krinner, G., Ménégoz, M., Derksen, C., Brutel-Vuilmet, C., et al. (2020b). Historical Northern Hemisphere Snow Cover Trends and Projected Changes in the CMIP6 Multi-Model Ensemble. The Cryosphere 14, 2495–2514. doi:10.5194/tc-14-2495-2020
Myers-Smith, I. H., Elmendorf, S. C., Beck, P. S. A., Wilmking, M., Hallinger, M., Blok, D., et al. (2015). Climate Sensitivity of Shrub Growth across the Tundra Biome. Nat. Clim Change 5 (9), 887–891. doi:10.1038/nclimate2697
Overland, J., Dunlea, E., Box, J. E., Corell, R., Forsius, M., Kattsov, V., et al. (2019). The Urgency of Arctic Change. Polar Sci. 21, 6–13. doi:10.1016/j.polar.2018.11.008
Paradis, M., Levesque, E., and Boudreau, S. (2016). Greater Effect of Increasing Shrub Height on winter versus Summer Soil Temperature. Environ. Res. Lett. 11, 085005. doi:10.1088/1748-9326/11/8/085005
Park, H., Fedorov, A., Zheleznyak, M., Konstantinov, P., and Walsh, T. (2015). Effect of Snow Cover on Pan-Arctic Permafrost thermal Regimes. Clim. Dyn. 44, 2873. doi:10.1007/s00382-014-2356-5
Park, H., Walsh, J., Fedorov, A. N., Sherstiukov, A. B., Iijima, Y., and Ohata, T. (2013). The Influence of Climate and Hydrological Variables on Opposite Anomaly in Active-Layer Thickness between Eurasian and North American Watersheds. The Cryosphere. 7, 631–645. doi:10.5194/tc-7-631-2013
Perreault, N., Lévesque, E., Fortier, D., Gratton, D., and Lamarque, L. J. (2017). Remote Sensing Evaluation of High Arctic Wetland Depletion Following Permafrost Disturbance by Thermo-Erosion Gullying Processes. Arctic Sci. 3, 237–253. doi:10.1139/as-2016-0047
Portner, H., Roberts, D., Masson-Delmotte, V., Zhai, P., Tignor, M., Poloczanska, E., et al. (2019). IPCC Special Report on the Ocean and Cryosphere in a Changing Climate. Geneva, Switzerland: IPCC Intergovernmental Panel on Climate Change.
Pulliainen, J., Luojus, K., Derksen, C., Mudryk, L., Lemmetyinen, J., Salminen, M., et al. (2020). Patterns and Trends of Northern Hemisphere Snow Mass from 1980 to 2018. Nature 581, 294–298. doi:10.1038/s41586-020-2258-0
Räisänen, J. (2008). Warmer Climate: Less or More Snow? Clim. Dyn. 30, 307–319. doi:10.1007/s00382-007-0289-y
Raynolds, M. K., Walker, D. A., Balser, A., Bay, C., Campbell, M., Cherosov, M. M., et al. (2019). A Raster Version of the Circumpolar Arctic Vegetation Map (CAVM),. Rem. Sens. Env. 232. doi:10.1016/j.rse.2019.111297
Riche, F., and Schneebeli, M. (2013). Thermal Conductivity of Snow Measured by Three Independent Methods and Anisotropy Considerations. The Cryosphere 7, 217–227. doi:10.5194/tc-7-217-2013
RIHMI-WDC (2019). Daily Data Set of Soil Temperature at Depths to 320 Cm from Meteorological Stations of the Russian Federation. Available at: http://meteo.ru/english/index.php.
Royer, A., Dominé, F., Roy, A., Langlois, A., Marchand, N., and Davesne, G. (2021). New Northern Snowpack Classification Linked to Vegetation Cover on a Latitudinal Mega-Transect across Northeastern Canada. Écoscience, 1–18. doi:10.1080/11956860.2021.1898775
Rutter, N., Sandells, M. J., Derksen, C., King, J., Toose, P., Wake, L., et al. (2019). Effect of Snow Microstructure Variability on Ku-Band Radar Snow Water Equivalent Retrievals. The Cryosphere 13 (11), 3045–3059. doi:10.5194/tc-13-3045-2019
Santolaria-Otin, M., and Zolina, O. (2020). Evaluation of snow cover and snow water equivalent in the continental Arctic in CMIP5 models. Clim. Dyn. 55, 2993–3016. doi:10.1007/s00382-020-05434-9
Schuur, E. A. G., McGuire, A. D., Schädel, C., Grosse, G., Harden, J. W., Hayes, D. J., et al. (2015). Climate Change and the Permafrost Carbon Feedback. Nature 520 (7546), 171–179. doi:10.1038/nature14338
Screen, J. A., and Simmonds, I. (2010). The central Role of Diminishing Sea Ice in Recent Arctic Temperature Amplification. Nature 464 (7293), 1334–1337. doi:10.1038/nature09051
Seddon, A. W. R., Macias-Fauria, M., Long, P. R., Benz, D., and Willis, K. J. (2016). Sensitivity of Global Terrestrial Ecosystems to Climate Variability. Nature 531 (7593), 229–232. doi:10.1038/nature16986
Serreze, M. C., and Barry, R. G. (2011). Processes and Impacts of Arctic Amplification: A Research Synthesis. Glob. Planet. Change 77 (1), 85–96. doi:10.1016/j.gloplacha.2011.03.004
Shiklomanov, N. I., Streletskiy, D. A., and Nelson, F. E. (2012). Northern Hemisphere Component of the Global Circumpolar Active Layer Monitoring (Calm) Program. Proc. 10th Int. Conf. On Permafrost, 1, 377–382.
Stocker, T., Qin, D., Plattner, G., Tignor, M., Allen, S., Boschung, J., et al. (2013). “IPCC, 2013: Climate Change 2013: the Physical Science Basis,” in Contribution of Working Group I to the Fifth Assessment Report of the Intergovernmental Panel on Climate ChangeCambridge University Press.
Sturm, M., and Benson, C. S. (1997). Vapor Transport, Grain Growth and Depth-Hoar Development in the Subarctic Snow. J. Glaciol. 43 (143), 42–59. doi:10.3189/s0022143000002793
Sturm, M., and Holmgren, J. (1994). Effects of Microtopography on Texture, Temperature and Heat Flow in Arctic and Sub-arctic Snow. Ann. Glaciol. 19, 63–68. doi:10.3189/1994aog19-1-63-68
Sturm, M., Holmgren, J., König, M., and Morris, K. (1997). The thermal Conductivity of Seasonal Snow. J. Glaciol. 43 (143), 26–41. doi:10.3189/s0022143000002781
Sturm, M., Holmgren, J., McFadden, J. P., Liston, G. E., Chapin, F. S., and Racine, C. H. (2001). Snow-Shrub Interactions in Arctic Tundra: A Hypothesis with Climatic Implications. J. Clim. 14, 336–344. doi:10.1175/1520-0442(2001)014<0336:ssiiat>2.0.co;2
Torralba, V., Doblas-Reyes, F. J., and Gonzalez-Reviriego, N. (2017). Uncertainty in Recent Near-Surface Wind Speed Trends: A Global Reanalysis Intercomparison. Environ. Res. Lett. 12 (11), 114019. doi:10.1088/1748-9326/aa8a58
Turetsky, M. R., Abbott, B. W., Jones, M. C., Walter Anthony, K., Olefeldt, D., Schuur, Koven, E. A. G. C., et al. (2019). Permafrost Collapse Is Accelerating Carbon Release. Nature 569 (7754), 32–34. doi:10.1038/d41586-019-01313-4
University of Alaska Fairbanks (2015). Water and Environmental Research center, North Slope Hydrology Research Projects. Available at: http://ine.uaf.edu/werc/projects/foothills/stations/dfm4/historical.html.
USDA (2019). Scan Brochure. Available at: https://www.wcc.nrcs.usda.gov/scan/scan_brochure.pdf.
Vargel, C., Royer, A., St-Jean-Rondeau, O., Picard, G., Roy, A., Sasseville, V., et al. (2020). Arctic and Subarctic Snow Microstructure Analysis for Microwave Brightness Temperature Simulations. Remote Sensing Environ. 242, 111754. doi:10.1016/j.rse.2020.111754
Vionnet, V., Brun, E., Morin, S., Boone, A., Faroux, S., Le Moigne, P., et al. (2012). The Detailed Snowpack Scheme Crocus and its Implementation in Surfex v7.2. Geosci. Model. Dev. 5, 773–791. doi:10.5194/gmd-5-773-2012
Wilfried-Laurier-University (2019). Trail valley Creek Research Station. Available at: https://www.wlu.ca/academics/research/northern-research/research-sites/trail-valley-creek.html.
Yen, Y. C. (1981). Review of thermal Properties of Snow, Ice and Sea Ice. Hanover NH: Technical report, Cold Regions Research and Engineering Lab
Yi, Y., Kimball, J. S., Chen, R. H., Moghaddam, M., Reichle, R. H., Mishra, U., et al. (2018). Characterizing Permafrost Active Layer Dynamics and Sensitivity to Landscape Spatial Heterogeneity in Alaska. The Cryosphere 12 (1), 145–161. doi:10.5194/tc-12-145-2018
Zhang, T. (2005). Influence of the Seasonal Snow Cover on the Ground thermal Regime: An Overview. Rev. Geophys. 43 (4). doi:10.1029/2004rg000157
Keywords: arctic snowpack physical properties, soil temperature, active layer deepening, snow - vegetation interactions, snow modeling, impact of warming arctic on snowpack
Citation: Royer A, Picard G, Vargel C, Langlois A, Gouttevin I and Dumont M (2021) Improved Simulation of Arctic Circumpolar Land Area Snow Properties and Soil Temperatures. Front. Earth Sci. 9:685140. doi: 10.3389/feart.2021.685140
Received: 24 March 2021; Accepted: 14 June 2021;
Published: 28 June 2021.
Edited by:
Anna-Kaisa Ronkanen, University of Oulu, FinlandReviewed by:
Ross Brown, Retired, Burlington, ON, CanadaAlexander N. Fedorov, Melnikov Permafrost Institute, Russia
Copyright © 2021 Royer, Picard, Vargel, Langlois, Gouttevin and Dumont. This is an open-access article distributed under the terms of the Creative Commons Attribution License (CC BY). The use, distribution or reproduction in other forums is permitted, provided the original author(s) and the copyright owner(s) are credited and that the original publication in this journal is cited, in accordance with accepted academic practice. No use, distribution or reproduction is permitted which does not comply with these terms.
*Correspondence: Alain Royer, YWxhaW4ucm95ZXJAdXNoZXJicm9va2UuY2E=