 Hongli Wang
 Xiao Zhang
 Suian Zhang1*
- 1College of Petroleum Engineering, China University of Petroleum, Beijing, China
- 2College of Science, China University of Petroleum, Beijing, China
- 3China United Coalbed Methane National Engineering Research Center Co. Ltd, Beijing, China
- 4National Engineering Research Center for Coalbed Methane Development and Utilization, Beijing, China
- 5Shanxi Lanyan Coalbed Methane Group Co., Ltd, Jincheng, China
The Baiyanghe block in Fukang, Xinjiang, China, is rich in coalbed methane (CBM) resources, and several pilot experimental wells have yielded high production. Due to the high dip angle (35–55°) of the coal seam in this area, the lack of understanding of the geological characteristics, the physical properties of coal, and gas–water migration law lead to immature development techniques and poor overall development benefits. We first conducted desorption and adsorption tests on low-rank coal of this area and found residual gas in the coal. We established a coalbed methane desorption model suitable for this area by modifying the isotherm adsorption model. Next, by analyzing the influence of the gas–water gravity differentiation in the high–dip angle coal seam and the shallow fired coalbed methane characteristics in this area, we discovered the leakage of CBM from the shallow exposed area of the coal seam. Given the particular physical property of coal and gas–water migration characteristics in this area, we optimized the well pattern: (i) the U-shaped along-dip horizontal well group in coal seams is the main production well for gas production with a spacing distance of 312 m; (ii) a multistage fracturing well drilled in the floor of coal is for water production; and (iii) vertical wells with a spacing distance of 156 m in the shallow area is to capture CBM leakage. Using numerical simulation and net present value (NPV) economics models, we optimized the well pattern details. Applying our CBM desorption model, the numerical simulator can improve the accuracy of the low-rank coalbed methane productivity forecast. The optimization results demonstrated the following: 1) the cumulative gas production of single U-shaped well increased by 89% with the optimal well spacing, 2) the cumulative gas production of the well group increased by 87.54% after adding the floor staged horizontal well, and 3) the amount of CBM leakage decrease by 67.59%.
Introduction
Background
Coalbed methane (CBM), also called coal seam gas (CSG), is an unconventional resource. The development of CBM has three practical applications: first, it alleviates energy shortages as a clean energy. Second, it sequesters carbon dioxide to alleviate the greenhouse effect. Most importantly, it reduces the risk of underground coal mine operations by improving the safety of the miners (Zhang et al., 2016). The Baiyanghe block in Fukang, Xinjiang, China, is rich in coal and CBM resources. The CBM development in the Baiyanghe mining area was the first CBM development case in Xinjiang (Mu et al., 2015), which played a positive role in promoting China’s low-rank CBM development and made full use of the abundant resources in China’s northwest area. During the block’s early pilot tests, traditional vertical wells and horizontal wells were drilled. Few wells achieved good production, while most wells did not get a satisfactory development benefit. In this study area, the coal seam is thick with a high dip angle. Optimizing the CBM development method and improving the CBM production and economic benefits are the top priorities.
The accurate CBM reservoir numerical simulation is the most commonly used development optimization method. Using numerical simulation, engineers can provide effective development plans before drilling expensive production wells. They can also update and redescribe the reservoir by history matching during the development process to track and optimize the development plan. Optimizing the well pattern is a crucial task for CBM development. By optimizing the CBM well pattern, we can improve drainage efficiency, accelerate pressure reduction speed, and obtain higher economic benefits. However, the work is arduous and complicated, especially when multiparameter optimization is required. Zulkarnain (2006) conducted a multiparameter simulation to optimize well spacing for CBM production. He found that narrow well spacing can accelerate the drainage process and increase the recovery of CBM. Clarkson and McGovern (2005) developed a new CBM exploration tool to optimize well spacing. Chen et al. (2010) found that the best wellbore direction of four-sided CBM wells should be parallel to the butt cleat direction. The central well angle of a pinnate horizontal well is affected by the anisotropy ratio of permeability. The reservoir simulation conversion method performed by Keim et al. (2011) can optimize the well pattern to maintain high productivity in low-permeability (less than 1.0 MD) coal seam. There are many cases of CBM well spacing optimization, but they mainly focused on horizontal coal seams.
There are also some learning optimization algorithms involved. The main idea is to build many simulation cases and set objective functions for a simulator to run until achieving an optimal value. Beckner and Song (1995) first applied a repetition simulation algorithm and an objective function of the net present value (NPV) to optimize a horizontal well’s position with a fixed direction. Genetic algorithm (GA) is one of the most popular optimization algorithms, and Güyagüler et al. (2002) used it to optimize well positions. Bouzarkouna et al. (2013) applied an optimization method based on the covariance matrix adaptation evolution strategy to optimize the well location trajectory. The particle swarm optimization algorithm application can significantly reduce the optimization time (Onwunalu and Durlofsky, 2010). Feng et al. (2012) used it to optimize the layout of a single well and multiple wells by maximizing the NPV in the synthetic reservoirs. However, these methods did not consider the stability and feasibility of wellbore drilling in high-dip coal seams, meaning currently unable to learn particular reservoir characteristics.
There have been some studies on the optimization of well patterns for high–dip angle coal seams. Mu et al. (2014) considered that wells should not be drilled in the structure’s shallow area, but rather at the structural wing. Ni et al. (2007) proposed different well layout methods for different structural positions: the inverted trapezoid method was for the anticline and syncline, and the triangular method or rhombus method was for the structural wings. Wang et al. (2019) proposed that horizontal wells should be drilled at the shallow area of the coal seam, along the coal seam at the structural wings, and the end of the horizontal well is at the bottom of the coal seam. Vertical wells or T-shaped wells can be drilled at the deep area. Other well layout ideas for high–dip angle coal seams include fan-shaped well layout methods and small well pattern methods. The above methods focus on drilling particular wells in particular areas, while ignoring the cooperation of different types of wells. Besides, they did not consider the desorption and adsorption characteristics of low-rank coalbed methane and the special gas–water migration characteristics caused by the coal seam’s large inclination angle.
The main factors affecting CBM production include the field pressure–volume–temperature (PVT) data, gas content, hydrological data, coal seam structure, and permeability (Tao et al., 2019). Our study focuses on the desorption and adsorption characteristics of low-rank coal, gas–water migration characteristics, and the comprehensive influence of different well types on gas production. Palmer (2008) proposed three specific solutions to utilize CBM reservoirs effectively: 1) locating a high-yield area in the mining area through structural geological maps and coal thickness maps; 2) drilling horizontal wells to produce gas; and 3) developing advanced production stimulation technologies to expand the natural fractures in the coal seam. We started the research with the second and third aspects.
First, we performed adsorption and desorption experiments on low-rank coal samples and found that the coal samples still had a considerable residual gas after negative pressure desorption. Second, we modified the Langmuir isotherm adsorption line to improve the accuracy of absorption data and productivity prediction. Then we analyzed the main negative effects of the high–dip angle coal seam’s gas–water gravity phenomenon through numerical simulation methods. Finally, given the above characteristics of high–dip angle coal seams, we optimized the well type, well spacing, and drilling location to combine an optimal well pattern.
Geological Background of the Research Area
Much of CBM in Xinjiang is low-rank CBM. The estimated CBM resources are 9.5 trillion m3, accounting for 26% of the national CBM resources. The Baiyanghe block in Fukang is a typical low-rank coal area. CBM exploration and production tests of small well groups have achieved breakthroughs in production, demonstrating that the area has good development prospects. The geographical location is shown in Figure 1A. The ridge formed by sandstone of the Sangonghe Formation is located in the southern part of the mining area, while the flat beam formed by flaming rock is located in the northern part of the mining area. The directions of the ridge and the flat beam are consistent with the stratigraphic direction.
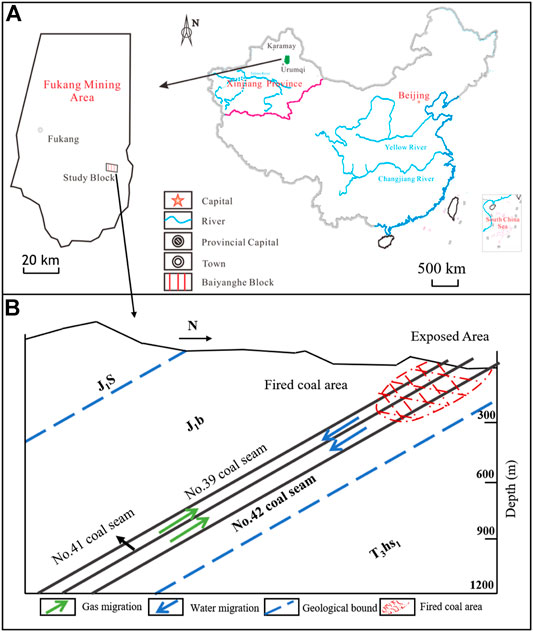
FIGURE 1. Location and reservoir accumulation diagram of the Baiyanghe mining area: (A) the location, (B) the reservoir accumulation diagram.
The Baiyanghe mining area’s overall structure is a south-dipping monoclinic structure, with a strike of nearly east–west direction and a high dip angle. The coal-bearing strata change little in strike and tendency. The structural complexity is a simple structural type. There is a Honggou fault on the west side of the mining area, which is a normal fault, inclined to the west. The main coal seams are the Middle Jurassic Xishanyao Formation and the Lower Badaowan Formation. There are 17 layers of coal seams in the Xishanyao Formation, of which Nos. 39, 41, 42, and 43 coal seams are the main mineable coal seams. The coal seam’s thickness is large, with the maximum thickness of a single layer being 22 m. There are 45 seams in the Badaowan Formation. Among them, there are seven mineable and thick coal seams. The maximum thickness of a single layer is 28.15 m. The total thickness of the Badaowan Formation stratum is 940.5 m. The average thickness of the coal seam is 68.5 m, with the coal content coefficient of 7.28%.
We considered No. 42 coal seam as the main research object. The total thickness of the No. 42 coal seam is between 8.67 and 25.01 m, with the average thickness of 19.36 m, the total thickness variation coefficient of 22.38%, and the secondary difference variation index of 42.66%. Its minable thickness is between 8.67 and 22.85 m, with an average thickness of 18.59 m, the recoverable thickness variation coefficient of 21.19%, and the second-order difference variation index of 41.53%. The estimated resource thickness is between 8.67 and 22.39 m, with an average of 18.32 m and the stratum dip of 45–53°. There are 0–3 layers of gangue with a simple structure and lithology of siltstone and carbonaceous mudstone. It is the largest, minable, and stable thick coal seam in the whole area. The roof is a dark gray powder with fine sandstone, with the floor of siltstone and medium sandstone. The distance from the No. 41 coal seam is between 24.91 and 35.66 m. The diagram of the reservoir accumulation is shown in Figure 1B.
Modified Desorption Isotherm for Low-Rank Coal
Coal Samples
The coal samples were from the Baode block, where the coal is also of low rank. The original samples were irregular lumps of different size with a total amount of about 100 kg. We smashed large coal samples into small ones with a diameter of less than 5 cm. Then we crushed them into powder to them pass through sieves. Only the coal samples between the sieves of 60 and 80 mesh were used for the experiment. We prepared three kinds of samples: dry coal samples, moisture equilibrium samples, and moisture saturated samples.
Experimental Method
The device used in the experiment is the Large Sample Adsorption and Desorption Simulation Device version 2.0 developed by Xi'an University of Science and Technology and China University of Petroleum. Figure 2 shows experimental equipment and the device.
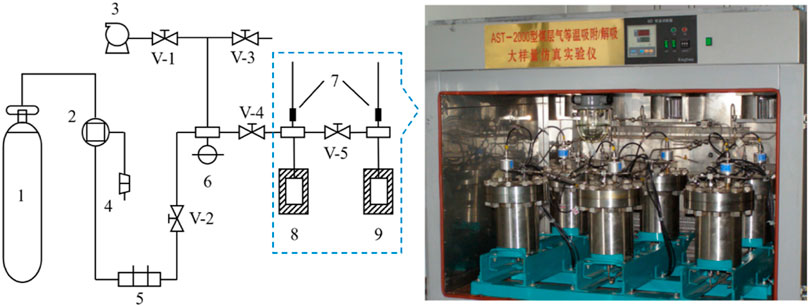
FIGURE 2. Schematic diagram of CBM negative pressure desorption experiment and desorption device. 1: high-pressure CH4 cylinder; 2: booster pump; 3: vacuum pump; 4: compressor; 5: gas filter; 6: pressure gauge; 7: pressure sensor; 8: reference cylinder; 9: sample cylinder; V-1 – V-5: valve.
We performed the adsorption experiment following the national standard (GB/T 19560-2004). The temperature of the isothermal adsorption and desorption experiment was 25°C. The maximum experimental pressure point was 8 MPa. There were no less than seven and six pressure points in the adsorption and the desorption process, respectively. We used a computer to record the temperature of the negative pressure desorption experiment and manually read the precision vacuum gauge (-0.1–0 MPa).
In the first step, we weighed the crushed coal sample and added it to the sample cylinder. After sealing, the samples were put in the thermostat. We opened the valve at the inlet of the intake pipe and filled the reference cylinder and the sample cylinder with methane. After the pressure of the two cylinders reached a certain value, we closed the intake valve. After keeping it for 6 h, we observed whether the pressure in each cylinder changed obviously: if there is, checking whether the equipment is leaking; if not, repeating the steps. We continued to fill each cylinder with gas to increase the pressure until the value reached the highest pressure required for the experiment. Then we evacuated the test system for 12 h and then carried out the negative pressure desorption experiment. We pumped the reference cylinder pressure to negative pressure (about 20 kPa) and opened the balance valve to make the sample cylinder and the reference cylinder pressure balance. Finally, we recorded the pressure after balance and calculated the desorption volume.
Experimental Results and Modified Desorption Model
Figures 3A–C show the experimental results of three kinds of samples. We found that all three kinds of samples had residual gas in the negative pressure desorption experiment. We used the Langmuir isotherm to fit the experimental results. The adsorption data fitted well, while the desorption curve did not fit accurately.
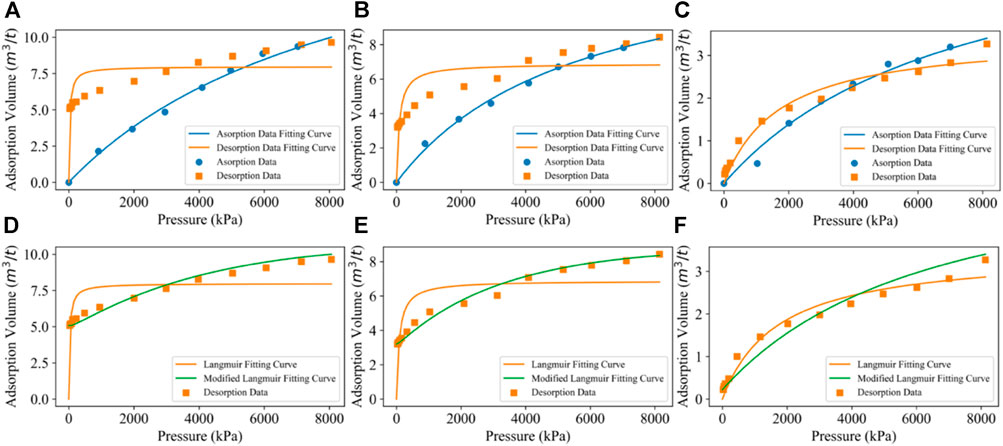
FIGURE 3. Experiment data fitting: fitting by the Langmuir isotherm: (A) dry coal sample, (B) moisture-equilibrated coal sample, and (C) moisture-saturated coal. Fitting desorption data by modified Langmuir isotherm: (D) dry coal sample, (E) moisture-equilibrated coal sample, and (F) moisture-saturated coal.
According to Weishauptová and Medek (1998); Weishauptová et al. (2004), they divided the methane adsorption in the coal matrix mainly into five types. The first type is a monolayer of CH4 molecules adsorbed on the surface of medium and large pores. The second type is the methane molecules controlled by molecular forces near the matrix, which can move freely. They were also included in the calculation of the total gas content of coal. The third type is the dissolved methane molecules in moisture. The fourth type is the methane molecules filled in micropores. The fifth type is the molecules bound to the macromolecular coal matrix structure.
As pressure decreases, the bottleneck-shaped coal matrix gradually swells and the channels shrink, which leads to the generation of residual gas. Therefore, we supposed residual gas is also a function of pressure. To accurately characterize the desorption process of the low-rank coal in the study area, we modified the Langmuir isotherm. When pressure equals 0 kPa, the Langmuir curve returns to zero. Therefore, a residual gas content item n needs to be added, as shown in Eq. 1. At this time, the curve only moves up as a whole, and the residual gas term needs to be corrected as follows:
where
From the negative pressure desorption experiment, we can record two data points accurately: the residual gas content and the pressure point at the beginning of the desorption experiment (the maximum test pressure). The minimum pressure of the negative pressure desorption experiment is 20 kPa, approximated as 0 kPa. We used a linear equation of pressure to make the residual gas term as follows:
where
We used the desorption model with a linear residual gas term to fit the data and found that the determination coefficient (R2) is low. Therefore, we modified the residual gas term to be nonlinear, as shown in Eq. 3:
where
In order to retain the adsorption characteristics, we did not fit the Langmuir volume and pressure of the desorption data. Instead, we used the Langmuir volume and pressure of the adsorption data. The modified desorption model is shown as Eq. 4:
Now, only the residual gas term relevant factor in Eq. 4 needs to be fitted. When
Table 1 and Figures 3D–F show the comparison of fitting the desorption data using the modified and original Langmuir isotherm. Taking dry coal in Figure 3A,(a) as an example, R2 of the Langmuir isotherm fitting the adsorption curve is 0.993 9. The Langmuir volume and pressure are 21.18 m3/ton and 9,000.91 kPa, respectively. However, R2 of the Langmuir fitting desorption data is only 0.594 3. The Langmuir volume and pressure obtained are 7.98 m3/ton and 29.19 kPa, respectively. Then we used the modified Langmuir model to fit the desorption data. First, the Langmuir volume and Langmuir pressure of the Langmuir adsorption curve were retained. Second, we calibrated the starting point of the desorption experiment at 8,000 kPa and the residual gas content under the vacuum state of the negative pressure experiment to 5.08 m3/ton. Finally, we only fitted the residual gas term relevant factor, which resulted in a value of 0.722 1 with an R2 of 0.972 3, which is much better than the Langmuir isotherm result.
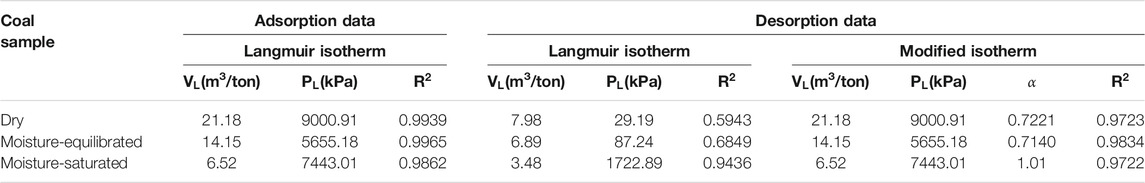
TABLE 1. Fitting results of adsorption and desorption data.
The coal seams’ maximal gas content in the study area is about 10.47 m3/ton, while the average gas content is only 8.35 m3/ton. For 8.35 m3/ton, the critical desorption pressure is about 900 kPa calculated by the Langmuir isotherm adsorption curve. Critical desorption pressure from the new two-point calibrated desorption–adsorption curve is about 600 kPa.
The negative pressure desorption experiment shows that coalbed methane desorption no longer follows the Langmuir isotherm in the low-pressure stage. Therefore, we used the two-point calibration to modify the isotherm. Due to the low-pressure stage, the decompression space is limited, the gas desorption power is insufficient, and the CBM desorption volume relatively shrinks, which is extremely unfavorable to the development of CBM resources. It is necessary to increase the drainage intensity.
Numerical Simulation Method
Numerical Model
We used the CMG-GEM simulator to build the numerical model and generated the optimization scenarios of development. The GEM is a three-dimensional compositional simulator capable of simulating the sorption, diffusion, dual-porosity, and single-permeability flowing of CBM in coal, which is widely used in CBM development engineering studies (Karacan and Olea, 2015; Zhang et al., 2020).
We built the geological model using Cartesian grids with grid numbers of 100, 80, and 10 in the x, y, and z directions, respectively, and set the grid size to 15 m × 15 m × 2.57 m. The boundary is closed. We used the formula editor to edit the grid top burial depth to set the dip angle to 45 degrees along the y direction. Layers 1–7 and 8–10 are coal seams and sandstone floor layers, respectively, as shown in Figure 5. The initial physical property parameters of the model are from the actual geological data of a well in the No. 42 coal seam, as shown in Table 2.
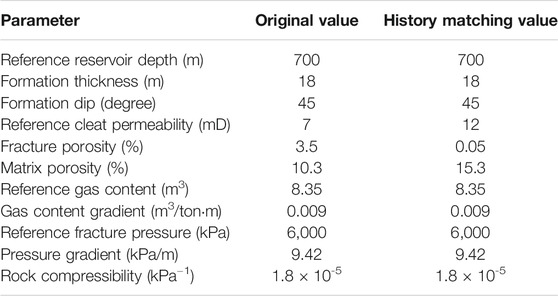
TABLE 2. Original geological parameters and parameters after history matching.
Figures 4A,B show the gas content contour and buried depth contour of the pilot test. It can be found that the gas content distribution in the range of 200–1,150 m buried depth is 2-12 m3/ton. By fitting the gas content with buried depth data, we found that the relationship between the depth and gas content is approximately linear. Therefore, we used the gas content gradient of 0.009 m3/ton m to set up the model. The permeability in this area is strongly anisotropic. Zhang et al. (2021) studied the relationship between permeability and dip angle through experiments and modeled coal seam permeability. We set the permeability of the model in three directions from his theory. Simultaneously, the permeability of the fired coal area, where the buried depth is less than 300 m, is increased tenfold.

FIGURE 4. (A) Gas content contour and (B) buried depth contour of No. 42 coal seam in the Baiyanghe mining area.
Simulation of Gas–Water Gravity Differentiation Phenomenon
During the drainage process, water in the coal seam migrates to the well bottom under the influence of the production pressure difference. Simultaneously, gas is always affected by the vertical downward gravity and the free gas is affected by vertical upward buoyancy. Due to the influence of gravity and buoyancy on gas–water migration, gravity differentiation occurs in the flow process when the production pressure difference is small. Water flows to the deeper part of the reservoir, while gas accumulates on top of the reservoir. Zhou et al. (2015) and Cui et al. (2007) studied the CBM accumulation model of the study area. They revealed exposed areas and fired areas in the study area, which causes particular geological phenomena such as changes in hydrodynamic conditions. Wang et al. (2020) studied the dynamic characteristics of the gas content in the Baiyanghe block. He conducted a simulation and found that when the shallow part of the reservoir is in a closed state, a CBM accumulation area is formed in the shallow part of the coal seam at the later stage of drainage. Therefore, if the shallow area is not closed and the fired coal area has high permeability, CBM will leak from the exposed areas. To simulate CBM leakage, we inserted a row of virtual wells (wells 1, 3, and 5 in Figure 5), where the burial depth is 0 m. The study area is a monoclinic structure, while the exposed areas in the north of the Yilinhegel Mountain receive surface water replenishment. Groundwater migrates from shallow to deep areas along the steep slope. Since the water depth is difficult to be obtained, the bottom-hole pressure is assumed as 151 kPa (1.5 atm). To simulate surface water replenishment, we inserted a row of water injection virtual wells (wells 2 and 4 in Figure 5) between production wells with a buried depth of 0 m. Bottom-hole pressure is set to 151 kPa. By observing the simulation results of wells 1, 3, and 5, we discovered CBM leakage from the shallow part.
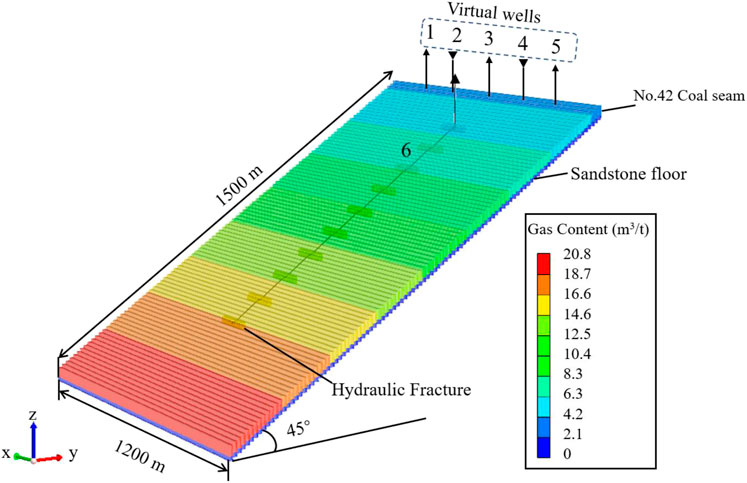
FIGURE 5. Numerical simulation method of migration of gas and water in the exposed area: wells 1, 3, and 5: the virtual wells for simulating gas leakage; wells 2 and 4: the virtual wells for simulating water replenishment; and well 6, an along-dip horizontal well for production.
History Matching
Affected by the uncertainty of the exploration and the limitations of the test method, the parameters obtained during the test may not reflect the actual field conditions. If these parameters are used for simulation, the accuracy of the simulation results cannot be guaranteed. To evaluate the accuracy of the geological model and modify the parameters, we first performed historical matching on the pilot test well data. We used the modified desorption model derived in Experimental Results and Modified Desorption Model section.
We selected the vertical well X1 field production data and used the fixed bottom-hole pressure method to fit the water and gas production rate. 80% of the field data are for history matching parameter correction and 20% for production prediction to test the accuracy of the model. Figures 6A,B show the history matching results of gas and water production rates. The cumulative gas production and cumulative water production errors in the prediction stage are 4.29 and 1.67%, respectively. The numerical model after history matching restores the actual coal seam characteristics from the perspective of productivity simulation. Table 2 shows the data after fitting. Relative permeability is an important characteristic for studying gas–water migration. However, the field data of the relative permeability were unavailable. Therefore, we adjusted the curve from the default curve of GEM. Figure 6C shows the adjusted relative permeability used in the research.
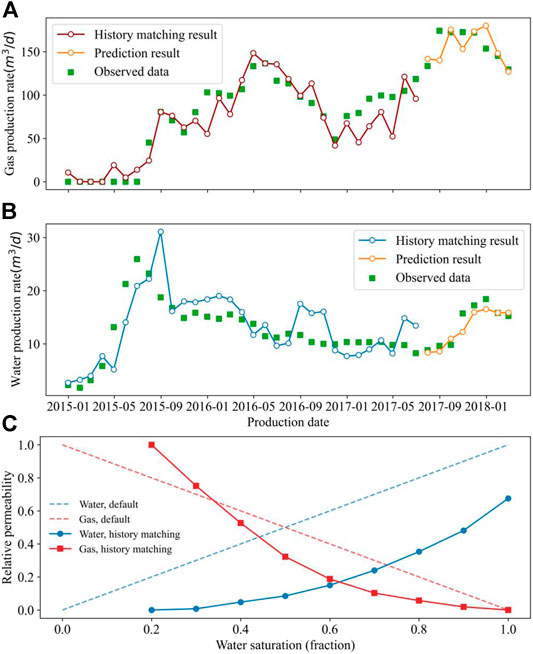
FIGURE 6. Results of history matching for (A) gas production rate, (B) water production rate, and (C) adjusted relative permeability.
Well Pattern Optimization and Results
Development Optimization Objective Functions and Economic Parameters
We used the productivity and NPV simultaneously as the objective function to perform pattern optimization (Hazlett and Babu, 2005; Zhang, 2010). The NPV model is based on the following:
• The wells produce 330 days a year, and the evaluation time is 15 years.
• The cost of a horizontal well includes the cost of a vertical well and horizontal part.
• The cost of a U-shaped well includes the cost of two vertical wells and horizontal part.
• The cost of a horizontal well contains the cost of staged fracturing operation.
• The cost of a vertical well is constant, neglecting the effect of location.
Eq. 5 shows the NPV prediction model we used to optimize the well pattern:
where NPV is the economic net present value of the well pattern, Chinese Yuan (CNY);
The economic evaluation data were taken from Zhang (2010): the horizontal well drilling cost is 0.35 × 10⁶ CNY/m; the vertical well drilling cost is 7 × 10⁵ CNY per well; the CBM sales price is 1.2 CNY/m3; the commodity rate is 95%; the operation and management cost of CBM is 0.36 CNY/m3; the processing cost of water is 6.5 CNY/m3; and the benchmark rate of return is 15%.
Development and Optimization Cases
We performed the optimization from three aspects: well type, drilling method, and well pattern spacing. First, we investigated the primary gas well type with its drilling direction, and well spacing distance. Second, we focused on water production in the deep area of high–dip angle coal seam. Finally, we studied how to capture gas, which can move to the fired coal area and leak into the air.
Wang et al. (2014) analyzed the influence of gas–water gravity difference, solid-phase blockage, and pressure drop propagation characteristics in the process of CBM extraction. He also analyzed the gas production of CBM wells. He found that there is an apparent negative gas–water gravity differentiation impact in vertical wells. The coal powders are easy to concentrate and block the migration channel, resulting in the slow transfer of pressure and difficulty to form effective well interference. The stable inclined section of an along-dip horizontal well can effectively reduce the negative impact of gas–water gravity differentiation. Therefore, we chose horizontal wells as the main development wells and studied the optimal drilling method.
There are some different types of horizontal wells in high-dip coal seams, which are easy to confuse. Figure 7 shows four different horizontal wells in high-dip coal seams. A horizontal well in high–dip angle coal seam refers to well drilling along the horizontal direction, shown as wells 03 and 04 in Figure 7. An along-dip horizontal well indicates that after the drill bit enters the coal seam, the wellbore trajectory maintains the same angle as the coal seam and has a particular extension, shown as wells 01 and 02 in Figure 7.
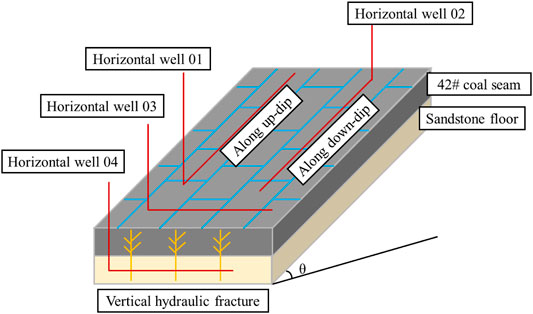
FIGURE 7. Different well-drilling styles: well 01 was drilled along the up-dip direction; well 02 was drilled along the down-dip; well 03 was drilled along the direction of the coal seam trend; and well 04 was a horizontal well drilled in the coal seam floor with vertical fractures through a specific staged fracturing process.
Optimization of Primary Production Well Pattern
Dong et al. (2018) studied the drilling stability of inclined coal seams. He proposed the action zone, the transition zone, and the reversal zone based on drilling stability at different angles. In the Baiyanghe block, drilling horizontal wells along inclination is the safest, while drilling along the coal extension is dangerous. The greater the anisotropy of ground stress, the higher the collapse pressure is and the smaller the range of safe drilling azimuths is. Therefore, we chose the horizontal well drilling along the dip as the primary gas production well.
The buried depth of the No. 42 coal seam under development is around 300–1,100 m with an angle of 45 degrees and the length along the dip angle of about 900 m. Therefore, we designed the length of the drilling the along-dip well as 900 m. The production duration was set to 15 years, which covers the general life span of CBM wells (Feng et al., 2012; Salmachi et al., 2013; Feng et al., 2014).
Figure 8 shows the results of the drilling direction optimization. The daily gas production curve of up-dip drilling shows the characteristics of a typical CBM production curve. It reaches a peak of 16,755 m3/d at 1,858 d. When drilling along the down-dip direction, the gas production showed an increasing trend. Meanwhile, the production fluctuated sharply in the later period. The highest value only reached 4,912 m3/d after 15 years. The cumulative gas production of the up-dip and down-dip horizontal wells is 4.66 × 10⁷ m3 and 0.861 × 10⁷ m3, respectively. The results of the up-dip drilling method are 5.18 times more than those of the down-dip drilling method.
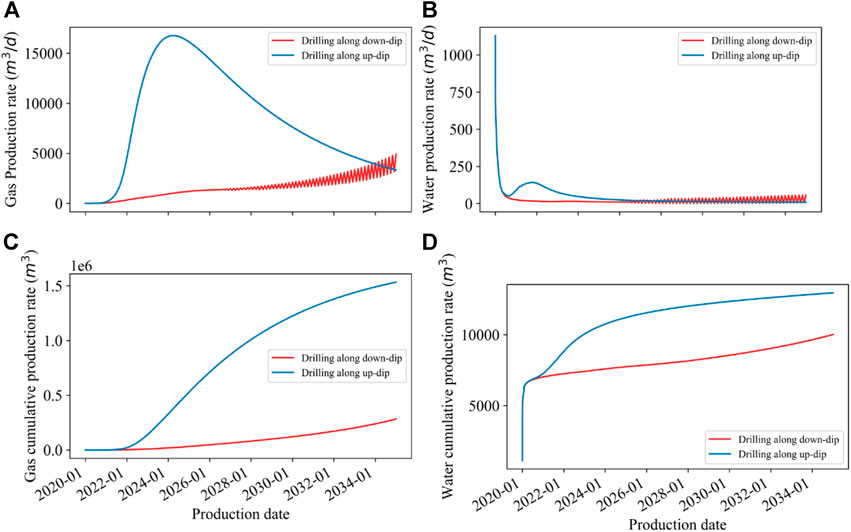
FIGURE 8. Production comparison between different drilling directions: (A) gas production, (B) water production, (C) cumulative gas production, and (D) cumulative water production.
A problem in drilling along the up-dip direction is the turning corner of the drill bit. Therefore, we modified the plan to use down-dip drilling. Besides, we finally added a vertical well at the end of the horizontal well to form a U-shaped well. Figure 9 shows the NPV of the three wells. Although the U-shaped well case increases the cost of a vertical well, the ultimate NPV is the highest.
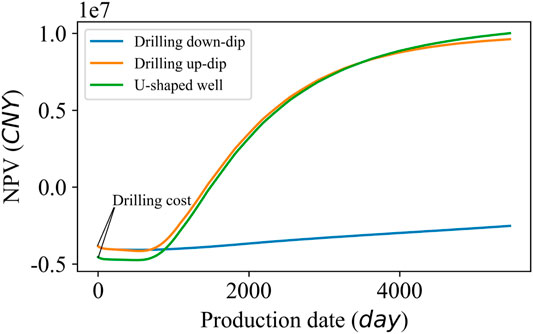
FIGURE 9. Comparison of NPVs of different well drilling types.
Furthermore, we optimized the well spacing distance of the U-shaped wells. According to the microseismic data, the hydraulic fracture length of the pilot test well is 60–80 m. Therefore, we built cases with well spacing distances of 100, 200, 300, 400, and 500 m to prevent fracture interference and ensure economic benefits. For the well spacing distance optimization schemes, we used a production group of all three wells. In order to ensure the correct single well control range, we will set the grids close to the boundary to null grids to meet the distance between the well and the boundary of half the well spacing distance, when the model boundary is too large. Since the boundary is closed, the pressure interference characteristics and the control area of a single well can be guaranteed according to the mirror principle.
Figure 10 shows the results of well spacing optimization. We took the influence of the number of wells in the NPV model into consideration. The R2 of cumulative production and NPV parabola fitting is 0.9221 and 0.9783, respectively. From the perspective of productivity, productivity is optimal when well spacing reaches 299 m. From the perspective of NPV, the NPV reaches its peak when well spacing is 312 m. We determined optimal well spacing based on the NPV, which can ensure the well-controlling area, the effect of well interference, and economic benefit.
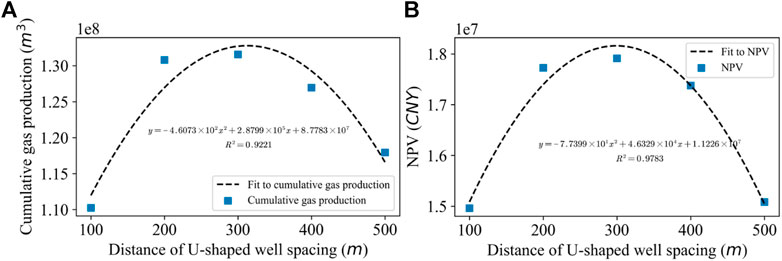
FIGURE 10. Simulation results of different well spacing distances: (A) Cumulative gas production rate and (B) NPV.
When a single U-shaped well produces, the cumulative production of 15 years is 4.66 × 10⁷ m3. When the three wells with the optimal spacing produce, the cumulative production of the group is 2.66 × 10⁸ m3. The cumulative production of each well is 8.85 × 10⁷ m3, with an increase of 89%.
Optimization of Drainage Well
The negative impact of gas–water gravity differentiation during development is that a large amount of water migrates to the deep part of the coal seam, resulting in difficult production. We proposed a plan to drill a staged fracturing horizontal well in the sandstone floor of the coal seam for drainage. According to the formation stress analysis, it is more challenging to drill horizontal wells directly in the coal seam. Therefore, we chose a relatively stable sandstone layer for horizontal wells and fracturing vertical fractures. The gravity plays a significant role in drainage. Cao et al. (2017) gave the feasibility study of CBM floor fracturing. He proposed that water gravity can assist coal seam drainage and pressure drop. This feature is more prominent in the high–dip angle coal seam, so floor horizontal well fracturing has advantages over horizontal wells in the coal seam in the study area.
Figure 11 shows the coal pillar connection among a pilot test well group. We found a stable sandstone layer under the No. 42 coal seam. A horizontal well can be drilled into this layer and fractured to generate vertical fractures into coal. We used the production well pattern optimized in Optimization of Drainage Well section as the base case, including three U-shaped along-dip horizontal wells. The well H1 in Figure 11 shows the numerical simulation method of the floor fracturing horizontal well. Figure 12 shows the simulation results after the floor fracturing horizontal well added. The gas production of the horizontal well is 0 m3, while the water production remained at about 900 m3. After 15 years, the NPV reaches 1.36 × 10⁸ CNY with an increase of 40% compared to the original well pattern of 9.69 × 10⁷ CNY. The cost of the horizontal well becomes negligible.
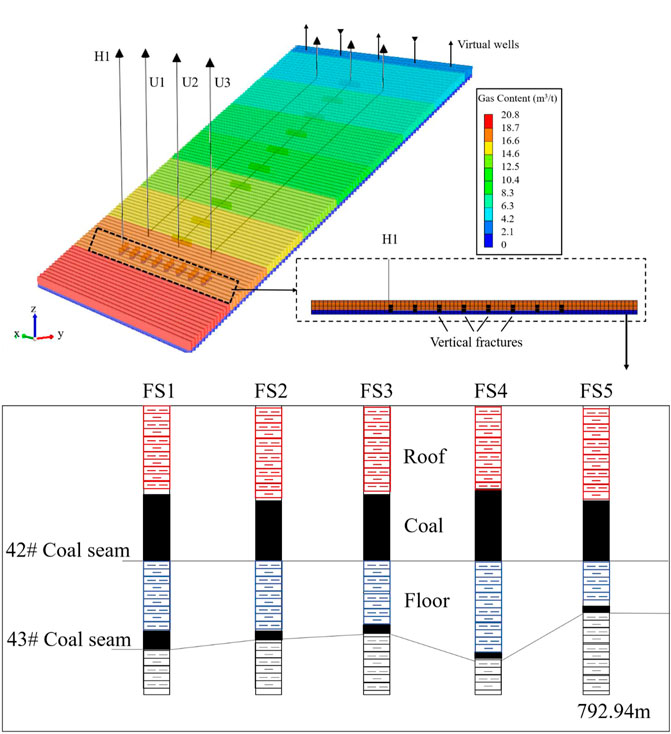
FIGURE 11. Schematic diagram of numerical simulation of the floor fracturing horizontal well and coal pillar connection among a pilot test well group: U1-3 is the U-shaped along-dip horizontal well group; H1 is the horizontal well drilled in the floor; and FS1-5 is the pilot test well group.
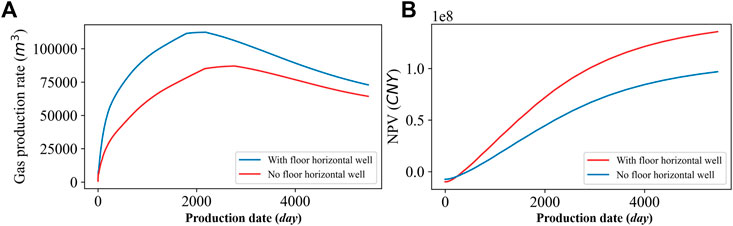
FIGURE 12. Comparison of the simulation cases: (A) Gas production rate, (B) NPV.
Optimization of Inserting Wells
Another negative impact of gas–water gravity differentiation is the leakage of CBM. We used the well pattern optimized above to simulate the CBM leakage phenomenon. Figure 13A shows the amount of CBM leakage. The phenomenon starts on day 1,423 with the amount of CBM leakage gradually increasing with production. After 15 years, the daily leakage rate reaches 12,882 m3/d, leading to a total waste of 2.9 × 10⁷ m3 of resources and production capacity affection. In order to capture leaked gas, we inserted wells in the beginning of the CBM leakage. We inserted five vertical wells at a depth of 300 m. To control a larger area, we set the spacing of inserting wells to half of the optimal bedding well spacing, 156 m. Simultaneously, we chose a well as a reference well and set it to start production together with the U-shaped wells.
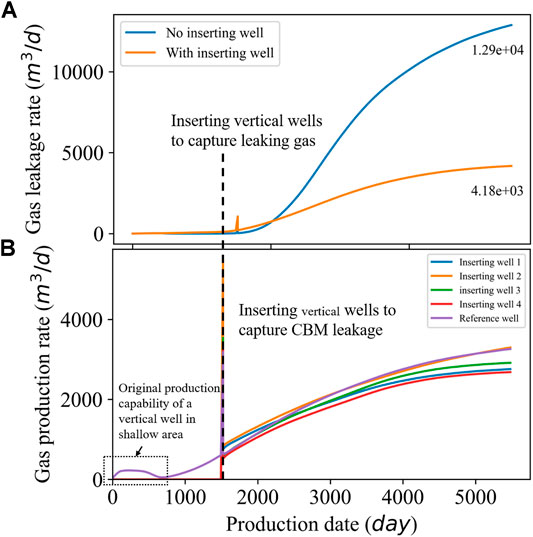
FIGURE 13. Results of inserting well simulation: (A) gas leakage rate and (B) gas production rate.
Operators also considered the characteristics of gas–water gravity differentiation and upward migration of gas in the early pilot test and drilled a vertical well in the shallow part. However, the test result was not good. From Figure 13B, we can observe that if the reference well starts producing from the initial production date, the productivity of the reference well is indeed not ideal. On the one hand, the gas content of the shallow part is low. On the other hand, the CBM from the deep coal seam has not migrated up to the well. After 1,423 days, the productivity of the vertical well has increased significantly. The leakage of CBM has been effectively limited at the same time.
Discussion
Figure 14 shows the specific process of well pattern optimization, the statistical values of the cost, productivity, and NPV of each case. We first optimized the well spacing and found that 312 m is the optimal well spacing, of which the productivity and the NPV reach 2.66 × 10⁷ m3, and 5.44 × 10⁷ CNY, respectively. In order to solve the problem of the difficulty in producing deep water caused by the gas–water gravity differentiation, we proposed a plan to drill a staged and fractured horizontal well in the floor. Although the well did not produce gas, the overall productivity reaches 4.97 × 10⁸ m3 with an increase of 87.54%. The NPV reached 1.16 × 10⁸ CNY with an increase of 123.23%. Finally, in order to solve the impact of CBM leakage, we inserted a vertical well in the shallow part to capture the upwardly moving gas. The production capacity reaches 5.34 × 10⁸ m3 with an increase of 6.93%. The NPV reaches 1.21 × 10⁸ CNY with an increase of 4.3%.
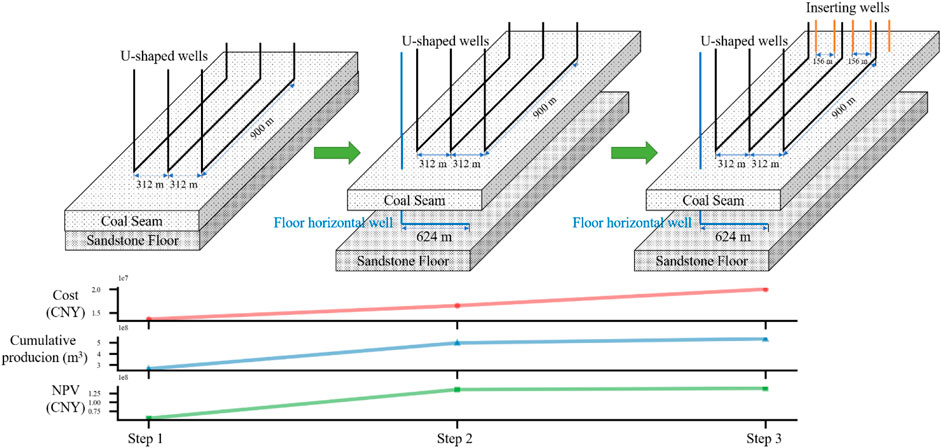
FIGURE 14. Optimization process and result statistics of well pattern in the high-dip coal seam.
From the above data, we found that the most effective measure to increase productivity is to drill a horizontal well in the floor to increase drainage capacity. In the research, the cost of a staged fractured horizontal well is 2.88 × 10⁶ CNY. However, the NPV increases by 6.16 × 10⁷ CNY for the well pattern. Although the five vertical wells inserting at the shallow area did not make a significant contribution to the increase in productivity and NPV, they effectively reduced the leakage of CBM.
Conclusion
We proposed a modified desorption model for low-rank coal and an optimal well pattern for the high–dip angle coal seam. The desorption model can record the information adsorption process and mark the residual gas of low-rank coal. Besides, the desorption model was applied to improve the accuracy of the numerical simulation. We optimized the well pattern, by determining the primary production well, optimizing the wells for producing water, and inserting the wells for capturing CBM leakage.
The U-shaped wells were chosen as the primary production wells, with the optimal well spacing of 312 m. A staged fracturing horizontal well drilled in the floor of the coal seam was chosen for producing water. To capture the leaking CBM from the shallow area, we inserted some vertical wells when leakage starts. The optimal well pattern can improve the NPV significantly and reduce the waste of resources effectively.
The modified desorption model, along-dip horizontal well spacing optimization method, and horizontal wells drilled in the floor proposed in this study can be applied to other inclined low-rank coal reservoirs. Because there are an exposed area and shallow fire coal areas with high permeability in the Baiyanghe mining area, inserting wells that capture CBM leakage are specifically proposed. At the same time, in order to improve the accuracy of the simulation of CBM leakage, field tests should be carried out in the future.
Data Availability Statement
The original contributions presented in the study are included in the article/Supplementary Material, further inquiries can be directed to the corresponding authors.
Author Contributions
HW: conceptualization, methodology, formal analysis, visualization, and writing an original draft. XZ: investigation, review and editing, and funding acquisition. SZ: project administration, supervision, review and editing. HH: validation and data curation. JW: resources.
Funding
This research was conducted under the financial support of the Major Science and Technology Project of Shanxi Province (Grant Nos. 20181101013 and 20201102002).
Conflict of Interest
Author HH was employed by the company China United Coalbed Methane National Engineering Research Center Co. Ltd. and National Engineering Research Center for Coalbed Methane Development and Utilization. Author JW was employed by the company Shanxi Lanyan Coalbed Methane Group Co., Ltd.
The remaining authors declare that the research was conducted in the absence of any commercial or financial relationships that could be construed as a potential conflict of interest.
References
Beckner, B. L., and Song, X., (1995). Field Development Planning Using Simulated Annealing-Optimal Economic Well Scheduling and Placement: SPE annual technical conference and exhibition, Dallas, TX, October 1995. doi:10.2118/30650-ms
Bouzarkouna, Z., Ding, D. Y. Y., and Auger, A. (2013). Partially Separated Metamodels with Evolution Strategies for Well-Placement Optimization. SPE J. 18, 1003–1011. doi:10.2118/143292-pa
Cao, L., Yang, X., Zhang, S., Wang, H., Wang, K., Liu, J., and Zhao, J., (2017). Research of Floor Horizontal Well Staged Fracturing Technology: SPE/IATMI Asia Pacific Oil & Gas Conference and Exhibition, Jakarta, Indonesia, October 2017. doi:10.2118/186370-ms
Chen, D., Liu, J., Pan, Z., and Connell, L., (2010). Coalbed Methane Production: Why Coal Permeability Matters: SPE Asia Pacific Oil and Gas Conference and Exhibition, Queensland, Australia, October 2010. doi:10.2118/133328-ms
Clarkson, C. R., and McGovern, J. M. (2005). Optimization of CBM Reservoir Exploration and Development Strategies through Integration of Simulation and Economics. SPE. Reservoir. Evaluation. Engineering. 8 (6), 502–519. SPE-88843-PA. doi:10.2118/88843-pa
Cui, S., Liu, H., Wang, B., Yang, Y., Ning, N., and Sang, S. (2007). Trapping Characteristics of Coalbed Methane in Low-rank Coal Zhungaer Basin. Geoscience 21, 719–724. doi:10.3969/j.issn.1000-8527.2007.04.019
Dong, Z., Bao, Q., Zhang, J., Sun, Q., Chen, S., Dong, H., et al. (2018). Research on Drilling along Steep Coal Seam:A Case Study of Changji Area in Southern Margin of the Junggar Basin. J. China Coal Soc. 43, 1041–1051. doi:10.13225/j.cnki.jccs.2017.0990
Feng, Q., Zhang, J., Zhang, X., and Hu, A. (2012). Optimizing Well Placement in a Coalbed Methane Reservoir Using the Particle Swarm Optimization Algorithm. Int. J. Coal Geology 104, 34–45. doi:10.1016/j.coal.2012.09.004
Feng, Q., Zhang, X., Zhang, J., and Chen, D. (2014). Numerical Simulation of Commingling Production for Coalbed Methane and Adjoining sandstone Gas Reservoirs. J. China. Coal. Soc. 39, 169–173. doi:10.13225/j.cnki.jccs.2013.0141
Güyagüler, B., Horne, R. N., Rogers, L., and Rosenzweig, J. J. (2002). Optimization of Well Placement in a Gulf of Mexico Waterflooding Project. SPE Reservoir Eval. Eng. 5, 229–236. doi:10.2118/78266-pa
Hazlett, R. D., and Babu, D. K. (2005). Optimal Well Placement in Heterogeneous Reservoirs via Semi-analytic Modeling. SPE J. 10 (3), 286–296. doi:10.2118/84281-pa
Karacan, C. Ö., and Olea, R. A. (2015). Stochastic Reservoir Simulation for the Modeling of Uncertainty in Coal Seam Degasification. Fuel 148, 87–97. doi:10.1016/j.fuel.2015.01.046
Keim, S. A., Luxbacher, K. D., and Karmis, M. (2011). A Numerical Study on Optimization of Multilateral Horizontal Wellbore Patterns for Coalbed Methane Production in Southern Shanxi Province, China. Int. J. Coal Geology. 86, 306–317. doi:10.1016/j.coal.2011.03.004
Mu, F., Jia, C., Mu, L., and Yang, J. (2014). Coal-bed Methane Development Modes in China. Unconventional Oil and Gas 1, 41–46.
Mu, F., Zhong, W., Zhao, X., Che, C., Chen, Y., Zhu, J., et al. (2015). Strategies for the Development of CBM Gas Industry in China. Nat. Gas Industry B 2, 383–389. doi:10.1016/j.ngib.2015.09.013
Ni, X., Wang, Y., Jie, M., and Wu, J. (2007). The Relations between Geological Structure in the Western Jincheng Diggings and Coal-Bed Methane wells Arrangement. J. China Coal Soc. 2, 146–149. doi:10.3321/j.issn:0253-9993.2007.02.008
Onwunalu, J. E., and Durlofsky, L. J. (2010). Application of a Particle Swarm Optimization Algorithm for Determining Optimum Well Location and Type. Comput. Geosci. 14, 183–198. doi:10.1007/s10596-009-9142-1
Palmer, I. (2008). Coalbed Methane wells Are Cheap, but Permeability Can Be Expensive. Energy Tribune 3, 10–13.
Salmachi, A., Sayyafzadeh, M., and Haghighi, M. (2013). Infill Well Placement Optimization in Coal Bed Methane Reservoirs Using Genetic Algorithm. Fuel 111, 248–258. doi:10.1016/j.fuel.2013.04.022
Tao, S., Pan, Z., Tang, S., and Chen, S. (2019). Current Status and Geological Conditions for the Applicability of CBM Drilling Technologies in China: A Review. Int. J. Coal Geology 202, 95–108. doi:10.1016/j.coal.2018.11.020
Wang, C., Peng, X., Zhu, S., Sun, H., Zhang, J., and Lin, L. (2019). Coalbed Methane Well-type Optimization and Well Pattern Arrangement for Thick Coal Seam with a Large Dip Angle. Chin. J. Rock Mech. Eng. 38, 313–320. doi:10.13722/j.cnki.jrme.2018.0911
Wang, S., Wang, F., Houg, G., Wu, X., Zhang, C., Zhang, Y., and Hu, Q. (2014). CBM development well type for steep seam in Fukang Baiyanghe mining area: Xiangjiang Pet. Geology. 39 (9), 1914–1918. doi:10.13225/j.cnki.jccs.2014.8018
Wang, H., Zhang, S., Chen, D., Huang, H., and Zhao, Z. (2020). Dynamic Distribution of Remaining Gas Content in Steep and Thick Coal Seams in Baiyanghe Mining Area of Fukang. Xinjiang Pet. Geology. 41, 587. doi:10.7657/XJPG20200512
Weishauptová, Z., and Medek, J. (1998). Bound Forms of Methane in the Porous System of Coal. Fuel 77, 71–76. doi:10.1016/s0016-2361(97)00178-6
Weishauptová, Z., Medek, J., and Kovář, L. (2004). Bond Forms of Methane in Porous System of Coal II. Fuel 83, 1759–1764. doi:10.1016/j.fuel.2004.03.001
Zhang, J., Feng, Q., Zhang, X., Hu, Q., Wen, S., Chen, D., et al. (2020). Multi-fractured Horizontal Well for Improved Coalbed Methane Production in Eastern Ordos basin, China: Field Observations and Numerical Simulations. J. Pet. Sci. Eng. 194, 107488. doi:10.1016/j.petrol.2020.107488
Zhang, S., Yuan, Y., and Meng, F. (2016). Progress on Coalbed Methane Development Technology in China. Coal Sci. Tech. 44, 1–5. doi:10.13199/j.cnki.cst.2016.05.001
Zhang, T., Tao, S., Tang, D., Tang, S., Xu, H., Zhang, A., et al. (2021). Permeability Anisotropy in High Dip Angle Coal Seam: A Case Study of Southern Junggar Basin. Nat. Resour. Res. 30 (3), 2273–2286. doi:10.1007/s11053-021-09831-7
Zhang, X. (2010). Migration Models of Fluids in Complicated Coalbed Methane Reservoirs and Their Numerical Simulations: Qingdao: China University of Petroleum East China. PhD thesis.
Keywords: coalbed methane, high–dip angle coal seam, desorption model, reservoir numerical simulation, well pattern optimization, Baiyanghe mining area
Citation: Wang H, Zhang X, Zhang S, Huang H and Wang J (2021) Numerical Simulation Research on Well Pattern Optimization in High–Dip Angle Coal Seams: A Case of Baiyanghe Block. Front. Earth Sci. 9:692619. doi: 10.3389/feart.2021.692619
Received: 08 April 2021; Accepted: 12 May 2021;
Published: 07 June 2021.
Edited by:
Huazhou Li, University of Alberta, CanadaReviewed by:
Sarada Prasad Pradhan, Indian Institute of Technology Roorkee, IndiaKai Sheng, University of Texas at Austin, United States
Copyright © 2021 Wang, Zhang, Zhang, Huang and Wang. This is an open-access article distributed under the terms of the Creative Commons Attribution License (CC BY). The use, distribution or reproduction in other forums is permitted, provided the original author(s) and the copyright owner(s) are credited and that the original publication in this journal is cited, in accordance with accepted academic practice. No use, distribution or reproduction is permitted which does not comply with these terms.
*Correspondence: Xiao Zhang, emhhbmd4aWFvQGN1cC5lZHUuY24=; Suian Zhang, c2F6aGFuZ0BjdXAuZWR1LmNu