 Habes Ghrefat
 Ahmed Hakami
 Kamal Abdelrahman
 Faisal K. Zaidi
- Department of Geology and Geophysics, College of Science, King Saud University, Riyadh, Saudi Arabia
The salt dome in Jizan, southwestern Saudi Arabia, has caused several problems related to underground dissolution, particularly in the old part of the city. Examples of these problems include surface collapse, building failure, fracturing, tilting, and road cracking. Analysis of the salt dome using X-ray diffraction (XRD) revealed the dominance of gypsum, anhydrite, and halite. This study evaluates the damage assessment using multitemporal high spatial resolution data of the GeoEye-1, and QuickBird-2 sensors. Change detection technique, textural analysis, and visual interpretation were applied to these data. Analysis of the data recorded before and after a particular damage event revealed that three neighborhoods located above the Jizan salt dome—Al-Ashaima, Shamiya, and Aljabal—were affected to the greatest extent. The entire residential neighborhood of Al-Ashaima was evacuated, and the buildings located in it were demolished. Several buildings in the Shamiya and Aljabal neighborhoods were also demolished. Therefore, high spatial remote sensing data are effective in assessing building damage and for anticipating future damage, thus benefiting decision making for the affected cities.
Introduction
Building destruction is one of the most serious issues in the developing world's unplanned settlements. For an effective response and reconstruction effort, information on the location, severity, and type of damage is critical. High spatial remote sensing data of satellites such as Ikonos, QuickBird-2, GeoEye-1, and WorldView-1 and -2 have been used by several authors to estimate building damage caused by geohazards and natural disasters (Saito et al., 2004; Rathje et al., 2005; Yamazaki et al., 2005; Eguchi et al., 2008; Sissakian and Abdul Jabbar, 2009; Sissakian et al., 2011, Behnia et al., 2012; Aguilar et al., 2012). Sissakian et al. (2011) reported that an integration of data from remote sensing, geographic information systems (GIS), and other geological analysis is essential for detecting various types of geohazards. Visual analysis and change detection based on both pre- and post-event remote sensing images are the most widely used techniques for assessing building damage. Optical and Synthetic Aperture Radar (SAR) can also benefit from change detection techniques as well as their combination, LiDAR data, and ancillary data and maps (GSC, 2000).
Damage assessment by the salt dome in Jizan was investigated by several authors (Al-Muhaidib, 2002; Youssef et al., 2012; Abdelrahman et al., 2021). Erol and Dhowian (1988) found severe and widespread damage in Jizan that was related to sinkholes and linear depressions associated with solution channels in the salt dome. The geological hazards in the city have been evaluated by Youssef et al. (2012) using multispectral remote sensing data such as Landsat-7 and QuickBird-2. The results of their analysis reveal that sabkha soil, salt dome, loess soil, and sand dune/drift have a severe impact on the ongoing development of activities in the Jizan area. Abdelrahman et al. (2021) evaluated the kinetic moduli and the soil competence scale in Jizan area. Their results demonstrated that extensive variation in topsoil profiles in terms of lithology and dynamic and geotechnical properties can cause engineering problems in new or renovated buildings, roads, and infrastructure. Pankratz et al. (2021) used integrated Interferometric Synthetic Aperture Radar datasets, local gravity surveys, and passive seismic data, to assess the environmental hazards associated with salt diapir in Jazan city, and identified the associated risks in the immediate surroundings. Ibrahim et al. (2021) investigated the subsurface extension of the salt diapir and deformation in Jizan city using gravity data. Edge-detection gravity indicated the presence of NW–SE and NE–SW trending fault systems which control the extent of the salt diapir in the area. Ground subsidence due rock dissolution in the area have been reported by a few workers (Ghazali et al., 1985; Fatani and Khan 1993). Alhumimidi (2020) carried out a geotechnical assessment of the near surface sediments in Jizan city and concluded that the city could be differentiated into two structurally weak zones that is the Jizan salt dome in the west and sabkha deposits in the east.
On the basis of the results presented in the literature, the present study uses the multitemporal high spatial remote sensing data of the GeoEye-1, and QuickBird-2 sensors to assess building damage attributed to land subsidence caused by the salt dome in Jizan. Change detection techniques and visual interpretation were applied to the aforementioned data to demonstrate the effects of the land subsidence on building damage before and after a particular damage event.
Area of Study and Geologic Setting
As shown in Figure 1, Jizan city is located in the southwestern part of Saudi Arabia between 42°38′–42°32′ latitude and 16°56′–16°49′ longitude (Abd El-Hamid et al., 2019). Jizan has a total area is 13.500 km2 and includes 13 counties, 29 historic districts, and nearly 4,000 villages. The city has an elevation of 19 m above sea level and is divided geographically into four areas: the coastal plains, highland region, Sarawat Mountains, and Frasan Islands.
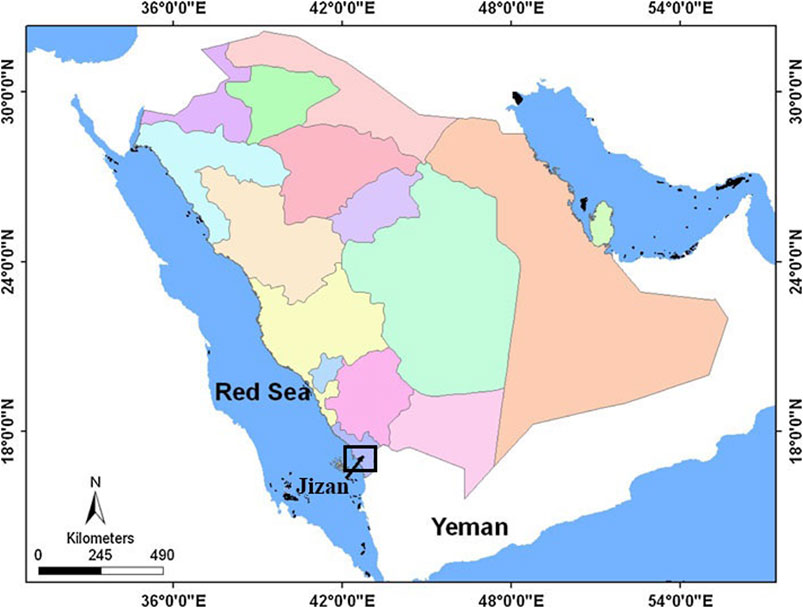
FIGURE 1. Location map of the study area.
The climate is characterized by extreme summer temperatures and mild winters that tend to be warm. The average highest temperatures are 38.5°C during the summer and 30°C during the winter, whereas the average lowest temperatures are 29°C during the summer and 21°C during the winter. The relative humidity reaches 74% in January and 66% in August, and the average relative humidity throughout the year is 68% (Abd El-Hamid et al., 2019).
A large part of Jizan is built on top of a salt dome, which is a unique physiographic feature in the region (Figure 2). The city's other half is built on a low-lying flat area along the Red Sea's edge. Deposits of sand and limestone from the Jurassic period alternately cover the coastal plain. These deposits are covered by a Tertiary continental series of salt deposits and marine calcareous rocks, resulting in a puffy surface known as “Sabkha”. Jizan's salt dome is positioned 10-50 m above the surrounding area. It forms rolling hilly terrain in the old city of Jizan (Pankratz et al., 2021). The salt dome is characterized by a thick evaporite succession at the bottom consisting of rock salt and gypsum. Halite makes up the dome's center, which is flanked by other evaporite minerals. The overlying layers have been folded, faulted, and deformed as a result of the diapiric motions of salt during the formation of the dome. Gray, red, and green siliceous and tuffaceous shale, sandstone, and limestone make up these layers.
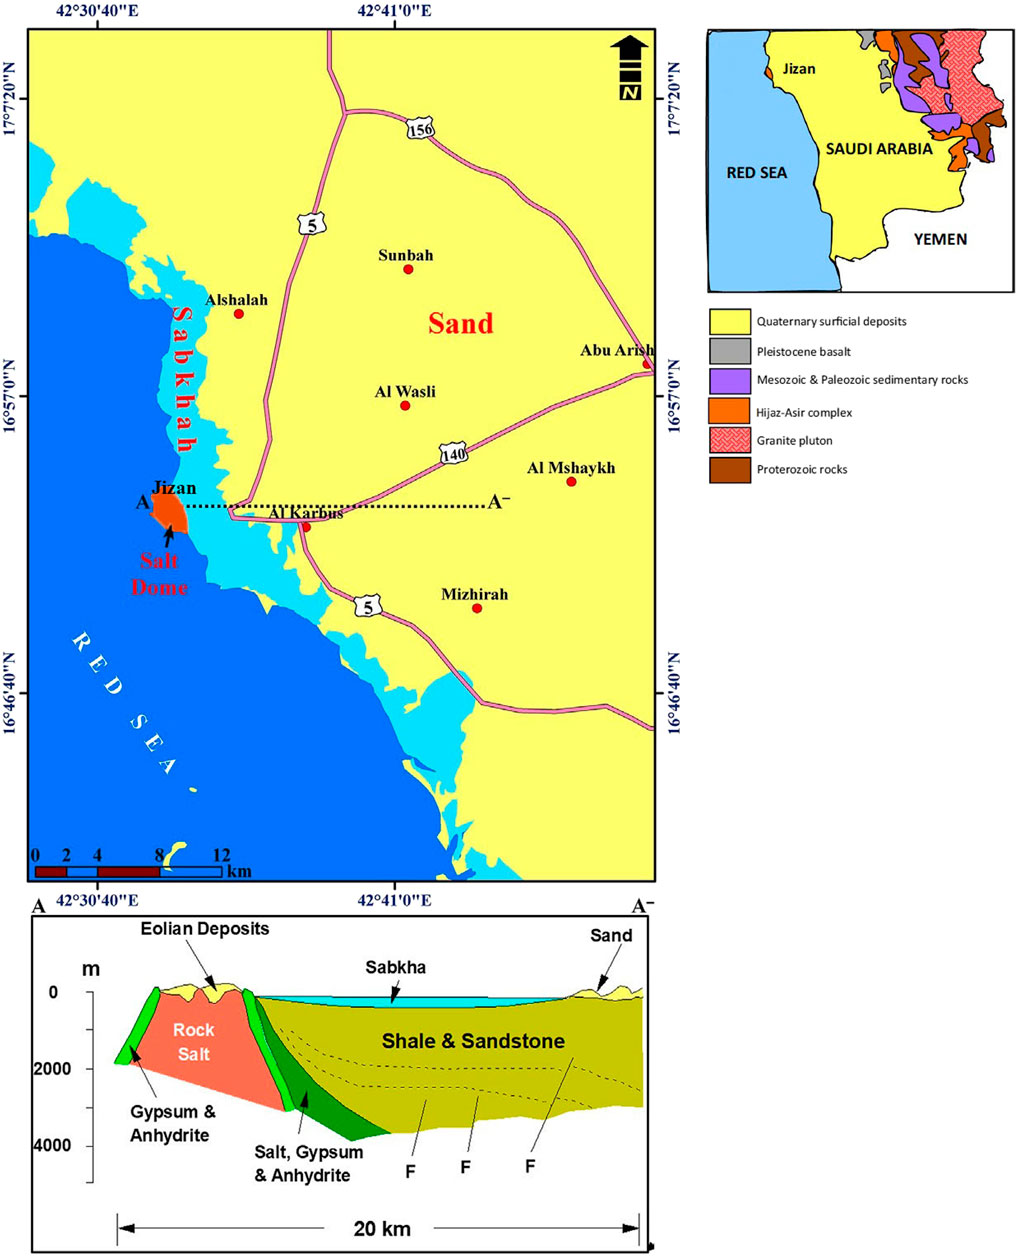
FIGURE 2. Geologic map the study area where the geologic cross-section is drawn on the map (Alhumimidi, 2020).
Jizan is part of the Arabian Shield, which is a Precambrian crustal plate, and 101 is made up of igneous and metamorphic rocks (Figure 2). The dominant rocks are granite, basalt, diorite, gabbro, and mica-schist (Blank and Gettings, 1985; Basyoni and Aref, 2016; Abd El-Hamid et al., 2019). The Arabian shield was separated from the neighboring African Shield during the Tertiary period by a rift due to crustal extension occupied by the Red Sea.
The landforms in Jizan are primarily of an alluvial nature and formed as a result of the downward transportation of soil material from the highlands through the main valleys and drainage channels that drain into the sea. Furthermore, the study area embodies various type of landforms such as marshland, coastal plains, alluvial plains, and valleys (Chapman, 1978; Abd El-Hamid et al., 2019).
Materials and Methods
Mineralogical Analysis
The composition of the collected samples from the study area was determined using X-ray diffraction (XRD). The investigated samples were crushed to a <200 mesh powder and were then illuminated with X-rays of a fixed wavelength. The intensity of the reflected radiation was determined using a goniometer. The diffraction peaks were converted to d-spacings, which were compared using standard reference patterns to identify the unknown minerals.
Spectral Analysis
The laboratory spectra of the samples were obtained in the visible to shortwave infrared regions of the electromagnetic spectrum (0.4–2.5 μm) using a GER3700 spectrometer. The spectrometer sensor was vertically positioned above the sample. The GER3700 spectrometer uses 640 bands between 0.315 and 2.519 μm and spectral sampling ranges from 0.0015 to 0.012 μm (Ghrefat et al., 2007). The samples were illuminated at an incident angle of 30° and reflectances are measured in a rectangular field of view of 1.5 by 7 cm. The spectral radiance (W/M2/sr/nm) of a standard whiteboard is used as a standard reference to measure the spectral radiance of samples. The reflectance of samples is calculated from the ratio of two by dividing the spectral radiance of the whiteboard by the measured target.
Remote Sensing Data
QuickBird-2 and GeoEye-1 data were used to assess the building damage caused by the salt dome in Jizan city. The pre-event QuickBird-2 image was acquired on July 13, 2005, whereas the post-event GeoEye-1 and QuickBird-2 images were recorded on August 17, 2008 and May 31, 2012, respectively.
Operated by DigitalGlobe, Inc., the Quickbird-2 satellite collects PAN and multispectral images at 0.61 and 2.5 m resolutions (Table 1), respectively, with blue at 0.45–0.52 µm, green at 0.52–0.60 µm, red at 0.63–0.69 µm, and near-infrared (NIR) at 0.76–0.90 µm (Yamazaki et al., 2005; Aguilar et al., 2012).
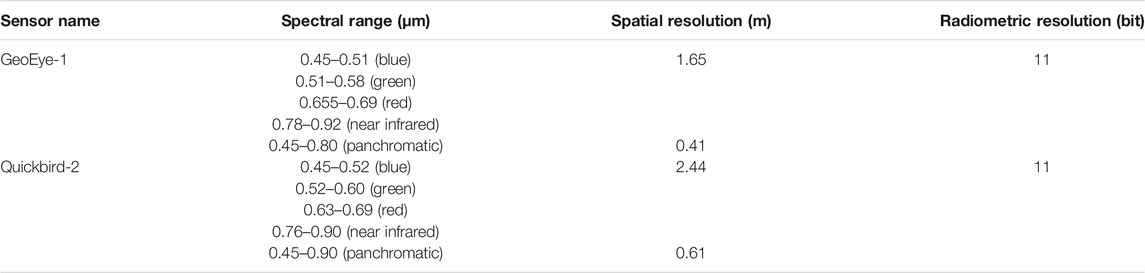
TABLE 1. The spectral properties of GeoEye-1 and Quickbird-2 data.
GeoEye-1 has the ability to acquire image data at 0.46 m PAN (black and white) and 1.84 m multispectral resolutions (Table 1) (Aguilar et al., 2016). Moreover, it features a revisit time of less than three days and is capable of locating an object within 3 m of its physical location.
After the co-registration, the multispectral (MS) images of QuickBird-2, and GeoEye-1 were fused with a higher resolution PAN image using the Gram–Schmidt (GS) spectral sharpening method (Maurer, 2013; Nikolakopoulos, 2008; Pushparaj and Hegde, 2017). In this analysis, the change detection technique was used to distinguish changes in the state of an object or phenomenon by analyzing it at various times in relation to the damage event (Singh, 1989; Moran et al., 2004). Moreover, the textural analysis based on the gray-level co-occurrence matrix was applied to these data to detect the buildings damage. The ENVI 5.2 program was used to analyze the remote sensing data.
Results and Discussion
Mineralogy of the Salt Dome
The analysis of XRD revealed the dominance of gypsum, anhydrite, and halite in the salt dome (Figure 3). The findings of the current study coincide with those of previous studies such as Youssef et al. (2012), Basyoni and Aref (2016), Abdelrahman et al. (2021), and Pankratz et al. (2021). Notably, gypsum and halite salts are active participants in land subsidence and have caused severe damage to buildings in different areas in the world (Romanoff, 1957; Johnson, 2008a; Johnson, 2008b).
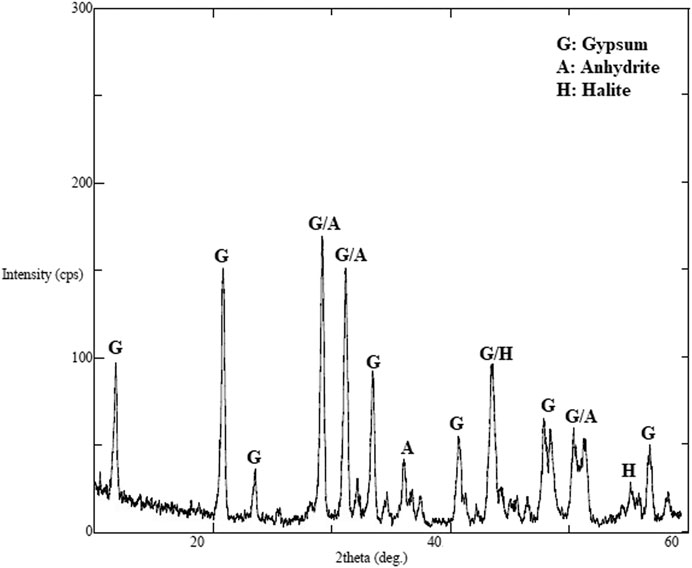
FIGURE 3. XRD pattern of the salt dome.
Spectral Properties of the Salt Dome
Figure 4 shows the United States Geological Survey (USGS) (Clark et al., 1993) library and the GER 3700 spectroradiometer spectra of gypsum and halite. All of the spectral curves displayed an increase in reflectance with increasing wavelength in the 0.4–2.5 μm region. The spectrum of gypsum is characterized by diagnostic absorption features located at 1.2, 1.4, 1.6, 1.74, 1.9, and 2.2 µm. These absorptions are mainly located in the visible and near infrared (VNIR) and short-wave infrared (SWIR) regions and are due to OH and H2O (Hunt et al., 1971). The intensity of the absorption features in the spectrum of gypsum decrease, when gypsum is mixed with other salts (Lindberg and Smith, 1973; Howari et al., 2002). The spectral reflectance curve of halite is generally flat between 0.5 and 2.5 µm (Figure 4) (Hunt et al., 1972; Crowley, 1991). The presence of moisture and fluid inclusions in halite cause water absorption features at 1.4, 1.95, and 2.25 µm (Hunt et al., 1972; Crowley, 1991).
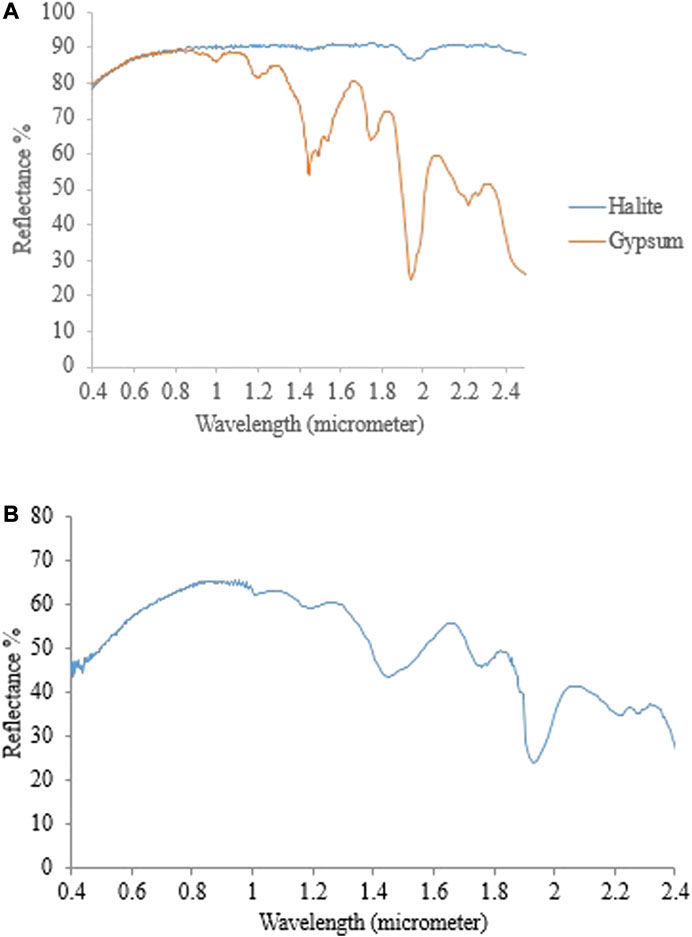
FIGURE 4. The USGS laboratory spectra of gypsum and halite (A) (Clark et al., 1993) and GER 3700 radiometer spectrum of gypsum mixed with halite (B).
Damage Assessment of the Salt Dome
Building damage can be detected using high spatial resolution remote sensing data because the reflective signatures of broken bricks and tiles, as well as other types of damage differ distinctively from undamaged intact buildings.
The characteristics of the damaged areas in the study area were examined in the high spatial resolution satellite images captured before and after the damage event. The visual interpretation of the images and the change detection technique based on the remote sensing data showed that the neighborhoods most affected by the salt dome in Jizan are Al-Ashaima, Shamiya, and Aljabal (Figures 5–7). All of the buildings in Al-Ashaima were evacuated and were subsequently demolished, becoming debris. Some of the buildings in Shamiya and Aljabal were also evacuated and demolished. Other neighborhoods were least affected and were away from the salt dome. Examples of collapsed buildings using QuickBird-2 and GeoEye-1 images are presented in Figure 5. Jazan is located on a salt dome surrounded by Sabkha that cause inclinations and cracks in buildings. The problems identified in the residential areas of Jizan include minor cracks, complete collapse, and substantial inclinations in some buildings as well as subsidence in sidewalks and roads (Figure 8) (Erol and Dhowian, 1988; Erol, 1989; Al-Muhaidib, 2002; Youssef et al., 2012; Youssef and Maerz, 2012). According to Erol (1989), the collapsed structures and cavities reported in areas of salt domes are mainly due to dissolution of salts by the action of rising groundwater that form an underground void. Sinkholes are also reported from some locations in Jizan where the subsurface formations of gypsum and halite has been dissolved naturally by the groundwater circulating through them.
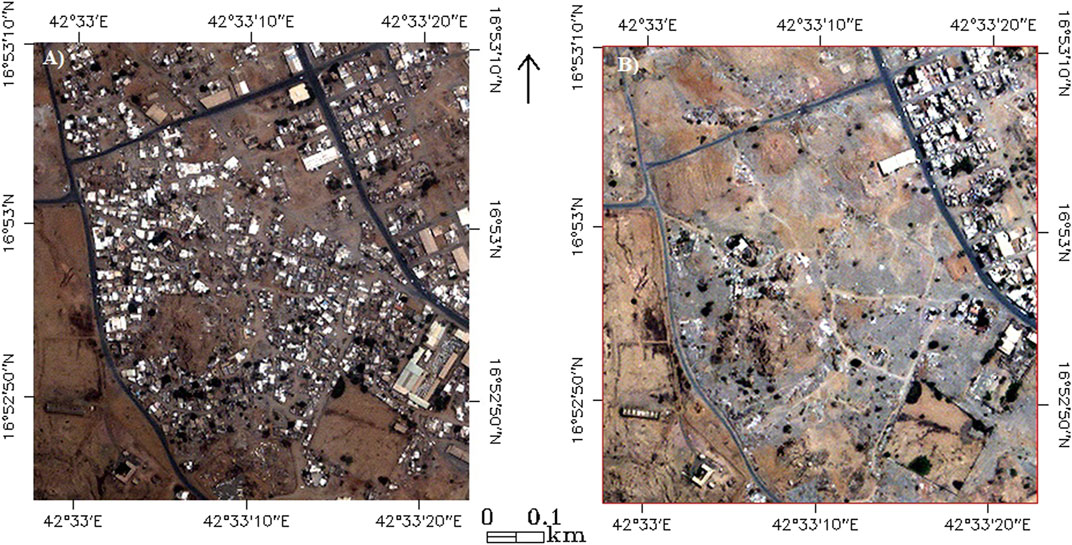
FIGURE 5. The QuickBird-2 color composite images (R:3; G:2; B:1) showing pre-event (A), and = post-event (B) of Al-Shaima neighborhood.
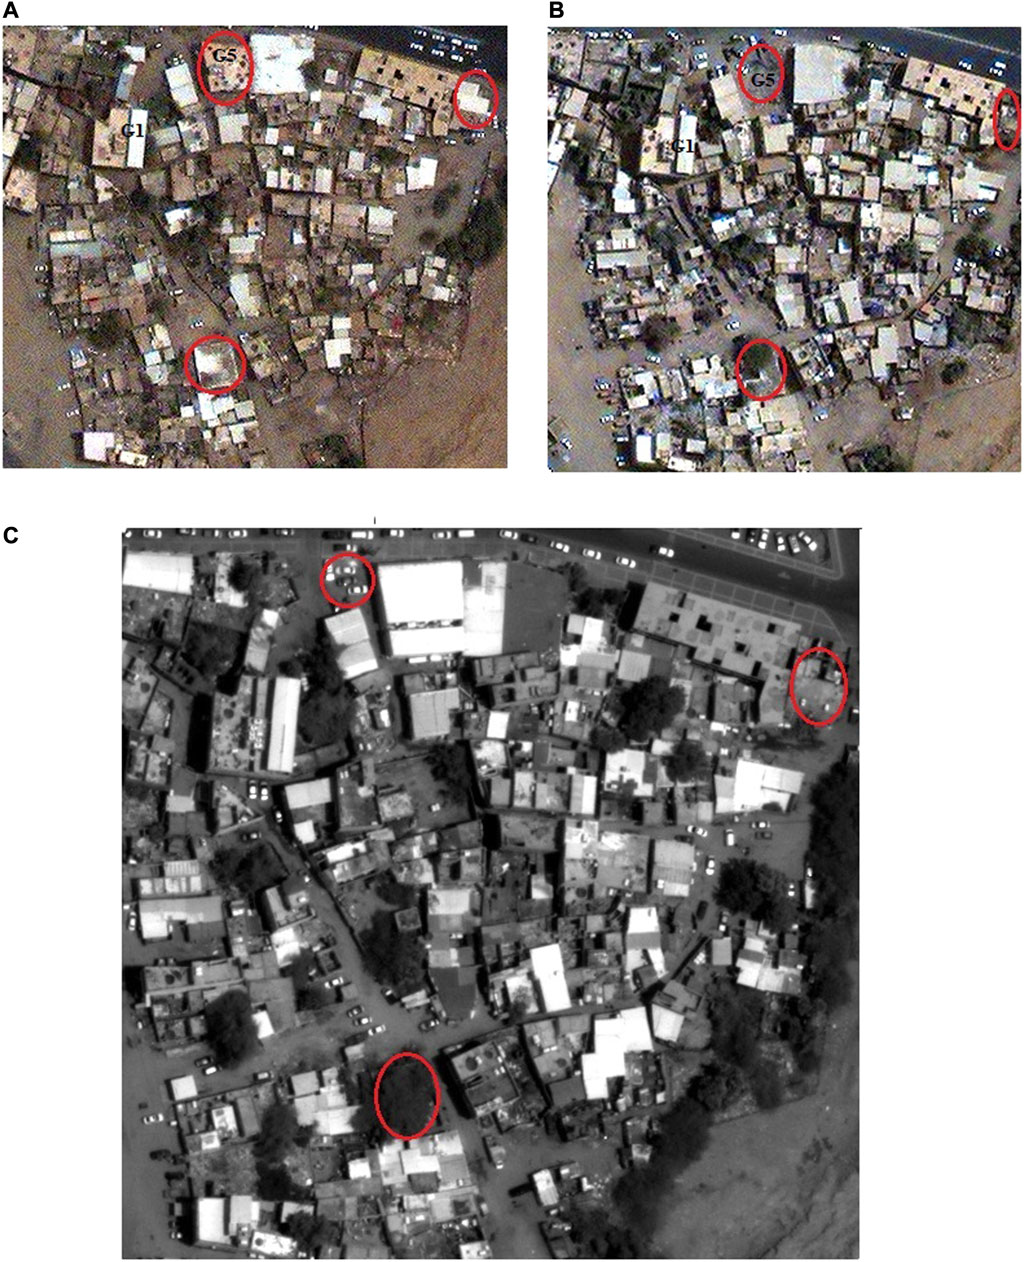
FIGURE 6. Pan-sharpened natural color QuickBird-2 (A = pre-event and B = post-event), and grayscale GeoEye-1 (C) (post-event) images of Aljabal neighborhood. Grade 1 (G1) and Grade 5 (G5) buildings are also shown on the figure.
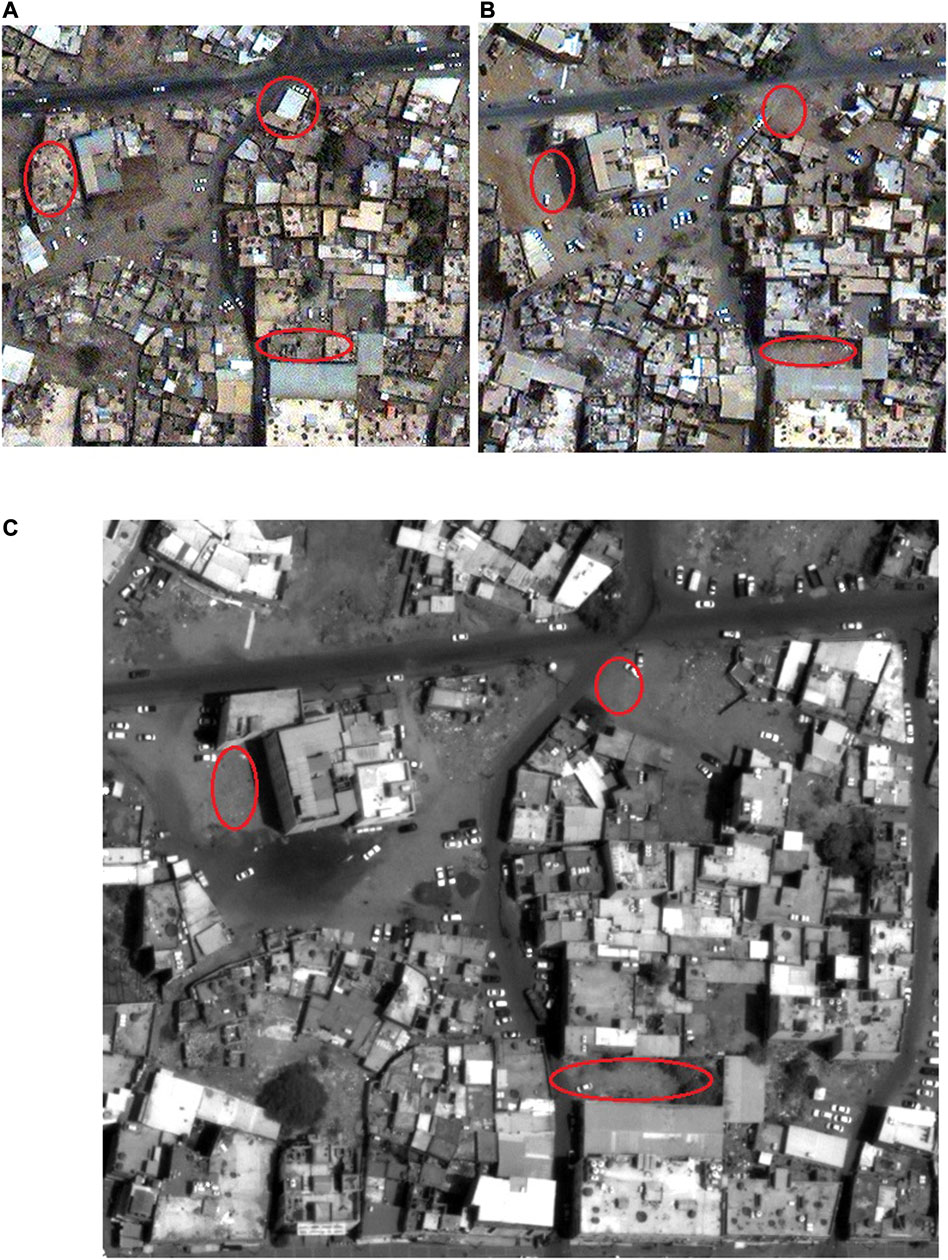
FIGURE 7. Pan-sharpened natural color QuickBird-2 (A = pre-event and B = post-event), and grayscale GeoEye-1 (C) (post-event) images of Shamiya neighborhood.
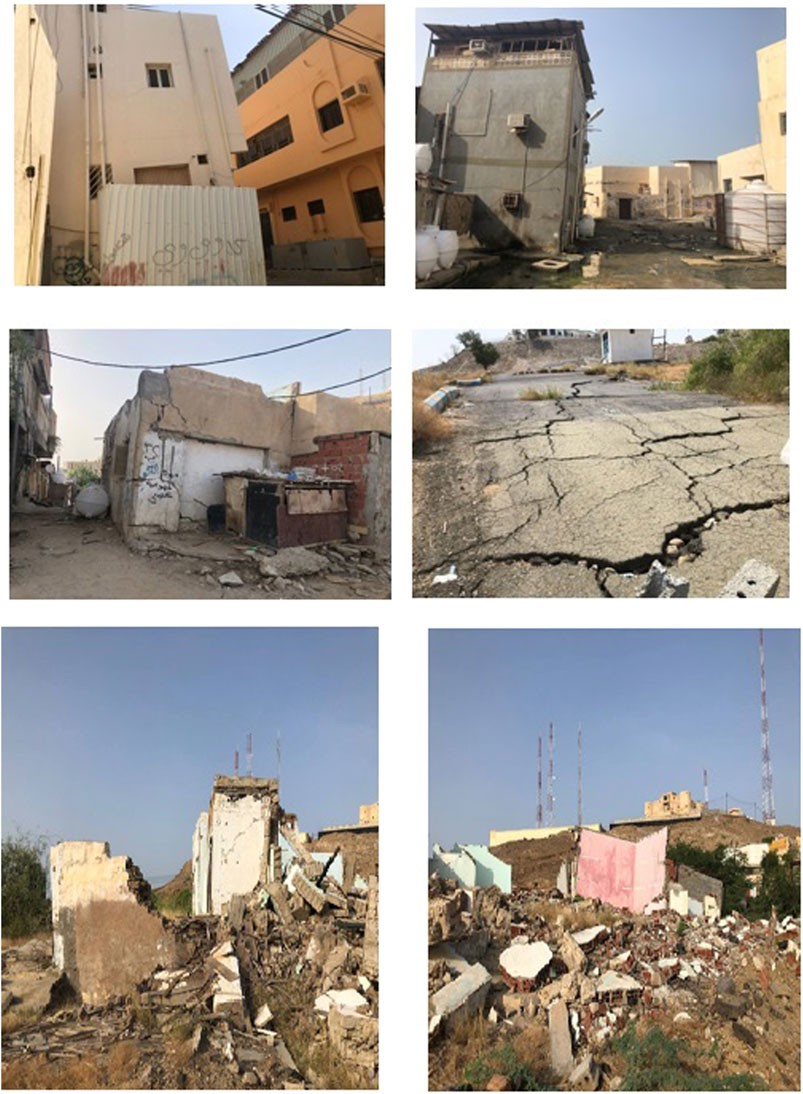
FIGURE 8. Examples of the damages caused by the salt dome.
The classes and categories of the buildings damage in the study area were examined using the EMS-98 scale (Grünthal, 1998), According to this scale, the buildings damage is classified into five categories. Grade 1 represents no and slight damage, moderate damage as Grade 2, heavy damage as Grade 3, very heavy damage as Grade 4, and Grade 5 is partial or total collapse. Only Grade 1 (G1) and Grade 5 (G5) buildings were detected in the study area using Quickbird-2 and GeoEye-1 data. No major differences were observed between the images of the G1 building (Figure 6). In the case of the G5 building, the buildings were completely destroyed (Figure 6). These results demonstrate the feasibility of using these images to identify building damage.
The image texture measures such as the average and homogeneity were used in the current study to differentiate between damaged and undamaged buildings. Also, the spectral information is of importance. In comparison to debris and streets, the buildings have higher digital number (DN) values ranging from 25 to 55 (Figure 9A). Two classes of buildings were identified in average image (Figure 8A). The demolished building debris in Jizan was differentiated from the streets and the damaged buildings by its rough textures. In the photos, the slightly and moderately damaged buildings have smooth and homogeneous texture features. The homogeneity index of these buildings is greater than 0.5 (Figure 9B). The debris area also shows larger homogeneity index because they are sensitive to the bright pixels in the debris. Figure 10 shows the spectral profiles of unaffected areas and collapsed areas. The results showed that collapsed zones are characterized by lower DN values compared to the unaffected zones.
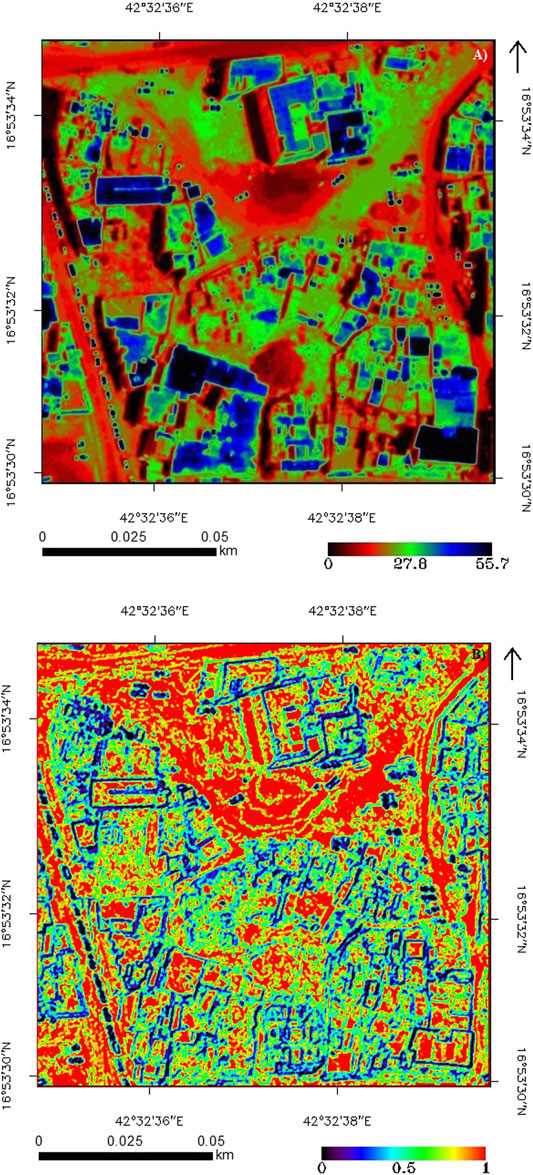
FIGURE 9. The classification of buildings based on average (A) and homogeneity (B) images.
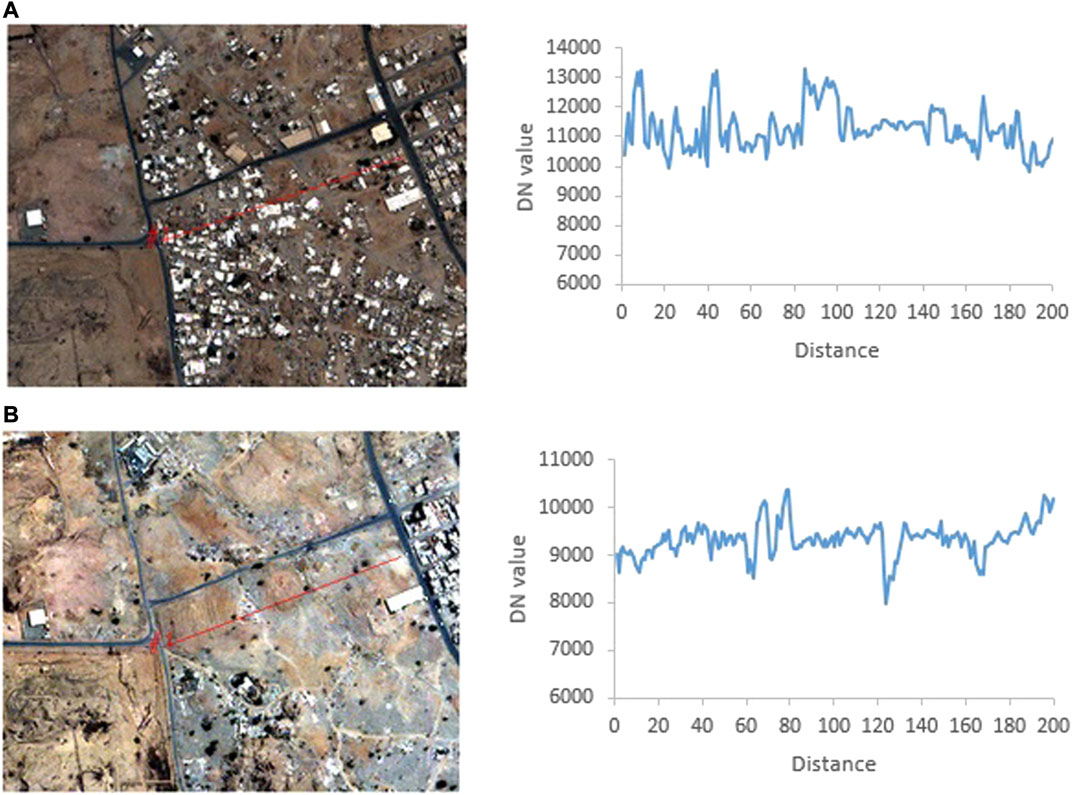
FIGURE 10. The spectral profiles for an affected (A), and damaged (B) areas. The profile is derived from QuickBird-2 data.
The accuracy of mapping the buildings damage using remote sensing data depends on several factors including co-rectification, radiometric correction, spatial resolution, and Sun angle/or Sun azimuth. In this study, the use of GeoEye-1 and QuickBird-2 were helpful and effective in assessing the damage caused by the salt dome in Jizan, and for anticipating the future damage in the area.
In June 2020, a field survey was conducted to map the areas impacted by the salt dome (Figure 11). The majority of the damage occurred in areas close to the dome and was rated as severe to very heavy damage, while buildings farther away suffered minor to moderate damage. The integration of high spatial resolution remote sensing data, image processing methods, mineralogical analyses, laboratory spectral measurements, and field observations was proven to be effective and critical for detecting and mapping building damage in a specific region. There was a good correspondence between remote sensing results and field survey.
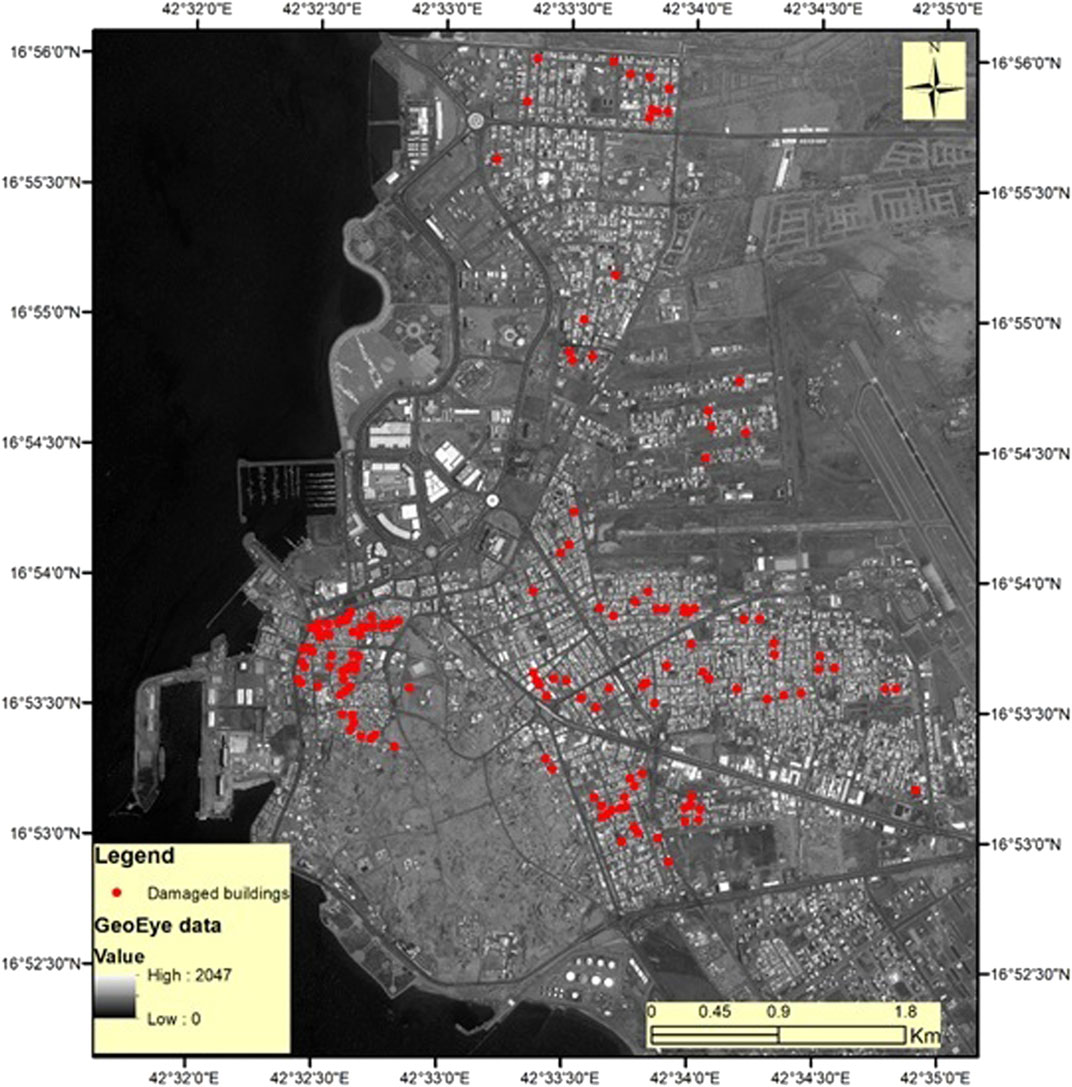
FIGURE 11. GeoEye-1 image with 0.41 m resolution showing the damaged buildings in Jizan based on the field survey.
Conclusions
Gypsum, anhydrite, and halite salts dominate the Jizan salt dome which are easily dissolved by the circulating groundwater leading to several types of geotechnical problems such as surface collapse, building failure, fractures, tilting, and cracked roads. For evaluating building damage caused by this dome, high spatial resolution remote sensing data enabled by visual interpretation of quality high-resolution images taken before and after a disaster are useful. The current study successfully used change detection using both pre- and post-event remote sensing data to assess the salt dome's building-level damage in Jizan. Also, the spectral and textural information were helpful to differentiate between undamaged and damaged buildings. The satellite interpretation of damage assessment was also followed by ground check to establish the reliability of the technique. The damage is classified as minor to serious in the three related communities. A comparative assessment of the high-resolution imageries with previous imageries should be made on a yearly basis to find new areas which might be affected by ground subsidence due to mineral dissolution. The affected areas should be clearly demarcated to minimize construction activities. In certain cases construction may be allowed by proper engineering treatment of the soil prior to construction.
Data Availability Statement
The original contributions presented in the study are included in the article/supplementary material, further inquiries can be directed to the corresponding author.
Author Contributions
HG: Supervision, Writing. HA: Field work, IE, SM, QS: Conceptualization, Methodology and Resources. AK, ZF: Validation and Investigation.
Funding
This research was funded by the National Plan for Science, Technology and Innovation (MAARIFAH), King Abdulaziz City for Science and Technology, Kingdom of Saudi Arabia, Award Number (2-17-01-001-0014).
Conflict of Interest
The authors declare that the research was conducted in the absence of any commercial or financial relationships that could be construed as a potential conflict of interest.
Acknowledgments
The authors also thank the Deanship of Scientific Research and RSSU at King Saud University for their technical support.
References
Abd El-Hamid, H. T., Hafiz, M. A., Wenlong, W., and Qiaomin, L. (2019). Detection of Environmental Degradation in Jazan Region on the Red Sea, KSA, Using Mathematical Treatments of Remote Sensing Data. Remote Sens Earth Syst. Sci. 2, 183–196. doi:10.1007/s41976-019-00022-w
Abdelrahman, K., Ibrahim, E., Qaysi, S., Mogren, S., Zaidi, F., and Ghrefat, H. (2021). Evaluation of Kinetic Moduli and Soil Competence Scale of Soil Profiles in Jizan Area, Southwestern Saudi Arabia. Arab. J. Geosci. 14, 172. doi:10.1007/s12517-020-06376-6
Aguilar, M. A., Fernández, A., Aguilar, F. J., Bianconi, F., and Lorca, A. G. (2016). Classification of Urban Areas from GeoEye-1 Imagery through Texture Features Based on Histograms of Equivalent Patterns. Eur. J. Remote Sensing 49, 93–120. doi:10.5721/eujrs20164906
Aguilar, M. A., Saldaña, M. M., and Aguilar, F. J. (2012). GeoEye-1 and WorldView-2 Pan-Sharpened Imagery for Object-Based Classification in Urban Environments. Int. J. Remote Sensing 34 (7), 2583–2606. doi:10.1080/01431161.2012.747018
Al-Muhaidib, A. (2002). Sabkha Soil in the Kingdom of Saudi Arabia: Its Properties and Methods of Treatment. J. King Abdulaziz Univ. Eng. Sci. 14 (2), 51.
Alhumimidi, M. S. (2020). Geotechnical Assessment of Near-Surface Sediments and Their Hazardous Impact: Case Study of Jizan City, Southwestern Saudi Arabia. J. King Saud Univ. - Sci. 32 (3), 2195–2201. doi:10.1016/j.jksus.2020.02.031
Basyoni, M. H., and Aref, M. A. (2016). Composition and Origin of the Sabkha Brines, and Their Environmental Impact on Infrastructure in Jizan Area, Red Sea Coast, Saudi Arabia. Environ. Earth Sci. 75, 105. doi:10.1007/s12665-015-4913-6
Behnia, P., Rainbird, R., and Harris, J. (2012). Remote Predictive Mapping 4. Utilizing High Resolution Satellite Imagery, Western Minto Inlier, Victoria Island, Nwt. Geosci. Can. 39, 33–45.
Blank, H. R., and Gettings, M. E. (1985). Reconnaissance Geologic Map of the Jizan Quadrangle, Sheet 16/42 B, Kingdom of Saudi Arabia. Open-File Report 85–724. United States Geological Survey.
Chapman, R. W. (1978). Quaternary Period in Saudi Arabia. Vienna: Springer, 4–19. doi:10.1007/978-3-7091-8494-3_3
Clark, R. N., Swayze, G. A., Gallagher, A., King, T. V. V., and Calvin, W. M. (1993). The U.S. Geological Survey, Digital Spectral Library: Version 1:0.2 to 3.0 μm. Open File Report 93-592. Available at: http://speclab.cr.usgs.gov (Accessed March 20, 2021), 1340
Crowley, J. K. (1991). Visible and Near-Infrared (0.4-2.5 μm) Reflectance Spectra of Playa Evaporite Minerals. J. Geophys. Res. 96, 16231–16240. doi:10.1029/91jb01714
Eguchi, R. T., Huyck, C. K., Ghosh, S., and Adams, B. J. (2008). “The Application of Remote Sensing Technologies for Disaster Management,” in Proceedings of the 14th World Conference on Earthquake Engineering, Beijing, China, October 12–17, 2008.
Erol, A. O., and Dhowian, A. W. (1988). Foundation Failures Associated with Dissolution of a Salt Dome at Jazan, SW Saudi Arabia. Case Hist. 25.
Erol, A. O. (1989). Engineering Geological Consideration in Salt Dome Region Surrounded by Sabkha Sediments, Saudi Arabia. Eng. Geol. 26, 215–232. doi:10.1016/0013-7952(89)90010-0
Fatani, M. N., and Khan, A. M. (1993). “Foundations on Salt Bearing Soils of Jazan,” in Proceedings of the Third International Conference on Case Histories in Geotechnical Engineering, St. Louis, MI, United States, June 1–4, 1993 (street Louis, Missouri: University of Missouri--Rolla). June 1–4: Paper No. 1.20.
Ghazali, F. M., Fatani, M. N. Y., and Khan, A. M. (1985). “Geotechnical Properties of Sabkha Soils of Jeddah and Jizan, Saudi Arabia,” in Proceedings of the Second Saudi Engineering Conference, Dahran, Saudi Arabia, November 16–19, 1985 (Dahran), 286–307.
Ghrefat, H. A., Goodell, P. C., Hubbard, B. E., Langford, R. P., and Aldouri, R. E. (2007). Modeling Grain Size Variations of Aeolian gypsum Deposits at White Sands, New Mexico, Using AVIRIS Imagery. Geomorphology 88 (1–2), 57–68. doi:10.1016/j.geomorph.2006.10.013
Grünthal, G. (1998). European Macroseismic Scale. Walferdange, Luxembourg: Centre Européen de Géodynamique et de Séismologie, 15, 99.
GSC (2000). Fast Damage Assessment after Major Disasters by Multitemporal Radar and Optical Analysis. Projet ESA/ESTEC, contract N°. ARCOP 14090. Paris, France.
Howari, F. M., Goodell, P. C., and Miyamoto, S. (2002). Spectral Properties of Salt Crusts Formed on Saline Soils. J. Environ. Qual. 31 (5), 1453–1461. doi:10.2134/jeq2002.1453
Hunt, G. R., Salisbury, J. W., Lenhoff, C. J., and Halides, V. (1972). Visible and Near Infrared Spectra of Minerals and Rocks. V. Halides, phosphates, arseniates, vanadates and borates. Mod. Geology. 3, 121–132.
Hunt, G. R., Salisbury, J. W., and Lenhoff, C. J. (1971). Visible and Near –infrared Spectra of Minerals and Rocks. IV. Sulfides and Sulfates. Mod. Geology. 3, 1–4.
Ibrahim, E., Mogren, S., Qaysi, S., Abdelrahman, K., Ghrefat, H., Zaidi, F., et al. (2021). Red Sea Faulting and Salt Diapirism as a Potential Geotechnical hazard in Jazan, Southwest Saudi Arabia: Inferences from Gravity Data. Nat. Hazards, 1–16. doi:10.1007/s11069-021-04791-w
Johnson, K. S. (2008a). Evaporite-karst Problems and Studies in the United States. Environ. Geology. 53, 981–992. doi:10.1007/s00254-007-0716-8
Johnson, K. S. (2008b). Gypsum-karst Problems in Constructing Dams in the USA. Environ. Geol. 53, 945–950. doi:10.1007/s00254-007-0720-z
Lindberg, J. D., and Smith, M. S. (1973). Reflectance Spectra of gypsum Sand from the White Sands National Monument and basalt from Nearby Lava Flow. Am. Min 58, 1062–1064.
Maurer, T. (2013). How to Pan-Sharpen Images Using the Gram-Schmidt Pan-Sharpen Method‐A Recipe. International Archives of the Photogrammetry, Remote Sensing and Spatial Information Sciences 1, W1.
Moran, E., Brondizio, E., Mausel, P., and Lu, D. (2004). Change Detection Techniques. Int. J. Remote Sens. 25 (12), 2365–2401. doi:10.1080/0143116031000139863
Nikolakopoulos, K. G. (2008). Comparison of Nine Fusion Techniques for Very High Resolution Data. Photogramm. Eng. Remote Sensing 74 (5), 647–659. doi:10.14358/PERS.74.5.647
Pankratz, H. G., Sultan, M., Abdelmohsen, K., Sauck, W. A., Alsefry, S., Alharbi, H., et al. (2021). Use of Geophysical and Radar Interferometric Techniques to Monitor Land Deformation Associated with the Jazan Salt Diapir, Jazan City, Saudi Arabia. Surv. Geophys. 42, 177–200. doi:10.1007/s10712-020-09623-3
Pushparaj, J., and Hegde, A. V. (2017). Evaluation of pan-sharpening methods for spatial and spectral quality. Appl. Geomat. 9 (1), 1–12. doi:10.1007/s12518-016-0179-2
Rathje, E. M., Crawford, M., Woo, K., and Neuenschwander, A. (2005). Damage Patterns from Satellite Images of the 2003 Bam, Iran, Earthquake. Earthq. Spectra 21, 295–307. doi:10.1193/1.2101047
Romanoff, M. (1957). Underground Corrosion, Houston, TX: National Association of Corrosion Engineers (NACE), Originally Issued by the National Bureau of Standards, Circular 579.
Saito, K., Spence, R. J. S., Going, C., and Markus, M. (2004). Using High-Resolution Satellite Images for Post-Earthquake Building Damage Assessment: A Study Following the 26 January 2001 Gujarat Earthquake. Earthq. Spectra 20 (1), 145–169. doi:10.1193/1.1650865
Singh, A. (1989). Review Article Digital Change Detection Techniques Using Remotely-Sensed Data. Int. J. Remote Sensing 10 (6), 989–1003. doi:10.1080/01431168908903939
Sissakian, V. K., Abdul Ahad, A. D., and Hamid, A. T. (2011). Geological Hazards in Iraq, Classification and Geographical Distribution. IBGM 7 (1), 1−28.
Sissakian, V. K., and Abdul Jabbar, M. F. (2009). Remote Sensing Techniques and GIS Applications in Detecting Geohazards in the Jazira Area, West Iraq. IBGM 5, 47–62.
Yamazaki, F., Yano, Y., Matsuoka, M., and Matsuoka, M. (2005). Visual Damage Interpretation of Buildings in Bam City Using QuickBird Images Following the 2003 Bam, Iran, Earthquake. Earthq. Spectra 21, 329–336. doi:10.1193/1.2101807
Youssef, A. M., and Maerz, N. H. (2012). Development, Justification, and Verification of a Rock Fall hazard Rating System. Bull. Eng. Geol. Environ. 71 (1), 171–186. doi:10.1007/s10064-010-0339-2
Keywords: assessment, damage, Jizan, high spatial resolution, salt dome
Citation: Ghrefat H, Hakami A, Ibrahim E, Mogren S, Qaysi S, Abdelrahman K and Zaidi FK (2021) Damage Assessment of a Salt Dome in Jizan, Southwestern Saudi Arabia, Using High Spatial Resolution Remote Sensing Data. Front. Earth Sci. 9:700337. doi: 10.3389/feart.2021.700337
Received: 26 April 2021; Accepted: 22 June 2021;
Published: 08 July 2021.
Edited by:
Maged Marghany, Syiah Kuala University, IndonesiaReviewed by:
Ahmed A Al-Taani, Yarmouk University, JordanFares Howari, Zayed University, United Arab Emirates
Copyright © 2021 Ghrefat, Hakami, Ibrahim, Mogren, Qaysi, Abdelrahman and Zaidi. This is an open-access article distributed under the terms of the Creative Commons Attribution License (CC BY). The use, distribution or reproduction in other forums is permitted, provided the original author(s) and the copyright owner(s) are credited and that the original publication in this journal is cited, in accordance with accepted academic practice. No use, distribution or reproduction is permitted which does not comply with these terms.
*Correspondence: Habes Ghrefat, aGFiZXNAa3N1LmVkdS5zYQ==