 Sotirios A. Mallios1*
 Georgios Papangelis1George Hloupis2
 Athanasios Papaioannou1
 Vasiliki Daskalopoulou1,3Vassilis Amiridis1
- 1National Observatory of Athens (IAASARS), Athens, Greece
- 2Department of Surveying and GeoInformatics Engineering, Faculty of Engineering, University of West Attica, Athens, Greece
- 3Department of Physics, Faculty of Astrophysics and Space Physics, University of Crete, Heraklion, Greece
The attachment of positive and negative ions to settling spherical dust particles is studied. A novel 1D numerical model has been developed to parameterize the charging process in the presence of a large-scale electric field. The model is able to self-consistently calculate the modification of atmospheric ion densities in the presence of the dust particles, and the consequent alteration of the atmospheric electrical conductivity and the large-scale electric field. Moreover, the model estimates the acquired electrical charge on the dust particles and calculates the electrical force that is applied on them. Using observed dust size distributions, we find that the particles can acquire electrical charge in the range of 1–1,000 elementary charges depending on their size and number density. The particles become mainly negatively charged, but under specific conditions giant mode particles (larger than 50 μm radius) can be positive. Moreover, the large-scale electric field can increase up to 20 times as much as the fair weather value. However, our approach shows that the resultant electrical force is not enough to significantly influence their gravitational settling, as the ratio between the electrical force magnitude and the gravity magnitude does not exceed the value of 0.01. This indicates that the process of ion attachment alone is not sufficient to create strong electrical effects for the modification of particle dynamics. Therefore, other processes, such as the triboelectric effect and updrafts, must be included in the model to fully represent the impact of electricity on particle dynamics.
1 Introduction
Mineral dust plays an important role in the Earth’s atmosphere, and in the Earth System in total. It significantly impacts radiation (Li et al., 2004), as dust particles absorb shortwave and long-wave radiations, potentially causing a net atmospheric warming (Kok et al., 2017). Moreover, mineral dust interacts with liquid or ice clouds, modifying their optical properties and lifetimes (DeMott et al., 2003), and affecting the precipitation processes (Creamean et al., 2013). Finally, the lifetime of the mineral dust particles affects the deposition fluxes over land and ocean (van der Does et al., 2018). Once dust particles are deposited at the surface, they provide micro nutrients to the ocean or to land ecosystems (e.g., Jickells et al., 2005).
All aforementioned processes are strongly affected by the dust Particle Size Distribution (PSD). The dust PSD changes rapidly after emission since the preferential gravitational settling quickly removes the larger particles. However, Earth System Models and transport models fail to properly simulate dust deposition. There have been comparisons of model simulation against measurements, that show a consistent overestimation of large particle removal (e.g., Ginoux et al., 2001; Colarco et al., 2002). On the other hand, dust model inter-comparison by Huneeus et al. (2011) found that, the model estimates of deposition vary over a large range, yet mainly underestimating the observations. Adebiyi and Kok (2020) showed that the mass of coarse dust (Diameter ≥5 μm) in the atmosphere is about four times greater than the simulated in current climate models, resulting in greater total dust mass load. This signifies the importance of proper modeling of the mineral dust deposition.
The conclusion that climate models underestimate the coarse mode dust in the atmosphere, is consistent with observations. Denjean et al. (2016) showed that the effective diameter of the Saharan dust coarse mode does not vary with dust age over the Mediterranean for transport times between 1.5 and 7 days. This conclusion has been drawn by consolidating high-quality aircraft measurements of dust PSDs performed during the last years in the framework of few large-scale experimental campaigns (Ryder et al., 2013a; Ryder et al., 2013b; Ryder et al., 2018; Ryder et al., 2019). Weinzierl et al. (2017) presented results of aircraft and ground-based measurements during the SALTRACE campaign in the tropical Atlantic in 2013/2014. Particles with sizes in the range of 10–30 μm were detected over Barbados, during a Langrangian flight sequence from Cape Verde, far beyond the Stokes gravitational settling expectations. Similar conclusions were also validated by deposition of giant particles (size greater than 75 μm), as depicted by samplers mounted on moored dust-collecting surface buoys, located in the Atlantic Ocean at 2,400 and 3,500 km from the west African coast (van der Does et al., 2018). These collected dust particles were mostly well-rounded quartz particles up to 450 μm in polar diameter, with what appeared to be high aspect ratios. Moreover, Goudie and Middleton (2001) reported that particles larger than 62.5 μm are commonly carried from Sahara to the British Isles.
van der Does et al. (2018) discussed four potential different mechanisms that could facilitate long-range transport of large/giant particles. These mechanisms are: 1) strong winds causing fast horizontal transport, 2) strong turbulence keeping particles in suspension for longer time (Garcia-Carreras et al., 2015), 3) electrical forces that balance the gravitational force (Nicoll et al., 2010; Renard et al., 2018; Toth et al., 2020), and 4) the presence of thunderstorms or tropical cyclones that can create strong uplifts. Additionally, the particle shape and orientation can also influence the dust particle transport time (Huang et al., 2020; Mallios et al., 2020; Mallios et al., 2021b). Specifically, Mallios et al. (2020, 2021b) showed that simulating dust particles as prolate spheroids, they can remain much longer in the atmosphere than their spherical counterparts, and that the particle vertical orientation can increase the residual time in the atmosphere significantly, compared to the horizontal one. Vertical orientation becomes possible in the presence of external large scale electric fields of strength in the order of 104 V/m (two orders of magnitude greater than the fair weather electric field values) (Mallios et al., 2021a).
The field of Atmospheric Electricity research can provide insights on the electrical processes and their contribution to the transport of dust plumes. The Earth’s atmosphere is a conducting medium, attributed to the presence of ions, created by ionization by galactic cosmic rays radiation. Ions attach to dust particles through the processes of ionic diffusion and Coulomb interaction (Gunn, 1954; Klett, 1971) and the polarization due to the presence of an external electric field (Gunn, 1956; Klett, 1971), leading to their subsequent charging (Zhou and Tinsley, 2007; Zhou and Tinsley, 2012). This large scale electric field is created by the potential difference between the lower part of the ionosphere and the Earth’s surface (Rycroft et al., 2008), and is modified by the ion density reduction caused by the ion attachment process, which leads to the electrical conductivity reduction and the atmospheric columnar resistance enhancement (Zhou and Tinsley, 2007; Baumgaertner et al., 2014). Moreover, the dust particles can be also charged during collisions, a mechanism known as triboelectric process (Kamra, 1972; Eden and Vonnegut, 1973), that results in large particle being predominantly positively charged and small particles negatively (e.g. Zhao et al., 2002; Lacks et al., 2008; Shinbrot and Herrmann, 2008; Merrison, 2012). This size preferential polarity acquisition in combination with updrafts or shape induced gravitational sorting (Yang et al., 2013; Mallios et al., 2020; Mallios et al., 2021b), can create charge separation that further enhances the electric field magnitude, similarly to processes that take place in thunderstorms (e.g., Chiu, 1978; Helsdon et al., 2002; Williams and Yair, 2006, and references therein).
Motivated by the studies of dust particle electrification and charging, we focus on dust charging due to ion attachment process and we develop an 1D numerical model for the of spherical dust particle settling in the presence of a large scale electric field. The model is able to calculate self consistently the modification of the atmospheric ion densities in the presence of the dust particles, and the consequent alteration of the atmospheric electrical conductivity and the large scale electric field. Moreover, it is able to evaluate the acquired electrical charge on the dust particles, and thus to calculate the electrical force that is applied on them. Finally, the effect of the electrical force on the gravitational settling and the terminal velocity is quantified.
In Section 2, the mathematical formulation of the model is presented and explained. In Section 3, results of the model under different conditions are presented and discussed. Finally, in Section 4 the results of this work are summarized.
2 Materials and Methods
2.1 System Dynamics
The bottom (z = 0 km, Earth’s surface) and the top (z = 40 km) boundaries are assumed to be perfect conductors of electricity. Although the lower part of the ionosphere is typically at ∼70–80 km (e.g., Rycroft et al., 2008), the perfectly conducting boundary can be placed at 40 km (for simulation purposes), since the electric field at this altitude is mainly vertical, regardless of the electrical activity at altitudes below 12 km (Pasko et al., 1997). Increasing the upper boundary altitude to 50 km, the relative difference between the results in the area of interest (up to 12 km altitude) is less than 1%. The electrical potential at the bottom boundary is set equal to 0 V, while at the top boundary is set to 250 kV, which can be seen as the average potential along the ionosphere (Rycroft et al., 2000).
In the region under investigation, the ion conductivity is dominant over the electron conductivity, as electron number density exceeds the bipolar ion number densities at altitudes above ∼60 km (Pasko et al., 1997). Therefore, the particle types that are considered in the presented formalism are the atmospheric small ions, and the dust particles in terms of atmospheric aerosol content.
As a first approximation in order to highlight the possible physical mechanisms, we neglect the wind speed, and we consider the atmosphere to be stagnant, which denotes to the particle velocity with respect to the air being the same with the particle velocity with respect to an observer at the ground,
The continuity equation for positive and negative small ion number densities, n±, is:
where μ± are the positive and negative small ion electrical mobilities,
The current continuity equation for the charge transport of dust particles with radius ri is:
where ρp,i is the dust particle charge density,
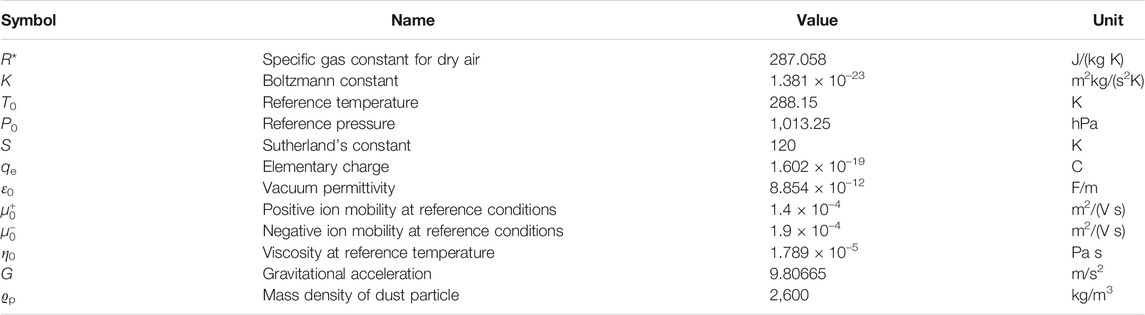
TABLE 1. Physical constant values.
The continuity equation for the transport of number densities, Np,i, that correspond to dust particles with radius ri, is:
where the terms in brackets are the dust particle flux due to the advection/settling and the diffusion.
Eqs. 2, 3 have the same particle velocities, and the same particle diffusion coefficients, since they refer to different properties of the same particle. The particle charge density and the particle number density are related through the expression ρp,i = qp,iNp,i, with qp,i being the particle net charge. These three quantities vary over time, but different equations govern their variation. The linkages between their temporal and spatial variations, are the common velocity and diffusion coefficient.
Finally, the large scale electric field,
Although Eqs. 1–4 are generic, in this work we shall focus on the 1D case, in the vertical direction along the altitude. Applicability of the model can be easily extended to other types of aerosols that can be simulated by spherical shapes and act as good conductors of electricity.
Substituting
The simulation domain is divided in 2049 mesh points, and increasing further their number by a factor of two leads to a relative difference less than 5% between the results. The results obtained with the aforementioned approach and the given mesh points, are very close (relative difference less than 2%) to the results obtained with a first order upwind scheme (Press et al., 1992, p. 834) with 8,192 mesh points. This shows that the used scheme is indeed less diffusive than a first order upwind scheme under the same conditions, and also that the averaging of two schemes can be a valid procedure. After all, the principle of a weighted average between a stable but diffusive low order scheme with an unstable but less diffusive higher order scheme is the core of the FTC schemes (Zalesak, 1979). The FMG algorithm ensures fast convergence of the Poisson equation solution, when the number of mesh points becomes very large (as in our case) (Press et al., 1992, p. 871).
2.2 Meteorological Conditions
The U.S. Standard Atmosphere 1976 (NOAA/NASA/USAF, 1976) is considered as the standard static atmospheric model, and the vertical distributions of pressure, P, and temperature, T, are constant over time (Figure 1). The air mass density, ϱair, at a given altitude can be calculated from pressure and temperature, provided that the atmosphere is an ideal gas:
where R* is the specific gas constant for dry air.
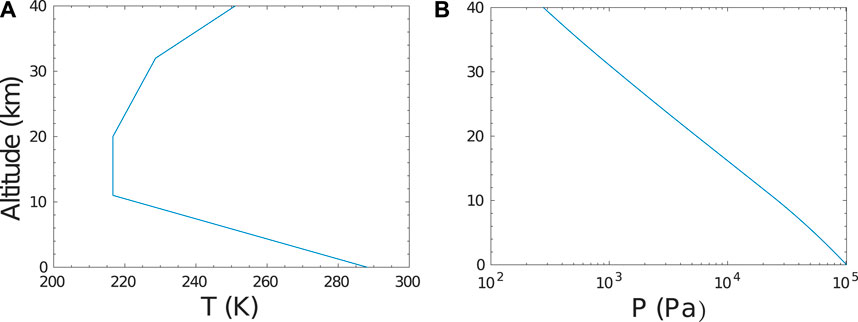
FIGURE 1. Vertical distribution of the meteorological parameters in SATP: (A) temperature T, and (B) pressure P.
2.3 Ionization Rate
There are three mechanisms that create the atmospheric ions (Tinsley and Zhou, 2006, and references therein): 1) ionization by natural radioactivity originating in the ground, including direct α, β, and γ radiation from the surface layers and dust aerosol, and radiation from radioactive gases (principally 222 Rn but also 220 Rn) and daughter products that are carried up into the troposphere by vertical convection. 2) In the troposphere the dominant ionization mechanism is the flux of galactic cosmic rays (GCR). This does not apply in polar and subpolar regions, where the ionization due to solar energetic particles is important (Mishev, 2013). 3) In the stratosphere there are additional ion pair sources such as the flux of relativistic electrons (of a few MeV energy) precipitated from the radiation belts and peaking at subauroral latitudes, and the solar energetic particle events (mainly protons) in the polar and subpolar regions (Mishev, 2013).
In the current study the ionization rate as formulated by Tinsley and Zhou (2006) is adopted with two simplifications. The first is to neglect the natural radioactivity effect originating in the ground. This leads to a cruder but smoother vertical profile of the ion densities and the electrical conductivity along the altitude. Moreover, such a choice eliminates the variation of the ionization rate between continental and marine areas (as we show in Section 2.10), and thus the only dependence that is left is on the geomagnetic latitude. This leads to an approximation of the ionization rate which is more suitable for highlighting the mechanism of the particle-ions interactions, which is the focus of the work, and interpreting the obtained results.
The second simplification is the creation of a generic temporal ionization rate profile, by averaging the solar minimum and solar maximum profiles given in the aforementioned work, leading to a profile independent of the solar cycle. This resulting empirical profile, although admittedly simple, is suitable since it serves as the baseline approach for the investigation of the ionization rate distribution effects on the ion density and, consequently, the atmospheric electrical conductivity distribution. Indeed, for in depth analysis more detailed profiles would be a better representation, regarding e.g. the annual variation, however, this goes beyond the scope of the paper at hand.
The mathematical formalism for the ionization rate, q, is listed in Table 2. The quantities qi and zi that depend on the geomagnetic latitude, and are used in the formulas, are plotted in Figure 2.
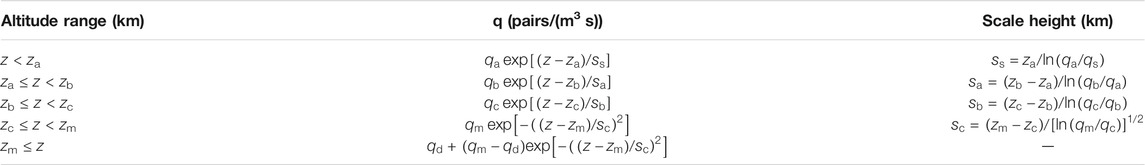
TABLE 2. Interpolation formulas and their scale heights for ionization rates, q.
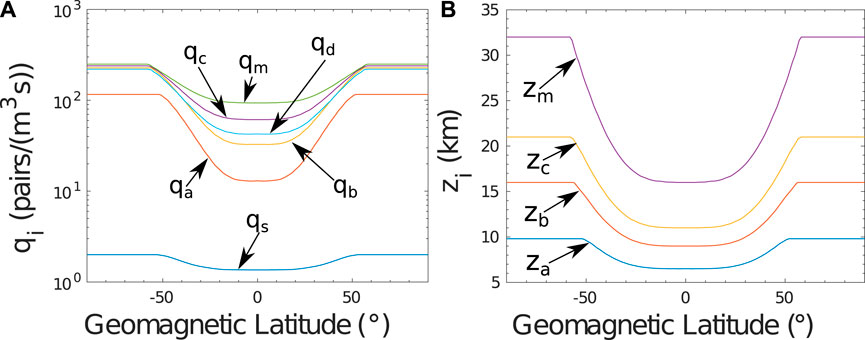
FIGURE 2. Quantities used in the interpolation formulas for the ionization rate calculation, as functions of the geomagnetic latitude: (A)q, and (B)zi.
2.4 Recombination Rate
The ion-ion recombination rate, a, is derived by fitting the values of Bates (1982).
where [M] is the concentration of air molecules in units of 2.69 × 1019 cm−3.
In the case of US Standard Atmosphere, [M] in units of m−3 can be calculated as:
where P is the pressure, k is the Boltzmann constant, and T is the temperature.
2.5 Ionic Electrical Mobilities
The ion electrical mobilities μ± are scaled along the altitude as (Zhou and Tinsley, 2007):
where
2.6 Diffusion Coefficients
The positive and negative small ion diffusion coefficient,
The diffusion coefficient for dust particles of radius ri, Dp,i, is given by the Einstein’s relation:
where μm,i is the mechanical mobility, given by the Cunningham-Knudsen-Weber-Millikan equation (e.g., Tammet, 1995), η is the air dynamic viscosity, and Cc is the slip correction factor.
The dynamic viscosity, η, is scaled along the altitude according to Sutherland’s model (e.g., Zhou and Tinsley, 2007, and references therein):
where η0 is the viscosity at reference temperature T0.
The slip correction factor is adopted by Davies (1945) as:
where l is the mean free path in air that is given by the expression (Jennings, 1988):
2.7 Particle Velocity
The magnitude of the velocity, vp,i, of a particle with radius ri at any time point is calculated by solving the Newton’s second law of motion:
where mp,i is the particle mass,
In 1D case, and assuming the positive direction to be upwards, Eq. 14 becomes:
with mp,i being the particle mass:
and ϱp being the mass density of a dust particle.
When the electric force, qp,iE, is positive (negative charge in a downward pointing electric field, or positive charge in an upward pointing electric field) and greater than gravity, mp,i, the particle moves upwards (positive velocity or acceleration) and the drag force is negative pointing downwards in the same direction as gravity (Figure 3A). When the electric force is positive but less than gravity, the particle moves downwards (negative velocity or acceleration) and the drag force points upwards (Figure 3B). Finally, in the case of negative electric force (negative charge in an upward pointing electric field, or positive charge in a downward pointing electric field), the particle moves downwards, and the drag force points upwards (Figure 3C).
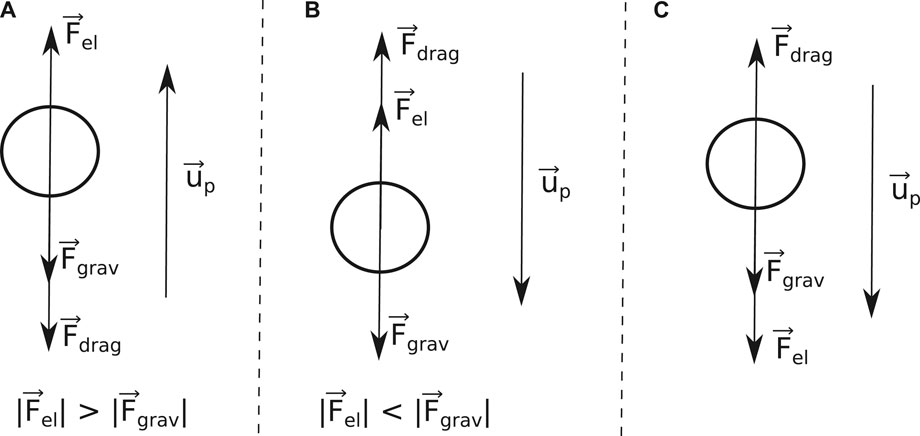
FIGURE 3. Motion of charged sphere in homogeneous electric and gravitational fields: (A) upward motion, (B) and (C) downward motion.
The magnitude of the drag force is:
where Ap,i is the projected area of the assumed spherical dust particle, and Cd is the drag coefficient, adopted by Clift and Gauvin (1971):
with Re being the Reynolds number, defined as:
It is noted that in both Eqs. 17, 19 the magnitude of the particle velocity vp,i is used. According to the definition of the Reynolds number and the drag force, the magnitude of the particle velocity with respect to the air is needed. Since in our analysis we neglect the effects of the wind, and therefore the wind speed is set to zero, the velocity of the particle with respect to an observer at the ground, vp,i, is the same as the velocity of the particle with respect to the air.
The choice of Eq. 18 as an expression for the drag coefficient comes from the fact that it is valid for Reynolds numbers up to 105, allowing the study of very large particles. Moreover, it is within 6% of experimental measurements (Clift et al., 2005). Additionally, it has been shown by Mallios et al. (2020) that, Eq. 18 compared to the drag coefficient derived by Proudman and Pearson (1957), which is the most accurate analytical expression for Re < 0.1, gives a relative error less than 2%. Finally, it is noted that since the slip correction factor, Cc, has been introduced for the correction of the Stokes law (and therefore it is valid only in the Stokes region), it appears in Eq. 17 only in the case of Re < 0.1 (Mallios et al., 2020).
Finally, in order us to avoid very small time steps for the solution of Eq. 15, that will lead to large simulation times, we apply the following procedure for the calculation of the particle velocity, vp,i. The time step of the simulation is calculated based on the processes of Eqs. 1–3. Eq. 15 is discretized as:
where Fdrag is calculated using the velocity at time point t,
If
using the Brent’s method (Press et al., 1992, p. 359).
In the case that
2.8 Ion Attachment Rates
For the quantification of ion attachment to dust particles, the particles are assumed perfect electrical conductors (Fuks, 1958, p. 81).
2.8.1 Continuum Regime
The formulation of the attachment rates that is adopted in this work, is valid in the continuum regime. This means that the ionic mean free path,
where < v >± is the average thermal velocity, and m± is the mass of positive and negative ions respectively, the continuum regime is defined for KnD < 1.
The ionic mass, m±, can be correlated with the ion electrical mobility,
where m± are given in kg. It is noted that the mean absolute error of Eq. 23 is 6.8%, and of Eq. 24 is 6.3% (both less than 10%). Although these errors are larger than the mean absolute error of the expression derived by Tammet (1995), which does not exceed the value of 2%, they are much simpler to use and can be seen as a very good compromise between simplicity and accuracy.
Using the adopted values of
2.8.2 Physical Mechanisms
According to the field–diffusion theory, two major mechanisms act simultaneously for the ion attachment to particles. The first is the diffusion to the particle surface, and the second is the conduction in the electric field (Helsdon et al., 2002). The electric field is the superposition of the external large scale electric field, the induced dipole electric field, and the electric field due to charges on the particle (Lawless, 1996). In the presence of bipolar ion, particle charge approaches a steady-state level as charging time increases (Fjeld and McFarland, 1989). Gauntt et al. (1984) showed that neither the diffusion nor the field approximation alone evaluate correctly the steady state particle charge in the case of
2.8.3 Stationary Particles
In the case of stationary particles, the diffusion approximation is obtained by neglecting the effect of the external electric field on the particle and on the ion transport, while retaining the effect of the particle charge (Fjeld and McFarland, 1989). The total rate per unit volume of positive and negative ion loss due to their attachment to dust particles of radius ri, and number density Np,i is (Gunn, 1954):
Φs is called self potential and indicates the influence of the particle charge to the diffusion current that flows to the particle. When Φs < 1, the thermal energy of the ions, kT/qe, is larger than the electric potential energy of the particle due to its charge. This means that ion diffusion dominates and the ion mobilities are the important factors that determine the type and the number of the ions that attach to the particle. When Φs > 1, the surface electric field magnitude of the particle is larger than the ion thermal energy, and the ion drift in the presence of the particle surface electric field dominates. In the limit that Φs ≪ 1, Eq. 25 becomes:
The field approximation is obtained by neglecting diffusion, and calculating the charging rate from the transport of ions along the electric field lines to the surface of the particle (Fjeld and McFarland, 1989). The electrical forces due to the images of the ions with respect to the conducting particles have been neglected, because as has been shown by Marlow and Brock (1975), their effect is not important in the continuum regime. The total rate per unit volume of positive and negative ion loss due to their attachment to dust particles of radius ri, and number density Np,i is (Gunn, 1956):
where
Several approaches have been proposed in the past for the superposition of these two mechanisms, both in theoretical and model simulation basis. Several theoretical expressions that combine the mechanisms or that numerically solve the field-diffusion problem have been proposed in the past (Klett, 1971; Smith and McDonald, 1975; Liu and Kapadia, 1978; Fjeld et al., 1983; Wang, 1983; Fjeld and McFarland, 1989; Lawless, 1996). Unfortunately, these expressions cannot be easily expanded to other cases such as moving particles, or different shapes, because they contain parts of approximate solutions that restrict the generalization. Moreover, some of them have convergence difficulties, or are valid in cases and conditions that are not commonly used (Lawless, 1996). On the other hand, a simple superposition of Eq. 27 with Eqs. 28, 29 (Chiu, 1978) or Eq. 25 with Eqs. 28, 29 (Helsdon et al., 2002), although not rigorous, offers the flexibility of generalization, because each individual charging mechanism has been studied extensively on a broad spectrum of applications.
The disadvantage of the superposition used by Chiu (1978) is that, in the case that
Long and Yao (2010) presented an evaluation of nine different particle charging models based on existing experimental results. One of the conclusions was that the field-diffusion combined model developed by Lawless (1996) should be the first choice relatively for numerical models of the particle dynamics. Since this model is shown to be the most preferable in terms of the theoretical consideration, accuracy and computational time, we use it as a reference for comparison with our proposed superposition (Eqs. 30, 31). The results are shown in Figure 4, where the attachment rates for positive ions, β+, are plotted as a function of particle charge, for different values of external electric field (the same conclusions are derived for the negative ions attachment rates). In Eqs. 25, 27–31 as attachment rate, β± (with units 1/s), the expression in the right hand side that is multiplied with the appropriate ion number density, n±, is defined (leading to an expression of the form
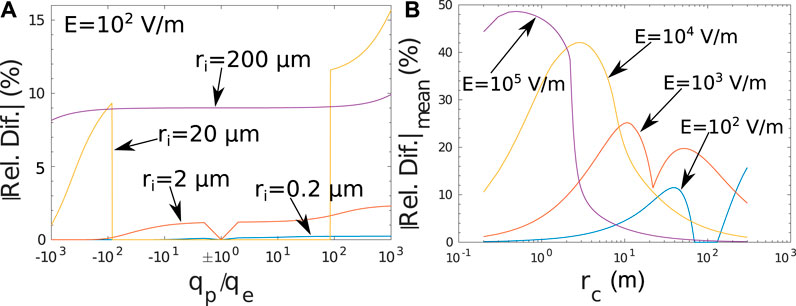
FIGURE 4. Comparison between Eq. 30 and formulation by Lawless (1996): (A) Relative difference as a function of normalized particle charge, for different particle radii, in the presence of external electric field with magnitude 102 V/m, and (B) mean relative difference for a range of particle charges −1,000 to 1,000 elementary charges, as a function of particle radius, in the presence of external field with various magnitudes.
Figure 4A shows the relative difference as a function of normalized particle charge, for different particle radii, in the presence of external electric field with magnitude 102 V/m. For ri = 0.2 μm the mean relative difference in the studied range of the particle charge is 0.12 %. For ri = 2 μm it is 1.08 %, for ri = 20 μm it is 8.09 %, and for ri = 200 μm it is 9.02 %.
The maximum particle charge is chosen to be 1,000 elementary charges, which is in the same order of magnitude with the charge derived from the charge density measured by Kamra (1972), and assuming particle density equal to 108 particles/m3, which is the annual mean of the lower limit of aerosol concentration over oceans (Tinsley and Zhou, 2006). The specific measurement was conducted over dust devils, which is an extreme phenomenon compared to the regular dust transport (in such conditions Nicoll et al. (2010) measured three orders of magnitude lower charge density) and the particle density is at the lower limit of particle densities observed in detached dust layers. For larger particle densities, keeping the charge density the same, the individual particle charge decreases. Therefore, the 1,000 elementary charges per particle can be used as an upper limit for the particle charge.
Figure 4B shows the mean relative difference for a range of particle charges −1,000 to 1,000 elementary charges, as a function of particle radius, in the presence of external field with various magnitudes. The mean relative difference does not exceed the value of 50 % for a range of electric field magnitudes from 0 to 105 V/m. Therefore, the proposed superposition of Eqs. 30, 31 can be considered as physically reasonable, and although they are not strict analytical solutions of the ion transport equation that describes the ion attachment process, they can be used in numerical models to describe adequately the effects of the ion attachment to particles.
The maximum electric field magnitude in Figure 4B is chosen to be in the order of magnitude of observed electric field values right before a lightning flash (e.g., Marshall et al., 2005; Stolzenburg et al., 2007). Regarding dust layers transported for days in the Earth’s atmosphere, away from the emission source, no case of lightning discharge has been reported, indicating that, in these cases, the value of 105 V/m is unlikely to be reached or exceeded. Thus, it can be used as an upper limit of the electric field magnitude. On the other hand, in cases of dust storms or dust devils that occur on Earth (or other planets, e.g., Mars) and in the vicinity of the emission source, the value of 105 V/m (or the equivalent electric field threshold on that planet) can be reached. This can happen due to the intense electrification caused by the triboelectric effect, which is the dominant electrification mechanism during the emission of dust particles in the atmosphere, and the large scale charge separation caused by the strong updrafts (Krauss et al., 2003). A short review on the electrification of dust storms and on the resultant electric field strengths has been made by Riousset et al. (2020). When the electric field threshold is reached, or exceeded, a discharge occurs, leading to a decrease of the electric field magnitude. Therefore, 105 V/m acts again as an upper limit of the electric field magnitude.
2.8.4 Moving Particles
Eqs. 30, 31 can be easily transformed in the case of moving particles. According to Gunn (1954), the diffusion approximation for moving particles leads to the following expression for the total rate per unit volume of positive and negative ion loss:
where the term
The coefficient F is an experimentally derived coefficient to match the theoretical results with actual measurements. It depends on the detailed air flow over the spherical particle, and can be described as a fitting function of the Reynolds number, Re, based on measurements by Kinzer and Gunn (1951) as:
The field approximation for moving particles has been studied by Whipple and Chalmers (1944), based on the theory of charge acquisition by particles falling through a region containing ions proposed by Wilson (1929). The total rate per unit volume of positive and negative ion loss is:
where
Although Eqs 36, 37 have been derived under the stream-line flow assumption, it has been discussed by Whipple and Chalmers (1944) that the provided formalism is appropriate even in turbulent environments. As a matter of fact, Gott (1936) gives experimental evidence to show that turbulence does not affect the general validity of Wilson’s theory.
A superposition similar to Eqs 30, 31 leads to the following expression for the combined diffusion-field theory approximation in the case of moving spherical particles:
2.9 Dust Particle Number Density Distribution
Several aircraft campaigns over recent years have attempted to measure the properties of Saharan mineral dust. Ryder et al. (2018) and Weinzierl et al. (2017) provide lists of the major aircraft campaigns with a focus on in-situ dust measurements. In the current work, we use the mean size distribution between altitudes of 1–6 km at STP, measured by Ryder et al. (2013b) during the Fennec 2011 aircraft campaign at Mauritania and Mali, since they represent measurements very close to the dust particle emission sources (Figure 5A).
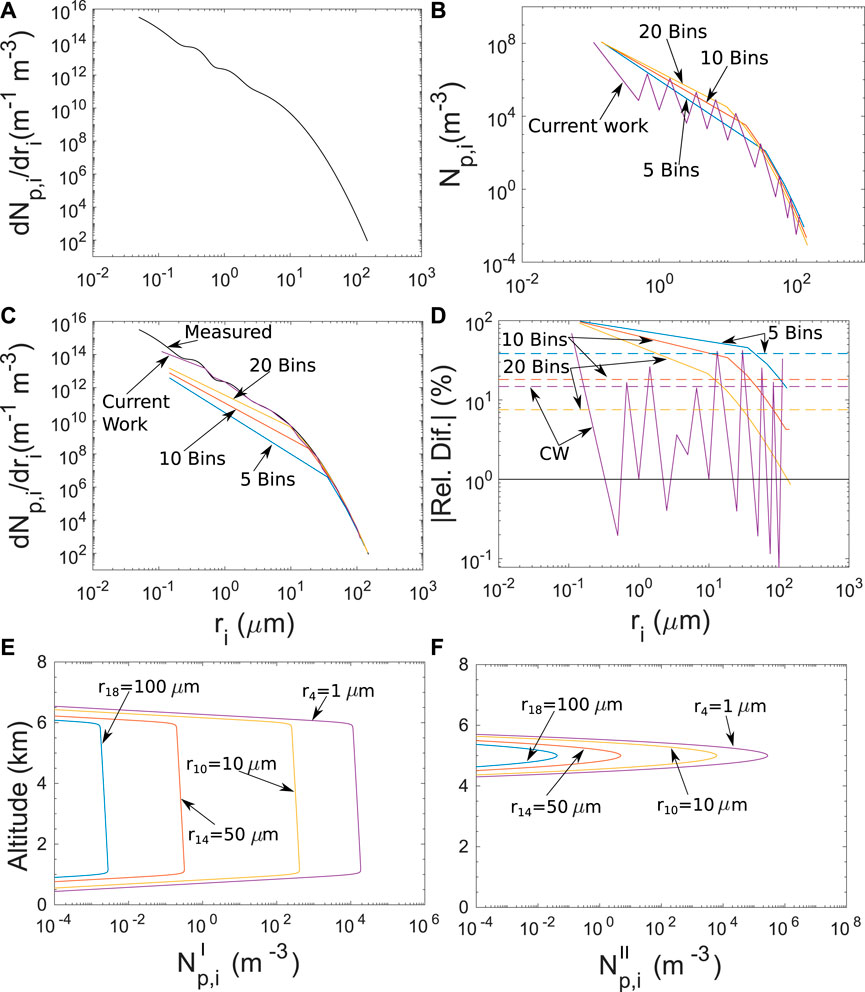
FIGURE 5. Particle number density distributions: (A) measured mean normalized number density distribution by Ryder et al. (2013b), (B) number density distribution for different binnings, (C) reconstructed normalized number density distributions, (D) relative difference between the reconstructed normalized number density distributions and the measured one, with dashed lines being the average values, (E)
2.9.1 Size Bins Apportionment
The PSD discretization is of high importance for the correctness of the results. The number of bins, along with the size of each bin, must ensure that the initial measured distribution is properly introduced to the model without significant loss of information, deformation, or non convergence of the final results.
The adopted size distribution is discretized using 19 bins, listed in Table 3. Figure 5B provides the representation of the discretized number density distribution from Fennec, using the aforementioned binning, along with 5, 10, 20 equilateral bins, respectively. Figure 5C shows a comparison between the measured distribution, with the reconstructed ones from the different types of binning. It becomes apparent that as the number of the equilateral bins increases, the initial distribution is better approximated. Nevertheless, a significantly large number of bins is required for the proper approximation of the whole range of the distribution (judging from the slow convergence at the small particles, more than 40). On the other hand, the adopted binning of the current work approximates very well a wider range of the initial distribution using a fairly small number of bins (19 bins). Furthermore, Figure 5D illustrates the relative difference between the reconstructed distributions and the initial one. As the number of bins increases and their length becomes much smaller than the mean radius of each bin, the relative difference with the original distribution decreases.
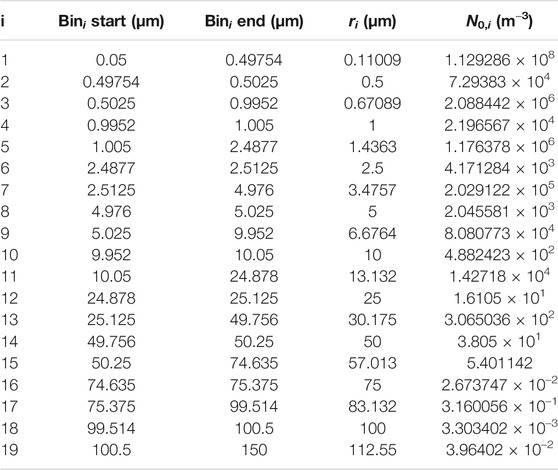
TABLE 3. Discretization bins of the size distribution.
For the current work binning, the agreement becomes ∼1% for the narrow bins, while for the larger bins the relative difference increases to values comparable to other types of binning. Moreover, the relative difference is better distributed in a wider range of particle radii. Therefore, it is proven that the adopted binning leads to a better introduction of the initial distribution to the model, especially the bins that have length less than 1% of the mean radius (even numbered bins). In the Results section, we demonstrate that the electrical properties, calculated using the adopted binning, are the convergence limits of the values obtained by increasing the number of equilateral bins.
2.9.2 Spatial Particle Number Density Distribution
The dust particles are introduced in the simulation domain using two different spatial distributions. The first one is a rectangular distribution of the form (Figure 5E):
where
The second is a Gaussian distribution, mathematically expressed as (Figure 5F):
where hII = 5,000 m is the altitude of the distribution center, and
The number density distribution
2.10 Initial Fair Weather Electrical Conditions
At t = 0 s all the dust particle bins are placed in the simulation domain, under fair weather conditions and are left to evolve under the influence of gravity, the electrical and drag forces. The initial fair weather electrical conditions are obtained by solving Eqs 1, 4 in the absence of dust particles, until steady state is reached. By doing that, the ambient fair weather ion densities,
Since the ionization rate, q, which is the source of atmospheric ions, depends on the geomagnetic latitude, and therefore the latitude and longitude, three different locations have been chosen for the calculation of the fair weather electrical conditions, and the study of their spatial variation. These are: 1) Mauritania (MR, 24.316°, −10.962°), 2) Cape Verde (CV, 16°, −24°), and 3) Barbados (BB, 13.167°, −59.33°). The three locations have been chosen because they belong to the route of the transatlantic transport of Saharan dust from Africa to Caribbean (Weinzierl et al., 2017; van der Does et al., 2018).
Figure 6 shows a comparison between the initial fair weather electrical conditions of the aforementioned locations. Figures 6A,B show that the ionization rate in Cape Verde and in Barbados is practically the same, with the relative difference being less than 1%, leading to the same fair weather electrical conditions.
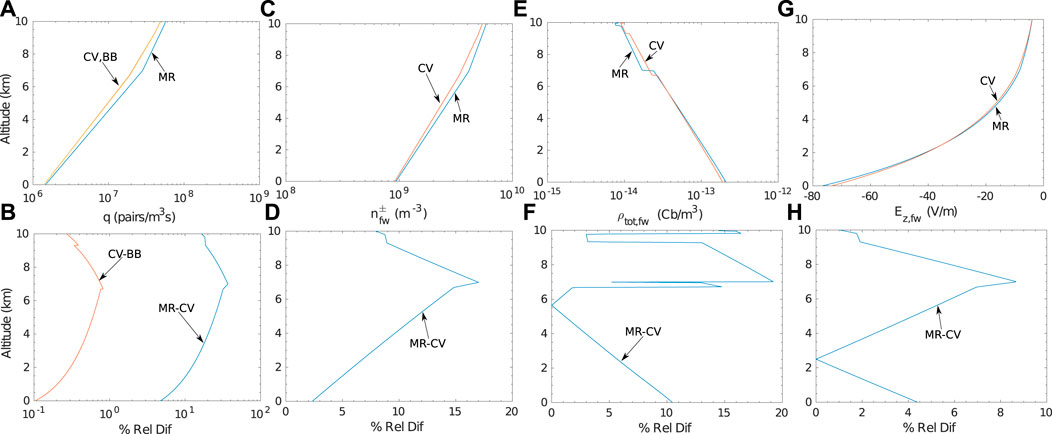
FIGURE 6. Initial fair weather conditions in Mauritania (MR), Cape Verde (CV), and Barbados (BB): (A) ionization rates, (B) Relative difference between ionization rates, (C) fair weather ion densities, (D) relative difference between fair weather ion densities, (E) fair weather total charge densities, (F) relative difference between fair weather total charge densities, (G) fair weather electric field magnitudes, (H) relative difference between fair weather electric field magnitudes.
On the other hand the ionization rate in Mauritania is higher, and can reach a maximum relative difference value of 40% compared with the ionization rate in Cape Verde. Regardless this significant difference in the ionization rates, the relative differences in the fair weather ion densities (Figures 6C,D) and the fair weather total charge densities (Figures 6E,F) do not exceed the value of 20%. At this point we note that the small difference between the positive and negative ion densities allows only one field to be graphed in Figure 6C. In the case of the fair weather electric field, the relative difference is even smaller, and does not exceed the value of 10% (Figures 6G,H). Therefore, the ionization rate dependence, solely, on the geomagnetic latitude does not create significant variations of the initial fair weather electrical conditions along the transatlantic transport of the dust particles. This means that, for the given simplistic ionization rate formulation it does not make a difference on the choice of the reference location between Mauritania and Barbados. In the simulation results presented in the current work, the fair weather electrical conditions of Mauritania are used as initial electrical conditions, because this location is closer to the measured dust particle size distribution that is used in the model. At this point we want to emphasize that, in reality there are additional spatial and temporal variation of the ionization rate that for the sake of simplicity have been omitted, which will lead to larger fair weather conditions differences along the transatlantic passage than the ones presented here, and their impact on the electrical evolution of the dust particles are planned to be studied in future work using a higher dimension model.
3 Results-Discussion
3.1 Particle Charging and Electrical Force
Figure 7 shows the time dynamics of the electrical properties of Bin18 (particles with radius, r = 100 μm), as well as the ambient conductivity and the large scale electric field magnitude. The ambient conductivity, σ, decreases, because the atmospheric ions attach to the total number of particles regardless their size, leading to a reduction of the ionic densities (Figure 7A). The conductivity reduction within the dust layer results in an increase of the columnar resistance, and a decrease in the conduction current at the ground (Baumgaertner et al., 2014). Since the conductivity at the ground does not change from the fair weather value, the electric field magnitude, depicted in Figure 7B, decreases to reflect the reduction in the conduction current (Daskalopoulou et al., 2021). On the other hand, as the system evolves towards the steady state, the conduction current Jz = σEz tends to become constant along the altitude, and therefore when the conductivity decreases the electric field magnitude increases (Figure 7B).
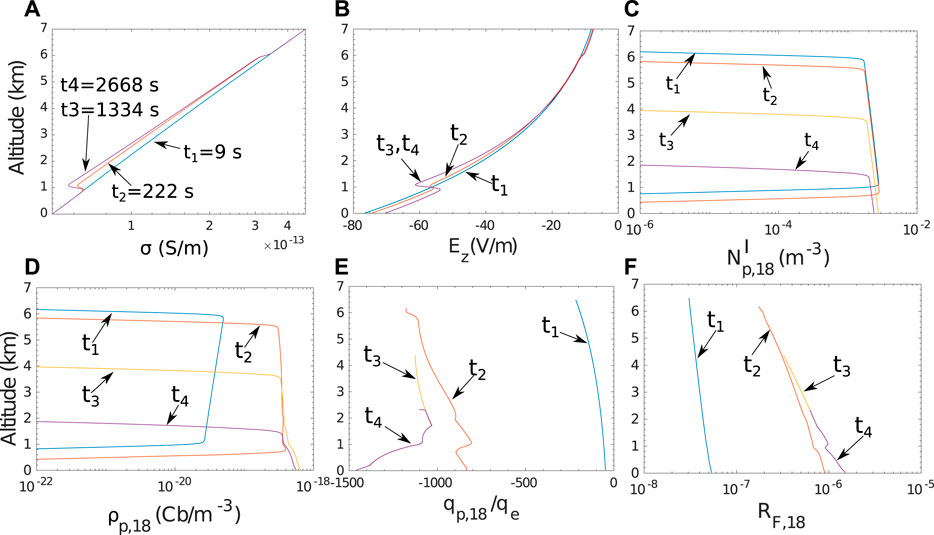
FIGURE 7. Time dynamics of electrical properties of Bin18 (r = 100 μm): (A) Atmospheric conductivity, (B) large scale electric field magnitude, (C) particle number density, (D) particle charge density, (E) number of elementary charges per particle, (F) ratio between the electrical force and the gravity.
At time t4 = 2,668 s, more than 70% of the Bin18 particles have vanished (Figure 7C). As these particles fall to the ground their charge density increases since more ions attach to them (Figure 7D). Especially in the region below the main dust layer (below 1 km), where the ion density increases to the fair weather values, the falling dust particles encounter a larger pool of ions available for attachment than the one within the layer. This consequently leads to an increase of the particle charge (Figure 7E). The dust particles are charged negatively, since more negative ions attach to them than positive ones, due to their higher mobilities. To be more precise, the ion attachment process depends both on the ion mobilities and the ion densities (Eqs 30, 31, 38, 39). If the mobility ratio,
Regardless of the charge and the large scale electric field magnitude, the electrical force that is acted upon the particles is negligible compared to gravity. As it can be seen in Figure 7F, the ratio between the electrical force and the gravity, RF,18 is less than 2 × 10⁻⁶.
For a better representation of the bin particles dynamics, and so as to efficiently display the electrical properties of the other bins as well, we define the following average quantities. The average particle charge of a bin, <qp,i>, at every time step is:
where zmax,i, and zmin,i, are the maximum and the minimum altitudes of the particle distribution that belongs to Bin i, respectively.
The average electrical force magnitude of a bin, <Fel,i>, at every time step is:
The average velocity magnitude of a bin, <vp,i>, at every time step is:
The average altitude of a bin, <zp,i>, at every time step is:
The usefulness of the defined average quantities can be described as follows. At t = 0 s, all the particle bins are placed at the same altitude in the simulation domain, and they form the dust layer. Since each bin consists of particles with different sizes, it moves with different velocity. As time progresses, each bin starts being detached from the dust layer and moves towards the ground. At each time step depending on the velocity, each bin is located at different average altitude, < zp,i >, in the presence of different electric field magnitude, Ez. During their motion, the particle bins are not deformed, because the magnitude of the forces acted on them is not sufficient to cause any deformation (e.g., Figure 7C). This results that when the bins are at the same average altitude, the same average electric field is present, and the only quantities that are different are the average charge, the average electrical force magnitude, and the average velocity. By plotting these properties as a function of the average altitude, we can compare them under the same conditions, and their differences are only due to the particle bin size, and the bin number density.
Figures 8A,B show the time evolution of the conductivity and electric field magnitude ratios with respect to their fair weather values, at different altitudes. As the conductivity decreases with respect to the fair weather value, the electric field magnitude increases, with two exceptions. The first one is at z = 6 km, which is close to the upper boundary of the layer. As layer boundary we define the region where the dust particle number density gradually decreases to values at least two orders of magnitude less than the values inside the layer (in the case of the layer upper boundary), or the region where the dust particle number density gradually increases to the maximum values inside the layer (in the case of the layer lower boundary). In this region as the conductivity increases to the initial fair weather values, the electric field decreases. Similar behavior has been derived by Zhou and Tinsley (2007), and by Harrison et al. (2020) in layer clouds. This has to do with the reduction of the current density due to the increase of the columnar resistance caused by the conductivity reduction inside the layer (Rycroft et al., 2008). As the system approaches the steady state, the current density along the altitude tends to become constant (which is the steady state condition inside conductors (see e.g. Landau and Lifshitz, 1963, p. 86)). Since the potential difference between the boundaries of the simulation domain is constant, the increase of the columnar resistance caused by the conductivity reduction in the layer, leads to a decrease of the current density. In the regions where the conductivity remains the same to the initial fair weather values, decrease of the current density results in a decrease of the electric field. Consequently, in the upper boundary of the dust layer, as the conductivity increases to fair weather values, the electric field decreases with respect to its fair weather value to reflect the decrease of the current density.
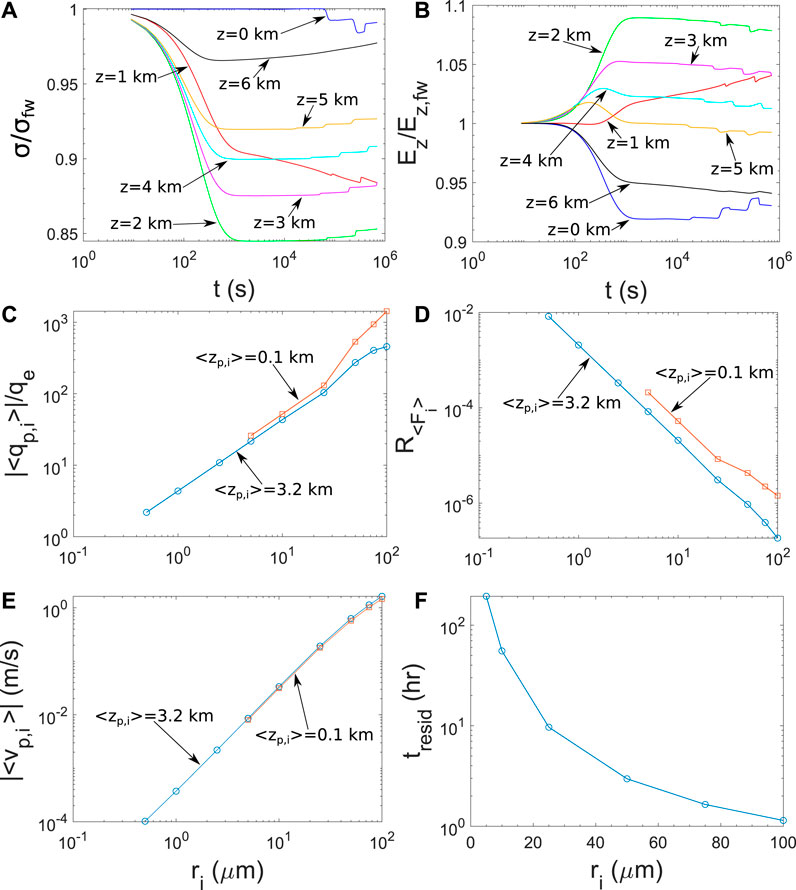
FIGURE 8. Characteristics of particles distributed along the altitude according to
The second is at the ground (z = 0 km), where initially the electric field decreases, but as time progresses and several bins arrive at the ground it increases. The initial decrease of the electric field, right after the placement of the dust layer, seems to contradict measurements and observations that show significant increase when dust is present (e.g. Katz et al., 2018; Zhang and Zhou, 2020).This can be explained, first of all, by the fact that the 1d model is not appropriate for the study of effects upon the arrival of the dust layer, since it assumes an infinite symmetrical horizontal extent of the layer. The particles are placed instantaneously above a location, and are left to move vertically according to the forces acting upon them. Effects caused by the horizontal transport of the layer that can create horizontal electrical currents that eventually close to the ground enhancing the fair weather electric field (due to the electrical structure of the layer or the horizontal wind) require 2d or 3d modeling for a more detailed study. Especially the presence of horizontal winds, that are responsible for the dust particle transport, can alter the fair weather electric field by modifying the electrical structure of the atmosphere, as has been shown by Anisimov et al. (2001). As a matter of fact, the differences between the measurements, presented by Katz et al. (2018), during day and night at Wise Observatory and Mt. Hermon are attributed, among other factors, to the effect of the winds at the lower layer.
While the dust particles are aloft, and in the absence of any charge separation within, the electric field at the ground decreases as a consequence of the increase of the columnar resistance as has been shown by Harrison et al. (2020) and Daskalopoulou et al. (2021). As dust particles approach the ground and the electrical conductivity decreases, because the dust particle number density increases, the electric field increases. The increase is not large because the calculation is terminated when 99.9% of particles with radius 5 μm vanish from the domain (hence smaller particles remain more than 5 days in the atmosphere, having terminal velocities in the order of a few cm per hour, and their settling is so slow that we choose not to include it in the current study, for the sake of saving simulation time). Small particles (that are the majority of the dust particle population) are still in the domain and above the ground. In the case of Katz et al. (2018) and Zhang and Zhou (2020) the measuring instruments (field mills) are well within the dust layer that reaches the ground. The increase of the electric field inside the layer and when it is already present has been reported by the measurements and agrees with our findings. Differences in the electric field polarities can exist as a consequence of multiple factors that are neglected in the current model, such as wind or other electrification mechanisms, which are planned to be studied in future work. Finally, we note that, although the conductivity decreases by a factor up to 0.85, the electric field enhancement factor is no greater than 1.08.
Figure 8C shows the relation between the number of elementary charges per particle and the particle size, at different altitudes. As the particle size decreases, particle charge decreases also as it is highly depended on particle size. Additionally, smaller particles have greater number densities than the large ones, and the attached ions tend to be divided on more particles leading to a decrease of the attached number of ions per particle (particle competition described by Gunn (1954)). Moreover, the charge of the larger particles increases as they travel within the atmosphere, as the attachment process depends on the particle velocity and the generated flow pattern, described by the Reynolds number. The larger the particle velocity the larger the difference between the particle charge at different altitudes.
Figure 8D illustrates the dependence of the ratio between the electrical force and gravity, on the particle size. As the particle size decreases both electrical force and gravity decrease (the first one because the particle charge decreases, and the second due to the size reduction). The gravitational force reduction is larger than the particle charge reduction, and the force ratio increases, but does not overcome a value of 0.01. Additionally, as large particles settle, the force ratio increases due to the subsequent increase of the particle charge with velocity, which leads to an increase of the electrical force.
The velocity of the particles is a result mainly of the gravity and the drag forces. It does not charge significantly over the altitude and decreases as the particle size decreases (Figure 8E). The residual time in the atmosphere, until 99.9% of the particle concentration of each size falls to the ground, spans in the range between 1 h, for particles with radius 100 μm, up to ∼ 120 h (5 days) with particles of radius equal to 5 μm (Figure 8F) The later results are consistent with the calculations presented by Mallios et al. (2020, 2021b).
3.2 Dependence on the Layer Depth
In this case the electrical properties of the distribution
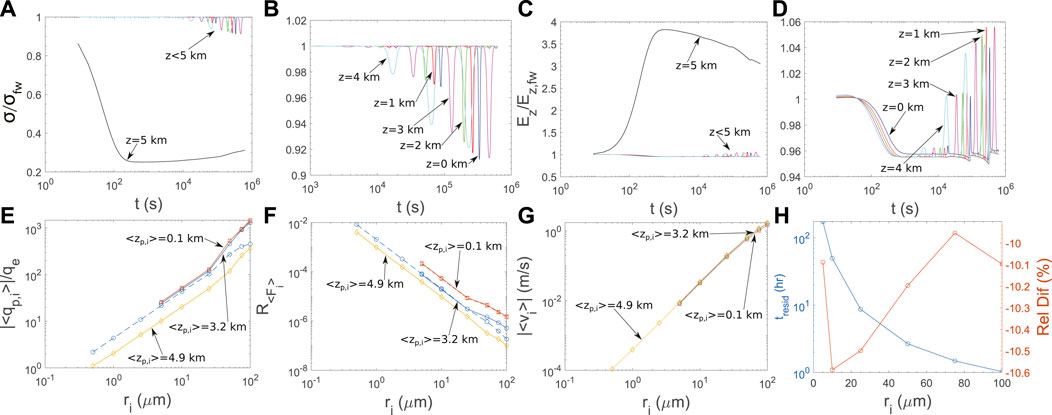
FIGURE 9. Characteristics of particles distributed along the altitude according to
The higher number density in the distribution leads to a more significant particle competition for ions. This leads to lower charge per particle than in the previous case when the particles are inside the layer. This can be seen clearly in Figure 9E where the number of elementary charges for particles that are located at average altitude equal to 4.9 km (in the center of the layer), is lower than in the previous case (dashed blue line in Figure 9E). As the particles keep falling the velocity influences the attachment process and increases the particle charge up until an average altitude of 3.2 km, where the particle charge remains constant for each size, regardless of the altitude.
Similar remarks hold for the case of the ratio between the electrical force and the gravity (Figure 9F). The velocity does not vary significantly over the altitude (Figure 9G), and since the electrical force is still insignificant compared to gravity, the particle velocity is the same as the previous case. The difference in the spatial distribution leads to a difference in the residual time that individual particles remain in the atmosphere by 10% (Figure 9H).
3.3 Dependence on the Particle Number Density
In order to demonstrate the charging mechanism dependence on the particle number density, we increase
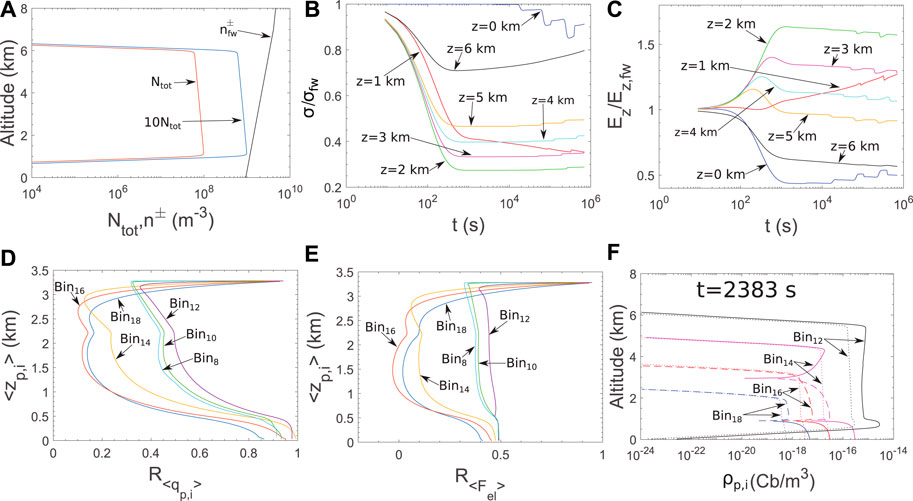
FIGURE 10. Comparison between the case of
Another interesting point that is revealed by Figure 10E, that for some bins the electrical force changes polarity and becomes positive. This means that the particles are charged positively. In Figure 10F, where a snapshot of the charge density dynamics is depicted, it is clear that the charge polarity in the case of particles with radius larger than 50 μm changes to positive values (Bin14–Bin18). This happens for the following reason. Since the ion attachment rate is proportional to the particle number density (Eqs 30, 31, 38, 39), the negative ions attach more to bins with smaller radii (that have several order of magnitude more particles than bins with larger radii). In the case of the distribution with
Similar conclusions were derived by Yair and Levin (1989) based on the ion attachment to aerosols formulation by Hoppel and Frick (1986). They studied polydisperse spherical conducting aerosols with radii up to 0.5 μm and found that for small aerosol concentrations, particles were charged mostly negatively, but that an increase in aerosol concentrations lead to differential charging, resulting in opposite charging of the small (mostly negative) and the large (mostly positive) particles. This effect was enhanced for size distributions which had a significant component of large particles. Their results showed dependency only on the particle concentration, as opposed to the current work findings, that show dependency on the particle concentrations with respect to the atmospheric ion concentrations. The latter distinction is attributed to the difference in the scale of the problem under examination. In the present study, the particle sizes are larger than the ionic mean free path and therefore the ionic diffusion is expected to influence the attachment process. In the case of Yair and Levin (1989) the aerosol sizes are comparable, or smaller, than the ionic mean free path and the processes of three body trapping and image capture are dominant. In general, it becomes clear that regardless the scale of the problem, the ion attachment to particles can lead to different polarities of the particle charges in case of different particle sizes.
Figure 11 shows the case of the densely packed
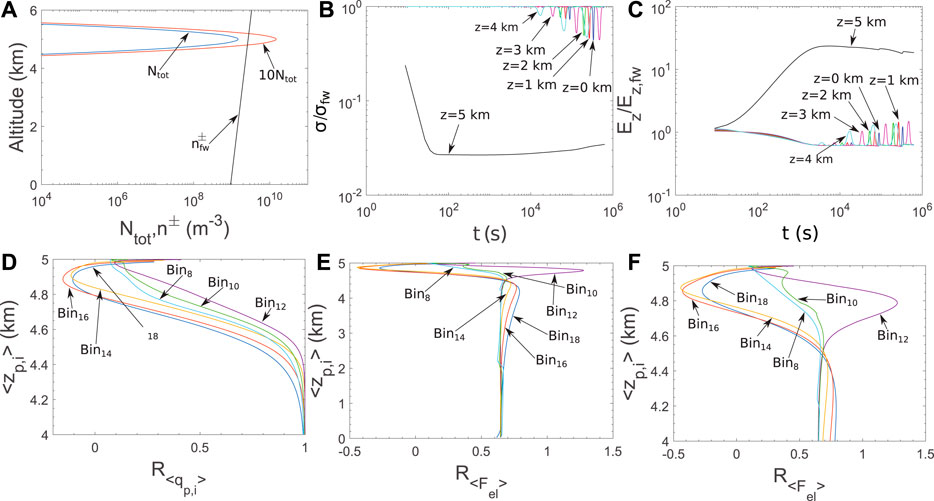
FIGURE 11. Comparison between the case of
From the results of Figures 10, 11 we deduce that, the increase of the dust particle density favors the increase of the ambient large scale electric field, but does not favor the charging process of the dust particles, because their net charge decreases. Overall, the increase of the dust particle density acts against the effects of the electrical force, because the reduction of the particle charge is more prominent than the increase of the electric field, and the electrical force ultimately decreases. This indicates that the ion attachment process (acting on the enhancement of the ambient electric field) combined with a second charging process, such as the triboelectric effect (acting on the enhancement of the particle charge), might create a sufficient electrical force that in turn influences the settling of the dust particles. We plan on investigating this further on future work.
3.4 Validation of the Particle Size Distribution Discretization
Figure 12 illustrates the results regarding the comparison of different types of binning. Figure 12A shows the number of elementary charges per particle as a function of the particle radius. As the number of equilateral bins increases, the results converge to the results calculated by the current work binning. This becomes more clear in Figures 12C,E, where initial size range is split in sub ranges 10–150 μm, and 0.1–10 μm, respectively. The same conclusions are derived in the case of the ratio between the electrical force magnitude and the gravity magnitude (Figures 2, 12B,D,F).
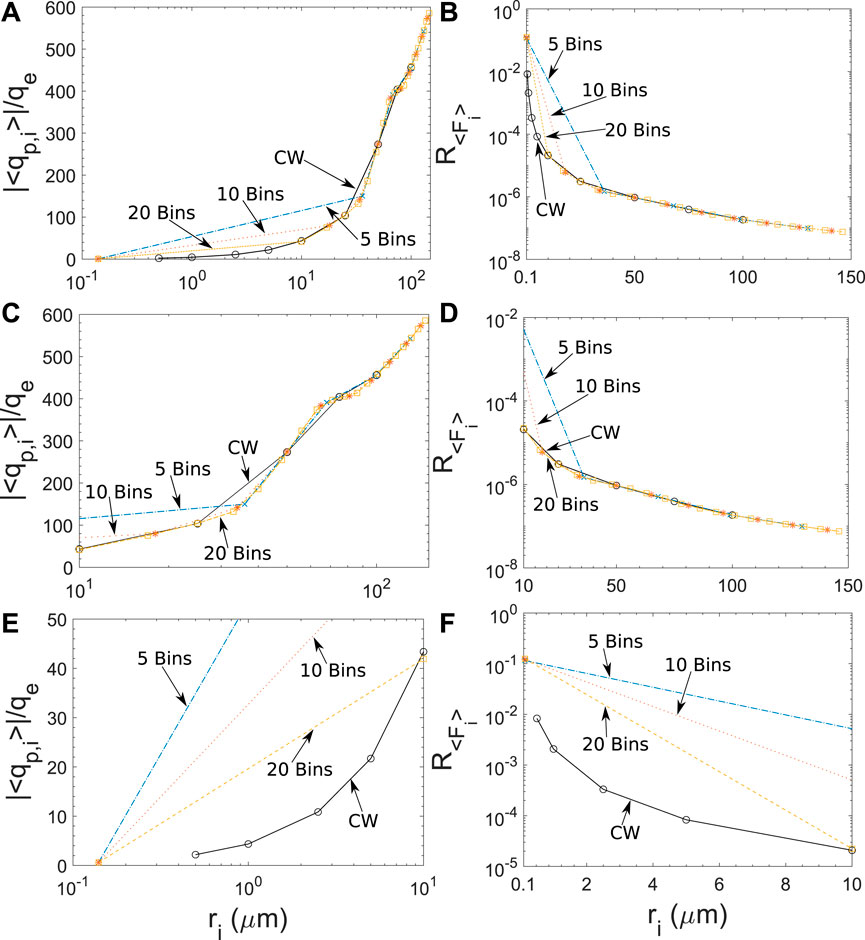
FIGURE 12. Study on the proper discretization of the size distribution: (A) Number of elementary charges per particle as a function of particle radius for different types of binnings, (B) ratio between the electrical force magnitude and the gravity magnitude as a function of particle radius for different types of binnings, (C,D) magnification of panels (A) and (B) for particle radius in the range of 10 − 150 μm, (E,F) magnification of panels (A) and (B) for particle radius in the range of 0.1 − 10 μm.
4 Conclusion
Ion attachment to dust particles is one of the major charging mechanisms during their gravitational settling within the atmospheric column. It can, therefore, lead to an enhancement of the ambient fair weather electric field, due to the ion density and, consequently, the atmospheric electrical conductivity reduction. This is the first consistent attempt, to our knowledge, to analytically represent the phenomena by integrating a measured size distribution of spherical dust particles, in the 1D model that incorporates the calculation of new attachment rates of non stationary spherical particles.
We have shown that ion attachment is capable of charging dust particles, with radius between 1 −100 μm, with a net charge that ranges between 1 −1,000 elementary charges depending on the dust particle number density. The particle velocity enhances the acquired particle net charge, but converges to a steady state value as the particle is traveling in the fair weather atmosphere away from the initial dust layer. The influence of the total number density on the particle charging process appears stronger than its influence on the electric field enhancement. If the number density is very close or becomes even larger than the ambient ion density, large particles can be charged positively while within the initial dust layer. This is attributed to the lack of negative ions, which tend to attach to small particles, that have number densities several orders of magnitude greater than the larger ones. A similar charging behavior was found in atmospheric aerosols with sizes smaller than 0.5 μm in radius, by Yair and Levin (1989). The dust layer depth is expected to influence both the net particle charge and the ambient electric field enhancement, but overall, the electrical force applied to the particles remains the same. The magnitude of the electrical force is found to be, at best, two orders of magnitude lesser than gravity, which leads to no significant influence to the particle dynamics, for particles with radius in the range 1−100 μm. Nonetheless, other processes must be combined with the ion attachment, such as the triboelectric effect or the updrafts, for a better quantification of the electrical force possible influence on the particle gravitational settling. In parallel to this work, sophisticated profiling measurements with novel atmospheric electricity sensors are launched in planned experiments within the D-TECT project, in order to further evaluate our model. These steps will be concluded in future work.
Data Availability Statement
Publicly available datasets were analyzed in this study. This data can be found here: http://www.met.reading.ac.uk/∼jp902366/research/fennec/data.php.
Author Contributions
SM conceptualized the model formalism, developed the model and wrote the paper. GP assisted in the model development and contributed in the paper writing. AP and GH directed the preparation of the paper, supervised the study and provided scientific consultation regarding the model results interpretation. VD prepared the particle size distribution discretization, the particle number density distributions along the altitude, and contributed in the paper writing. VA co-supervised the study, and provided scientific consultation regarding the mathematical formalism of the particle number density distribution and the particle size distribution discretization.
Funding
SM, GP, GH, and AP are funded by the project: “Modeling and Measuring Electrical Properties of Desert Dust Layers–Medimnos” (MIS 5049929) under the call for proposals “Researcher support with emphasis on new researchers” (EDBM103). The project is co-financed by Greece and the European Union (European Social Fund- ESF) by the Operational Programme Human Resources Development, Education and Lifelong Learning 2014–2020. VD would like to acknowledge funding by Greece and the European Union (European Social Fund-ESF) through the Operational Programme “Human Resources Development, Education and Lifelong Learning” in the context of the project “Strengthening Human Resources Research Potential via Doctorate Research” (MIS-5000432), implemented by the State Scholarships Foundation (IKY). VA acknowledges funding by the project “D-TECT” (Grant Agreement 725698) funded by the European Research Council (ERC) under the European Union’s Horizon 2020 research and innovation programme.
Conflict of Interest
The authors declare that the research was conducted in the absence of any commercial or financial relationships that could be construed as a potential conflict of interest.
Publisher’s Note
All claims expressed in this article are solely those of the authors and do not necessarily represent those of their affiliated organizations, or those of the publisher, the editors and the reviewers. Any product that may be evaluated in this article, or claim that may be made by its manufacturer, is not guaranteed or endorsed by the publisher.
References
Adebiyi, A. A., and Kok, J. F. (2020). Climate Models Miss Most of the Coarse Dust in the Atmosphere. Sci. Adv. 6, eaaz9507. doi:10.1126/sciadv.aaz9507
Anisimov, S. V., Mareev, E. A., Shikhova, N. M., and Dmitriev, E. M. (2001). Mechanisms for the Formation of Electric-Field Pulsation Spectra in the Near-Surface Atmosphere. Radiophys. Quan. Electron. 44, 520–532. doi:10.1023/a:1017905732496
Bates, D. R. (1982). Recombination of Small Ions in the Troposphere and Lower Stratosphere. Planet. Space Sci. 30, 1275–1282. doi:10.1016/0032-0633(82)90101-5
Baumgaertner, A. J. G., Lucas, G. M., Thayer, J. P., and Mallios, S. A. (2014). On the Role of Clouds in the Fair Weather Part of the Global Electric Circuit. Atmos. Chem. Phys. 14, 8599–8610. doi:10.5194/acp-14-8599-2014
Bricard, J. (1965). “Action of Radioactivity and of Pollution upon Parameters of Atmospheric Electricity,” in Problems of Atmospheric and Space Electricity. Editor S. C. Coroniti, 82–117.
Chiu, C.-S. (1978). Numerical Study of Cloud Electrification in an Axisymmetric, Time-dependent Cloud Model. J. Geophys. Res. 83, 5025–5049. doi:10.1029/jc083ic10p05025
Clift, R., and Gauvin, W. H. (1971). Motion of Entrained Particles in Gas Streams. Can. J. Chem. Eng. 49, 439–448. doi:10.1002/cjce.5450490403
Clift, R., Grace, J. R., and Weber, M. E. (2005). Bubbles, Drops, and Particles. Dover Publications.
Colarco, P. R., Toon, O. B., Torres, O., and Rasch, P. J. (2002). Determining the UV Imaginary index of Refraction of Saharan Dust Particles from Total Ozone Mapping Spectrometer Data Using a Three-Dimensional Model of Dust Transport. J. Geophys. Res. 107. doi:10.1029/2001jd000903
Creamean, J. M., Suski, K. J., Rosenfeld, D., Cazorla, A., DeMott, P. J., Sullivan, R. C., et al. (2013). Dust and Biological Aerosols from the Sahara and Asia Influence Precipitation in the Western U.S. Science 339, 1572–1578. doi:10.1126/science.1227279
Dahneke, B. (1983). “Simple Kinetic Theory of Brownian Diffusion in Vapors and Aerosols,” in Theory of Dispersed Multiphase Flow. Editor R. E. Meyer (Academic Press), 97–133. doi:10.1016/B978-0-12-493120-6.50011-8
Daskalopoulou, V., Mallios, S. A., Ulanowski, Z., Hloupis, G., Gialitaki, A., Tsikoudi, I., et al. (2021). The Electrical Activity of Saharan Dust as Perceived from Surface Electric Field Observations. Atmos. Chem. Phys. 21, 927–949. doi:10.5194/acp-21-927-2021
Davies, C. N. (1945). Definitive Equations for the Fluid Resistance of Spheres. Proc. Phys. Soc. 57, 259–270. doi:10.1088/0959-5309/57/4/301
DeMott, P. J., Sassen, K., Poellot, M. R., Baumgardner, D., Rogers, D. C., Brooks, S. D., et al. (2003). African Dust Aerosols as Atmospheric Ice Nuclei. Geophys. Res. Lett. 30. doi:10.1029/2003GL017410
Denjean, C., Cassola, F., Mazzino, A., Triquet, S., Chevaillier, S., Grand, N., et al. (2016). Size Distribution and Optical Properties of mineral Dust Aerosols Transported in the Western Mediterranean. Atmos. Chem. Phys. 16, 1081–1104. doi:10.5194/acp-16-1081-2016
Eden, H. F., and Vonnegut, B. (1973). Electrical Breakdown Caused by Dust Motion in Low-Pressure Atmospheres: Considerations for Mars. Science 180, 962–963. doi:10.1126/science.180.4089.962
Fjeld, R. A., Gauntt, R. O., and McFarland, A. R. (1983). Continuum Field-Diffusion Theory for Bipolar Charging of Aerosols. J. Aerosol Sci. 14, 541–556. doi:10.1016/0021-8502(83)90010-1
Fjeld, R. A., and McFarland, A. R. (1989). Evaluation of Select Approximations for Calculating Particle Charging Rates in the Continuum Regime. Aerosol Sci. Technol. 10, 535–549. doi:10.1080/02786828908959293
Fuks, N. A. (1958). The Mechanics of Aerosols. Maryland: Technical Information Division, Directorate of Technical Services, U.S. Army Chemical Warfare Laboratories.
Garcia-Carreras, L., Parker, D. J., Marsham, J. H., Rosenberg, P. D., Brooks, I. M., Lock, A. P., et al. (2015). The Turbulent Structure and Diurnal Growth of the Saharan Atmospheric Boundary Layer. J. Atmos. Sci. 72, 693–713. doi:10.1175/JAS-D-13-0384.1
Gauntt, R. O., Fjeld, R. A., and Mcfarland, A. R. (1984). Bipolar Charging of Near-Micrometer Sized Aerosol. IEEE Trans. Ind. Applicat. IA-20, 1636–1641. doi:10.1109/tia.1984.4504653
Ginoux, P., Chin, M., Tegen, I., Prospero, J. M., Holben, B., Dubovik, O., et al. (2001). Sources and Distributions of Dust Aerosols Simulated with the GOCART Model. J. Geophys. Res. 106, 20255–20273. doi:10.1029/2000JD000053
Gott, J. P. (1936). Movements of Electrically Charged Cloud Particles. Math. Proc. Camb. Phil. Soc. 32, 486–492. doi:10.1017/S0305004100019198
Goudie, A. S., and Middleton, N. J. (2001). Saharan Dust Storms: Nature and Consequences. Earth-Science Rev. 56, 179–204. doi:10.1016/S0012-8252(01)00067-8
Gunn, R. (1954). Diffusion Charging of Atmospheric Droplets by Ions, and the Resulting Combination Coefficients. J. Meteorol. 11, 339–347. doi:10.1175/1520-0469(1954)011<0339:DCOADB>2.0.CO;2
Gunn, R. (1956). The Hyperelectrification of Raindrops by Atmospheric Electric fields. J. Meteorol. 13, 283–288. doi:10.1175/1520-0469(1956)013<0283:THORBA>2.0.CO;2
Harrison, R. G., Nicoll, K. A., Mareev, E., Slyunyaev, N., and Rycroft, M. J. (2020). Extensive Layer Clouds in the Global Electric Circuit: Their Effects on Vertical Charge Distribution and Storage. Proc. R. Soc. A. 476, 20190758. doi:10.1098/rspa.2019.0758
Helsdon, J. H., Gattaleeradapan, S., Farley, R. D., and Waits, C. C. (2002). An Examination of the Convective Charging Hypothesis: Charge Structure, Electric fields, and Maxwell Currents. J. Geophys. Res. 107. doi:10.1029/2001JD001495
Hoppel, W. A., and Frick, G. M. (1986). Ion-Aerosol Attachment Coefficients and the Steady-State Charge Distribution on Aerosols in a Bipolar Ion Environment. Aerosol Sci. Technol. 5, 1–21. doi:10.1080/02786828608959073
Huang, Y., Kok, J. F., Kandler, K., Lindqvist, H., Nousiainen, T., Sakai, T., et al. (2020). Climate Models and Remote Sensing Retrievals Neglect Substantial Desert Dust Asphericity. Geophys. Res. Lett. 47, 1–11. doi:10.1029/2019GL086592
Huneeus, N., Schulz, M., Balkanski, Y., Griesfeller, J., Prospero, J., Kinne, S., et al. (2011). Global Dust Model Intercomparison in AeroCom Phase I. Atmos. Chem. Phys. 11, 7781–7816. doi:10.5194/acp-11-7781-2011
Jennings, S. G. (1988). The Mean Free Path in Air. J. Aerosol Sci. 19, 159–166. doi:10.1016/0021-8502(88)90219-4
Jickells, T. D., An, Z. S., Andersen, K. K., Baker, A. R., Bergametti, G., Brooks, N., et al. (2005). Global Iron Connections between Desert Dust, Ocean Biogeochemistry, and Climate. Science 308, 67–71. doi:10.1126/science.1105959
Kamra, A. K. (1972). Measurements of the Electrical Properties of Dust Storms. J. Geophys. Res. 77, 5856–5869. doi:10.1029/JC077i030p05856
Katz, S., Yair, Y., Price, C., Yaniv, R., Silber, I., Lynn, B., et al. (2018). Electrical Properties of the 8-12th September, 2015 Massive Dust Outbreak over the Levant. Atmos. Res. 201, 218–225. doi:10.1016/j.atmosres.2017.11.004
Kilpatric, W. D. (1971). An Experimental Mass-Mobility Relation for Ions in Air at Atmospheric Pressure. Proc. 19th Annu. Conf. Mass. Spectrosc. 19, 320–325.
Kinzer, G. D., and Gunn, R. (1951). The Evaporation, Temperature and thermal Relaxation-Time of Freely Falling Waterdrops. J. Meteorol. 8, 71–83. doi:10.1175/1520-0469(1951)008<0071:tetatr>2.0.CO;2
Klett, J. D. (1971). Ion Transport to Cloud Droplets by Diffusion and Conduction, and the Resulting Droplet Charge Distribution. J. Atmos. Sci. 28, 78–85. doi:10.1175/1520-0469(1971)028<0078:ittcdb>2.0.co;2
Kok, J. F., Ridley, D. A., Zhou, Q., Miller, R. L., Zhao, C., Heald, C. L., et al. (2017). Smaller Desert Dust Cooling Effect Estimated from Analysis of Dust Size and Abundance. Nat. Geosci 10, 274–278. doi:10.1038/ngeo2912
Krauss, C. E., Hor nyi, M., and Robertson, S. (2003). Experimental Evidence for Electrostatic Discharging of Dust Near the Surface of Mars. New J. Phys. 5, 70. doi:10.1088/1367-2630/5/1/370
Lacks, D. J., Duff, N., and Kumar, S. K. (2008). Nonequilibrium Accumulation of Surface Species and Triboelectric Charging in Single Component Particulate Systems. Phys. Rev. Lett. 100. doi:10.1103/PhysRevLett.100.188305
Landau, L. D., and Lifshitz, E. M. (1963). Electrodynamics of Continuous Media, Vol. 8. Pergamon Press.
Lawless, P. A. (1996). Particle Charging Bounds, Symmetry Relations, and an Analytic Charging Rate Model for the Continuum Regime. J. Aerosol Sci. 27, 191–215. doi:10.1016/0021-8502(95)00541-2
Leonard, B. P. (1979). A Stable and Accurate Convective Modelling Procedure Based on Quadratic Upstream Interpolation. Comput. Methods Appl. Mech. Eng. 19, 59–98. doi:10.1016/0045-7825(79)90034-3
Li, F., Vogelmann, A. M., and Ramanathan, V. (2004). Saharan Dust Aerosol Radiative Forcing Measured from Space. J. Clim. 17, 2558–2571. doi:10.1175/1520-0442(2004)017<2558:sdarfm>2.0.co;2
Li, J.-G. (2008). Upstream Nonoscillatory Advection Schemes. Mon. Weather Rev. 136, 4709–4729. doi:10.1175/2008MWR2451.1
Liu, B. Y. H., and Kapadia, A. (1978). Combined Field and Diffusion Charging of Aerosol Particles in the Continuum Regime. J. Aerosol Sci. 9, 227–242. doi:10.1016/0021-8502(78)90045-9
Long, Z., and Yao, Q. (2010). Evaluation of Various Particle Charging Models for Simulating Particle Dynamics in Electrostatic Precipitators. J. Aerosol Sci. 41, 702–718. doi:10.1016/j.jaerosci.2010.04.005
Mallios, S. A., Daskalopoulou, V., and Amiridis, V. (2021a). Orientation of Non Spherical Prolate Dust Particles Moving Vertically in the Earth's Atmosphere. J. Aerosol Sci. 151, 105657. doi:10.1016/j.jaerosci.2020.105657
Mallios, S. A., Drakaki, E., and Amiridis, V. (2021b). Corrigendum to "Effects of Dust Particle Sphericity and Orientation on Their Gravitational Settling in the Earth's Atmosphere" [Journal of Aerosol Science 150 (2020) 105634]. J. Aerosol Sci. 153, 105736. doi:10.1016/j.jaerosci.2020.105736
Mallios, S. A., Drakaki, E., and Amiridis, V. (2020). Effects of Dust Particle Sphericity and Orientation on Their Gravitational Settling in the Earth's Atmosphere. J. Aerosol Sci. 150, 105634. doi:10.1016/j.jaerosci.2020.105634
Marlow, W. H., and Brock, J. R. (1975). Unipolar Charging of Small Aerosol Particles. J. Colloid Interf. Sci. 50, 32–38. doi:10.1016/0021-9797(75)90250-7
Marshall, T. C., Stolzenburg, M., Maggio, C. R., Coleman, L. M., Krehbiel, P. R., Hamlin, T., et al. (2005). Observed Electric fields Associated with Lightning Initiation. Geophys. Res. Lett. 32. doi:10.1029/2004gl021802
Merrison, J. P. (2012). Sand Transport, Erosion and Granular Electrification. Aeolian Res. 4, 1–16. doi:10.1016/j.aeolia.2011.12.003
Meyerott, R. E., Reagan, J. B., and Joiner, R. G. (1980). The Mobility and Concentration of Ions and the Ionic Conductivity in the Lower Stratosphere. J. Geophys. Res. 85, 1273–1278. doi:10.1029/JA085iA03p01273
Mishev, A. (2013). Short- and Medium-Term Induced Ionization in the Earth Atmosphere by Galactic and Solar Cosmic Rays. Int. J. Atmos. Sci. 2013, 1–9. doi:10.1155/2013/184508
Nicoll, K. A., Harrison, R. G., and Ulanowski, Z. (2010). Observations of Saharan Dust Layer Electrification. Environ. Res. Lett. 6, 014001. doi:10.1088/1748-9326/6/1/014001
NOAA/NASA/USAF (1976). U.S Standard Atmosphere 1976. Washington, DC, United States: Tech. Rep. NASA-TM-X-74335, NOAA-S/T-76-1562.
Pasko, V. P., Inan, U. S., Bell, T. F., and Taranenko, Y. N. (1997). Sprites Produced by Quasi-Electrostatic Heating and Ionization in the Lower Ionosphere. J. Geophys. Res. 102, 4529–4561. doi:10.1029/96JA03528
Press, W. H., Teukolsky, S. A., Vetterling, W. T., and Flannery, B. P. (1992). “Numerical Recipes in C,” in The Art of Scientific Computing. 2nd Ed. (USA: Cambridge University Press).
Proudman, I., and Pearson, J. R. A. (1957). Expansions at Small Reynolds Numbers for the Flow Past a Sphere and a Circular cylinder. J. Fluid Mech. 2. doi:10.1017/s0022112057000105
Renard, J.-B., Dulac, F., Durand, P., Bourgeois, Q., Denjean, C., Vignelles, D., et al. (2018). In Situ measurements of Desert Dust Particles above the Western Mediterranean Sea with the Balloon-Borne Light Optical Aerosol Counter/sizer (LOAC) during the ChArMEx Campaign of Summer 2013. Atmos. Chem. Phys. 18, 3677–3699. doi:10.5194/acp-18-3677-2018
Riousset, J. A., Nag, A., and Palotai, C. (2020). Scaling of Conventional Breakdown Threshold: Impact for Predictions of Lightning and TLEs on Earth, Venus, and Mars. Icarus 338, 113506. doi:10.1016/j.icarus.2019.113506
Rycroft, M. J., Harrison, R. G., Nicoll, K. A., and Mareev, E. A. (2008). An Overview of Earth's Global Electric Circuit and Atmospheric Conductivity. Space Sci. Rev. 137, 83–105. doi:10.1007/s11214-008-9368-6
Rycroft, M. J., Israelsson, S., and Price, C. (2000). The Global Atmospheric Electric Circuit, Solar Activity and Climate Change. J. Atmos. Solar-Terrestrial Phys. 62, 1563–1576. doi:10.1016/S1364-6826(00)00112-7
Ryder, C. L., Highwood, E. J., Lai, T. M., Sodemann, H., and Marsham, J. H. (2013a). Impact of Atmospheric Transport on the Evolution of Microphysical and Optical Properties of Saharan Dust. Geophys. Res. Lett. 40, 2433–2438. doi:10.1002/grl.50482
Ryder, C. L., Highwood, E. J., Rosenberg, P. D., Trembath, J., Brooke, J. K., Bart, M., et al. (2013b). Optical Properties of Saharan Dust Aerosol and Contribution from the Coarse Mode as Measured during the Fennec 2011 Aircraft Campaign. Atmos. Chem. Phys. 13, 303–325. doi:10.5194/acp-13-303-2013
Ryder, C. L., Highwood, E. J., Walser, A., Seibert, P., Philipp, A., and Weinzierl, B. (2019). Coarse and Giant Particles Are Ubiquitous in Saharan Dust export Regions and Are Radiatively Significant over the Sahara. Atmos. Chem. Phys. 19, 15353–15376. doi:10.5194/acp-19-15353-2019
Ryder, C. L., Marenco, F., Brooke, J. K., Estelles, V., Cotton, R., Formenti, P., et al. (2018). Coarse-mode mineral Dust Size Distributions, Composition and Optical Properties from AER-D Aircraft Measurements over the Tropical Eastern Atlantic. Atmos. Chem. Phys. 18, 17225–17257. doi:10.5194/acp-18-17225-2018
Shinbrot, T., and Herrmann, H. J. (2008). Static in Motion. Nature 451, 773–774. doi:10.1038/451773a
Smith, W. B., and McDonald, J. R. (1975). Calculation of the Charging Rate of fine Particles by Unipolar Ions. J. Air Pollut. Control. Assoc. 25, 168–172. doi:10.1080/00022470.1975.10470068
Stolzenburg, M., Marshall, T. C., Rust, W. D., Bruning, E., MacGorman, D. R., and Hamlin, T. (2007). Electric Field Values Observed Near Lightning Flash Initiations. Geophys. Res. Lett. 34. doi:10.1029/2006GL028777
Tammet, H. (1995). Size and Mobility of Nanometer Particles, Clusters and Ions. J. Aerosol Sci. 26, 459–475. doi:10.1016/0021-8502(94)00121-e
Tinsley, B. A., and Zhou, L. (2006). Initial Results of a Global Circuit Model with Variable Stratospheric and Tropospheric Aerosols. J. Geophys. Res. 111. doi:10.1029/2005jd006988
Toth, J. R., Rajupet, S., Squire, H., Volbers, B., Zhou, J., Xie, L., et al. (2020). Electrostatic Forces Alter Particle Size Distributions in Atmospheric Dust. Atmos. Chem. Phys. 20, 3181–3190. doi:10.5194/acp-20-3181-2020
van der Does, M., Knippertz, P., Zschenderlein, P., Giles Harrison, R., and Stuut, J.-B. W. (2018). The Mysterious Long-Range Transport of Giant mineral Dust Particles. Sci. Adv. 4, eaau2768. doi:10.1126/sciadv.aau2768
Wang, P.-K. (1983). Collection of Aerosol Particles by a Conducting Sphere in an External Electric Field-Continuum Regime Approximation. J. Colloid Interf. Sci. 94, 301–318. doi:10.1016/0021-9797(83)90268-0
Weinzierl, B., Ansmann, A., Prospero, J. M., Althausen, D., Benker, N., Chouza, F., et al. (2017). The Saharan Aerosol Long-Range Transport and Aerosol-Cloud-Interaction Experiment: Overview and Selected Highlights. B. Am. Meteorol. Soc. 98, 1427–1451. doi:10.1175/BAMS-D-15-00142.1
Whipple, F. J. W., and Chalmers, J. A. (1944). On Wilson's Theory of the Collection of Charge by Falling Drops. Q.J R. Met. Soc. 70, 103–119. doi:10.1002/qj.49707030402
Williams, E., and Yair, Y. (2006). “The Microphysical and Electrical Properties of Sprite-Producing Thunderstorms,” in Sprites, Elves and Intense Lightning Discharges. Editors M. Füllekrug, E. A. Mareev, and M. J. Rycroft (Springer Netherlands), 57–83. doi:10.1007/1-4020-4629-4\text{\_}3
Wilson, C. T. R. (1929). Some Thundercloud Problems. J. Franklin Inst. 208, 1–12. doi:10.1016/s0016-0032(29)90935-2
Yair, Y., and Levin, Z. (1989). Charging of Polydispersed Aerosol Particles by Attachment of Atmospheric Ions. J. Geophys. Res. 94, 13085–13091. doi:10.1029/jd094id11p13085
Yang, W., Marshak, A., Kostinski, A. B., and Várnai, T. (2013). Shape-induced Gravitational Sorting of Saharan Dust during Transatlantic Voyage: Evidence from CALIOP Lidar Depolarization Measurements. Geophys. Res. Lett. 40, 3281–3286. doi:10.1002/grl.50603
Zalesak, S. T. (1979). Fully Multidimensional Flux-Corrected Transport Algorithms for Fluids. J. Comput. Phys. 31, 335–362. doi:10.1016/0021-9991(79)90051-2
Zhang, H., and Zhou, Y. H. (2020). Reconstructing the Electrical Structure of Dust Storms from Locally Observed Electric Field Data. Nat. Commun. 11, 5072. doi:10.1038/s41467-020-18759-0
Zhao, H., Castle, G. S. P., and Inculet, I. I. (2002). The Measurement of Bipolar Charge in Polydisperse Powders Using a Vertical Array of Faraday Pail Sensors. J. Electrostatics 55, 261–278. doi:10.1016/S0304-3886(01)00209-1
Zhou, L., and Tinsley, B. A. (2007). Production of Space Charge at the Boundaries of Layer Clouds. J. Geophys. Res. 112. doi:10.1029/2006JD007998
Keywords: dust particle electrification, dust particle charging, ion attachment, dust particle settling, dust particle transport, atmospheric electricity
Citation: Mallios SA, Papangelis G, Hloupis G, Papaioannou A, Daskalopoulou V and Amiridis V (2021) Modeling of Spherical Dust Particle Charging due to Ion Attachment. Front. Earth Sci. 9:709890. doi: 10.3389/feart.2021.709890
Received: 14 May 2021; Accepted: 20 July 2021;
Published: 05 August 2021.
Edited by:
Konstantinos Kourtidis, Democritus University of Thrace, GreeceReviewed by:
Yoav Yosef Yair, Interdisciplinary Center Herzliya, IsraelJames Matthews, University of Bristol, United Kingdom
Copyright © 2021 Mallios, Papangelis, Hloupis, Papaioannou, Daskalopoulou and Amiridis. This is an open-access article distributed under the terms of the Creative Commons Attribution License (CC BY). The use, distribution or reproduction in other forums is permitted, provided the original author(s) and the copyright owner(s) are credited and that the original publication in this journal is cited, in accordance with accepted academic practice. No use, distribution or reproduction is permitted which does not comply with these terms.
*Correspondence: Sotirios A. Mallios, c21hbGxpb3NAbm9hLmdy