 Chelsea Ackroyd
 S. McKenzie Skiles
 Karl Rittger
 Joachim Meyer1
- 1Department of Geography, University of Utah, Salt Lake City, UT, United States
- 2Institute for Arctic and Alpine Research (INSTAAR), University of Colorado, Boulder, CO, United States
High Mountain Asia (HMA) has the largest expanse of snow outside of the polar regions and it plays a critical role in climate and hydrology. In situ monitoring is rare due to terrain complexity and inaccessibility, making remote sensing the most practical way to understand snow patterns in HMA despite relatively short periods of record. Here, trends in snow cover duration were assessed using MODIS between 2002 and 2017 across the headwaters of the region’s primary river basins (Amu Darya, Brahmaputra, Ganges, Indus, and Syr Darya). Data limitations, associated with traditional binary mapping and data gaps due to clouds, were addressed with a daily, spatially and temporally complete, snow cover product that maps the fraction of snow in each pixel using spectral mixture analysis. Trends in fractional snow cover duration (fSCD) were calculated at the annual and monthly scale, and across 1,000 m elevation bands, and compared to trends in binary snow cover duration (SCD). Snow cover is present, on average, for 102 days across all basin headwaters, with the longest duration in western basins and shortest in eastern basins. Broadly, snow cover is in decline, which is most pronounced in elevation bands where snow is most likely to be present and most needed to sustain glaciers. Some of the strongest negative trends in fSCD were in the Syr Darya, which has 13 fewer days between 4,000–5,000 m, and Brahmaputra, which has 31 fewer days between 5,000–6,000 m. The only increasing tendency was found in the Indus between 2,000 and 5,000 m. There were differences between fSCD and SCD trends, due to SCD overestimating snow cover area relative to fSCD.
Introduction
It is imperative to accurately monitor changes in snow cover (both annually and seasonally) in High Mountain Asia (HMA), where over a billion people depend on snow and glacial melt to meet water demands (Xu et al., 2007). Mountain snowmelt accounts for a relatively large proportion of surface water resources: up to 50% of annual river runoff in western HMA and 40% in eastern HMA is derived from snowmelt (Bookhagen and Burbank, 2010). The timing of the snowmelt pulse directly aligns with the growing season and is essential to agriculture (Barnett et al., 2005) and for generating energy via hydropower (Mishra et al., 2018), making both the snowmelt magnitude and the consistent runoff timing critical to sustaining livelihoods in this region of the world. Snow cover also has a critical role in regional to global climate, linking atmospheric and land surface processes. For instance, less snow coverage in HMA, which encompasses more snow and ice than anywhere else in the world outside of the polar regions, impacts the global energy budget via the snow albedo feedback (Panday et al., 2011). Regionally, snow has important feedbacks with weather and climate patterns; for example, surface albedo in eastern HMA has been associated with the timing of monsoonal rainfall, with a stronger monsoon linked to earlier melt (Kripalani et al., 2003).
Controls on snow cover duration, snow accumulation, and melt processes, exhibit high spatial variability across the vast mountain region. Precipitation timing and amount are closely linked to the East Asian monsoon in eastern HMA, whereas in western HMA snow accumulation is primarily linked to the westerlies winds that bring moisture to the continent. Broadly, the study region is experiencing warming at a higher rate than the global average with increased rates in the western basins of HMA observed in winter (Bhutiyani et al., 2007; Hartmann et al., 2013; Shukla et al., 2019), which may be shifting broader climate patterns and precipitation phase. Observations show that the central and eastern basins are broadly experiencing a decrease in precipitation (Bollasina et al., 2011; Palazzi et al., 2013), apart from the Karakoram where precipitation is increasing, in what is known as the Karakoram-Kun Lun-Pamir anomaly (Farinotti et al., 2020). Changing snow accumulation patterns also impact melt magnitude and timing as less snow melts faster. Other controls on melt timing, like reduction in albedo by light absorbing particles, vary regionally. For instance, dust from adjacent deserts is more predominant in the west, whereas black carbon from South Asia is more predominant along the south slope of the Himalaya (Menon et al., 2010; Skiles et al., 2018; Sarangi et al., 2020).
Understanding how snow responds to climate warming and perturbations to snow energy balance is challenging because of the complexity and remoteness of the terrain, considering most areas are inaccessible. The relatively few snow data collection sites and in situ measurement stations cannot adequately represent the entire region (Tang et al., 2013). Many ground stations were also abandoned in the Syr Darya and Amu Darya after the disintegration of the Soviet Union in the early 1990s, leaving the number of snow surveys (either in situ or aerial) to decrease substantially since that time (Unger-Shayesteh et al., 2013; Hoelzle et al., 2019). The use of remote sensing data, therefore, is the preferred method for monitoring snow cover (Tahir et al., 2011). Current remote sensing based studies broadly agree that there is a decline in snow covered area (SCA) across the region (Immerzeel et al., 2009; Gurung et al., 2011; Dietz et al., 2014). However, studies also indicate that snow cover trends are highly variable depending on the analysis dataset, spatial scale, and the study period (Hasson et al., 2014; Singh et al., 2018), which is consistent with the spatial and temporal variability in controls on snow accumulation and snowmelt. For example, a decrease in SCA was reported across the HKH as a whole from 2000 to 2010; however, when assessing the snow cover trends on a smaller spatial scale, a decrease in SCA was only reported in the central HKH region, with increases in SCA in the western region during the same time period (Gurung et al., 2011). In such cases, the relatively short time period may only reflect decadal climatic variability, indicating that a longer time frame is needed to detect snow cover anomalies. The inconsistency between study region, time frame, and scale makes it a challenge for understanding where and how snow cover is changing.
The Moderate Resolution Imaging Spectrometer (MODIS) is a popular choice for assessing snow cover trends because of its multispectral band placement, radiometric resolution that reduces saturation over bright snow, frequent temporal resolution, and record length, with snow cover maps since 1999/2002 (Aqua/Terra) (Hasson et al., 2014). Studies to date that have analyzed snow cover trends in HMA from MODIS have used binary (snow/no snow) snow extent, mapped from the normalized difference snow index (NDSI) coverage (Maskey et al., 2011; Dietz et al., 2014; Tahir et al., 2015; Li et al., 2018). For time series analysis 8-days composites are typically chosen to account for noise and gaps inherent in daily data, such as obscuration due to clouds or distorted viewing geometry from the satellite view angle (Hall and Riggs, 2007). This approach has uncertainty associated with the spatial resolution of MODIS in the “land bands” (500 m), a scale at which almost all pixels are mixed in mountain terrain. The operational NDSI-based snow cover products (MOD10A1) have an accuracy of approximately 88%, in which some of the errors include overestimating snow or failing to classify shallow snow (Klein and Barnett, 2003; Wang et al., 2006).
Here, MODIS was also used to assess trends in snow cover duration, and data limitations were addressed by using a daily gap filled fractional snow cover dataset. The analysis focuses on the mountainous headwaters of the regions primary river basins spanning the Syr Darya to the Brahmaputra. The base retrieval, the MODIS Snow Covered Area and Grain Size algorithm (MODSCAG), applies spectral mixture analysis to identify the percentage of each pixel covered in snow (Painter et al., 2009; Rittger et al., 2013). By quantifying the snow cover fraction within each 500 m pixel, the scale limitation can be reduced and a more accurate understanding of snow cover trends can be achieved (Salomonson and Appel, 2006; Painter et al., 2009). To address missing pixel values, interpolation, filtering, and smoothing are applied to create a spatially and temporally complete (STC) daily dataset (Dozier et al., 2008; Rittger et al., 2020). The MODSCAG-STC dataset is the longest and most accurate snow cover dataset available for mountain snow, and this is the first study to leverage it for time series analysis in HMA. Trends in fractional snow cover duration (fSCD) between 2002 and 2017 were assessed at the annual and monthly scale, and across 1,000-m elevation bands. Additionally, fSCD was compared to binary snow cover duration (SCD) to understand how trends change with pixel or subpixel analysis.
Methods
Study Area
The snow cover duration is assessed individually within the boundaries of each river basin, from west to east, the Syr Darya, Amu Darya, Indus, Ganges, and Brahmaputra, the contiguous area as a whole, and 1,000 m elevation bands (Figure 1). These basins encompass several countries including Kyrgyzstan, Kazakstan, Uzbekistan, Tajikistan, Afghanistan, Pakistan, India, Nepal, Bangladesh, Bhutan, and China. The headwaters include the Tien Shan, Pamir, Hindu Kush, and Himalaya Mountains, some of the highest landscapes in the world (Figure 2), much of which is snow covered either perennially or annually. The seasonal snowmelt from snow that accumulates at these higher elevations is a major contributor to surface water and ground water recharge in each of these basins.
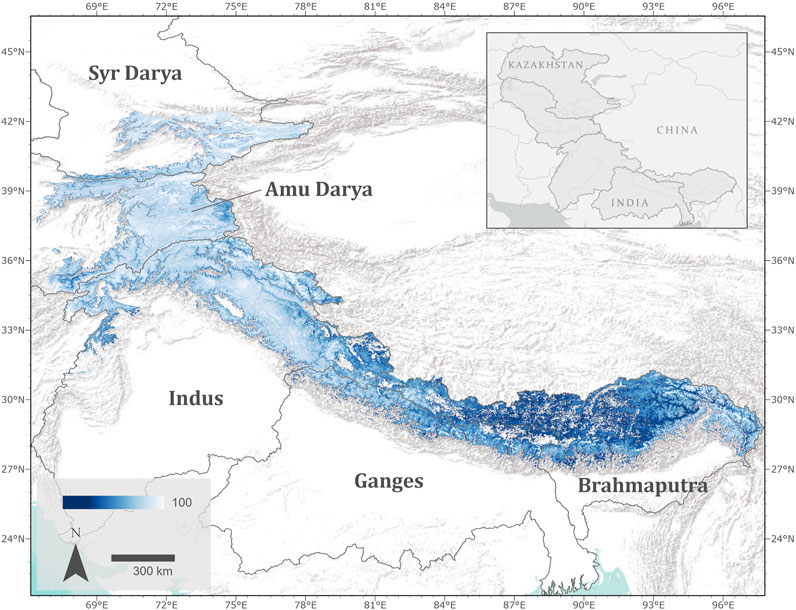
FIGURE 1. The study area includes the following river basins: Syr Darya, Amu Darya, Indus, Ganges, and Brahmaputra. Using MODSCAG-STC, mean annual fractional snow-covered area is shown across each basin for the year 2017. The SCA value of 100, represented by the color white, indicates full snow coverage for a given pixel. Sources for the basemap include ESRI, USGS, and NOAA.
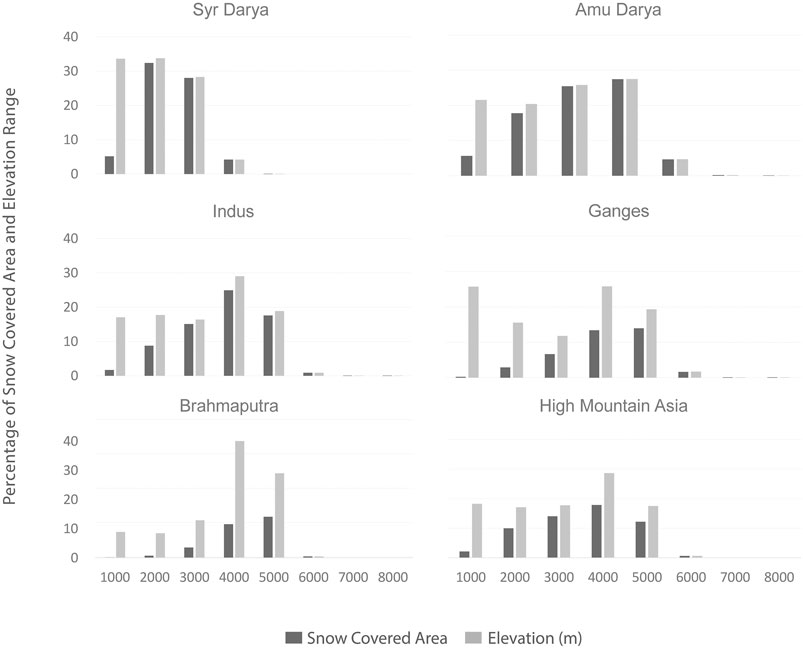
FIGURE 2. Percentage of elevation ranges and snow-covered area for High Mountain Asia and the five target basins. Elevations are determined using ASTER GDEM V2. For demonstration purposes we used snow-covered area from MODSCAG-STC for the year 2002. Higher elevation bands with indistinct bars are typically <0.1%.
Data
Snow cover maps derived from MODIS surface reflectance were used in this analysis. The MODIS instrument is aboard both the Terra and Aqua satellites, from which data collection began in February 2000 and July 2002, respectively (Hall and Riggs, 2007). Due to degrading detectors on Aqua, however, it is common to analyze trends in snow cover from Terra alone. MODIS uses a cross-track scanner in its sun-synchronous orbit and has a 16-day ground track revisit, but its wide swath width provides a near daily temporal resolution (Barnes et al., 1998). MODIS has 36 non-continuous spectral bands ranging from 0.4 to 14.0 µm, with native resolutions from 250–1,000 m. There are seven visible to shortwave infrared bands in the range of wavelengths where snow is reflective. Operationally, NASA uses two of these, band 4 (0.545–0.565 µm) where snow is bright and band 6 (1.628–1.652 µm) where snow is dark, to map snow cover at 500 m resolution using the NDSI band ratio (Hall et al., 1995; Hall et al., 2002). The binary (snow/no snow) NDSI algorithm and the empirical NDSI fractional product are effective in identifying snow in homogeneous areas where the probability of mixed pixels is low, but in mountains the instantaneous field-of-view often incorporates reflected radiation from other land surface types, decreasing NDSI accuracy.
For this study, the MODSCAG algorithm was selected over NDSI because it uses all seven relevant spectral bands to leverage the unique reflectance signatures of different land surface types for spectral mixture analysis and sub-pixel snow mapping. The MODSCAG retrieval is described in detail in Painter et al., 2009; briefly, the spectral mixture analysis uses a set of simultaneous linear equations to solve for the land surface endmembers contributing to the atmospherically corrected surface reflectance in a pixel. Under the assumption of linear mixing, the relative contribution to the mixed spectral reflectance represents the abundance of that land surface type. To optimize spectral mixture analysis for snow, the reflectance of which is sensitive to sun angle and grain size, the MODSCAG endmember library includes simulated snow reflectance for a range of solar zenith angles (0–85o) and effective grain radii (10–1,100 μm at 10 μm intervals). Other endmembers include ice, soil/rock, vegetation, and photometric shade. Using the directional reflectance retrievals from MODIS/Terra (MOD09GA), MODSCAG produces fractional estimates of endmembers (e.g., snow fraction, vegetation fraction) and the grain size snow fraction for each pixel (Painter et al., 2009). The open-source dataset is distributed in near real-time through NASA’s snow data system at the Jet Propulsion Laboratory1.
The uncertainty of MODSCAG has been previously assessed in three cases using higher resolution (30 m) snow cover maps. The seminal publication (Painter et al., 2009) used 31 cloud free scenes primarily in the melt season from Landsat 5 and 7 with sensors TM and ETM + data in the California Sierra Nevada, the Rocky Mountains, the high plains of Colorado, and the Himalaya and found a pixel weighted RMSE of 5% ranging from 1 to 13% and precision, recall, and accuracy statistics all near unity. An assessment of methods for mapping snow with 172 Landsat scenes across the same regions but distributed throughout the year (including many scenes in October through December where NDSI based methods did not detect snow) resulted in an RMSE of 9% for MODSCAG (Rittger et al., 2013). These initial analyses used sensors (TM and ETM+) that frequently saturate over snow. The most recent analysis uses Landsat 8 OLI, which does not saturate, shows that MODSCAG is nearly unbiased with a mean bias of −0.5% (Rittger et al., 2021) compared to the previous bias of −7.6% (Rittger et al., 2013) in the Himalaya region. Other studies support the accuracy of spectral mixture analysis over other methods (Masson et al., 2018; Aalstad et al., 2020). Further validation of products based on MODSCAG are given below.
Because surface reflectance products from MODIS are susceptible to errors caused by cloud cover or sensor viewing geometry, the spatially and temporally complete (STC) algorithm includes filtering, smoothing, and snow/cloud discrimination to fill gaps in MODSCAG fSCA in both space and time (Dozier et al., 2008; Rittger et al., 2020). Specifically, data gaps and errors are identified using quality flags from the MOD09GA reflectance product. Next, a band-wise set of reflectance thresholds are used as a first pass to identify clouds and create an initial cloud mask. This cloud mask contains both false positives (FP) and false negatives (FN). FP pixels are generally a small subset of errors as clouds are much brighter in the shortwave infrared than all surface types including snow, vegetation and soils or rocks, therefore, a mixed pixel would appear darker. For a second pass on the cloud mask, FN pixels are identified (previously identified as not cloudy) by taking advantage of MODSCAG's simultaneous grain size retrieval. Specifically for pixels with a reasonable amount of snow (i.e. over a minimum fSCA threshold), the grain size is queried and pixels set to cloudy if the grain sizes are below a grain size threshold. To create the final cloud mask, MODSCAG's simultaneously retrieved vegetation fraction and soil/rock fraction are used to identify pixels that were previously identified (in the time dimension) as a combination of snow and vegetation but suddenly changed to a combination of snow and soil/rock, which indicate a pixel was misidentified (see Figure 3a in Rittger et al., 2020). The viewable snow cover is then masked with the final cloud mask. Next, the viewable snow cover is adjusted to snow on the ground with the vegetation fraction (Raleigh et al., 2013) from MODSCAG in areas with significant vegetation height (Simard et al., 2011).
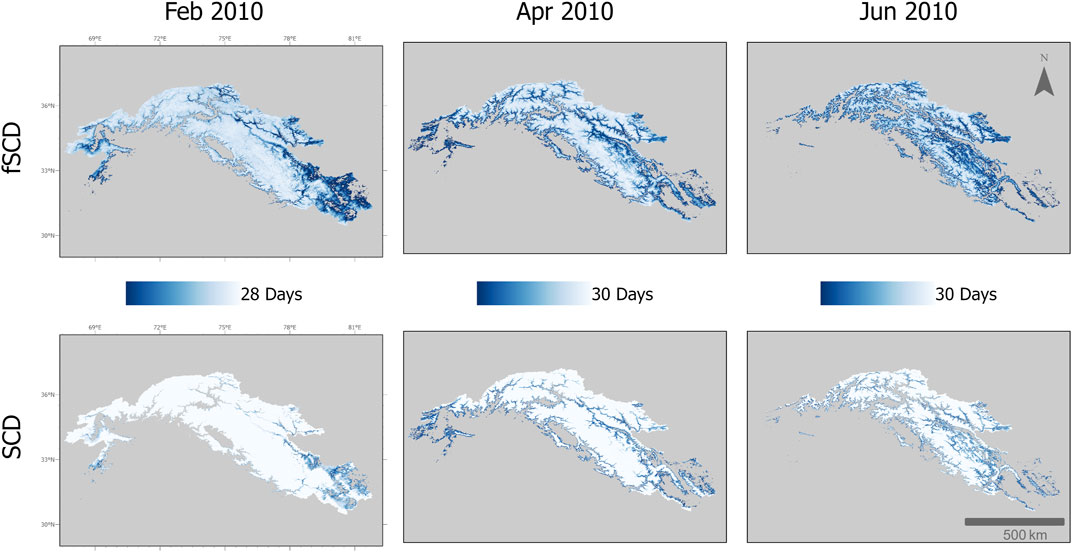
FIGURE 3. An example of binary snow-covered days and fractional snow-covered days from MODSCAG-STC for the year 2002 for the study area. A value of 365, represented by the color white, indicates snow cover at 15% or greater for SCD and a value of 100% snow cover for fSCD.
Finally, the resulting snow on the ground maps are interpolated, weighing the nadir observations more heavily than off-nadir (Dozier et al., 2008). The MODSCAG-STC data have been previously used for snow water equivalent reconstruction (SWE, Bair et al., 2016; Rittger et al., 2016), real-time estimates of SWE (Bair et al., 2018), to assess the impact of snow albedo on SWE (Bair et al., 2019), to validate regional climate modeling (Sarangi et al., 2019; Sarangi et al., 2020), and to assess the impacts of COVID lockdowns on snow albedo (Bair et al., 2021). The gap-filled dataset analyzed here uses MODIS surface reflectance inputs from Collection 5 from 2002 to 2010 (prior to degradation of the sensor and recalibration of the data) and surface reflectance inputs from Collection 6 after recalibration from 2011 to 2017. Error analysis of the gap filled products has shown an average bias of less than 5%, even for heavily forested regions (Rittger et al., 2020).
The 30-m ASTER GDEM V2 dataset was used to classify and assess data within specific elevation bands, an approach that has also been used by other studies in this region (Mishra et al., 2014; Tahir et al., 2016; Atif et al., 2018). The DEM was bilinearly resampled to align with the 500 m spatial resolution of MODIS. From the DEM we subset the topography into 1,000 m elevation bands, similar to previous studies (Maskey et al., 2011; Li et al., 2018), to further assess snow cover trends within each of the five study basins through time and by elevation (Basin-Scale Trends and Trends by Elevation Band).
Snow Covered Days
We used pixelwise snow-covered days (SCD) to assess annual trends in snow frequency over the MODIS record. This study is the first to apply and analyze fSCD from daily STC-MODSCAG data but has heritage in using binary SCD to monitor snow duration in the region (Paudel and Andersen, 2011; Zhang et al., 2012; Dedieu et al., 2014). Relative to prior studies, we also have a longer time period over which to assess trends (16 years of data). To compare our results to previous efforts, we carried out both a binary and a fractional analysis. The binary analysis (Figure 3) identified a pixel value greater than 15% as “snow” and a pixel value less than 15% as “no snow”. The 15% cutoff is based on the spectral mixture analysis detection limit (Painter et al., 2009). The count of all snow classified pixels was then used to determine annual snow cover trends for each year from 2002 to 2017. With this approach, a pixel value of 365 indicates persistent snow cover at any level above the cutoff within a year. To evaluate fractional snow-covered days (fSCD, Figure 3), the sum of all pixel values for a given year was again calculated with the 15% threshold applied. In this regard, a pixel value of 365 indicates 100% snow cover within a pixel for each day of the year. The difference between the two datasets is visually notable, and by leveraging MODSCAG’s capability to map fractional snow cover, it allows us to assess whether trends in snow cover vary when the analysis is carried out at the pixel or subpixel level. Both the median SCD and median fSCD are calculated on a monthly and annual scale for the entire study area as well as each of the six basins and each 1,000-m elevation band.
We used a modified Mann-Kendall test to determine interannual trends, while Sen’s slope was applied to assess the magnitude of the trend. The Mann-Kendall test is a robust, non-parametric test that is used to detect monotonic trends within a time series (Mann, 1945; Kendall, 1975). Because the Mann-Kendall test uses a rank-based process, it performs well when the data have a non-normal distribution and is commonly used to identify trends in hydrological records (Önöz and Bayazit, 2012). When determining the magnitude of the trend, Sen’s slope calculates a median slope between the data values. In comparison to ordinary least squares regression, which calculates the mean slope between data values, Sen’s slope is not as easily influenced by outliers that may be prevalent in small datasets, which pertains to the relatively short time span of the datasets in this study (Sen, 1968). The percentage of change for each metric is also estimated by multiplying the Sen’s slope by the time period and dividing by the respective mean SCD or fSCD (Yue and Hashino 2003; Duhan and Pandey, 2013). The Mann-Kendall test is also commonly used with small sample size datasets in the earth sciences (Hipel and McLeod, 2005). Both the Mann-Kendall test and Sen’s slope have been previously used in monitoring snow cover trends across HMA (Mishra et al., 2014; Tahir et al., 2016; Atif et al., 2018; Negi et al., 2018) and allowed a direct comparison of this work.
To account for autocorrelation within the time series, Hamed and Rao’s modified Mann-Kendall test was used, in which a variance correction approach was applied to the data (Hamed and Rao, 1998). This method is recommended for removing autocorrelation within a relatively short time series (Önöz and Bayazit, 2012). Additionally, to account for the seasonal variation inherent in the monthly data, the Seasonal Mann Kendall test was used to determine trends at the monthly scale (Hirsch and Slack 1984). The p-value at three levels (<0.01, <0.05, <0.10) was then used to identify significant interannual snow cover trends across HMA and across elevation bands, as well as per basin (Basin-Scale Trends) and per elevation band per basin (Trends by Elevation Band).
Results
Climatology
Across the study area, spanning all basins, the average snow cover duration is 102 fSCD. As would be expected based on climate patterns and previous work, average snow cover duration is longer in the western basins: Amu Darya (142 fSCD), Syr Darya (137 fSCD), and Indus (116 fSCD). Average snow cover duration in the eastern basins is shorter: Ganges (69 fSCD) and Brahmaputra (38 fSCD) (Figure 4). Maximum snow cover duration is found within the 7,000–8,000 m elevation band (262 fSCD; 0.03% of total area), and minimum snow cover duration is found within the 1,000–2,000 m elevation band (38 fSCD; 18.3% of total area). At the basin scale, the lowest elevation band has a longer duration in the Amu Darya (72 fSCD; 21.5% of basin) and Syr Darya (56 fSCD; 33.7% of basin) in comparison to the other basins that each have less than 30 fSCD at the same elevation. The longest snow cover duration increases in elevation from west to east and is found within the 5,000–6,000 m elevation band in the Syr Darya (237 fSCD; 0.01% of basin), within the 6,000–7,000 m elevation band in the Amu Darya (288 fSCD; 0.1% of basin) and the Indus (275 fSCD; 0.8% of basin), and within the 7,000–8,000 m elevation band in the Ganges (254 fSCD; 0.1% of basin) and the Brahmaputra (227 fSCD; <0.01% of basin).
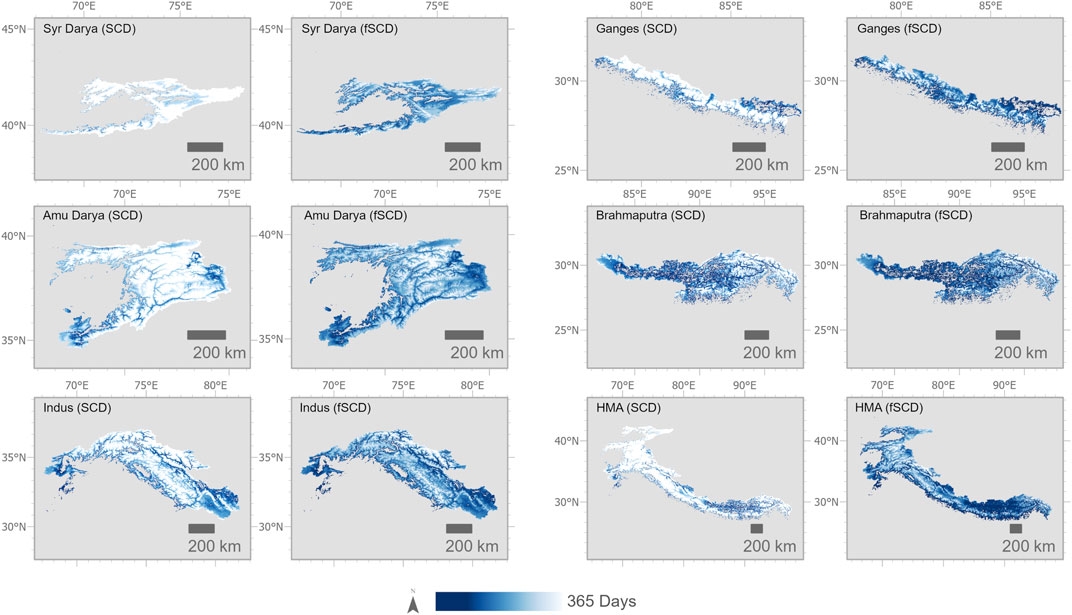
FIGURE 4. Snow covered days and fractional snow-covered days per basin from 2002 to 2017. Note the different y-axis for each basin or study plot.
The snow duration is consistently lower when analyzing fSCD relative to SCD by 64 days on average, showing that a binary approach overestimates snow duration. This tendency is expected considering the binary approach classifies partially snow-covered pixels (snow cover greater than or equal to 15%) as a fully snow-covered pixel, in comparison to a fractional analysis that retains the subpixel value. The difference between SCD and fSCD is highest in the Indus basin with a mean difference of 70 days and lowest in the Brahmaputra basin with a mean difference of 58 days. An example of this is shown in Figure 5, which displays a difference map between fSCD and SCD across all basins in 2009, when snow cover duration was high (118 fSCD), and in 2010, when snow cover duration was low (83 fSCD) relative to the full study period. Additionally, Figure 6 shows the difference between SCD and fSCD across the Indus basin during snowmelt at the monthly scale, specifically in February, April, and June. Although the general snow cover trend is captured annually by SCD, the patterns are exaggerated relative to fSCD, particularly at higher elevations.
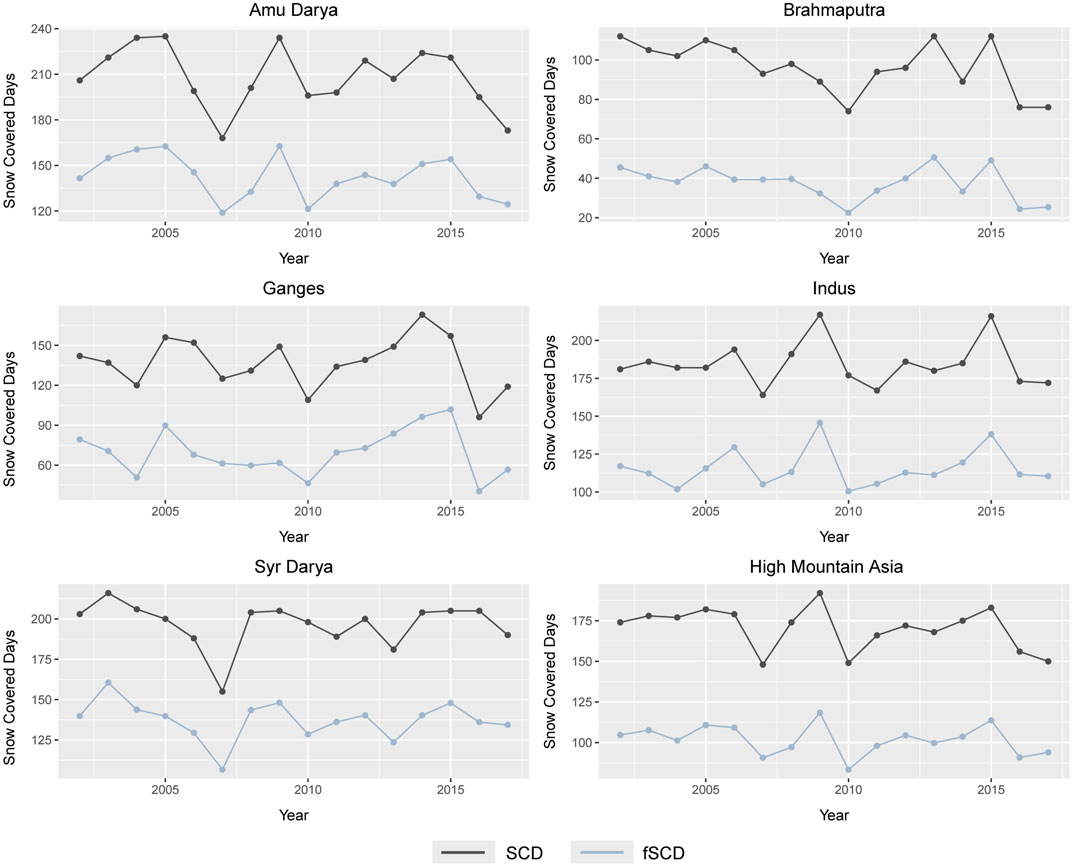
FIGURE 5. Difference maps between fSCD and SCD across the full study area in 2009, when snow cover duration was relatively high (118 fSCD) and in 2010, when snow cover duration was relatively low (83 fSCD). The dark blue pixels indicate areas where the largest differences are highlighting where binary SCD overestimates snow cover relative to fSCD.
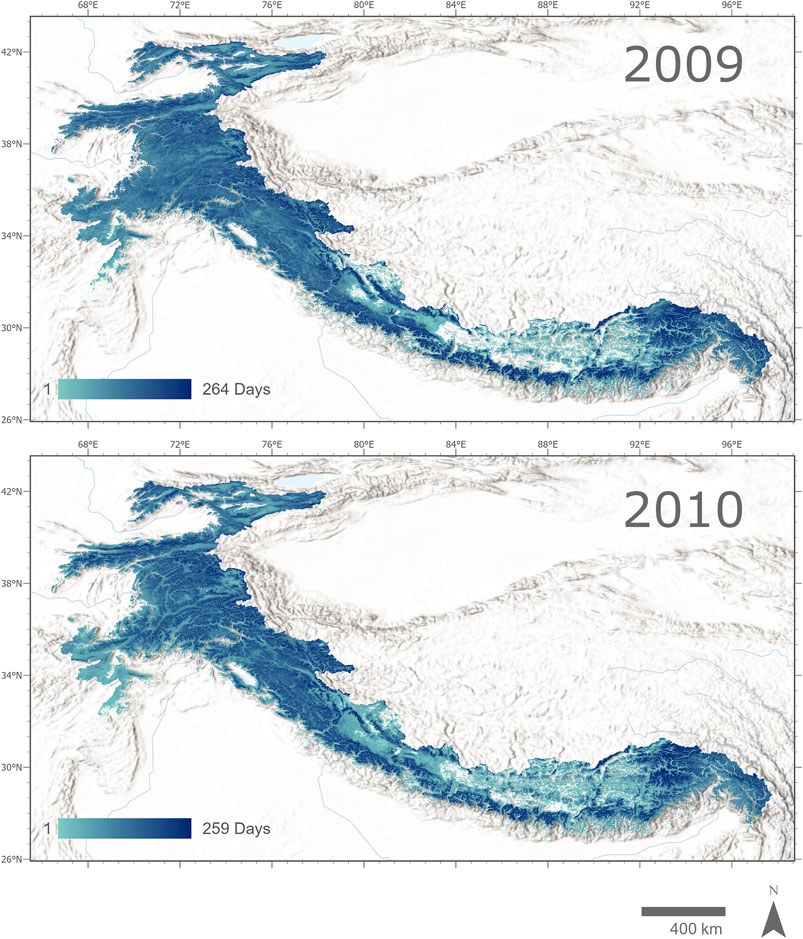
FIGURE 6. A sample of SCD and fSCD maps across the Indus basin that demonstrates the variation between the two metrics during the snowmelt season, specifically during the months of February, April, and June 2010.
Basin-Scale Trends
Changing snow cover duration over the period from 2002 to 2017 was determined for fSCD and SCD for each basin, and across all basins as a whole (Table 1). No significant trends were identified for annual or monthly fSCD at the broad spatial scale of the entire study region or at the basin scale. If only the binary SCD data is assessed, there is a statistically significant decline for the total extent of High Mountain Asia (Sen’s slope: −0.844). At the basin scale, annual SCD displayed a negative tendency in the Amu Darya and Brahmaputra basins, with the largest rate of decline in the Brahmaputra (Sen’s slope: −1.804). These negative trends in snow cover duration equate to a loss of 33 SCD in the Amu Darya, 36 SCD in the Brahmaputra, and 24 SCD across HMA over the 16-year study period. When assessing SCD at the monthly scale, there was not enough variation across the binary time series to be detectable, resulting in a stable trend (Sen’s slope: 0) for each study basin.
TABLE 1. Slope of annual and monthly SCD and fSCD for each basin and the total HMA region, including the associated percent change for each metric.
Trends by Elevation Band
Finer scale trends in snow cover duration become more evident when examining patterns across 1,000-m elevation bands (Table 2, Table 3, Table 4). The most western basin, the Syr Darya, and the most eastern basin, the Brahmaputra, are experiencing the greatest decline in snow cover at higher elevations for both fSCD and SCD (Table 2 and Table 3). The Syr Darya has a significant decrease in snow cover duration between 4,000–5,000 m (4% of the basin) for both metrics, resulting in a decrease of 13 fSCD and 24 SCD throughout the duration of the study period. This negative trend in the Syr Darya includes a wider range of elevations from 3,000–6,000 m (32.5% of Syr Darya) when assessing monthly trends for fSCD. Similarly, the Brahmaputra basin shows a decline in snow cover duration at many of the higher elevations (above 5,000 m for annual SCD and fSCD, and above 6,000 m for monthly fSCD, respectively 29.5% and 0.5% of the Brahmaputra). At the annual scale, the Brahmaputra experienced a decline of 31 fSCD and 60 SCD between 5,000–6,000 m during the study period (29% of Brahmaputra). In a like manner, the only trends across the total study area that prove to be statistically significant are negative and are only found at higher elevations, or above 4,000 m. This common pattern of decline in snow cover duration is occurring across the elevations that occupy a large percentage of area within the study region (46.9% of HMA), where the largest portion of the snowpack is found and where seasonal snowfall is necessary for sustaining glaciers.
TABLE 2. Slope of annual SCD per elevation band for each basin and the total HMA region, including the percent change in annual SCD.
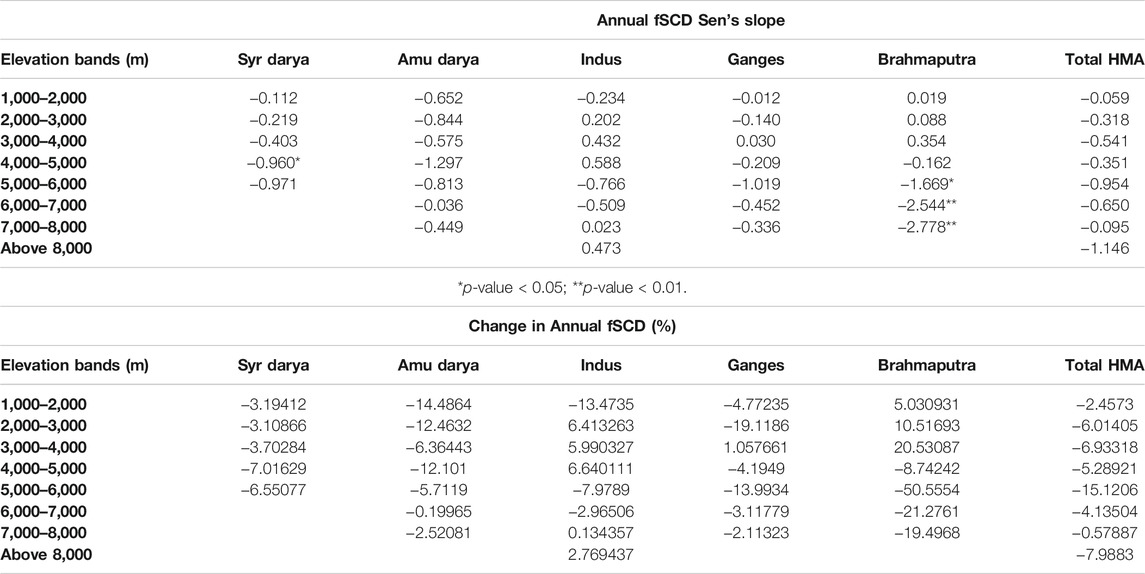
TABLE 3. Slope of annual fSCD per elevation band for each basin and the total HMA region, including the percent change in annual fSCD.
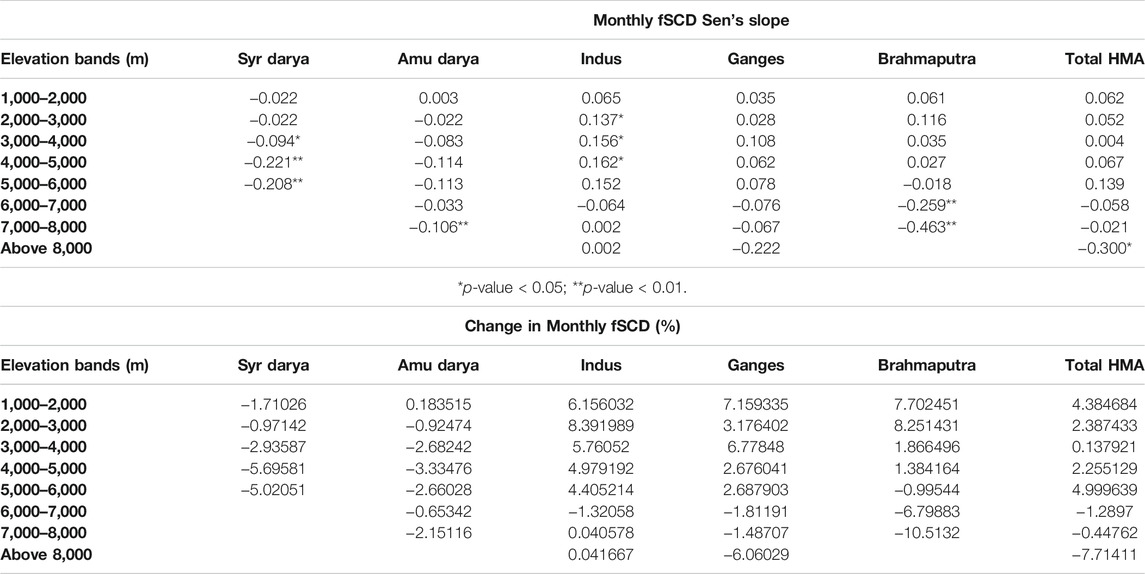
TABLE 4. Slope of monthly fSCD per elevation band for each basin and the total HMA region, including the percent change in annual SCD.
The trends in snow cover duration found within the central basins of the study area are not as clearly pronounced as the patterns found across the Syr Darya and Brahmaputra. For instance, annual SCD detected a significant negative trend in the Ganges basin between 5,000–8,000 m, and although fSCD had the same negative trend, it was not significant. The SCD trend corresponds with a decline of 31 SCD within 5,000–6,000 m, 44 SCD within 6,000–7,000 m, and 53 SCD within 7,000–8,000 m throughout the study period (19.3, 1.7, and 0.1% of Ganges, respectively). Likewise, monthly fSCD identified changes in snow cover within the Amu Darya and Indus basins, but SCD did not show a significant trend. According to monthly fSCD, the Amu Darya experienced a decrease in snow cover duration between 7,000–8,000 m (<0.01% of Amu Darya). Monthly fSCD also detected the only positive trend for this study in the Indus basin between 2,000–5,000 m (63% of Indus). In summary, negative trends were identified for annual SCD, annual fSCD, and monthly fSCD in the Syr Darya and Brahmaputra at higher elevations; in comparison, the Amu Darya and Ganges basins also experienced a decrease in snow cover duration at higher elevations, but the trend is not as easily identifiable (it was only observed within monthly fSCD and annual SCD, respectively). The Indus basin is the exception at the monthly fSCD scale, as it is the only basin to display a positive trend in snow cover duration.
As specified, both annual fSCD and SCD produce results that align with the monthly fSCD patterns across elevation bands. The monthly SCD results, however, require careful consideration. Again, monthly SCD results indicate no change in snow cover duration across each study area (Sen’s slope: 0) and, therefore, a table is not provided for this metric. These stable trends in monthly SCD are considered significant in the following elevation bands: Syr Darya between 4,000–5,000 m (4.2% of Syr Darya), Indus between 2,000–3,000 m and 5,000–6,000 m (36.6% of Indus), Ganges between 3,000–4,000 m (11.8% of Ganges), and HMA between 5,000–6,000 m (17.5% of HMA). Although such results may agree with the positive trends in monthly fSCD in the Indus, it directly contradicts the negative trends observed across the study area, particularly in the Syr Darya and HMA as a whole. According to the monthly SCD results, the Syr Darya has a stable trend between 4,000–5,000 m at a 95% confidence level, but when compared to the monthly fSCD analysis, the Syr Darya has a negative trend at this same elevation band with a confidence level of 99%. Similarly, in the Brahmaputra basin, annual SCD has a stable trend in snow cover within the 7,000–8,000 m elevation band at a 90% confidence level, compared to annual fSCD which has a negative trend at the same elevation with a confidence level of 99%. Not only does this higher confidence level indicate that snow cover duration in the Syr Darya and Brahmaputra is declining at these elevation bands rather than remaining constant, but it also displays MODSCAG’s ability to detect trends on a sub-pixel level that SCD could not.
Discussion
By assessing patterns in snow cover duration, we can gather a greater understanding of how changes in climate and other factors that impact snow energy balance, such as deposition of light absorbing particles, may be impacting snow cover in this region. Overall, the general trends across HMA indicate shorter snow cover duration, which reinforce previous conclusions that SCA is declining across this broad mountainous region (Gurung et al., 2017; Singh et al., 2018). The significant trends in annual fSCD and SCD are negative and occur above 4,000 m.
The results from both fSCD and SCD align with the observations of previous studies showing the highest rate of SCA decline in the eastern basins of HMA (Singh et al., 2014; Gurung et al., 2017). Both the Ganges and Brahmaputra show stronger declining trends, in both fSCD and SCD, with increases in elevation. Other studies have also concluded that the central and eastern region, specifically Bhutan and Nepal, are more likely to experience increased temperatures and less precipitation at higher elevations (Mishra et al., 2014; Li et al., 2018). Thus, in addition to the already declining snowpack at lower elevations, mountain ranges at higher elevations, particularly in the eastern HMA, are even more susceptible to changes in climate (Beniston, 2003; Bradley et al., 2006).
As basins in the northwestern Himalaya have experienced warmer winters (Bhutiyani et al., 2007; Singh et al., 2015), the proportion of precipitation that falls as snow continues to decrease (Negi et al., 2018). Although patterns vary throughout the Syr Darya and Amu Darya at the subbasin scale, the temperature and precipitation changes generally lead to less snow accumulation as well as an earlier snowmelt, which in combination leads to a shorter annual duration of snow cover (Dedieu et al., 2014; Dietz et al., 2014). Previous work that focused on the northwestern basins could not determine a significant trend in SCA over a 10-year study period (Rathore et al., 2018; Singh et al., 2018); however, in agreement with our 16-year study, other more recent work (Negi et al., 2018) also determined that a decrease in snow cover is occurring over this part of HMA when time periods of at least 15 years are considered. Similarly, when extending the time period even further, from 1986 to 2008, a decline in snow cover was identified above 4,000 m using AVHRR and MODIS data (Zhou et al., 2013). Likewise, Aizen et al. (1997) observed a decrease of 9 days in snow cover duration in this region when observing ground station data in the Tien Shan from 1940 to 1991. As this study’s metrics have consistently observed a decrease in snow cover duration in the Syr Darya, future work should continue to use a sufficient length of time to monitor snow cover in this part of HMA that is not as well researched (Unger-Shayesteh et al., 2013; Dedieu et al., 2014).
The Indus basin is of particular interest, as it is the only basin to reflect positive trends in snow cover duration. Other studies have also found that the Indus is either stable or slightly increasing in snow cover (Singh et al., 2014; Tahir et al., 2016). This increasing tendency may be due to stronger influences from the westerlies (Archer and Fowler, 2004), along with a decreasing trend in temperature in the Karakoram and portions of the western Himalayan region (Fowler and Archer, 2006; Gusain; Mishra, and Bhutiyani, 2014). Indeed, the positive trend in snow cover frequency within the 2,000–5,000 m elevation band may be due to the central Karakoram, which has a mean elevation of 4,650 m and a reported increasing trend in snow cover (Atif et al., 2018). Singh et al. (2018) also observed a significant increase in snow cover from 2001 to 2016 when only considering the Karakoram region. Other studies noted varying snow cover trends at sub-basins within the Indus, including a decrease in snow cover during the winter (Immerzeel et al., 2009; Hasson et al., 2014). Thus, in order to fully observe the differing climatic influences in the Indus and the direct impact on snow cover, further work should include monitoring the Indus on a sub-basin scale.
Indeed, the decrease in snow cover duration across High Mountain Asia is a broad scale assessment that could be further refined in future work by considering trends at smaller spatial scales across each basin in the study area. For instance, glaciers have been shrinking at a slower rate at higher elevations in the Pamir and the Tien Shan mountain ranges compared to glaciers found in the lower elevations of the outer Pamir (Unger-Shayesteh et al., 2013; Hoelzle et al., 2019). Generalizing trends across the Syr Darya and Amu Darya, therefore, does not capture the full variability across varying aspects and other topographic controls. The trends observed here across elevation bands indicate that an increased rate of warming does have more of an impact at higher elevations (Pepin et al., 2015), but there is still potential to identify more localized trends across each basin to better understand the spatial variability across such complex terrain.
Conclusion
Both fSCD and SCD were evaluated to determine monthly and annual snow cover trends across basins and elevation bands in the HMA region. The binary SCD analysis overestimated snow cover and produced different trends relative to fSCD at all scales analyzed, although the general patterns remained consistent. Declining trends for snow cover duration and snow cover extent were observed across the entire study area, while individual basins did not show many significant trends averaged across all elevations. The longest duration of snow cover persists among the westerly-influenced basins, specifically the Syr Darya, Amu Darya, and Indus basins. The highest rate of decline is found at higher elevations, particularly within the Syr Darya and Brahmaputra basins. The Indus is the only basin to display an increasing tendency, which may reflect anomalies in this region, including the positive precipitation trends in the Karakoram. Ideally, this analysis would include a longer time series, but for a daily analysis at a scale that is relevant for processes in complex terrain, MODIS remains the best option. This study could be extended as the MODIS record becomes longer, and it could also be supplemented by other optical platforms like VIIRS and/or Sentinel (Gascoin et al., 2017). Comparing these results to datasets with relatively longer records, including passive microwave data, may also be worth considering. Overall, each statistically significant trend indicates a general decline in snow cover duration. This shortening timespan of snow accumulation and snowmelt should continue to be monitored as millions of people continue to depend on these water resources.
Data Availability Statement
Publicly available datasets were analyzed in this study. This data can be found here: The MODIS product used in this study, MODSCAG, is publicly distributed through NASA-JPL's snow data system. https://snow-data.jpl.nasa.gov/modscag.
Author Contributions
CA and MS conceptualized the overall study. KR provided and consulted on the remote sensing dataset that was analyzed, and JM assisted in preparing data for analysis. MS provided financial support for the study. CA wrote the first draft of the manuscript, which was then contributed to by all authors.
Conflict of Interest
The authors declare that the research was conducted in the absence of any commercial or financial relationships that could be construed as a potential conflict of interest.
Publisher’s Note
All claims expressed in this article are solely those of the authors and do not necessarily represent those of their affiliated organizations, or those of the publisher, the editors and the reviewers. Any product that may be evaluated in this article, or claim that may be made by its manufacturer, is not guaranteed or endorsed by the publisher.
Footnotes
1https://snow.jpl.nasa.gov/portal/data/help_modscag
References
Aalstad, K., Westermann, S., and Bertino, L. (2020). Evaluating Satellite Retrieved Fractional Snow-Covered Area at a High-Arctic Site Using Terrestrial Photography. Remote Sensing Environ. 239, 111618. doi:10.1016/j.rse.2019.111618
Aizen, V. B., Aizen, E. M., Melack, J. M., and Dozier, J. (1997). Climatic and Hydrologic Changes in the Tien Shan, Central Asia. J. Clim. 10 (6), 1393–1404. doi:10.1175/15200442(1997)010<1393:CAHCIT>2.0.CO;2
Archer, D. R., and Fowler, H. J. (2004). Spatial and Temporal Variations in Precipitation in the Upper Indus Basin, Global Teleconnections and Hydrological Implications. Hydrol. Earth Syst. Sci. 8, 47–61. doi:10.5194/hess-8-47-2004
Atif, I., Iqbal, J., and Mahboob, M. (2018). Investigating Snow Cover and Hydrometeorological Trends in Contrasting Hydrological Regimes of the Upper Indus basin. Atmosphere 9, 162. doi:10.3390/atmos9050162
Bair, E. H., Abreu Calfa, A., Rittger, K., and Dozier, J. (2018). Using Machine Learning for Real-Time Estimates of Snow Water Equivalent in the Watersheds of Afghanistan. The Cryosphere 12 (5), 1579–1594. doi:10.5194/tc-12-1579-2018
Bair, E. H., Rittger, K., Davis, R. E., Painter, T. H., and Dozier, J. (2016). Validating Reconstruction of Snow Water Equivalent in California's Sierra Nevada Using Measurements from the NASAAirborne Snow Observatory. Water Resour. Res. 52, 8437–8460. doi:10.1002/2016WR018704
Bair, E. H., Rittger, K., Skiles, S. M., and Dozier, J. (2019). An Examination of Snow Albedo Estimates from MODIS and Their Impact on Snow Water Equivalent Reconstruction. Water Resour. Res. 55, 7826–7842. doi:10.1029/2019WR024810
Bair, E., Stillinger, T., Rittger, K., and Skiles, M. (2021). COVID-19 Lockdowns Show Reduced Pollution on Snow and Ice in the Indus River Basin. Proc. Natl. Acad. Sci. USA 118, e2101174118. doi:10.1073/pnas.2101174118
Barnes, W. L., Pagano, T. S., and Salomonson, V. V. (1998). Prelaunch Characteristics of the Moderate Resolution Imaging Spectroradiometer (MODIS) on EOS-AM1. IEEE Trans. Geosci. Remote Sensing 36, 1088–1100. doi:10.1109/36.700993
Barnett, T. P., Adam, J. C., and Lettenmaier, D. P. (2005). Potential Impacts of a Warming Climate on Water Availability in Snow-Dominated Regions. Nature 438, 303–309. doi:10.1038/nature04141
Beniston, M., and Diaz, H. F. (2003). “Climatic Change in Mountain Regions: a Review of Possible Impacts,” in Climate Variability and Change in High Elevation Regions: Past, Present & Future (Springer), 5–31. doi:10.1007/978-94-015-1252-7_2
Bhutiyani, M. R., Kale, V. S., and Pawar, N. J. (2007). Long-term Trends in Maximum, Minimum and Mean Annual Air Temperatures across the Northwestern Himalaya during the Twentieth century. Climatic Change 85, 159–177. doi:10.1007/s10584-006-9196-1
Bollasina, M. A., Ming, Y., and Ramaswamy, V. (2011). Anthropogenic Aerosols and the Weakening of the South Asian Summer Monsoon. Science 334, 502–505. doi:10.1126/science.1204994
Bookhagen, B., and Burbank, D. W. (2010). Toward a Complete Himalayan Hydrological Budget: Spatiotemporal Distribution of Snowmelt and Rainfall and Their Impact on River Discharge. J. Geophys. Res. 115, F03019. doi:10.1029/2009jf001426
Bradley, R. S., Vuille, M., Diaz, H. F., and Vergara, W. (2006). CLIMATE CHANGE: Threats to Water Supplies in the Tropical Andes. Science 312, 1755–1756. doi:10.1126/science.1128087
Dedieu, J. P., Lessard-Fontaine, A., Ravazzani, G., Cremonese, E., Shalpykova, G., and Beniston, M. (2014). Shifting Mountain Snow Patterns in a Changing Climate from Remote Sensing Retrieval. Sci. Total Environ. 493, 1267–1279. doi:10.1016/j.scitotenv.2014.04.078
Dietz, A., Conrad, C., Kuenzer, C., Gesell, G., and Dech, S. (2014). Identifying Changing Snow Cover Characteristics in central Asia between 1986 and 2014 from Remote Sensing Data. Remote Sensing 6, 12752–12775. doi:10.3390/rs61212752
Dozier, J., Painter, T. H., Rittger, K., and Frew, J. E. (2008). Time-space Continuity of Daily Maps of Fractional Snow Cover and Albedo from MODIS. Adv. Water Resour. 31, 1515–1526. doi:10.1016/j.advwatres.2008.08.011
Duhan, D., and Pandey, A. (2013). Statistical Analysis of Long Term Spatial and Temporal Trends of Precipitation during 1901-2002 at Madhya Pradesh, India. Atmos. Res. 122, 136–149. doi:10.1016/j.atmosres.2012.10.010
Farinotti, D., Immerzeel, W. W., de Kok, R. J., Quincey, D. J., and Dehecq, A. (2020). Manifestations and Mechanisms of the Karakoram Glacier Anomaly. Nat. Geosci. 13, 8–16. doi:10.1038/s41561-019-0513-5
Fowler, H. J., and Archer, D. R. (2006). Conflicting Signals of Climatic Change in the Upper Indus Basin. J. Clim. 19, 4276–4293. doi:10.1175/JCLI3860.1
Gascoin, S., Guðmundsson, S., Aðalgeirsdóttir, G., Pálsson, F., Schmidt, L., Berthier, E., et al. (2017). Evaluation of MODIS Albedo Product over Ice Caps in Iceland and Impact of Volcanic Eruptions on Their Albedo. Remote Sensing 9, 399. doi:10.3390/rs9050399
Gurung, D. R., Kulkarni, A. V., Giriraj, A., Aung, K. S., Shrestha, B., and Srinivasan, J. (2011). Changes in Seasonal Snow Cover in Hindu Kush-Himalayan Region. Cryosphere Discuss. 5, 755–777. doi:10.5194/tcd-5-755-2011
Gurung, D. R., Maharjan, S. B., Shrestha, A. B., Shrestha, M. S., Bajracharya, S. R., and Murthy, M. S. R. (2017). Climate and Topographic Controls on Snow Cover Dynamics in the Hindu Kush Himalaya. Int. J. Climatol. 37, 3873–3882. doi:10.1002/joc.4961
Hall, A., and Qu, X. (2006). Using the current seasonal cycle to constrain snow Albedo Feedback in Future Climate Change. Geophys. Res. Lett. 33. doi:10.1029/2005gl025127
Hall, D. K., Riggs, G. A., Foster, J. L., and Kumar, S. V. (2010). Development and Evaluation of a cloud-gap-filled MODIS Daily Snow-Cover Product. Remote Sensing Environ. 114, 496–503. doi:10.1016/j.rse.2009.10.007
Hall, D. K., Riggs, G. A., and Salomonson, V. V. (1995). Development of Methods for Mapping Global Snow Cover Using Moderate Resolution Imaging Spectroradiometer Data. Remote Sensing Environ. 54, 127–140. doi:10.1016/0034-4257(95)00137-P
Hall, D. K., Riggs, G. A., Salomonson, V. V., DiGirolamo, N. E., and Bayr, K. J. (2002). MODIS Snow-Cover Products. Remote Sensing Environ. 83, 181–194. doi:10.1016/S0034-4257(02)00095-0
Hamed, K. H., and Ramachandra Rao, A. (1998). A Modified Mann-Kendall Trend Test for Autocorrelated Data. J. Hydrol. 204, 182–196. doi:10.1016/S0022-1694(97)00125-X
Hartmann, D. L., Tank, A. M. G. K., Rusticucci, M., Alexander, L. V., Brönnimann, S., Charabi, Y. A. R., et al. (2013). “Observations: Atmosphere and Surface,” in Climate Change 2013 the Physical Science Basis: Working Group I Contribution to the Fifth Assessment Report of the Intergovernmental Panel on Climate Change (Cambridge University Press)
Hasson, S., Lucarini, V., Khan, M. R., Petitta, M., Bolch, T., and Gioli, G. (2014). Early 21st century Snow Cover State over the Western River Basins of the Indus River System. Hydrol. Earth Syst. Sci. 18, 4077–4100. doi:10.5194/hess-18-4077-2014
Hipel, K. W., and McLeod, A. I. (2005). Nonparametric Tests for Trend Detection. Time Ser. Model. Water Resour. Environ. Syst., 853–938. doi:10.1016/S0167‐5648(08)70688‐9
Hirsch, R. M., and Slack, J. R. (1984). A Nonparametric Trend Test for Seasonal Data with Serial Dependence. Water Resour. Res. 20, 727–732. doi:10.1029/WR020i006p00727
Hoelzle, M., Barandun, M., Bolch, T., Fiddes, J., Gafurov, A., Muccione, V., et al. (2019). “The Status and Role of the alpine Cryosphere in Central Asia,” in The Aral Sea Basin (Taylor & Francis). doi:10.4324/9780429436475-8
Immerzeel, W. W., Droogers, P., de Jong, S. M., and Bierkens, M. F. P. (2009). Large-scale Monitoring of Snow Cover and Runoff Simulation in Himalayan River Basins Using Remote Sensing. Remote Sensing Environ. 113, 40–49. doi:10.1016/j.rse.2008.08.010
Klein, A., and Barnett, A. C. (2003). Validation of Daily MODIS Snow Cover Maps of the Upper Rio Grande River Basin for the 2000-2001 Snow Year. Remote Sensing Environ. 86, 162–176. doi:10.1016/s0034-4257(03)00097-x
Kripalani, R. H., Kulkarni, A., and Sabade, S. S. (2003). Western Himalayan Snow Cover and Indian Monsoon Rainfall: A Re-examination with INSAT and NCEP/NCAR Data. Theor. Appl. Climatology 74, 1–18. doi:10.1007/s00704-002-0699-z
Li, C., Su, F., Yang, D., Tong, K., Meng, F., and Kan, B. (2018). Spatiotemporal Variation of Snow Cover over the Tibetan Plateau Based on MODIS Snow Product, 2001-2014. Int. J. Climatol 38, 708–728. doi:10.1002/joc.5204
Mann, H. B. (1945). Nonparametric Tests against Trend. Econometrica 13, 245–259. doi:10.2307/1907187
Maskey, S., Uhlenbrook, S., and Ojha, S. (2011). An Analysis of Snow Cover Changes in the Himalayan Region Using MODIS Snow Products and Iin-Ssitu Temperature Data. Climatic Change 108, 391–400. doi:10.1007/s10584-011-0181-y
Masson, T., Dumont, M., Mura, M., Sirguey, P., Gascoin, S., Dedieu, J.-P., et al. (2018). An Assessment of Existing Methodologies to Retrieve Snow Cover Fraction from MODIS Data. Remote Sensing 10, 619. doi:10.3390/rs10040619
Menon, S., Koch, D., Beig, G., Sahu, S., Fasullo, J., and Orlikowski, D. (2010). Black Carbon Aerosols and the Third Polar Ice Cap. Atmos. Chem. Phys. 10, 4559–4571. doi:10.5194/acp-10-4559-2010
Mishra, B., Babel, M. S., and Tripathi, N. K. (2014). Analysis of Climatic Variability and Snow Cover in the Kaligandaki River Basin, Himalaya, Nepal. Theor. Appl. Climatol. 116, 681–694. doi:10.1007/s00704-013-0966-1
Mishra, S. K., Hayse, J., Veselka, T., Yan, E., Kayastha, R. B., LaGory, K., et al. (2018). An Integrated Assessment Approach for Estimating the Economic Impacts of Climate Change on River Systems: An Application to Hydropower and Fisheries in a Himalayan River, Trishuli. Environ. Sci. Pol. 87, 102–111. doi:10.1016/j.envsci.2018.05.006
Negi, H. S., Kanda, N., Shekhar, M. S., and Ganju, A. (2018). Recent Wintertime Climatic Variability over the North West Himalayan Cryosphere. Curr. Sci. 114, 760–770. doi:10.18520/cs/v114/i04/760-770
Önöz, B., and Bayazit, M. (2012). Block Bootstrap for Mann-Kendall Trend Test of Serially Dependent Data. Hydrol. Process. 26, 3552–3560. doi:10.1002/hyp.8438
Painter, T. H., Dozier, J., Roberts, D. A., Davis, R. E., and Green, R. O. (2003). Retrieval of Subpixel Snow-Covered Area and Grain Size from Imaging Spectrometer Data. Remote Sensing Environ. 85, 64–77. doi:10.1016/S0034-4257(02)00187-6
Painter, T. H., Rittger, K., McKenzie, C., Slaughter, P., Davis, R. E., and Dozier, J. (2009). Retrieval of Subpixel Snow Covered Area, Grain Size, and Albedo from MODIS. Remote Sensing Environ. 113, 868–879. doi:10.1016/j.rse.2009.01.001
Palazzi, E., von Hardenberg, J., and Provenzale, A. (2013). Precipitation in the Hindu-Kush Karakoram Himalaya: Observations and Future Scenarios. J. Geophys. Res. Atmos. 118, 85–100. doi:10.1029/2012jd018697
Panday, P. K., Frey, K. E., and Ghimire, B. (2011). Detection of the Timing and Duration of Snowmelt in the Hindu Kush-Himalaya Using QuikSCAT, 2000-2008. Environ. Res. Lett. 6, 024007. doi:10.1088/1748-9326/6/2/024007
Paudel, K. P., and Andersen, P. (2011). Monitoring Snow Cover Variability in an Agropastoral Area in the Trans Himalayan Region of Nepal Using MODIS Data with Improved Cloud Removal Methodology. Remote Sensing Environ. 115, 1234–1246. doi:10.1016/j.rse.2011.01.006
Pepin, N., Bradley, R. S., DiazBaraer, H. F. M., Caceres, E. B., Forsythe, N., Fowler, H., et al. (2015). Elevation-dependent Warming in Mountain Regions of the World. Nat. Clim. Change 5 (5), 424–430. doi:10.1038/nclimate2563
Raleigh, M. S., Rittger, K., Moore, C. E., Henn, B., Lutz, J. A., and Lundquist, J. D. (2013). Ground-based Testing of MODIS Fractional Snow Cover in Subalpine Meadows and Forests of the Sierra Nevada. Remote Sensing Environ. 128, 44–57. doi:10.1016/j.rse.2012.09.016
Rathore, B. P., Bahuguna, I. M., Singh, S. K., Brahmbhatt, R. M., Randhawa, S. S., Jani, P., et al. (2018). Trends of Snow Cover in Western and West-Central Himalayas during 2004-2014. Curr. Sci. 114, 800–807. doi:10.18520/cs/v114/i04/800-807
Rittger, K., Bair, E. H. E., Kahl, A., and Dozier, J. (2016). Spatial Estimates of Snow Water Equivalent from Reconstruction. Adv. Water Resour. 94, 345–363. doi:10.1016/j.advwatres.2016.05.015
Rittger, K., Bormann, K. J., Bair, E. H., Dozier, J., and Painter, T. H. (2021). Evaluation of VIIRS and MODIS Snow Cover Fraction in High-Mountain Asia Using Landsat 8 OLI. Front. Remote Sens. 2, 8. doi:10.3389/frsen.2021.647154
Rittger, K., Painter, T. H., and Dozier, J. (2013). Assessment of Methods for Mapping Snow Cover from MODIS. Adv. Water Resour. 51, 367–380. doi:10.1016/j.advwatres.2012.03.002
Rittger, K., Raleigh, M. S., Dozier, J., Hill, A. F., Lutz, J. A., and Painter, T. H. (2020). Canopy Adjustment and Improved Cloud Detection for Remotely Sensed Snow Cover Mapping. Water Resour. Res. 56, e2019WR024914. doi:10.1029/2019WR024914
Salomonson, V. V., and Appel, I. (2004). Development of the Aqua MODIS NDSI Fractional Snow Cover Algorithm and Validation Results. IEEE Trans. Geosci. Remote Sensing 44, 1747–1756. doi:10.1109/TGRS.2006.876029
Sarangi, C., Qian, Y., Rittger, K., Bormann, K. J., Liu, Y., Wang, H., et al. (2019). Impact of Light-Absorbing Particles on Snow Albedo Darkening and Associated Radiative Forcing over High-Mountain Asia: High-Resolution WRF-Chem Modeling and New Satellite Observations. Atmos. Chem. Phys. 19, 7105–7128. doi:10.5194/acp-19-7105-2019
Sarangi, C., Qian, Y., Rittger, K., Ruby Leung, L., Chand, D., Bormann, K. J., et al. (2020). Dust Dominates High-Altitude Snow Darkening and Melt over High-Mountain Asia. Nat. Clim. Chang. 10, 1045–1051. doi:10.1038/s41558-020-00909-3
Sen, P. K. (1968). Estimates of the Regression Coefficient Based on Kendall's Tau. J. Am. Stat. Assoc. 63, 1379–1389. doi:10.1080/01621459.1968.10480934
Shukla, P., Skea, J., Calvo Buendia, E., Masson-Delmotte, V., Pörtner, H., Roberts, D., et al. (2019). IPCC, 2019: Climate Change and Land: An IPCC Special Report on Climate Change, Desertification, Land Degradation, Sustainable Land Management, Food Security, and Greenhouse Gas Fluxes in Terrestrial Ecosystems.
Simard, M., Pinto, N., Fisher, J. B., and Baccini, A. (2011). Mapping forest Canopy Height Globally with Spaceborne Lidar. J. Geophys. Res. 116. doi:10.1029/2011jg001708
Singh, D. K., Gusain, H. S., Mishra, V., and Gupta, N. (2018). Snow Cover Variability in North-West Himalaya during Last Decade. Arab. J. Geosci. 11, 579. doi:10.1007/s12517-018-3926-3
Singh, D., Sharma, V., and Juyal, V. (2015). Observed Linear Trend in Few Surface Weather Elements over the Northwest Himalayas (NWH) during winter Season. J. Earth Syst. Sci. 124, 553–565. doi:10.1007/s12040-015-0560-2
Singh, S. K., Rathore, B. P., Bahuguna, I. M., and Ajai, (2014). Snow Cover Variability in the Himalayan-Tibetan Region. Int. J. Climatol. 34 (2), 446–452. doi:10.1002/joc.3697
Skiles, S. M., Flanner, M., Cook, J. M. J., Dumont, M., and Painter, T. H. (2018). Radiative Forcing by Light-Absorbing Particles in Snow. Nat. Clim Change 8, 964–971. doi:10.1038/s41558-018-0296-5
Tahir, A. A., Adamowski, J. F., Chevallier, P., Haq, A. U., and Terzago, S. (2016). Comparative Assessment of Spatiotemporal Snow Cover Changes and Hydrological Behavior of the Gilgit, Astore and Hunza River Basins (Hindukush-Karakoram-Himalaya Region, Pakistan). Meteorol. Atmos. Phys. 128, 793–811. doi:10.1007/s00703-016-0440-6
Tahir, A. A., Chevallier, P., Arnaud, Y., and Ahmad, B. (2011). Snow Cover Dynamics and Hydrological Regime of the Hunza River basin, Karakoram Range, Northern Pakistan. Hydrol. Earth Syst. Sci. 15, 2275–2290. doi:10.5194/hess-15-2275-2011
Tahir, A. A., Chevallier, P., Arnaud, Y., Ashraf, M., and Bhatti, M. T. (2015). Snow Cover Trend and Hydrological Characteristics of the Astore River basin (Western Himalayas) and its Comparison to the Hunza basin (Karakoram Region). Sci. Total Environ. 505, 748–761. doi:10.1016/j.scitotenv.2014.10.065
Tang, Z., Wang, J., Li, H., and Yan, L. (2013). Spatiotemporal Changes of Snow Cover over the Tibetan Plateau Based on Cloud-Removed Moderate Resolution Imaging Spectroradiometer Fractional Snow Cover Product from 2001 to 2011. J. Appl. Remote Sens. 7, 073582. doi:10.1117/1.JRS.7.073582
Unger-Shayesteh, K., Vorogushyn, S., Farinotti, D., Gafurov, A., Duethmann, D., Mandychev, A., et al. (2013). What Do We Know about Past Changes in the Water Cycle of Central Asian Headwaters? A Review. Glob. Planet. Change 110, 4–25. doi:10.1016/j.gloplacha.2013.02.004
Wang, L., Qu, J. J., Xiong, X., Hao, X., Xie, Y., and Che, N. (2006). A New Method for Retrieving Band 6 of Aqua MODIS. Remote Sens. Lett. 3, 267–270. doi:10.1109/LGRS.2006.869966
Xu, J., Shrestha, A., Vaidya, R., Eriksson, M., and Hewitt, K. (2007). The Melting Himalayas: Regional Challenges and Local Impacts of Climate Change on Mountain Ecosystems and Livelihoods. Kathmandu, Nepal: International Center for Integrated Mountain Development.
Yue, S., and Hashino, M. (2003). Long Term Trends of Annual and Monthly Precipitation in Japan1. JAWRA J. Am. Water Resour. Assoc. 39 (3), 587–596. doi:10.1111/j.1752-1688.2003.tb03677.x
Zhang, G., Xie, H., Yao, T., Liang, T., and Kang, S. (2012). Snow Cover Dynamics of Four lake Basins over Tibetan Plateau Using Time Series MODIS Data (2001-2010). Water Resour. Res. 48, W10529. doi:10.1029/2012wr011971
Keywords: snow, snowmelt, remote sensing, high mountain asia (HMA), MODIS
Citation: Ackroyd C, Skiles SM, Rittger K and Meyer J (2021) Trends in Snow Cover Duration Across River Basins in High Mountain Asia From Daily Gap-Filled MODIS Fractional Snow Covered Area. Front. Earth Sci. 9:713145. doi: 10.3389/feart.2021.713145
Received: 21 May 2021; Accepted: 30 August 2021;
Published: 21 September 2021.
Edited by:
Anna-Kaisa Ronkanen, Finnish Environment Institute (SYKE), FinlandCopyright © 2021 Ackroyd, Skiles, Rittger and Meyer. This is an open-access article distributed under the terms of the Creative Commons Attribution License (CC BY). The use, distribution or reproduction in other forums is permitted, provided the original author(s) and the copyright owner(s) are credited and that the original publication in this journal is cited, in accordance with accepted academic practice. No use, distribution or reproduction is permitted which does not comply with these terms.
*Correspondence: S. McKenzie Skiles, bS5za2lsZXNAZ2VvZy51dGFoLmVkdQ==; Chelsea Ackroyd, Y2hlbHNlYS5hY2tyb3lkQHV0YWguZWR1