 Shuqin Zhang1,2,3,4
 Chunlei Liu2,4*
 Jianjun Xu2,4Shaojing Zhang1,2Ruoying Tang5Zhefan Huang1Yanzhu Zheng1Zhuoqiang Guan1Hongfei Mao6*Yufeng Xue1,2,3,4*
- 1College of Ocean and Meteorology, Guangdong Ocean University, Zhanjiang, China
- 2South China Sea Institute of Marine Meteorology, Guangdong Ocean University, Zhanjiang, China
- 3Key Laboratory of Climate, Resources and Environment in Continental Shelf Sea and Deep Sea of Department of Education of Guangdong Province, Guangdong Ocean University, Zhanjiang, China
- 4CMA-GDOU Joint Laboratory for Marine Meteorology, Zhanjiang, China
- 5College of Coastal Agricultural Sciences, Guangdong Ocean University, Zhanjiang, China
- 6College of Ocean Engineering, Guangdong Ocean University, Zhanjiang, China
Contributions of different physical processes to the development of a super explosive cyclone (SEC) migrating over the Gulf Stream with the maximum deepening rate of 3.45 Bergeron were investigated using the ERA5 atmospheric reanalysis from European Centre for Medium-Range Weather Forecasts (ECMWF). The evolution of the SEC resembled the Shapiro-Keyser model. The moisture transported to the bent-back front by easterlies from Gulf Stream favored precipitation and enhanced the latent heat release. The bent-back front and warm front were dominated by the water vapor convergence in the mid-low troposphere, the cyclonic-vorticity advection in the mid-upper troposphere and the divergence in the upper troposphere. These factors favored the rapid development of the SEC, but their contributions showed significant differences during the explosive-developing stage. The diagnostic results based on the Zwack-Okossi equation suggested that the early explosive development of the SEC was mainly forced by the diabatic heating in the mid-low troposphere. From the early explosive-developing moment to maximum-deepening-rate moment, the diabatic heating, warm-air advection and cyclonic-vorticity advection were all enhanced significantly, their combination forced the most explosive development, and the diabatic heating had the biggest contribution, followed by the warm-air advection and cyclonic-vorticity advection, which is different from the previous studies of ECs over the Northwestern Atlantic. The cross section of these factors suggested that during the rapid development, the cyclonic-vorticity advection was distributed and enhanced significantly in the mid-low troposphere, the warm-air advection was strengthened significantly in the mid-low and upper troposphere, and the diabatic heating was distributed in the middle troposphere.
Introduction
It has been observed that the extratropical cyclones can develop explosively by a rapid drop of the sea level pressure (SLP) at the center and a sharp enhancement of the intensity within a very short time. Rice (1979) called them Meteorological bombs and they are one of the most dangerous weather systems in winter over the mid-latitude oceans, with 2–5 days lifespan and 2,000–3,000 km horizontal scales, leading to extremely severe winds and heavy precipitation and potentially causing serious losses of life and property (Liberato et al., 2011; Liberato et al., 2013). Sanders and Gyakum (1980) defined the explosive cyclone (EC) as the one with the central SLP drops more than 24 hPa within 24 h when adjusted geostrophically to 60°N. The latitude adjustment is performed to account for the variation of the geostrophic wind with latitude for a given pressure gradient. Given the facts that ECs usually occur in the mid-latitude and that the high-resolution reanalysis data are widely used, Zhang et al. (2017) adjusted the latitude to 45°N and set the pressure fall to 12 hPa/12 h. The one “Bergeron” of a 24 hPa/24 h at 60°N in Sanders and Gyakum (1980) was modified into a 12 hPa/12 h at 45°N. In addition, these ECs were classified into four categories using K-means clustering algorithm based on the maximum deepening rate: Super (≥2.30 Bergeron), strong (1.70–2.29 Bergeron), moderate (1.30–1.69 Bergeron) and weak (1.00–1.29 Bergeron).
In the Northern Hemisphere, ECs occurred frequently over the Northwestern Pacific and the Northwestern Atlantic (Rogers and Bosart, 1986; Lim and Simmonds, 2002; Iwao et al., 2012; Zhang et al., 2017; Fu et al., 2020), especially over the Gulf Stream and Kuroshio/Kuroshio Extension regions (Roebber, 1984; Gyakum et al., 1989; Wang and Rogers, 2001; Allen et al., 2010; Seiler and Zwiers, 2016a, 2016b). The Gulf Stream and Kuroshio/Kuroshio Extension supply abundant moisture and turbulent (sensible and latent) heat fluxes, which favor the rapid development of ECs through increasing the latent heat release and decreasing atmospheric stability (Nuss and Kamikawa 1990; Kuo et al., 1991b; Reed et al., 1993b; Neiman and Shapiro 1993; Takayabu et al., 1996; Booth et al., 2012). Based on the frequency spatial distribution of the maximum-deepening-rate position, Wang and Rogers (2001) classified ECs over the North Atlantic into three types: NWA (Northwest Atlantic), NCA (North-Central Atlantic) and NEA (Northeast Atlantic), and the high frequency center over NWA near the Gulf Stream was the strongest (Sun et al., 2018). Allen et al. (2010) compared the distribution of ECs using NCEP2 (the second National Centers for Environmental Prediction), JRA (the Japanese Reanalysis) and ECMWF (European Centre for Medium-Range Weather Forecasts) data with different spatial resolutions from 1979 to 2008, and they obtained similar results with those of Wang and Rogers (2001). Sanders and Gyakum (1980) indicated that the monthly frequency of ECs peaked in January and November over the Northern Hemisphere, while it peaked in February over NWA. Sun et al. (2018) suggested that the seasonal variation characteristics of the EC frequency in different regions of the Northern Atlantic showed significant differences.
Four famous ECs over the Northwestern Atlantic have been extensively investigated in the previous studies, including the Queen Elizabeth II storm in 1978 (Gyakum, 1983a, 1983b, 1991; Anthes et al., 1983; Manobianco, 1989), the President Day’s Cyclone in 1979 (Bosart, 1981; Bosart and Lin, 1984; Uccellini et al., 1984, 1985; Whitaker et al., 1988), the ERICA IOP-4 Cyclone in 1989 (Wakimoto et al., 1992; Chang et al., 1993, 1996; Neiman et al., 1993; Neiman and Shapiro, 1993; Rausch and Smith, 1996), and the ERICA IOP-5 Cyclone in 1989 (Reed et al., 1993a, 1993b; Blier and Wakimoto, 1995; Kuo et al., 1996). Several mechanisms of EC development were suggested, such as the baroclinic instability (Sanders and Gyakum, 1980; Bosart, 1981; Manobianco, 1989; Wang and Rogers, 2001), diabatic heating (Gyakum, 1983b; Kuo et al., 1991a; Stoelinga, 1996; Moore et al., 2008; Willison et al., 2013), upper-level forcing (Bosart and Lin, 1984; Sanders, 1986; Gyakum, 1991), upper-level jet stream (Uccellini et al., 1984; Manobianco, 1989), intrusion of high potential vorticity (PV) air (Bosart and Lin, 1984; Uccellini et al., 1985; Whitaker et al., 1988; Davis and Emanuel, 1991; Reed et al., 1992), and multiple factors (Rausch and Smith, 1996; Nesterov, 2010). Lupo et al. (1992) used the Zwack-Okossi (Z-O) equation to examine ECs over the Gulf Stream off the coast of New England, near the location of the four famous cases over the Northwestern Atlantic, and the results revealed that the contribution of the diabatic heating was important but generally smaller than that of the cyclonic-vorticity advection and warm-air advection. Using the composite analysis Sanders (1986) and Wang and Rogers (2001) pointed out that ECs over the Northwestern Atlantic tended to have strong baroclinicity, consistent with the results from the four famous cases over the Northwestern Atlantic (Bosart, 1981; Gyakum, 1983a, 1983b; Anthes et al., 1983; Manobianco, 1989).
The Gulf Stream, known as the warm current in the North Atlantic flowing from the Gulf of Mexico northeast along the United States coast to Nantucket and from there eastward, is an important region for the global navigation associated with the frequent commercial and economic activities. The EC occurs frequently near the Gulf Stream (Sun et al., 2018) and is one of the most dangerous weather systems over this area. Some ECs around this area have been studied, but the extreme EC over the Gulf Stream has been rarely investigated and its development mechanism is still not clear. In this study, a super EC (SEC) migrating over the Gulf Stream (27–58°N, 79–49°W) from 25 to March 29, 2014 was studied. It is the most explosive development case during the last 20 years, causing serious economic losses, for example, more than 2,500 flights were delayed and 415 flights were canceled in America. Traffics were severely blocked due to the heavy snow associated with the SEC and many buildings were damaged by the severe wind. To reveal the development processes of this SEC, the atmospheric environment and structure are investigated, and the dynamic and thermodynamic factors such as the vorticity advection, temperature advection and diabatic heating are diagnosed quantitatively based on the Z-O equation using ERA5 atmospheric reanalysis from ECMWF (Hersbach et al., 2020). The data and methods are described in Data and Methods, the evolution and synoptic-scale atmospheric environment of the SEC are in Synoptic Study. Diagnostic Results presents the results from the Z-O equation and the last section is the Discussion and Conclusion.
Data and Methods
Data
The hourly variables such as the geopotential height, horizontal wind, vertical velocity, temperature, relative humidity and SLP are from ERA5 data provided by ECMWF. ERA5 data are produced using 4D-Var data assimilation in CY41R2 of ECMWF’s Integrated Forecast System (IFS) (Hersbach et al., 2020). The ERA5 data are downloaded with 0.25° × 0.25° horizontal resolution and 37 vertical levels from 1,000 to 1 hPa (all layers in hPa: 1,000, 975, 950, 925, 900, 875, 850, 825, 800, 775, 750, 700, 650, 600, 550, 500, 450, 400, 350, 300, 250, 225, 200, 175, 150, 125, 100, 70, 50, 30, 20, 10, 7, 5, 3, 2 and 1). They are used to examine the atmospheric environment variation and for the diagnostic analysis to reveal the physical process contributions to the development of the SEC.
Methods
Definition of EC
The EC definition modified by Zhang et al. (2017) is used in this study and the deepening rate (DR in Bergeron) of a cyclone SLP can be calculated using the following formula:
where t is the analyzed time in hour. P is the central SLP, and
Z-O Equation
The Z-O equation originally derived by Zwack and Okossi (1986) by integrating the omega equation was in quasigeostrophic form. It is further developed by Lupo et al. (1992) in a generalized form by substituting the hydrostatic balance equation, state equation, and the first law of thermodynamics into the equation. Moreover, the generalized form of the Z-O equation is simplified by removing some small terms in order to avoid aliasing errors (Lupo et al., 1992). It has been demonstrated that the simplified Z-O equation is an effective tool for diagnosing synoptic-scale development of the EC and it has been successfully applied to many studies (Morris and Smith, 2001; Strahl and Smith, 2001; Yoshida and Asuma, 2004; Azad and Sorteberg, 2014). The simplified Z-O equation can be written as:
where
Each term in the Z-O equation is calculated using the ERA5 data and a second-order finite-difference method is used to calculate the horizontal and vertical derivatives. The trapezoidal rule is used to estimate the vertical integrals. Based on Lupo et al. (1992) and Rausch and Smith (1996), the 950 hPa and 100 hPa are chosen as Pl and Pt, respectively, since the 950 hPa is an isobaric level above the ground and sufficiently close to the surface to be representative of the surface cyclogenesis and 100 hPa is a sufficient high level containing the whole troposphere. There are 23 levels between 950 hPa and 100 hPa. To reduce the subsynoptic-scale noise, each term is smoothed by the two-dimensional second-order filtering scheme (Shapiro, 1970).
To explore the role of the individual forcing process at different pressure levels in the Z-O equation, Rausch and Smith (1996) constructed the vertical profiles of each forcing term in Equation 2. As the vertical interval (ΔP) between pressure levels varies in ERA5 data, the method of Rausch and Smith (1996) is modified and each of the thermodynamic terms (terms B, C and D) in Equation 2 can be profiled by the following formula.
where Pl and PN are air pressure at the first and Nth levels, respectively,
Referring to Equation 2, the contribution of the dynamic term (term A) at each level can be profiled using the following formula:
where
Eady Growth Rate Equation
The EC over the warm current will be strongly influenced by the moisture. Considering the impact of the latent heat release on the baroclinicity through changes in the vertical stability term, the Eady growth rate (Eady, 1949; Hoskins and Valdes, 1990) is taken as the measure of baroclinicity and can be written as
where f is the Coriolis parameter, N is the Brunt-Väisälä frequency and V is the horizontal wind speed.
Synoptic Study
SEC Evolution
The most rapid development EC over the Gulf Stream during the last 20 years occurred from 00 UTC 25 to 06 UTC March 29, 2014 with the northeastward moving track (Figure 1A). The maximum deepening rate reached 3.45 Bergeron and the central SLP dropped to the minimum of 953.1 hPa during its lifetime (Figure 1B). It was formed over the eastern sea of Florida (27.5°N, 79°W) at 00 UTC March 25, 2014 with a central SLP of 1,012.1 hPa (Figure 1). It started the explosive development with the deepening rate of 1.04 Bergeron at 06 UTC 25 (Figure 1B). The deepening rate increased dramatically with the rapid drop of the central SLP after 18 UTC 25 (Figure 1B). At 06 UTC 26 over the eastern sea of North Carolina (36.5°N, 68°W), it experienced the most rapid development with the maximum deepening rate of 3.45 Bergeron and the central SLP drop of 34.8 hPa in 12 h. The explosive-developing stage with the deepening rate more than 1 Bergeron lasted 33 h from 06 UTC 25 to 15 UTC March 26, 2014. The development of the SEC slowed down with the deepening rate of central SLP less than 1 Bergeron after 18 UTC 26, which fell to the minimum SLP of 953.1 hPa at 00 UTC 27. It finally disappeared over the eastern coast of Canada (57.75°N, 49.5°W) in Newfoundland at 06 UTC 29.
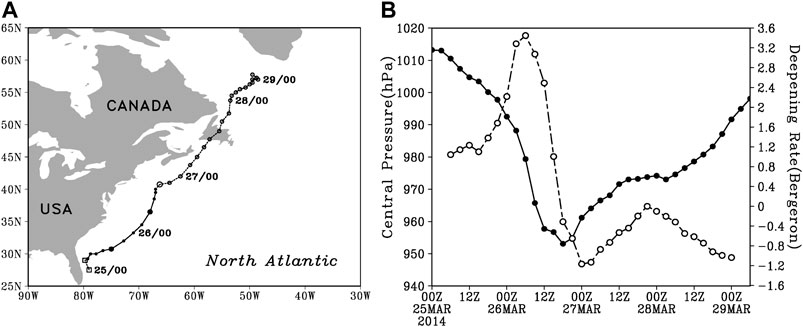
FIGURE 1. (A) The moving track (3-h intervals), and (B) the time series of the central SLP (solid, in hPa) and deepening rate (dashed, in Bergeron). EC center is defined as the minimum SLP position.
The evolution of the SLP, precipitation, wind and 0° temperature at 2 m from 12 UTC 25 to 18 UTC March 26, 2014 are shown in Figure 2. At 12 UTC 25 (Figure 2A), the precipitation was distributed to the north and southeast of the SEC center, the wind speed was less than 12 m/s. The 0° temperature showed approximately a straight line to the north of the SEC. The anticyclones over the North American and the North Atlantic Ocean existed to the northwest and northeast of the SEC, respectively. From 18 UTC 25 to 00 UTC 26 (Figures 2B,C), the precipitation area increased significantly. The northwestern anticyclone intruded from the northwest of the SEC and northeastern anticyclone strengthened gradually, resulting in the northwestern and southeastern gales to appear at 00 UTC 26. From 00 UTC 26 to 06 UTC 26, the precipitation over the east and northwest of the SEC enhanced evidently and indicated a pronounced mesoscale structure over the east and northwest. The precipitation was contributed from the transportation of water vapor through the strengthend southeastern gale due to the enhancement of the northeastern anticyclone. The northwestern anticyclone intruded to the west of the SEC with a trough of 0° temperature, bringing in the cold air. The cold intrusion favored the enhancement of the baroclinicity and the precipitation increased the latent heat release. From 6 h to 12 UTC 26, the northwestern anticyclone continued to intrude with the deepening trough of 0° temperature. The precipitation enhanced over the north and decreased over the east. The deepening rate of the SEC weakened to 2.49 Bergeron. The central SLP decreased to the minimum at 18 UTC 26.
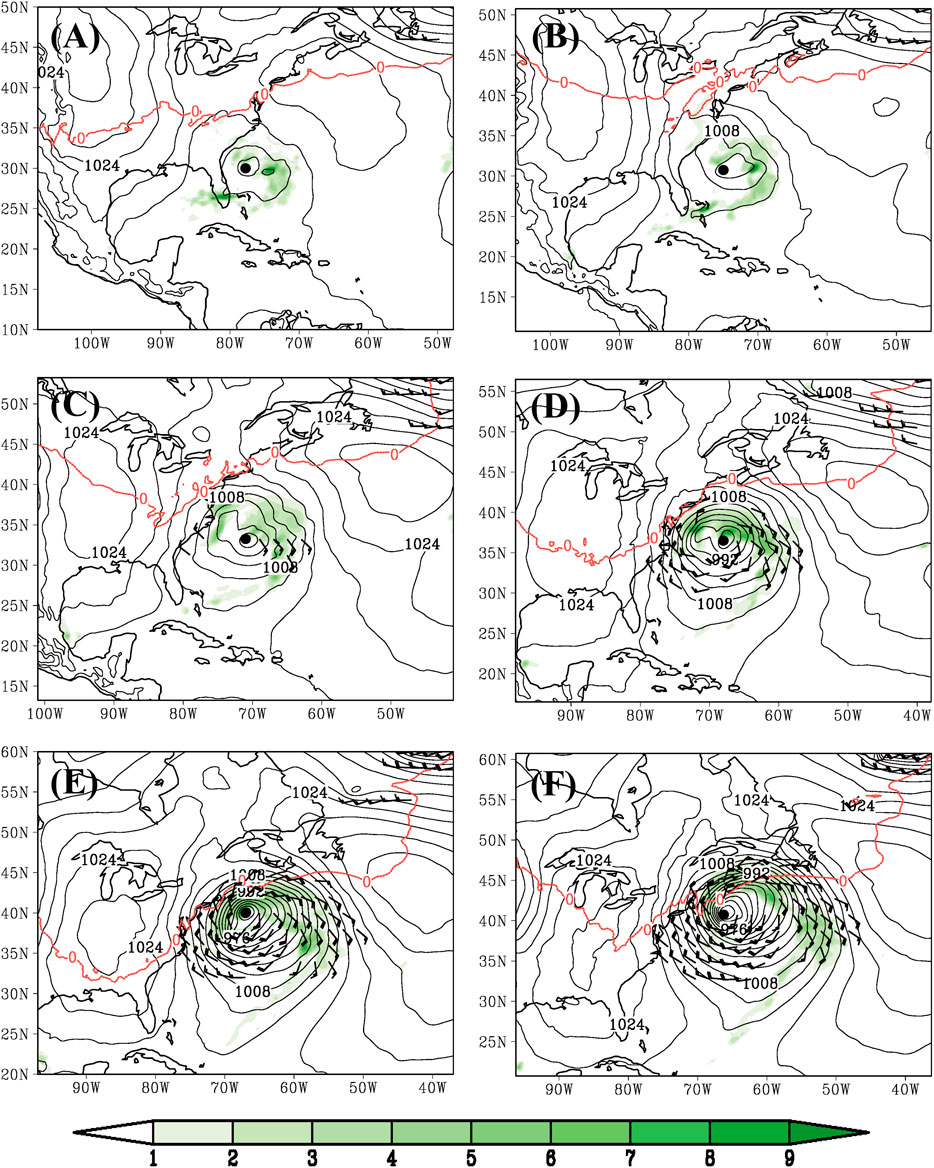
FIGURE 2. Sea level pressure (solid, 4 hPa intervals), 1-h accumulated precipitation (shaded, 1 mm intervals), gale (bard, ≥12 m s−1) and 0° temperature at 2 m (red) at (A) 12 UTC 25, (B) 18 UTC 25, (C) 00 UTC 26, (D) 06 UTC 26, (E) 12 UTC 26, and (F) 18 UTC March 26, 2014. The large solid dot denotes the SEC center.
Synoptic-Scale Environment
The rapid development from 18 UTC 25 to 18 UTC 26, which is 12 h before and after the moment of the maximum deepening rate at 06 UTC 26, will be examined in this section. Key factors including the baroclinicity, water vapor, vorticity advection and upper-level forcing are investigated at 18 UTC 25 (the moment of early explosive development, tear), 06 UTC 26 (the moment of maximum deepening rate, tmax), and 18 UTC 26 (the moment of minimum central SLP, tmin).
At tear (Figures 3A1–E1), the deepening rate of central SLP was 1.38 Bergeron (Figure 1B). The distribution of surface turbulent heat fluxes and evaporation was mainly to the southwest and northeast of the SEC (Figure 3A1), providing heat from ocean to atmosphere, and the distribution over the northeast near the precipitation area was stronger than that over the southwest. Meanwhile, the easterlies transported moisture from surrounding areas to the region of precipitation. The SEC was located in a trough of the 850-hPa geopotential height (Figure 3B1). The temperature disturbance had a rather small initial amplitude but lagged the 850-hPa geopotential height by about 1/4 wavelength, which is ideal for baroclinic development (Sanders, 1971; Warrenfeltz and Elsberry, 1989). The baroclinicity (Eady growth rate) was distributed to the north and northwest of the SEC. The northwestward and southeastward low-level jet streams at 850-hPa appeared to the northwest and east of the SEC, respectively, and of which the northwestward one was stronger (Figure 3C1). The moist tongue of specific humidity around the SEC was more than 5 g kg−1. The water vapor convergence was mainly distributed over the northeast of the SEC and was transported by the southeastward low-level jet stream. The SEC strode about 10 longitudes in the downstream of the 500-hPa geopotential height trough with positive vorticity, causing weak cyclonic-vorticity advection around the SEC (Figure 3D1). At 300 hPa (Figure 3E1), the pattern of the geopotential height trough was similar to that at 500 hPa and strode about 10 longitudes upstream of the SEC located in the south of the jet stream. A region of divergence existed about 7 longitudes downstream of the SEC.
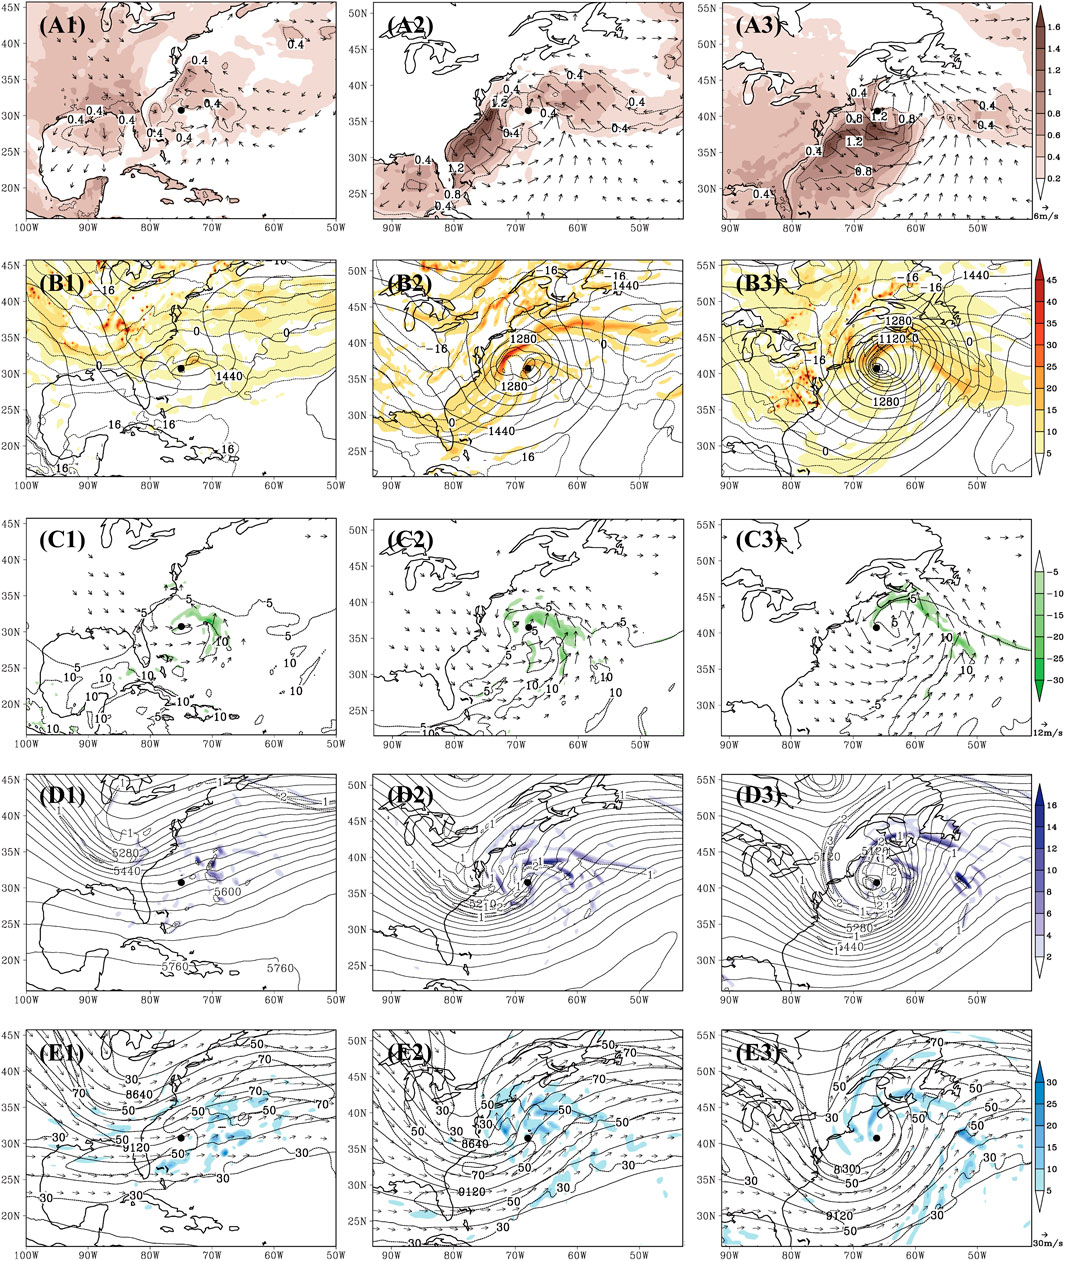
FIGURE 3. Synoptic weather charts at (A1–E1) 18 UTC 25, (A2–E2) 06 UTC 26, and (A3–E3) 18 UTC March 26, 2014. (A1–A3) Surface heat fluxes (latent and sensible fluxes, shaded, 0.2 kW m−2 intervals), evaporation (dashed, 0.4 mm intervals) and 10 m wind vector (arrow, ≥6 m s−1); (B1–B3) 850-hPa geopotential height (solid, 40 gpm intervals), temperature (dashed, 4°C intervals) and Eady growth rate (shaded, 5 × 10⁻⁶ s−1 intervals); (C1–C3) 850-hPa jet stream (arrow, ≥12 m s−1), specific humidity (dashed, 5 g kg−1 intervals) and water vapor convergence (shaded, 5 × 10⁻⁴ g kg−1 s−1 intervals); (D1–D3) 500-hPa geopotential height (solid, 40 gpm intervals), vorticity (dashed, 1 × 10⁻⁴ s−1 intervals) and vorticity advection (shaded, 2 × 10⁻⁹ s−2 intervals); (E1–E3) 300-hPa geopotential height (solid, 120 gpm intervals), wind vector (arrow, ≥30 m s−1), jet stream (dashed, ≥30 m s−1) and divergence (shaded, 3 × 10⁻⁵ s−1 intervals). The large solid dot denotes the SEC center.
At tmax (Figures 3A2–E2), the deepening rate of the central SLP reached its maximum of 3.45 Bergeron (Figure 1B). During the rapid development of the SEC, there was more surface turbulent heat fluxes supply from the ocean along the Gulf Stream to the atmosphere due to the enhancing surface wind speed (Figure 3A2), compared with that at tear (Figure 3A1). The precipitation was enhanced in the northwest of the SEC (Figure 2D), due to more evaporation and horizontal moisture convergence (see Figure 6B) by stronger easterlies over this region. At 850 hPa (Figure 3B2), the low vortex deepened to 1,240 m. The temperature field was severely distorted with a warm ridge extending toward to the SEC from the southeast. The baroclinicity enhanced significantly and showed a pattern of the Shapiro-Keyser model. The cold front was located to the southwest, the bent-back front and the warm front were distributed to the northwest and northeast, respectively. Both the northwestward and southeastward low-level jet streams strengthened evidently (Figure 3C2), especially the southeastward one enhanced dramatically. Associated with the increasing moist tongue of specific humidity, the stronger southeastward low-level jet stream enhanced water vapor convergence over the northwest and northeast of the SEC, corresponding to the location of the bent-back front and the warm front, where the precipitation occurred (Figure 2D). At 500 hPa (Figure 3D2), the geopotential height trough was amplified significantly with stronger cyclonic vorticity and approached the SEC, causing the enhancement of cyclonic-vorticity advection around the SEC. At 300 hPa (Figure 3E2), the approaching trough was amplified and evolved similar to the 500-hPa trough. The SEC moved from the south of the jet stream to the left of the jet stream exit where the strong upper-level forcing happened (Uccellini and Kocin, 1987; Nakamura, 1993), resulting in the divergence around the SEC in the upper troposphere and further enhancement of the ascending motion in the mid-low troposphere.
At tmin (Figures 3A3–E3), the central SLP dropped to the minimum of 953.1 hPa (Figure 1B). The high value area of surface turbulent heat fluxes was enlarged in the south but almost disappeared over the northeast of SEC. The intensity and scale of 850-hPa low vortex continued to strength (Figure 3B3) the baroclinicity was enhanced to the north of the SEC. Meanwhile, the southwestern cold front at tmax weakened. The northwestward low-level jet stream continued to enhance (Figure 3C3), while the southeastward low-level jet stream associated with the specific humidity was moving away from the SEC, resulting in the decrease of the water vapor convergence around the SEC. The height wave was developed into a low vortex and cut off at 500 hPa (Figure 3D3). The cyclonic vorticity and cyclonic-vorticity advection evolved to the downstream of the SEC, resulting in the weakening of the cyclonic-vorticity advection around the SEC. At 300 hPa (Figure 3E3), the trough evolved similarly to the 500-hPa one, except that there was no closed circulation formation. The jet stream moved farther away from the SEC, indicating the decrease of the upper-level forcing and the weakening of the divergence around the SEC.
Diagnostic Results
The Z-O equation is used to quantify the contributions from the dynamic and thermodynamic factors, including the vorticity advection, temperature advection, diabatic heating and adiabatic heating. The two-dimensional second-order filtering scheme by Shapiro (1970) cannot filter out all noises due to the nonlinear term and there are some deviation in calculating each term inevitably. However, the comparison between the sum of four terms on the right side (the total tendency in Figure 4, shaded) and the 950-hPa geostrophic vorticity tendency on the left side (LHS, contour in Figure 4) of Equation 2 indicated that their pattern and magnitude were quite similar in general, suggesting the reasonableness of the result.
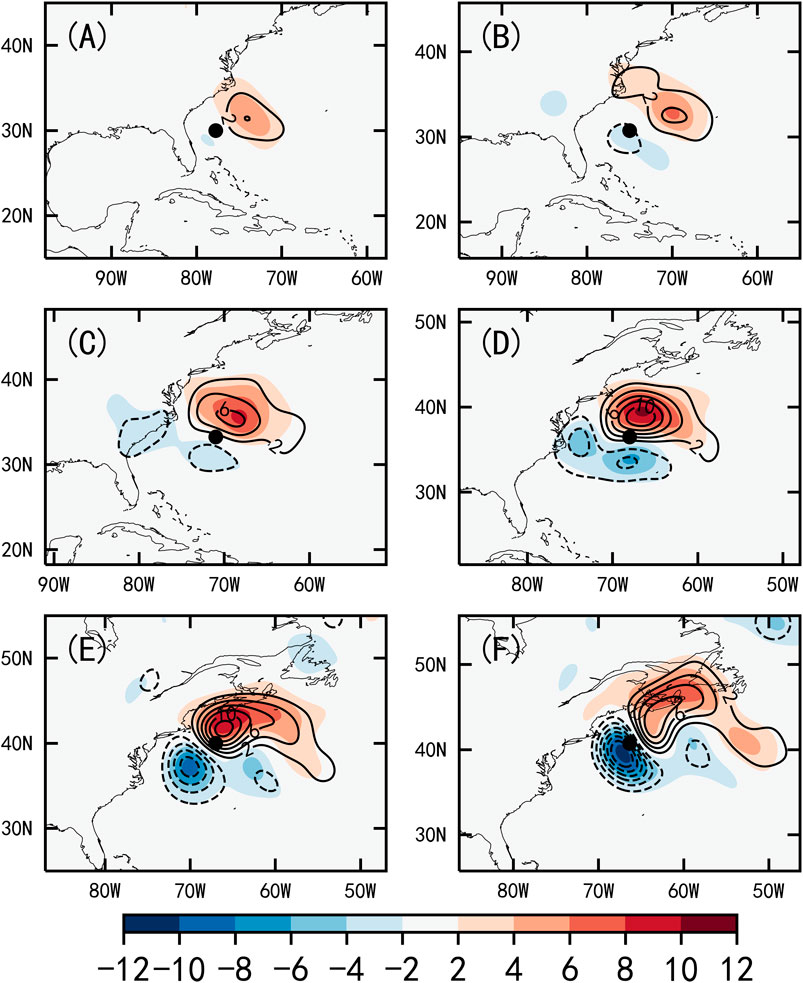
FIGURE 4. The 950-hPa geostrophic vorticity tendency (the term on the left side of Eq. 2 (LHS), contour interval is 2 × 10⁻⁹ s−2) and the total tendency (shaded, the sum of four terms on the right side of Equation 2, the interval is 2 × 10⁻⁹ s−2) of the SEC at (A) 12 UTC 25, (B) 18 UTC 25, (C) 00 UTC 26, (D) 06 UTC 26, (E) 12 UTC 26, and (F) 18 UTC March 26, 2014. The large solid dot denotes the SEC center.
At 12 UTC 25 (Figure 4A, shaded), the total tendency of 4 × 10⁻⁹ s−2 from the Z-O equation was centered on the northeast of the SEC. From 12 UTC 25 to 00 UTC 26 (Figures 4A–C, shaded), it was gradually enhanced to 8 × 10⁻⁹ s−2 and the deepening rate of the SEC was also increased (Figure 1B). At 06 UTC 26 (Figure 4D, shaded), its intensity was enhanced to the maximum of 10 × 10−9 s−2 and the deepening rate of the SEC reached the maximum of 3.45 Bergeron at the same time (Figure 1B). At 12 UTC 26 (Figure 4E), the intensity of the total tendency began to weaken to 8 × 10⁻⁹ s−2 and the deepening rate of the SEC also began to decrease. The total tendency and the deepening rate continued to weaken till 18 UTC 26 (Figure 4F, shaded). The results indicated that the total tendency of the Z-O equation had similar evolution with the deepening rate of the SEC, showing the reasonableness of the result calculated by the Z-O equation.
Moreover, it is found that the positive total tendency moved closer to the SEC center during the increase of the deepening rate from 12 UTC 25 to 00 UTC 26 and moved away from the SEC center during the decrease of the deepening rate from 06 UTC 26 to 18 UTC 26.
Vertically Integrated Characteristics
In order to focus on the SEC evolution, the diagnostic domain is moving with the SEC and extending over 30 latitudes and 40 longitudes regarding to the SEC center. At tear (Figures 5A1–D1), the integrated cyclonic-vorticity advection center (term A in Equation 2) of 2 × 10⁻⁹ s−2 was located to the northeast of the SEC (Figure 5A1). The integrated warm-air advection center (term B in Equation 2) of 6 × 10⁻⁹ s−2 was distributed to the northeast of the SEC and the integrated cold-air advection center of -6 × 10⁻⁹ s−2 was around the SEC center (Figure 5B1). The integrated diabatic heating (term C in Equation 2) with the center value of 18 × 10−9 s−2 was distributed to the southwest of the SEC (Figure 5C1). The pattern of the integrated adiabatic cooling due to the ascending motion (term D in Equation 2) was generally opposite to the integrated diabatic heating and was located to the southwest of the SEC, with the center value of −18 × 10−9 s−2 (Figure 5D1). A 10° × 10° area with the SEC as the center was selected to calculate the mean contributions of each term to the total tendency, and the results were shown in Figure 6A. It can be seen that the diabatic heating was the largest (1.06 × 10⁻⁹ s−2) and much greater than the cyclonic-vorticity advection (0.58 × 10⁻⁹ s−2) and warm-air advection (0.13 × 10⁻⁹ s−2) at tear, indicating that the early explosive development was initiated primarily by the diabatic heating.
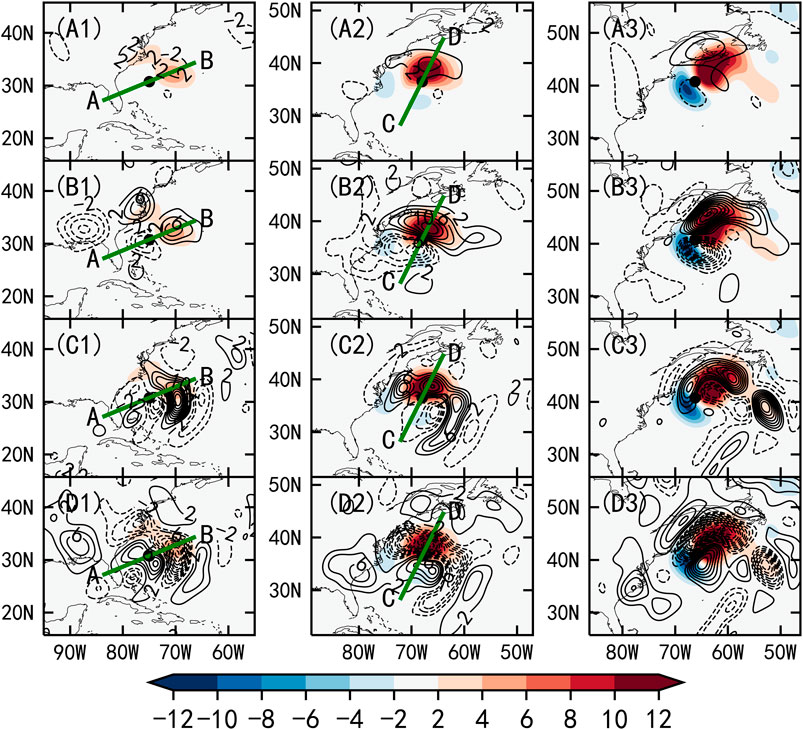
FIGURE 5. Contributions of individual terms (contours, 2 × 10⁻⁹ s−2 intervals) to the total tendency (shaded, 2 × 10⁻⁹ s−2 intervals) at (A1–D1) 18 UTC 25, (A2–D2) 06 UTC 26, and (A3–D3) 18 UTC March 26, 2014. The large solid dot denotes the SEC center. (A1–A3) the cyclonic-vorticity advection, (B1–B3) the warm-air advection, (C1–C3) the diabatic heating, (D1–D3) the adiabatic heating. The lines of A–B and C–D are the cross sections in Panel 7.
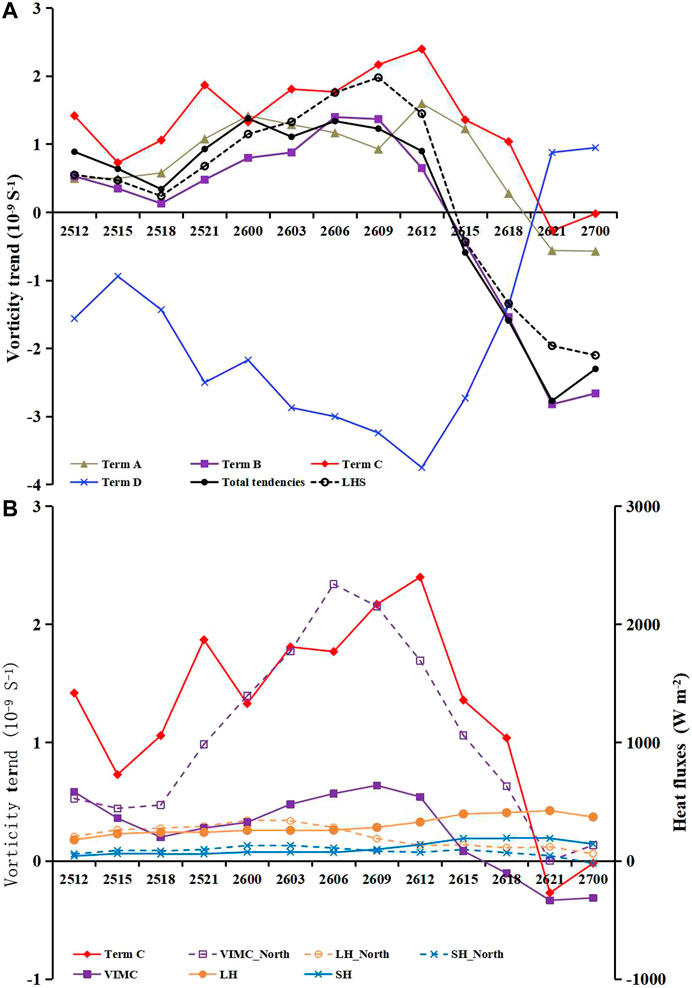
FIGURE 6. (A) Evolution of the area mean cyclonic-vorticity advection (Term A, brown), warm-air advection (Term B, purple), diabatic heating (Term C, red), adiabatic heating (Term D, blue), total tendencies (black) and the 950-hPa geostrophic vorticity tendency (dashed, LHS of Eq. 2). The area is 10° × 10° and moved with the SEC as the center. (B) Evolution of the area mean diabatic heating (Term C, red), surface sensible heat fluxes (SH, blue), surface latent heat fluxes (LH, orange) and vertically integrated moisture convergence (VIMC, converted to unit of W m−2, purple). The “_North” indicates the north half area mean (10° longitudes ×5° latitudes) over the north of SEC center.
At tmax (Figures 5A2–D2), the integrated cyclonic-vorticity advection was located closely to the north of the SEC, the intensity was enhanced to 4 × 10⁻⁹ s−2 and the scale was enlarged (Figure 5A2). The integrated warm-air advection increased to 12 × 10−9 s−2 over the northwest of the SEC (Figure 5B2) and moved closer to the SEC center. The integrated diabatic heating rotated cyclonically around the SEC center (Figure 5C2) and showed a pronounced mesoscale structure with three centers, corresponding to the warm front over the east and the bent-back front over the north and northwest, respectively. The intensity was weakened slightly to 12 × 10−9 s−2. The pattern of the integrated adiabatic cooling was almost opposite to the integrated diabatic heating and the intensity increased to -20 × 10−9 s−2 (Figure 5D2). From tear to tmax, both the integrated cyclonic-vorticity advection and the integrated warm-air advection evolved cyclonically and closed to the northeast of the SEC and their intensity increased distinctively. The integrated diabatic heating was close to the SEC center, although it weakened slightly. These resulted in the significant growth of the area mean integrated diabatic heating, integrated warm-air advection and integrated cyclonic-vorticity advection (Figure 6A). The warm-air advection had the biggest growth (increased 1.27 × 10⁻⁹ s−2 within 12 h), followed by the diabatic heating (increased 0.71 × 10⁻⁹ s−2 within 12 h) and the cyclonic-vorticity advection (increased 0.59 × 10⁻⁹ s−2 within 12 h). The contribution of the diabatic heating was still the largest (1.77 × 10⁻⁹ s−2), followed by the warm-air advection (1.40 × 10⁻⁹ s−2) and the cyclonic-vorticity advection (1.17 × 10⁻⁹ s−2) (Figure 6A).
At tmin (Figures 5A3–D3), the integrated cyclonic-vorticity advection over the northeast moved away from the SEC and the integrated anticyclonic-vorticity advection over the southwest moved closer to the SEC (Figure 5A3). Although the integrated warm-air advection was strengthened over the northeast (Figure 5B3), the SEC became detached from the warm-air advection region and located in the area of the cold-air advection. The integrated diabatic heating was distributed to the west and northeast of the SEC (Figure 5C3). The western center was close to the SEC, the northeastern center was enhanced but moved away from the SEC. The adiabatic cooling increased but kept away from the SEC (Figure 5D3). From tmax to tmin, the integrated cyclonic-vorticity advection, warm-air advection, and diabatic heating generally moved away from the SEC, even though their intensity unchanged or enhanced, resulting in significant weakening of the area mean of each term around the SEC center (Figure 6A).
According to the above analysis associated with the synoptic study in section 3, corresponding to the water vapor convergence (Figure 3C1) and precipitation (Figure 2B) to the east of the SEC at tear, the diabatic heating resulted from the latent heat release contributed the biggest to the early explosive development (Figure 5C1). Due to the relatively longer distance about 10 longitudes between the SEC and the mid-upper trough in the upstream (Figures 3D1,E1), the contribution of the cyclonic-vorticity advection was weaker than the diabatic heating (Figure 6A). Consistent with the small amplitude of temperature disturbance (Figure 3B1), the contribution of the warm-air advection was the smallest (Figure 6A). During the rapid development from tear to tmax, the diabatic heating evolved closely to the SEC center (Figure 5C2), causing the increasing contribution of the diabatic heating (Figure 6A). Moreover, it turned out that the distribution of the diabatic heating has a pronounced mesoscale structure and has two main separated areas: the north part (in the vicinity of the bent-back front) and the east part (in the vicinity of the warm front). The SEC was centered in the low-level warm ridge with increased amplitude (Figure 3B2). The warm-air advection was enhanced and approached the SEC (Figure 5B2), resulting in the enhancement of the warm-air advection (Figure 6A). The mid-upper level geopotential height trough with cyclonic vorticity approached the SEC (Figures 3D2,E2), and the cyclonic-vorticity advection was enhanced around the SEC (Figure 5A2). Figure 6A showed the evolutions of the area mean total and individual terms from 12 UTC 25 to 00 UTC 27. The good variability agreement between the sum of four terms (total tendency) and the 950-hPa geostrophic vorticity tendency (LHS) indicates once again the reasonableness of the results calculated from the Z-O equation. During the rapid development of the SEC from 18 UTC 25 to 18 UTC 26, the contribution of the diabatic heating was generally larger than the cyclonic-vorticity advection and warm-air advection, suggesting that the diabatic heating played more important role during the rapid development of the SEC over the Gulf Stream.
Additionally, the evolution of the area mean surface sensible and latent heat fluxes and vertically integrated moisture convergence (VIMC) has been examined. The hourly VIMC has been converted to the energy flux (unit of W m−2) by multiplying the latent heat of vaporization of water (2.5 × 10⁶ J/kg) and considering the time interval of 1 h (3,600 s), for the unit consistence with the sensible and latent heat fluxes. The results were shown in Figure 6B. The area mean VIMC showed similar variability with the diabatic heating, while the surface sensible and latent heat fluxes were monotonically increasing. As the surface turbulent heat fluxes associated with abundant moisture was transported from ocean to atmosphere over the precipitation region by stronger easterlies over the north of the SEC (Figures 3A1,A2), so the north half of the mean area (10° longitudes ×5° latitudes) over the north of the SEC was selected to examine the effect of surface sensible and latent heat fluxes on the explosive development. The north area mean of sensible and latent heat fluxes (SH_North and LH_North) and VIMC (VIMC_North) were generally enhanced from 12 UTC 25 to 06 UTC 26 and then weakened, similar to the variability of the deepening rate (Figure 1B) and the diabatic heating (Figure 6B, red), moreover, the area mean over the north was usually larger than that over the whole area, indicating that the processes over the north of the SEC center had more significant influences on the rapid development, consistent with the results of Figures 3A1–A3. The diabatic heating was mainly from the condensation of moisture transported from horizontal (i.e., vertically integrated moisture convergence) and vertical (i.e., surface latent heat flux) directions. Although, the variability of the surface latent heat flux and vertically integrated moisture convergence was similar, the increasing rate of surface latent heat flux was much smaller than that of the vertically integrated moisture convergence during the rapid development. The surface latent heat flux had some contributions to the initial development of the SEC, but the contribution became negligible at the later stage.
Cross Section
The cross sections described in Methods are further discussed at tear and tmax to explore the physical process contributions to the rapid SEC development. The cross section passes through the SEC center and the total tendency center (green line in Figures 5A1–D1). The cross sections of the cyclonic-vorticity advection, warm-air advection, diabatic heating and adiabatic heating at tear are shown in Figures 7A1–D1. The cyclonic-vorticity advection greater than 0.2 × 10⁻⁹ s−2 appeared between the 700–300 hPa in the downstream of the SEC (Figure 7A1), its intensity was relatively weak, corresponding to the weak geopotential height trough at 500 hPa and 300 hPa (Figures 3D1,E1). The warm-air advection was mainly distributed below 400 hPa with a maximum near 700 hPa (0.8 × 10⁻⁹ s−2) in the downstream of the SEC. Moreover, a weak center of 0.4 × 10⁻⁹ s−2 was located near 250 hPa above the SEC (Figure 7B1). The cold-air advection was below 400 hPa and above the SEC, which offset the warm-air advection, causing the weak area mean warm-air advection (Figure 6A). The diabatic heating resulted from the latent heat release dominated between the 900–300 hPa with the center of 1.0 × 10⁻⁹ s−2 at 600 hPa (Figure 7C1) in the downstream of the SEC, where the warm front was located (Figure 3B1), the water vapor converged (Figure 3C1) and the precipitation (Figure 2B) occurred. The adiabatic cooling due to the ascending motion was concentrated between the 900–300 hPa with a center value of −1.4 × 10⁻⁹ s−2 near 600 hPa in the downstream of the SEC (Figure 7D1).
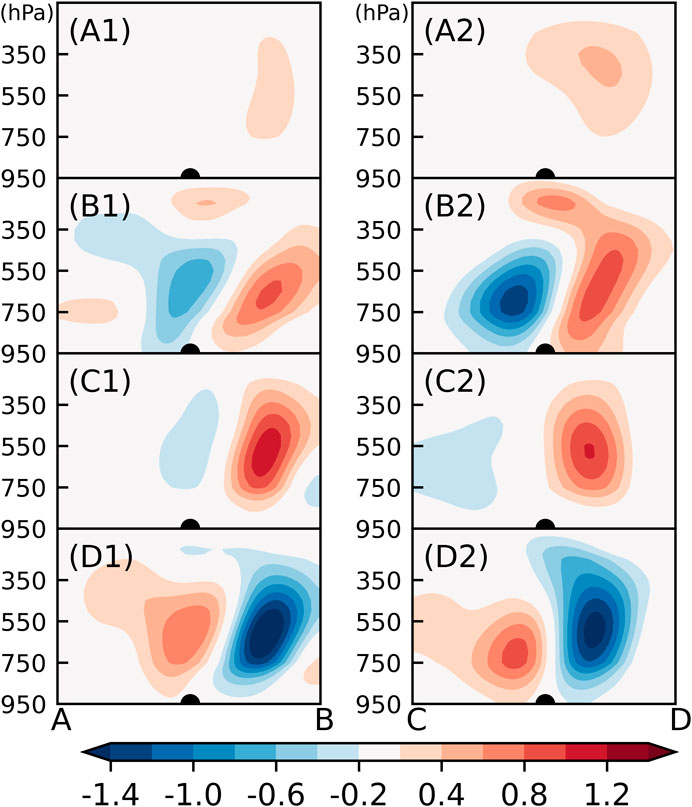
FIGURE 7. Vertical cross sections of the cyclonic-vorticity advection [(A1, A2), 0.2 × 10⁻⁹ s−2 intervals], warm-air advection [(B1, B2), 0.2 × 10⁻⁹ s−2 intervals], diabatic heating [(C1, C2), 0.2 × 10⁻⁹ s−2 intervals] and adiabatic heating [(D1, D2), 0.2 × 10⁻⁹ s−2 intervals] along the lines A–B and C–D as illustrated in Panel 5 (green lines). The lines are selected to pass through the SEC center and the total tendency center. A: (27.25°N, 83.5°W), B: (34.25°N, 66.5°W), C: (29.5°N, 71.5°W), D: (43.5°N, 64.5°W). (A1–D1) 18 UTC 25, (A2–D2) 06 UTC March 26, 2014. The large solid dot denotes the SEC center.
Figures 7A2–D2 showed cross sections of each term at tmax (green line in Figures 5A2–D2). The center value of the cyclonic-vorticity advection was doubled to 0.4 × 10⁻⁹ s−2 at 300 hPa (Figure 7A2) and its area was enlarged, due to the strengthened trough and cyclonic vorticity advection in the mid-upper troposphere (Figures 3D2,E2). The warm-air advection had two centers, one in the mid-low troposphere near 600 hPa was enhanced and moved closer to the SEC center, the other one in the upper troposphere was enhanced significantly (Figure 7B2). The warm-air advection in the upper troposphere was in agreement with Hirschberg and Fritsch (1991), who showed that the warm-air advection in the upper troposphere, superimposed up the lower-level baroclinicity or in combination with other forcing factors, could enhance the cyclone development. The diabatic heating was concentrated between the 900–300 hPa and centered near 600 hPa with the center value of 1.0 × 10⁻⁹ s−2 (Figure 7C2). Its intensity maintained, but the location also became closer to the SEC center, strengthening the contribution of the diabatic heating (Figure 6A). The adiabatic cooling area was enlarged and its intensity was basically unchanged.
Discussion and Conclusion
The physical process contributions to the development of a SEC migrating over the Gulf Stream from 25 to March 29, 2014 was studied using ERA5 data from ECMWF. This SEC was the most explosive one in the last 20 years, with the maximum deepening rate of 3.45 Bergeron (Figure 1B). During its rapid development (Figure 2), the northwestern anticyclone associated with the cold air intrusion to the west of the SEC caused the northwestern gale, suggesting that the baroclinicity favored the rapid development. The northeastern anticyclone and gale were strengthened, favoring the precipitation over the east and northwest of the SEC. The precipitation was significantly enhanced during the rapid development.
At the maximum-deepening-rate moment, the precipitation showed a pronounced mesoscale structure, which has centers to the north and northeast of the SEC (Figure 2D). The SEC migrated along the southeastern periphery of the Gulf Stream during its development stage (Figure 1A). The easterlies to the northern side of the SEC, known as cold conveyor belt with cold and dry air (Carlson, 1980; Schultz, 2001; Schemm and Wernli, 2014), facilitated more moisture flux from the Gulf Stream and transported to the bent-back front. These surface processes favored the precipitation and further enhanced the latent heat release over the bent-back front. The evolution of the 850 hPa temperature resembled (Figures 3B1–B3) the Shapiro-Keyser model (Neiman and Shapiro, 1993) with the frontal T-bone structure. The bent-back front and the warm front were dominated by the water vapor convergence in the mid-low troposphere, the cyclonic-vorticity advection in the mid-upper troposphere and the divergence in the upper troposphere (Figures 3C2–E2). The mesoscale structure of precipitation (Figure 2) corresponds to the bent-back front and the warm front, resulted from the water vapor convergence associated with the mid-low level front, mid-upper level cyclonic-vorticity advection and the upper level divergence. These key factors of the baroclinicity, water vapor convergence, cyclonic-vorticity advection and divergence were generally enhanced during the rapid development of the SEC and their combination from the low to upper troposphere forced the rapid development of the SEC.
The Z-O equation was used to diagnose the contributions of the thermodynamic and dynamic factors quantitatively. The results suggested that the early explosive development of the SEC was mainly forced by the diabatic heating resulted from the latent heat release at tear. The combination of the diabatic heating, warm-air advection and cyclonic-vorticity advection forced the most explosive development at tmax, and the diabatic heating had the biggest contribution, followed by the warm-air advection and cyclonic-vorticity advection. During the rapid development from 18 UTC 25 to 18 UTC 26, the diabatic heating always had the biggest contribution (Figure 6A), indicating that the diabatic heating played the most important role in the whole process of rapid development, which is different from the previous results. For example, Lupo et al. (1992) revealed that the contribution of the diabatic heating was generally smaller than those of the cyclonic-vorticity advection and warm-air advection for the EC off the coast of New England, some results showed strong baroclinicity of ECs over the Northwestern Atlantic (Bosart, 1981; Gyakum, 1983a, 1983b; Anthes et al., 1983; Sanders, 1986; Manobianco, 1989; Wang and Rogers, 2001). The surface heat and moisture fluxes from the Gulf Stream turned to be much stronger than those over the Northwestern Atlantic (Kuo et al., 1991b), resulting in the larger contribution of the diabatic heating. Although the diabatic heating was the most important factor during the rapid development of the SEC, its relative contribution varied at different stages. From the early explosive-developing moment to the maximum-deepening-rate moment, the relative contribution of the diabatic heating weakened, while the relative contributions of the cyclonic-vorticity advection and warm-air advection enhanced, differing from the previous studies of Gyakum (1983a, 1983b), Anthes et al. (1983) and Strahl and Smith (2001), who suggested that the latent heat release played an major role in the later stages of the EC development. In the current study, the surface latent heat flux had some contributions to the initial development of the SEC, but the contribution became negligible at the later stage (Figure 6B).
The cross section constructed using an updated method suggested that during the rapid development, the cyclonic-vorticity advection was distributed and enhanced in the mid-upper troposphere, in agreement with the marine explosive cyclone studied by Lupo et al. (1992). The warm-air advection had two centers in the mid-low (near 600 hPa) and upper (near 200 hPa) troposphere, and the center in mid-low troposphere was stronger than the center in upper troposphere, differing from the weaker center in mid-low troposphere and stronger center in upper troposphere in Lupo et al. (1992). The diabatic heating stretched to 300 hPa, which is higher than 500 hPa in Lupo et al. (1992). Probably, the heat and moisture fluxes from the Gulf Stream in the Western Atlantic is larger than these from the Northwestern Atlantic (Kuo et al., 1991b), which strengthens the warm-air advection in the mid-low troposphere and latent heat release in middle troposphere. Further study is needed in order to understand different contributions of each physical process during different developed stages between ECs with different intensity. Additionally, the surface heat and moisture fluxes from the Gulf Stream can enhance the precipitation and latent heat release over the bent-back front and favor the rapid development, while the Z-O equation can’t explain the processes directly, more numerical experiments of the contribution of the surface sensible and latent heat fluxes to the EC development are needed in further studies.
Data Availability Statement
The original contributions presented in the study are included in the article/Supplementary Material, further inquiries can be directed to the corresponding authors.
Author Contributions
Conceptualization, SZ, YX and CL; method, SZ, CL, HM and JX; software, SJZ and ZH; data curation, SZ and YZ; writing—original draft preparation, SZ and ZG; writing—review and editing, SZ, CL, HM and RT; visualization, SJZ, ZH and YZ; All authors have read and agreed to the published version of the manuscript.
Funding
This research was supported by the National Key Research and Development Project (2018YFC1506902), Project of Enhancing School with Innovation of Guangdong Ocean University (230419106), Guangdong Ocean University PhD. Scientific Research Program (R19045) and the National Natural Science Foundation of China (42075036).
Conflict of Interest
The authors declare that the research was conducted in the absence of any commercial or financial relationships that could be construed as a potential conflict of interest.
Publisher’s Note
All claims expressed in this article are solely those of the authors and do not necessarily represent those of their affiliated organizations, or those of the publisher, the editors and the reviewers. Any product that may be evaluated in this article, or claim that may be made by its manufacturer, is not guaranteed or endorsed by the publisher.
Acknowledgments
The authors express their sincere thanks to Gang Fu and Pengyuan Li from Ocean University of China for their comments on this article. Special thanks are given to ECMWF for providing ERA5 data. We would like to thank the reviewers for their valuable suggestions and comments.
References
Allen, J. T., Pezza, A. B., and Black, M. T. (2010). Explosive Cyclogenesis: A Global Climatology Comparing Multiple Reanalyses. J. Clim. 23, 6468–6484. doi:10.1175/2010jcli3437.1
Anthes, R. A., Kuo, Y.-H., and Gyakum, J. R. (1983). Numerical Simulations of a Case of Explosive marine Cyclogenesis. Mon. Wea. Rev. 111, 1174–1188. doi:10.1175/1520-0493(1983)111<1174:nsoaco>2.0.co;2
Azad, R., and Sorteberg, A. (2014). The Vorticity Budgets of North Atlantic Winter Extratropical Cyclone Life Cycles in MERRA Reanalysis. Part I: Development Phase*. J. Atmos. Sci. 71, 3109–3128. doi:10.1175/jas-d-13-0267.1
Blier, W., and Wakimoto, R. M. (1995). Observations of the Early Evolution of an Explosive Oceanic Cyclone during ERICA IOP 5. Part I: Synoptic Overview and Mesoscale Frontal Structure. Mon. Wea. Rev. 123, 1288–1310. doi:10.1175/1520-0493(1995)123<1288:ooteeo>2.0.co;2
Booth, J. F., Thompson, L., Patoux, J., and Kelly, K. A. (2012). Sensitivity of Midlatitude Storm Intensification to Perturbations in the Sea Surface Temperature Near the Gulf Stream. Mon. Wea. Rev. 140, 1241–1256. doi:10.1175/mwr-d-11-00195.1
Bosart, L. F., and Lin, S. C. (1984). A Diagnostic Analysis of the President's Day Storm of February 1979. Mon. Wea. Rev. 112, 2148–2177. doi:10.1175/1520-0493(1984)112<2148:adaotp>2.0.co;2
Bosart, L. F. (1981). The President's Day Snowstorm of 18-19 February 1979: A Subsynoptic-Scale Event. Mon. Wea. Rev. 109, 1542–1566. doi:10.1175/1520-0493(1981)109<1542:tpdsof>2.0.co;2
Carlson, T. N. (1980). Airflow through Midlatitude Cyclones and the Comma Cloud Pattern. Mon. Wea. Rev. 108, 1498–1509. doi:10.1175/1520-0493(1980)108<1498:atmcat>2.0.co;2
Chang, S. W., Alliss, R. J., Raman, S., and Shi, J.-J. (1993). SSM/I Observations of ERICA IOP 4 marine Cyclone: A Comparison with In Situ Observations and Model Simulation. Mon. Wea. Rev. 121, 2452–2464. doi:10.1175/1520-0493(1993)121<2452:sooeim>2.0.co;2
Chang, S. W., Holt, T. R., and Sashegyi, K. D. (1996). A Numerical Study of the ERICA IOP 4 marine Cyclone. Mon. Wea. Rev. 124, 27–46. doi:10.1175/1520-0493(1996)124<0027:ansote>2.0.co;2
Davis, C. A., and Emanuel, K. A. (1991). Potential Vorticity Diagnostics of Cyclogenesis. Mon. Wea. Rev. 119, 1929–1953. doi:10.1175/1520-0493(1991)119<1929:pvdoc>2.0.co;2
Fu, G., Sun, Y., Sun, J., and Li, P. (2020). A 38-year Climatology of Explosive Cyclones over the Northern Hemisphere. Adv. Atmos. Sci. 37 (2), 143–159. doi:10.1007/s00376-019-9106-x
Gyakum, J. R., Anderson, J. R., Grumm, R. H., and Gruner, E. L. (1989). North Pacific Cold-Season Surface Cyclone Activity: 1975-1983. Mon. Wea. Rev. 117, 1141–1155. doi:10.1175/1520-0493(1989)117<1141:npcssc>2.0.co;2
Gyakum, J. R. (1991). Meteorological Precursorsto the Explosive Intensifification of the QE II Storm. Mon. Wea. Rev. 119, 1156–1173. doi:10.1175/1520-0493(1991)119<1105:mpttei>2.0.co;2
Gyakum, J. R. (1983a). On the Evolution of theQE IIStorm. I: Synoptic Aspects. Mon. Wea. Rev. 111, 1137–1155. doi:10.1175/1520-0493(1983)111<1137:oteoti>2.0.co;2
Gyakum, J. R. (1983b). On the Evolution of theQE IIStorm. I: Synoptic Aspects. Mon. Wea. Rev. 111, 1137–1155. doi:10.1175/1520-0493(1983)111<1137:oteoti>2.0.co;2
Hersbach, H., Bell, B., Berrisford, P., Hirahara, S., Horányi, A., Muñoz-Sabater, J., et al. (2020). The ERA5 Global Reanalysis. Q. J. R. Meteorol. Soc. 146, 1999–2049. doi:10.1002/qj.3803
Hirschberg, P. A., and Fritsch, J. M. (1991). Tropopause Undulations and the Development of Extratropical Cyclones. Part I. Overview and Observations from a Cyclone Event. Mon. Wea. Rev. 119, 496–517. doi:10.1175/1520-0493(1991)119<0496:tuatdo>2.0.co;2
Holton, J. R. (2004). An Introduction to Dynamic Meteorology. 4thed. International Geophysics Series, 88. Academic Press, 535.
Hoskins, B. J., and Valdes, P. J. (1990). On the Existence of Storm-Tracks. J. Atmos. Sci. 47, 1854–1864. doi:10.1175/1520-0469(1990)047<1854:oteost>2.0.co;2
Iwao, K., Inatsu, M., and Kimoto, M. (2012). Recent Changes in Explosively Developing Extratropical Cyclones over the Winter Northwestern Pacific. J. Clim. 25, 7282–7296. doi:10.1175/jcli-d-11-00373.1
Kuo, Y.-H., Low-Nam, S., and Reed, R. J. (1991b). Effects of Surface Energy Fluxes during the Early Development and Rapid Intensification Stages of Seven Explosive Cyclones in the Western Atlantic. Mon. Wea. Rev. 119, 457–476. doi:10.1175/1520-0493(1991)119<0457:eosefd>2.0.co;2
Kuo, Y.-H., Reed, R. J., and Liu, Y. (1996). The ERICA IOP 5 Storm. Part III: Mesoscale Cyclogenesis and Precipitation Parameterization. Mon. Wea. Rev. 124, 1409–1434. doi:10.1175/1520-0493(1996)124<1409:teispi>2.0.co;2
Kuo, Y.-H., Shapiro, M. A., and Donall, E. G. (1991a). The Interaction between Baroclinic and Diabatic Processes in a Numerical Simulation of a Rapidly Intensifying Extratropical marine Cyclone. Mon. Wea. Rev. 119, 368–384. doi:10.1175/1520-0493(1991)119<0368:tibbad>2.0.co;2
Liberato, M. L. R., Pinto, J. G., Trigo, I. F., and Trigo, R. M. (2011). Klaus - an Exceptional winter Storm over Northern Iberia and Southern France. Weather 66, 330–334. doi:10.1002/wea.755
Liberato, M. L. R., Pinto, J. G., Trigo, R. M., Ludwig, P., Ordóñez, P., Yuen, D., et al. (2013). Explosive Development of winter Storm Xynthia over the Subtropical North Atlantic Ocean. Nat. Hazards Earth Syst. Sci. 13, 2239–2251. doi:10.5194/nhess-13-2239-2013
Lim, E.-P., and Simmonds, I. (2002). Explosive Cyclone Development in the Southern Hemisphere and a Comparison with Northern Hemisphere Events. Mon. Wea. Rev. 130, 2188–2209. doi:10.1175/1520-0493(2002)130<2188:ecdits>2.0.co;2
Lupo, A. R., Smith, P. J., and Zwack, P. (1992). A Diagnosis of the Explosive Development of Two Extratropical Cyclones. Mon. Wea. Rev. 120, 1490–1523. doi:10.1175/1520-0493(1992)120<1490:adoted>2.0.co;2
Manobianco, J. (1989). Explosive East Coast Cyclogenesis over the West-central North Atlantic Ocean: A Composite Study Derived from ECMWF Operational Analyses. Mon. Wea. Rev. 117, 2365–2383. doi:10.1175/1520-0493(1989)117<2365:eeccot>2.0.co;2
Moore, R. W., Montgomery, M. T., and Davies, H. C. (2008). The Integral Role of a Diabatic Rossby Vortex in a Heavy Snowfall Event. Mon. Wea. Rev. 136, 1878–1897. doi:10.1175/2007mwr2257.1
Morris, W. E., and Smith, P. J. (2001). Cyclolysis: A Diagnosis of Two Extratropical Cyclones. Mon. Wea. Rev. 129, 2714–2729. doi:10.1175/1520-0493(2001)129<2714:cadote>2.0.co;2
Nakamura, H. (1993). Horizontal Divergence Associated with Zonally Isolated Jet Streams. J. Atmos. Sci. 50, 2310–2313. doi:10.1175/1520-0469(1993)050<2310:hdawzi>2.0.co;2
Neiman, P. J., Shapiro, M. A., and Fedor, L. S. (1993). The Life Cycle of an Extratropical marine Cyclone. Part II: Mesoscale Structure and Diagnostics. Mon. Wea. Rev. 121, 2177–2199. doi:10.1175/1520-0493(1993)121<2177:tlcoae>2.0.co;2
Neiman, P. J., and Shapiro, M. A. (1993). The Life Cycle of an Extratropical Marine Cyclone. Part I: Frontal-Cyclone Evolution and Thermodynamic Air-Sea Interaction. Mon. Wea. Rev. 121, 2153–2176. doi:10.1175/1520-0493(1993)121<2153:tlcoae>2.0.co;2
Nesterov, E. S. (2010). Explosive Cyclogenesis in the Northeastern Part of the Atlantic Ocean. Russ. Meteorol. Hydrol. 35, 680–686. doi:10.3103/s1068373910100055
Nuss, W. A., and Kamikawa, S. I. (1990). Dynamics and Boundary Layer Processes in Two Asian Cyclones. Mon. Wea. Rev. 118, 755–771. doi:10.1175/1520-0493(1990)118<0755:dablpi>2.0.co;2
Rausch, R. L. M., and Smith, P. J. (1996). A Diagnosis of a Model-Simulated Explosively Developing Extratropical Cyclone. Mon. Wea. Rev. 124, 875–904. doi:10.1175/1520-0493(1996)124<0875:adoams>2.0.co;2
Reed, R. J., Grell, G. A., and Kuo, Y.-H. (1993a). The ERICA IOP 5 Storm. Part I: Analysis and Simulation. Mon. Wea. Rev. 121, 1577–1594. doi:10.1175/1520-0493(1993)121<1577:teispi>2.0.co;2
Reed, R. J., Grell, G. A., and Kuo, Y.-H. (1993b). The ERICA IOP 5 Storm. Part II: Sensitivity Tests and Further Diagnosis Based on Model Output. Mon. Wea. Rev. 121, 1595–1612. doi:10.1175/1520-0493(1993)121<1595:teispi>2.0.co;2
Reed, R. J., Stoelinga, M. T., and Kuo, Y.-H. (1992). A Model-Aided Study of the Origin and Evolution of the Anomalously High Potential Vorticity in the Inner Region of a Rapidly Deepening marine Cyclone. Mon. Wea. Rev. 120, 893–913. doi:10.1175/1520-0493(1992)120<0893:amasot>2.0.co;2
Roebber, P. J. (1984). Statistical Analysis and Updated Climatology of Explosive Cyclones. Mon. Wea. Rev. 112, 1577–1589. doi:10.1175/1520-0493(1984)112<1577:saauco>2.0.co;2
Rogers, E., and Bosart, L. F. (1986). An Investigation of Explosively Deepening Oceanic Cyclones. Mon. Wea. Rev. 114, 702–718. doi:10.1175/1520-0493(1986)114<0702:aioedo>2.0.co;2
Sanders, F. (1971). Analytic Solutions of the Nonlinear omega and Vorticity Equations for a Structurally Simple Model of Disturbances in the Baroclinic Westerlies. Mon. Wea. Rev. 99, 393–407. doi:10.1175/1520-0493(1971)099<0393:asotno>2.3.co;2
Sanders, F. (1986). Explosive Cyclogenesis in the West-Central North Atlantic Ocean, 1981-84. Part I: Composite Structure and Mean Behavior. Mon. Wea. Rev. 114, 1781–1794. doi:10.1175/1520-0493(1986)114<1781:ecitwc>2.0.co;2
Sanders, F., and Gyakum, J. R. (1980). Synoptic-Dynamic Climatology of the "Bomb". Mon. Wea. Rev. 108, 1589–1606. doi:10.1175/1520-0493(1980)108<1589:sdcot>2.0.co;2
Schemm, S., and Wernli, H. (2014). The Linkage between the Warm and the Cold Conveyor Belts in an Idealized Extratropical Cyclone*. J. Atmos. Sci. 71, 1443–1459. doi:10.1175/jas-d-13-0177.1
Schultz, D. M. (2001). Reexamining the Cold Conveyor belt. Mon. Wea. Rev. 129, 2205–2225. doi:10.1175/1520-0493(2001)129<2205:rtccb>2.0.co;2
Seiler, C., and Zwiers, F. W. (2016a). How Well Do CMIP5 Climate Models Reproduce Explosive Cyclones in the Extratropics of the Northern Hemisphere? Clim. Dyn. 46, 1241–1256. doi:10.1007/s00382-015-2642-x
Seiler, C., and Zwiers, F. W. (2016b). How Will Climate Change Affect Explosive Cyclones in the Extratropics of the Northern Hemisphere? Clim. Dyn. 46, 3633–3644. doi:10.1007/s00382-015-2791-y
Shapiro, R. (1970). Smoothing, Filtering, and Boundary Effects. Rev. Geophys. 8, 359–387. doi:10.1029/rg008i002p00359
Stoelinga, M. T. (1996). A Potential Vorticity-Based Study of the Role of Diabatic Heating and Friction in a Numerically Simulated Baroclinic Cyclone. Mon. Wea. Rev. 124, 849–874. doi:10.1175/1520-0493(1996)124<0849:apvbso>2.0.co;2
Strahl, J. L. S., and Smith, P. J. (2001). A Diagnostic Study of an Explosively Developing Extratropical Cyclone and an Associated 500-hPa Trough Merger. Mon. Wea. Rev. 129, 2310–2328. doi:10.1175/1520-0493(2001)129<2310:adsoae>2.0.co;2
Sun, Y. W., Fu, G., Sun, J. L., and Zhang, S. Q. (2018). Spatial Distribution and Seasonal Variation of Explosive Cyclones over the Northern Atlantic. J. Ocean Univ. China 17 (005), 1000–1010. doi:10.1007/s11802-018-3703-7
Takayabu, I., Niino, H., Yamanaka, M. D., and Fukao, S. (1996). An Observational Study of Cyclogenesis in the lee of the Japan central Mountains. Meteorl. Atmos. Phys. 61, 39–53. doi:10.1007/bf01029710
Uccellini, L. W., Keyser, D., Brill, K. F., and Wash, C. H. (1985). The President's Day Cyclone of 18-19 February 1979: Influence of Upstream Trough Amplification and Associated Tropopause Folding on Rapid Cyclogenesis. Mon. Wea. Rev. 113, 962–988. doi:10.1175/1520-0493(1985)113<0962:tpdcof>2.0.co;2
Uccellini, L. W., Kocin, P. J., Petersen, R. A., Wash, C. H., and Brill, K. F. (1984). The President's Day Cyclone of 18-19 February 1979: Synoptic Overview and Analysis of the Subtropical Jet Streak Influencing the Pre-cyclogenetic Period. Mon. Wea. Rev. 112, 31–55. doi:10.1175/1520-0493(1984)112<0031:tpdcof>2.0.co;2
Uccellini, L. W., and Kocin, P. J. (1987). The Interaction of Jet Streak Circulations during Heavy Snow Events along the East Coast of the United States. Wea. Forecast. 2, 289–308. doi:10.1175/1520-0434(1987)002<0289:tiojsc>2.0.co;2
Wakimoto, R. M., Blier, W., and Liu, C. (1992). The Frontal Structure of an Explosive Oceanic Cyclone: Airbone Radar Observations of ERICA IOP 4. Mon. Wea. Rev. 120, 1135–1155. doi:10.1175/1520-0493(1992)120<1135:tfsoae>2.0.co;2
Wang, C.-C., and Rogers, J. C. (2001). A Composite Study of Explosive Cyclogenesis in Different Sectors of the North Atlantic. Part I: Cyclone Structure and Evolution. Mon. Wea. Rev. 129, 1481–1499. doi:10.1175/1520-0493(2001)129<1481:acsoec>2.0.co;2
Warrenfeltz, L. L., and Elsberry, R. L. (1989). Superposition Effects in Rapid Cyclogenesis-Linear Model Studies. J. Atmos. Sci. 46, 789–802. doi:10.1175/1520-0469(1989)046<0789:seircm>2.0.co;2
Whitaker, J. S., Uccellini, L. W., and Brill, K. F. (1988). A Model-Based Diagnostic Study of the Rapid Development Phase of the President's Day Cyclone. Mon. Wea. Rev. 116, 2337–2365. doi:10.1175/1520-0493(1988)116<2337:ambdso>2.0.co;2
Willison, J., Robinson, W. A., and Lackmann, G. M. (2013). The Importance of Resolving Mesoscale Latent Heating in the North Atlantic Storm Track. J. Atmos. Sci. 70, 2234–2250. doi:10.1175/jas-d-12-0226.1
Yoshida, A., and Asuma, Y. (2004). Structures and Environment of Explosively Developing Extratropical Cyclones in the Northwestern Pacific Region. Mon. Wea. Rev. 132, 1121–1142. doi:10.1175/1520-0493(2004)132<1121:saeoed>2.0.co;2
Zhang, S., Fu, G., Lu, C., and Liu, J. (2017). Characteristics of Explosive Cyclones over the Northern Pacific. J. Appl. Meteorol. Clim. 56, 3187–3210. doi:10.1175/jamc-d-16-0330.1
Keywords: super explosive cyclone, Gulf Stream, structure, diagnostic analysis, physical process
Citation: Zhang S, Liu C, Xu J, Zhang S, Tang R, Huang Z, Zheng Y, Guan Z, Mao H and Xue Y (2021) Physical Process Contributions to the Development of a Super Explosive Cyclone Over the Gulf Stream. Front. Earth Sci. 9:722555. doi: 10.3389/feart.2021.722555
Received: 09 June 2021; Accepted: 28 September 2021;
Published: 18 October 2021.
Edited by:
Guihua Wang, Fudan University, ChinaReviewed by:
Ernesto Dos Santos Caetano Neto, National Autonomous University of Mexico, MexicoHuaji Pang, Qingdao Meteorological Bureau, China
Copyright © 2021 Zhang, Liu, Xu, Zhang, Tang, Huang, Zheng, Guan, Mao and Xue. This is an open-access article distributed under the terms of the Creative Commons Attribution License (CC BY). The use, distribution or reproduction in other forums is permitted, provided the original author(s) and the copyright owner(s) are credited and that the original publication in this journal is cited, in accordance with accepted academic practice. No use, distribution or reproduction is permitted which does not comply with these terms.
*Correspondence: Chunlei Liu, bGl1Y2xlaUBnZG91LmVkdS5jbg==; Hongfei Mao, TWFvaGZAZ2RvdS5lZHUuY24=; Yufeng Xue, eHVleWZAZ2RvdS5lZHUuY24=