 Ze-Nan Zhu1
 Xiao-Hua Zhu1,2,3*
 Chuanzheng Zhang1Minmo Chen1Hua Zheng1,3Zhensheng Zhang1Jiwen Zhong4Lixin Wei4Qiang Li4Hua Wang4Shuming Li4Arata Kaneko5
- 1State Key Laboratory of Satellite Ocean Environment Dynamics, Second Institute of Oceanography, Ministry of Natural Resources, Hangzhou, China
- 2Southern Marine Science and Engineering Guangdong Laboratory (Zhuhai), Zhuhai, China
- 3School of Oceanography, Shanghai Jiao Tong University, Shanghai, China
- 4Lower Changjiang River Bureau of Hydrological and Water Resources Survey, Hydrology Bureau of Changjiang Water Resources Commission, Nanjing, China
- 5Graduate School of Advanced Science and Engineering, Hiroshima University, Higashi-Hiroshima, Hiroshima, Japan
To continuously monitor the discharge of the Yangtze River, two coastal acoustic tomography (CAT) systems with synchronized transmission were deployed at the Datong hydrometric station of the Yangtze River from July 2018 to January 2021. To accurately estimate the discharge of the Yangtze River, the cross-sectional averaged flow velocity and area data were estimated by establishing two empirical relationships: one between the range-averaged flow velocity measured by acoustic Doppler current profiler (ADCP) and the reciprocal travel time difference measured by CAT, and the other between the ADCP-measured cross-sectional area and the water-surface elevation (stage). Compared with the discharges directly measured by ADCP, our estimation had the root mean square error of 946 m3/s, accounting for 2.5% of the mean discharge. The discharges varied from 10,981 to 81,807 m3/s over the 2.5-years observational period, with a mean of 30,708 m3/s. The annual mean discharge was 29,163 and 34,763 m3/s in 2019 and 2020, respectively. Our monitoring successfully covered two complete flood processes, with a peak discharge of 69,744 (July 17, 2019) and 81,807 m3/s (July 13, 2020). Our study provides an innovative method to achieve accuracy and real-time monitoring of river discharges even during extreme flood events.
Introduction
Rivers play an important role in the global hydrological cycle and solid transport, with river discharge serving as a key link between continental fresh water and marine salt water (Chen et al., 1988; Chen et al., 2001; Lu, 2004; Haddeland et al., 2014). Therefore, real-time acquisition of accurate river discharge data is of significance in water resource management and ecological protection (Feng et al., 2019). The increase in air vapor due to global warming has underlined the importance of river-flood monitoring (Arnell and Gosling, 2016; Zhou et al., 2021).
The standard method for obtaining a time series of river discharge generally involves the use of an empirical regression equation to convert the time series of water-surface elevation (stage) into a time series of discharge (Schmidt, 2002). Some studies have obtained the surface flow velocity using radars (Costa et al., 2006) or particle image velocimetry (PIV) technique (Bandini et al., 2020) to estimate the continuous discharge. These indirect flow measurement techniques of surface flow velocity are extremely susceptible to environmental factors such as wind and rain (Hauet et al., 2009); thus, they result in an inaccurate estimation of surface flow velocity, which in turn, affects the accuracy of estimation of discharge. Moftakhari et al. (2013) and Cai et al. (2014) estimated the freshwater discharge into the San Francisco Bay and the Yangtze River Estuary by evaluating the tide-runoff interaction. Although these theoretical models can estimate discharge, the estimates must be verified through long-term continuous monitoring of river discharges. The fall index method (estimating the discharge using the water level differences between adjacent hydrometric stations) has also been widely applied to estimate the discharge of the Yangtze River Basin (Wu et al., 2010; Zhang and Gao, 2014), but it is difficult to accurately estimate the drop in the water level, especially during floods.
Acoustic instruments such as a shipboard acoustic Doppler current profiler (ADCP), horizontal acoustic Doppler current profiler (H-ADCP), acoustic Doppler profiler (ADP), and acoustic Doppler velocimeter (ADV) have been widely applied to river surveys (e.g., Hoitink et al., 2009; Zhu et al., 2012). These shipboard instruments are labor-intensive, and their operation is limited by voyage duration, which prevents them from providing a continuous, long-term time series of monitoring data. Additionally, it is difficult for these devices to accurately “capture” the instantaneous peak discharge.
In addition, coastal acoustic tomography (CAT, Kaneko et al., 2020), as a new type of flow measurement technique, is widely used to measure the sectional averaged velocity and discharge in coastal areas and rivers based on its reciprocal travel time difference data (e.g., Zheng et al., 1997; Kawanisi et al., 2010; Adityawarman et al., 2011; Zhu et al., 2012; Zhu et al., 2015). Previous studies have directly established the relationship between the reciprocal travel time difference data and the discharge observed by shipboard ADCP. The variations in the observational cross-sectional area may have been neglected for a few days or months of observations. However, the seasonal variations in the cross-sectional area are always large as the stage substantially varies in different seasons. Thus, the methods used in previous studies may introduce large errors, and they are not suitable for long-term CAT observations.
In this study, shipboard ADCP observation data were combined with the monitoring data of stage and reciprocal travel time difference data captured over a 2.5-year period continuously. The aim of this study was to obtain the continuous discharge data of the Yangtze River at the Datong hydrometric station. We provide a new method by considering variations in both cross-sectional averaged flow velocity and area for monitoring large-scale river discharge.
Data and Methods
Experimental Setup
The Datong hydrometric station, which is located in Meilong Town, Anhui Province, is approximately 624 km from the Yangtze River Estuary (Figure 1A). It is the first hydrometric station on the main stream of the Yangtze River to the estuary (Mei et al., 2018) and is also the uppermost boundary of the ocean tide (Yang et al., 2005). Generally, the discharge at the Datong hydrometric station represents the discharge of the Yangtze River into the East China Sea (Zhang et al., 2003).
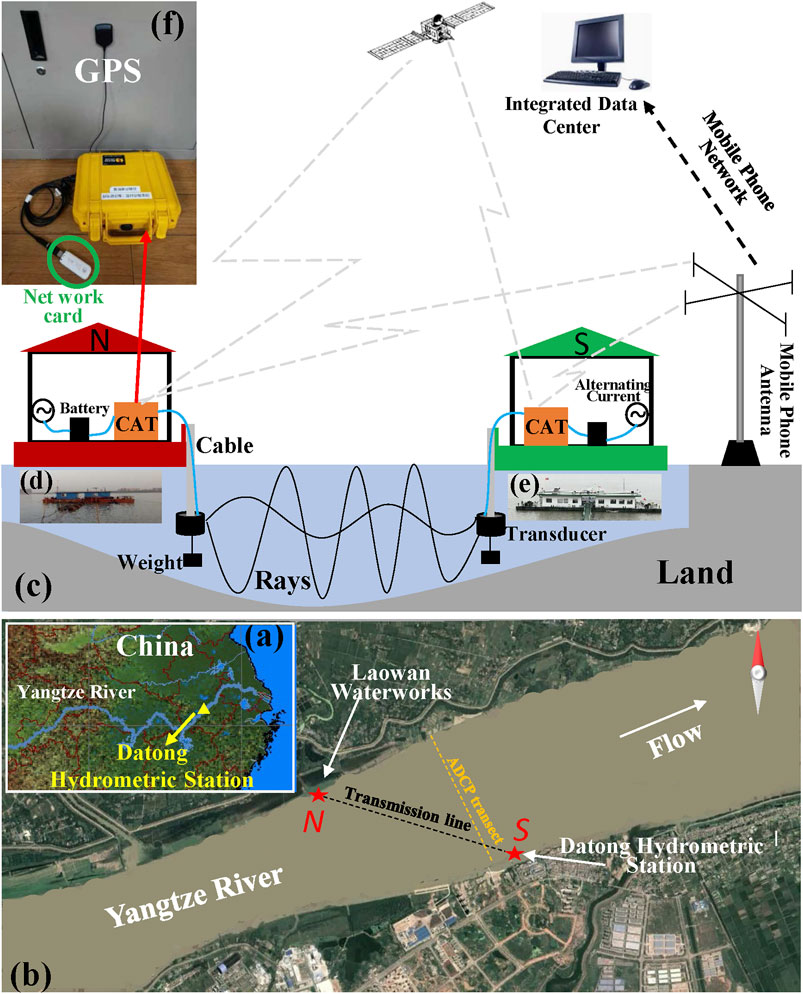
FIGURE 1. (A) Monitoring region; (B) positions of monitoring sites and transects; (C) schematic of the CAT systems. Two CAT systems are respectively placed at site N (Laowan Water Plant, (D) and site S (Datong hydrometric station, (E); (F) physical picture of the CAT system connected to a wireless network card and a GPS receiver. The orange and black dotted lines in panel (B) denote the voyage route of shipboard ADCP and the transmission line of CAT transducer-generated wave signals, respectively.
In July 2018, we deployed a set of CAT systems, including CAT instruments (Figure 1F), transducers for both transmitting and receiving, GPS, battery pack, wireless network cards, and SD memory cards, on both north (site N, Figure 1D) and south banks (site S, Figure 1E) of the Datong hydrometric station, with a distance of approximately 3,015 m between the sites, and an angle of approximately 31° between the survey line N-S and the north bank. The entire system was mounted on a floating barge (Figure 1C), and the transducers were suspended approximately 2 m underwater by iron chains, with AC power to continuously charge the battery packs.
Each CAT system relied on GPS for remote clock synchronization. The two CAT systems simultaneously sent a 9-kHz 11th-order M sequence every 5 min. After cross-correlating the original signal generated at a given site with the received signal from the opposite site, the signal-to-noise ratio (SNR) was increased by (
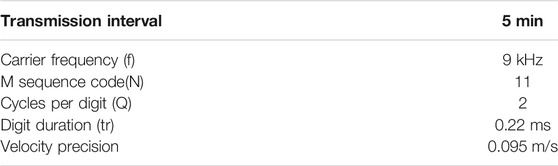
TABLE 1. Parameters of coastal acoustic tomography (CAT) systems.
Data Acquisition
As shown in Figure 1B, sites N and S are both a sound-transmitting point and a sound-receiving point. Assuming the same reciprocal travel path, and denoting the time for the sound wave to travel from N to S and S to N as
where, c and u are the range-averaged sound velocity and range-averaged flow velocity of the N-S transect cross-section, respectively. The flow direction is from N to S, with L being the horizontal distance between the sites. Combining Eq. 1 and Eq. 2 leads to:
where,
During CAT measurement, shipboard ADCP (600 kHz Rio Grande Workhorse) measurement was performed through 40 voyages. The ADCP was placed 0.5 m underwater, and the differential GPS receiver (used to record the real-time position) was mounted directly above the ADCP. ADCP sampling was performed every 2 s for a total of 70 bin number (each with a bin length of 0.5 m), and the unmeasurable top area was 0.25 m thick. Considering that the measurement of ship velocity was biased towards the ADCP bottom-tracking mode due to the bed material load near the bed of the Yangtze River (Jiang, 2008), the ship velocity was calculated using differential GPS. Given that the voyage route of the shipboard ADCP was not exactly along the preset transect, we projected the original flow velocity profile along the bank to the preset ADCP transect (Figure 1B). Finally, the flow velocity in the profile was averaged over 20 and 1 m in the horizontal and vertical directions, respectively, leading to grid data with a resolution of 20 m × 1 m.
The shipboard ADCP measurements of discharge in the surface layers, bottom layers, and the near-bank areas could not be obtained. The surface flow velocity was obtained through extrapolation of the ADCP-measured data of the first water layer. The near-bed flow velocity was obtained by linearly extrapolating the ADCP-measured data of the deepest layer towards the zero-velocity points of the river bottom (Gordon, 1989). Assuming that the near-bank water column gradually becomes shallow along a uniform underwater slope until it reaches the water-land boundary, the flow velocity in areas outside the monitoring region was obtained through extrapolation (Simpson and Oltmann, 1993). Finally, the range-averaged flow velocity and discharge of the transect cross-section were obtained through integration.
The salinity (zero in this study), temperature, and water depth of the monitoring region were measured using a conductivity-temperature-depth (CTD) profiler, and the obtained sound velocity profile was used for calculating the distribution patterns of acoustic rays. In addition, a stage logger with a measuring accuracy of ±0.5 cm was placed at the river bottom of the site S to measure the stage every 10 min, and the collected time series of the stage was used to estimate the cross-sectional area of the transect.
Regression Analysis and Error Computation of Discharge
To obtain the time series of discharge using continuous CAT measurement data (i.e.,
First, a direct-fitting method (hereinafter, DFM) with a quadratic polynomial equation fitted between the ADCP-measured discharge (
Meanwhile, a velocity-area method (hereinafter, VAM) was used by establishing two linear empirical equations: one between the range-averaged flow velocity (
Hence, the accuracy of discharge obtained by shipboard ADCP is critical to both VAM and DFM when establishing regression equations. Thus, it is necessary to accurately calculate the discharge error caused by shipboard ADCP measurement.
First, the cross-sectional area (
where,
Then, the discharge (
where,
Thus, the discharge errors of shipboard ADCP measurement can be estimated using Eq. 6 and Eq. 8.
In general, we considered that the scheme proposed herein to estimate the discharge is worthy to extend to other river cross sections. The main steps for the implementation are as follows. Two CAT systems, a stage logger, and CTD casts are used to obtain the basic data for discharge estimation. Regular repeated shipboard ADCP measurements (including cross-sectional flow velocity and area data) should be carried out during the experiment. The continuous discharge is obtained using VAM based on the CAT, ADCP, and stage data. However, heavy traffic and cruise safety in flood seasons are challenges encountered when collecting high-quality ADCP data.
Monitoring Results
Acoustic Ray Distributions
In our study, the sound speed generally increased with an increase in underwater depth in the water column of both winter and summer profiles except for the weak daily warming and the resulting shallow water sound channel in the upper few meters (Figures 2B,D). Ray simulation was separately performed according to the sound speed profiles in winter and summer with both sending the sound at angles that varied by a 0.1° increment from −20 to 20°, and the simulation results are shown in Figures 2A,C, respectively. Notably, the sound rays that reflected more than 10 times from the water surface and river bottom were ignored. Acoustic rays nearly covered the entire transect cross-section, in both winter and summer.Therefore, we deduced that the flow velocity observed using the CAT systems was the entire depth-averaged flow velocity along the sound transmission path.
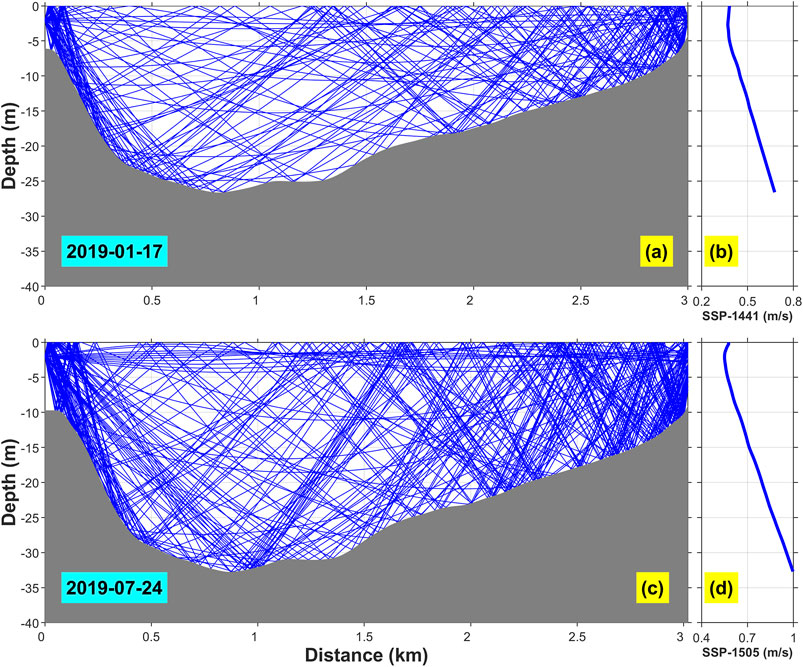
FIGURE 2. Simulated acoustic rays in the N-S transect cross-section: (A) winter; (C) summer; (B) and (D) present the corresponding sound speed profiles (SSPs).
Depth-Averaged Flow Velocity Derived From CAT Measurement
Figures 3A,B presents three-dimensional diagrams of SNRs received at sites N and S on January 9, 2020, respectively. The peak SNR values appeared at about 2.084 and 2.082 s, respectively. The reciprocal travel time calculated using the peak-SNR time data is shown in Figure 3C. The travel time varied from 1.99 to 2.09 s. The travel time from site S to site N was always longer than that measured in the opposite direction, indicating that the direction of river water flow remained unchanged downstream during the monitoring period. However, the barges used to mount the CAT systems were artificially moved from river bank to prevent grounding due to the seasonal changes in the stage in the Yangtze River, which resulted in an abnormally sudden change in the travel time (e.g., the time window of September 2018 shown with blue dotted lines in Figure 3). However, there was no abrupt abnormal change in the travel time difference (reflective of the range-averaged flow velocity of the transect cross-section).
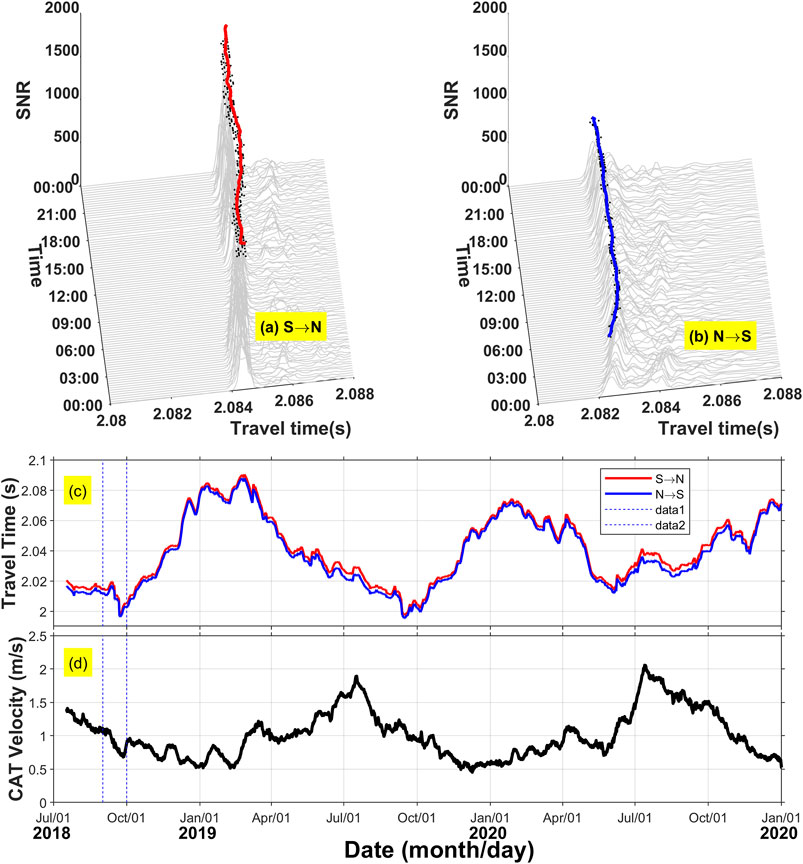
FIGURE 3. Stack diagrams of the sound signals received by CAT systems at site N(A) and site S(B) from 00:00 to 24:00 h on January 9, 2020. The positions of the arrival peaks are marked with red and blue dots. The time series of CAT-measured reciprocal travel time are shown in (C). The time series of range-averaged flow velocity (in the direction from site N to site S) are shown in (D).
The time series of the vertical section-averaged flow velocity along the N-S transect is shown in Figure 3D. The averaged flow velocity generally presented a seasonal pattern of low values in winter (0.45 m/s on December 9, 2019) and high values in summer (2.06 m/s on July 13, 2020), with a seasonal mean of 1.02 m/s. The mean of the measured averaged flow velocity was 1.24 m/s in the flood season (May to October) and 0.73 m/s in the dry season (November to April). The annual mean of the averaged flow velocity was 0.99 m/s in 2019 and 1.08 m/s in 2020. The peak flow velocities in the flood season were 1.89 m/s (July 17, 2019) and 2.06 m/s (July 13, 2020), and the minimum flow velocities in the dry season were 0.45 m/s and 0.52 m/s for 2019 and 2020, respectively.
Cross-Sectional Flow Velocity Measured by ADCP
The cross-sectional flow velocity measured by ADCP indicated that the flow direction in the monitoring region remained downstream throughout the year and that the river flow generally was strengthened with increasing depth, and a core velocity was observed in the surface layer (Figure 4). The core in the dry season was located around the largest depth approximately 1.4 km from the north shore (e.g., Figure 4 IV), whereas two cores existed in the flood season (e.g., Figure 4 XXX), which gradually shifted northward as the flow velocity increased (Figure 4 III-XVIII).
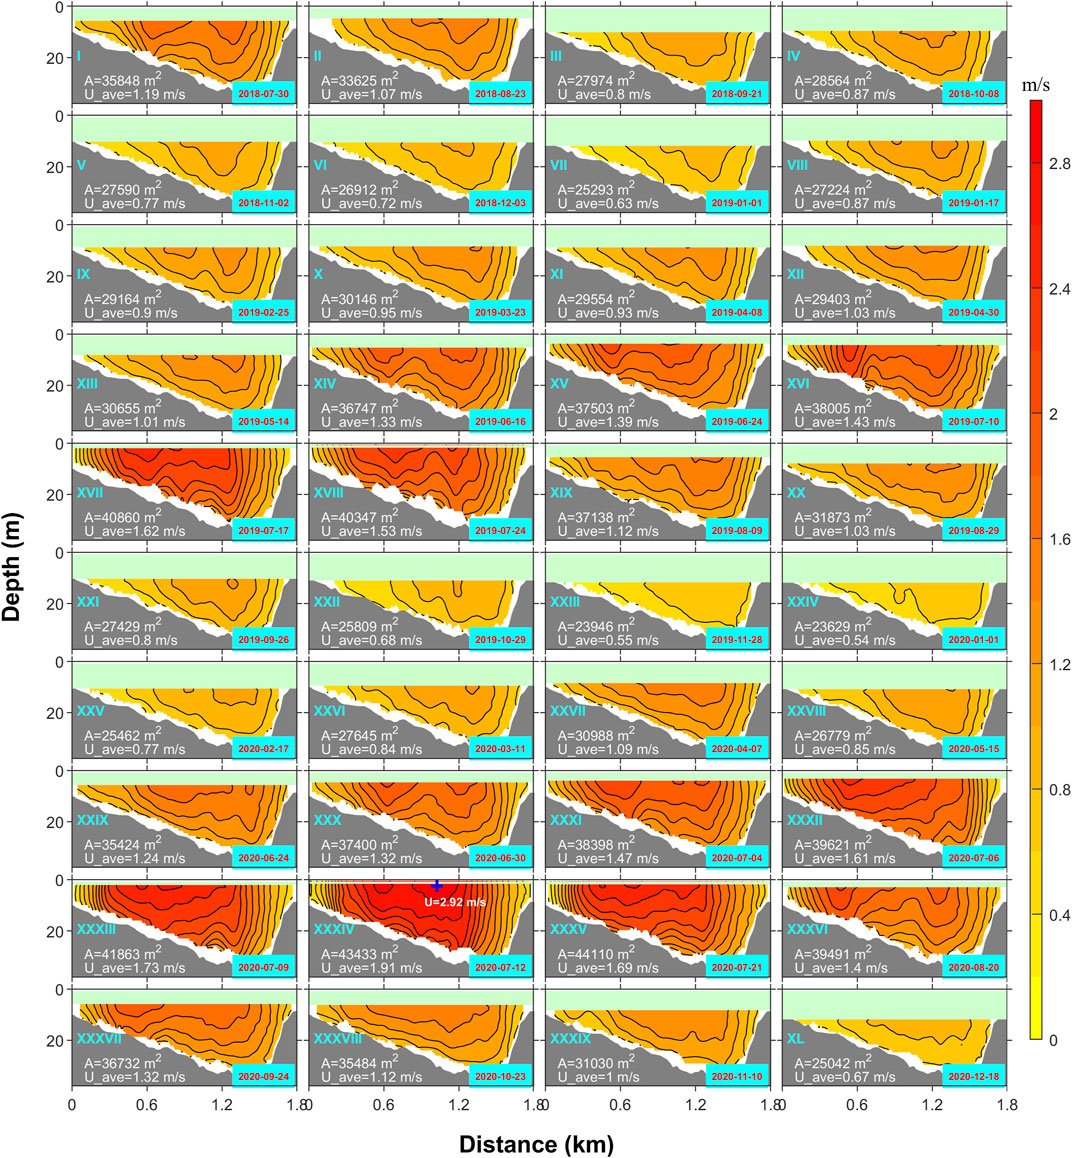
FIGURE 4. Shipboard ADCP-measured flow velocity of the transect cross-section. The contour interval is 20 cm/s. Dates are shown in the lower right corners. The cross-section area (A) and range-averaged flow velocity of transect cross-section (
The river discharge generally showed an obvious seasonal pattern. 1) The flow velocity showed a small horizontal shear in the dry season and did not vary greatly across the entire transect cross-section. 2) The flow velocity gradually increased in the flood season until it peaked in mid-July, and showed a large gradient, with the difference between the maximum and minimum flow velocities in the same transect cross-section exceeding 1 m/s. The maximum and minimum cross-section-averaged flow velocities were 2.05 (July 12, 2020, Figure 4 XXXIV) and 0.58 m/s (January 1, 2020, Figure 4 XXIV), respectively. In particular, the maximum velocity observed was 2.92 m/s (July 12, 2020, Figure 4 XXXIV). The river discharges were then estimated based on the 40 cross-sectional flow velocity data measured by ADCP.
Time Series of River Discharge
To obtain a continuous and long-term time series of discharge, both DFM and VAM methods were used as mentioned in Regression analysis and error computation of discharge.
The results of DFM showed that the ADCP-measured discharge (
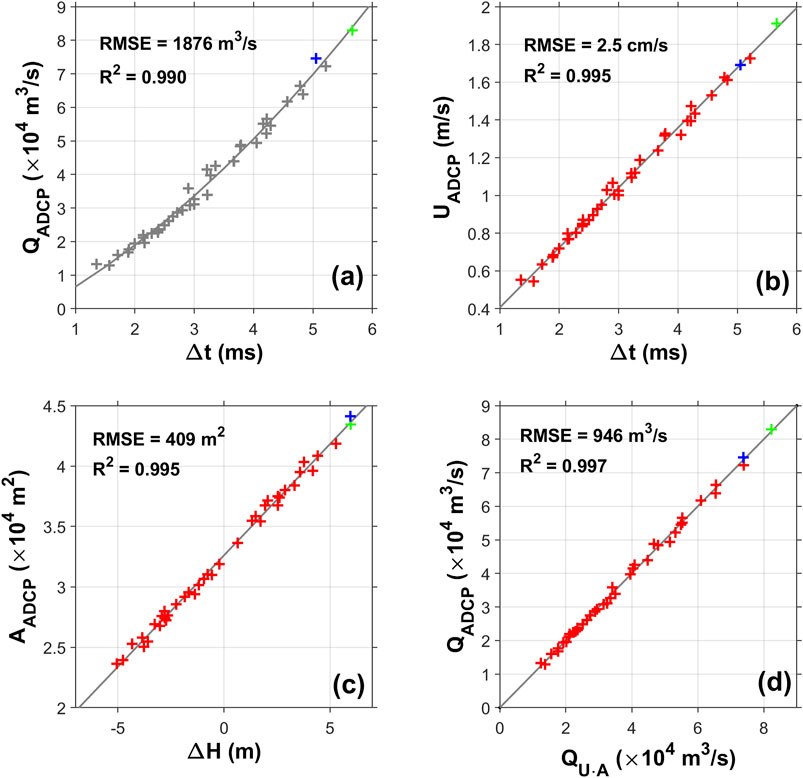
FIGURE 5. (A) Empirical relationship between the travel time difference (
However, the stage of the monitoring region varied significantly during the dry and flood seasons, with a difference as high as 11.88 m and a corresponding increase of 21,907 m2 in the transect cross-sectional area (the mean area was 30,374 m2). The large change in the cross-section area had a non-negligible effect on the estimated discharge.
The VAM was then developed to improve the accuracy of discharge estimation. A good linear relationship was observed between the ADCP-determined cross-section area (
As
The cross-sectional averaged flow velocity
On the contrary, the 40 cruises of shipboard ADCP distributed from January to December and covered dry and flood seasons of the Yangtze river throughout the year; the observation interval was approximately once a month (Figure 4). Thus, the discharge data obtained by shipboard ADCP can well represent the characteristics of seasonal variations of discharge. Therefore, the regression equations in Figure 5 can represent the characteristics in different seasons during the 2.5-years experiment period.
The time series of VAM- and DFM-derived discharge are shown in Figure 6. Considering that DFM-derived discharge was only determined by
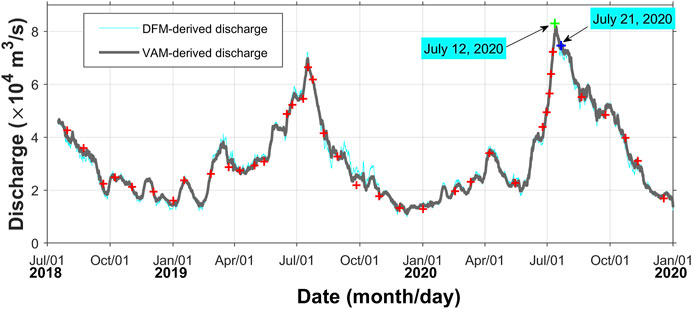
FIGURE 6. Time series of discharge of the Yangtze River obtained using the velocity-area method (VAM, gray line) and direct-fitting method (DFM, cyan line). The “+” symbols represent the discharge obtained by shipboard ADCP measurement.
Summary and Discussion
Two CAT systems were deployed at the Datong hydrometric station from July 2018 to January 2021, which provided a continuous and long-term time series of reciprocal travel time of sound wave. Moreover, long-term time series of stage data was obtained at site S. Forty flow velocity profiles were obtained through shipboard ADCP measurements during the period of CAT measurement.
The range-averaged flow velocity derived from the CAT systems exhibited an obvious seasonal pattern. The mean velocity over the 2.5-year period was 1.02 m/s. The maximum peak flow velocities in 2019 and 2020 was 1.89 and 2.06 m/s, respectively, whereas the minimum flow velocity in the dry season of the 2 years was 0.45 and 0.52 m/s, respectively.
The cross-sectional averaged flow velocity (
The VAM-derived discharge exhibited an obvious seasonal pattern of high values in summer and low values in winter, with a mean discharge of 30,708 m3/s over the 2.5-year period. The time series of discharge covered two complete flood processes. The annual mean discharge in 2019 and 2020 was 29,163 and 34,763 m3/s, respectively. The maximum peak discharge was 69,744 and 81,807 m3/s in the 2 years, whereas the minimum discharge in the respective dry season was 10,981 and 13,643 m3/s, respectively.
The estimated discharge errors mainly included the following: the discharge error measured by shipboard ADCP (
First,
By simultaneously considering these three errors, the discharge estimated using the direct-fitting method had a total error of
Bandini et al. (2020) reported a mean absolute error of 19.1% between PIV-derived discharge and discharge measured using an electromagnetic flow meter. The mean absolute error of discharge in this study was 2.2%, indicating that the CAT systems incorporating the velocity-area method can lead to a more accurate estimation of discharge.
The fall index method is derived from the Saint-Venant Unsteady Flow Momentum Equation (Szymkiewicz, 1993). However, the fall fails to accurately represent the actual gradient of a given river in case of a flood. The error in the representativeness of the fall may affect the accuracy in fitting the relationship between single-valued discharge and the stage, ultimately leading to large errors in discharge estimation.
Thus, an accurate relationship between the discharge and the stage should be established to obtain continuous and accurate discharge data. If the stage exceeds the historical limit, extrapolation of the established relationship to derive discharge would introduce severe errors (Coxon et al., 2015; Sӧrengård and Baldassarre, 2017) and likely result in uncertainty as high as 200% (Kiang et al., 2018). For extreme stages, the lack of real-time discharge data will introduce large uncertainties in the relationship between single-valued discharge and the stage, and thereby in the discharge estimated using the relationship.
In addition, water level gauge and ADCP measurements revealed that the stages on July 12 and 21, 2020 (before and after the peak flood discharge, respectively) were 12.42 (green “+” in Figure 5C) and 12.40 m (blue “+” in Figure 5C), respectively, corresponding to cross-sectional areas of 43,433 and 44,110 m2 (Figure 4 XXXIV and XXXV). Although the stage and cross-sectional area at the two moments were almost the same (Figure 5C), the ADCP measurements revealed that the range-averaged flow velocity (discharge) was 1.91 m/s (82,966 m3/s) and 1.69 m/s (74,597 m3/s) on July 12, 2020 and July 21, 2020, respectively, with a difference of 11.5% (10.1%). The difference in the CAT-measured travel time enables accurate determination of the range-averaged flow velocity (Figure 5B) and discharge (Figure 5D) at the two moments. The two moments (i.e., July 12 and 21, 2020) were either before or after the peak flood discharge, in a time period wherein the range-averaged flow velocity or discharge underwent rapid increase or decrease.
It is evident that stage-based estimation of discharge for such periods would introduce large errors. In contrast, the difference in the CAT-measured travel time reflects the range-averaged flow velocity of the transect cross-section (Eq. 4), which allows the accurate “capture” of instantaneous flow velocity and discharge of the peak flood flow. For example, the real-time data of
The 2020 floods occurred rapidly and lasted for a long time, and caused significant havoc in the Yangtze River Basin, with 141 deaths and a direct economic loss of 82.23 billion yuan (Zhou et al., 2021). Thus, efficient real-time monitoring measurement of Yangtze River discharge in key sites such as the present site can help predict the flood level in downstream sites. The downstream-flood prediction for disaster prevention and reduction is accomplished by providing key-site data to decision-making departments that are in charge of model prediction. Currently, the CAT systems are widely applied to measure the flow velocity and discharge of coastal and river waters that are subject to heavy waterway traffic. The CAT systems can not only provide continuous and long-term observation data with high time resolution, but can also transmit field data back to the data center in real-time via a wireless network, which allows real-time monitoring of flow velocity and discharge. Our study demonstrates the excellent application of CAT to real-time high-accuracy river discharge monitoring, which is of significance to scientific research, social production, and flood relief.
Data Availability Statement
The datasets presented in this study can be found in online repositories. The names of the repository/repositories and accession number(s) can be found below: https://doi.org/10.6084/m9.figshare.14595261.v3.
Author Contributions
Z-NZ, ZZ, and X-HZ contributed to conception and design of the study. JZ, LW, HW, SL, and QL organized the observational data. CZ, MC, and HZ performed the statistical analysis. Z-NZ, AK, and ZZ wrote the first draft of the article. ZZ, Z-NZ, and CZ obtain the field data. All authors contributed to article revision, read, and approved the submitted version.
Funding
This study was supported by the National Natural Science Foundation of China (Grant Nos 41906024, 41920104006, 41776107, and 52071293), the Scientific Research Fund of the Second Institute of Oceanography, MNR, (Grant Nos JT 1801, and JZ 2001), and the Project of State Key Laboratory of Satellite Ocean Environment Dynamics, SIO, MNR (SOEDZZ2106).
Conflict of Interest
The authors declare that the research was conducted in the absence of any commercial or financial relationships that could be construed as a potential conflict of interest.
Publisher’s Note
All claims expressed in this article are solely those of the authors and do not necessarily represent those of their affiliated organizations, or those of the publisher, the editors and the reviewers. Any product that may be evaluated in this article, or claim that may be made by its manufacturer, is not guaranteed or endorsed by the publisher.
References
Adityawarman, Y., Kaneko, A., Nakano, K., Taniguchi, N., Komai, K., Guo, X., et al. (2011). Reciprocal Sound Transmission Measurement of Mean Current and Temperature Variations in the central Part (Aki-Nada) of the Seto Inland Sea, Japan. J. Oceanogr 67, 173–182. doi:10.1007/s10872-011-0016-5
Arnell, N. W., and Gosling, S. N. (2016). The Impacts of Climate Change on River Flood Risk at the Global Scale. Climatic Change 134, 387–401. doi:10.1007/s10584-014-1084-5
Bandini, F., Lüthi, B., Peña‐Haro, S., Borst, C., Liu, J., Karagkiolidou, S., et al. (2021). A Drone‐Borne Method to Jointly Estimate Discharge and Manning's Roughness of Natural Streams. Water Res. 57 (2), e2020WR028266. doi:10.1029/2020WR028266
Cai, H., Savenije, H. H. G., and Jiang, C. (2014). Analytical Approach for Predicting Fresh Water Discharge in an Estuary Based on Tidal Water Level Observations. Hydrol. Earth Syst. Sci. 18, 4153–4168. doi:10.5194/hess-18-4153-2014
Chen, J. Y., Shan, H. T., and Yun, C. X. (1988). Shanghai: Shanghai Scientific and Technical Publishers. (in Chinese with English abstract).Processes of Dynamics and Geomorphology of the Changjiang Estuary.
Chen, Z., Li, J., Shen, H., and Wang, Z. (2001). Yangtze River of China: Historical Analysis of Discharge Variability and Sediment Flux. Geomorphology 41, 77–91. doi:10.1016/s0169-555x(01)00106-4
Costa, J. E., Cheng, R. T., Haeni, F. P., Melcher, N., Spicer, K. R., Hayes, E., et al. (2006). Use of Radars to Monitor Stream Discharge by Noncontact Methods. Water Resour. Res. 42, W07422. doi:10.1029/2005WR004430
Coxon, G., Freer, J., Westerberg, I. K., Wagener, T., Woods, R., and Smith, P. J. (2015). A Novel Framework for Discharge Uncertainty Quantification Applied to 500 UK Gauging Stations. Water Resour. Res. 51, 5531–5546. doi:10.1002/2014WR016532
Feng, D., Gleason, C. J., Yang, X., and Pavelsky, T. M. (2019). Comparing Discharge Estimates Made via the BAM Algorithm in High‐Order Arctic Rivers Derived Solely from Optical CubeSat, Landsat, and Sentinel‐2 Data. Water Resour. Res. 55, 7753–7771. doi:10.1029/2019WR025599
Gordon, R. L. (1989). Acoustic Measurement of River Discharge. J. Hydraulic Eng. 115, 925–936. doi:10.1061/(asce)0733-9429(1989)115:7(925)
Haddeland, I., Heinke, J., Biemans, H., Eisner, S., Flörke, M., Hanasaki, N., et al. (2014). Global Water Resources Affected by Human Interventions and Climate Change. Proc. Natl. Acad. Sci. USA 111 (9), 3251–3256. doi:10.1073/pnas.1222475110
Hauet, A., Kruger, A., Krajewski, W. F., Bradley, A., Muste, M., Creutin, J.-D., et al. (2009). Experimental System for Real-Time Discharge Estimation Using an Image-Based Method. J. Hydraulic Eng. 13 (2), 105–110.
Hoitink, A. J. F., Buschman, F. A., and Vermeulen, B. (2009). Continuous Measurements of Discharge from a Horizontal Acoustic Doppler Current Profiler in a Tidal River. Water Resour. Res. 45, W11406. doi:10.1029/2009WR007791
Kaneko, A., Zhu, X.-H., and Lin, J., 2020. Coastal Acoustic Tomography, Amsterdam, Netherlands: Elsevier, 362. doi:10.1016/B978-0-12-818507-0.00013-5
Kawanisi, K., Razaz, M., Kaneko, A., and Watanabe, S. (2010). Long-term Measurement of Stream Flow and Salinity in a Tidal River by the Use of the Fluvial Acoustic Tomography System. J. Hydrol. 380, 74–81. doi:10.1016/j.jhydrol.2009.10.024
Kiang, J. E., Gazoorian, C., McMillan, H., Coxon, G., Le Coz, J., Westerberg, I. K., et al. (2018). A Comparison of Methods for Streamflow Uncertainty Estimation. Water Resour. Res. 54, 7149–7176. doi:10.1029/2018WR022708
Lu, X. X. (2004). Vulnerability of Water Discharge of Large Chinese Rivers to Environmental Changes: an Overview. Reg. Environ. Change 4, 182–191. doi:10.1007/s10113-004-0080-0
Mei, X., Dai, Z., Darby, S. E., Gao, S., Wang, J., and Jiang, W. (2018). Modulation of Extreme Flood Levels by Impoundment Significantly Offset by Floodplain Loss Downstream of the Three Gorges Dam. Geophys. Res. Lett. 45, 3147–3155. doi:10.1002/2017GL076935
Moftakhari, H. R., Jay, D. A., Talke, S. A., Kukulka, T., and Bromirski, P. D. (2013). A Novel Approach to Flow Estimation in Tidal Rivers. Water Resour. Res. 49, 4817–4832. doi:10.1002/wrcr.20363
Munk, W., Worcester, P., and Wunsch, C. (1995). Ocean Acoustic Tomography. New York: Cambridge University Press. doi:10.1017/CBO9780511666926
Schmidt, A. R. (2002). Analysis of Stage-Discharge Relations for Open-Channel Flows and Their Associated Uncertainties (Doctoral Dissertation). Retrieved from IDEALS. Urbana-Champaign: University of Illinois. Available at: http://hdl.handle.net/2142/83191.
Sörengård, M., and Di Baldassarre, G. (2017). Simple vs Complex Rating Curves: Accounting for Measurement Uncertainty, Slope Ratio and Sample Size. Hydrological Sci. J. 62 (13), 2072–2082. doi:10.1080/02626667.2017.1367397
Szymkiewicz, R. (1993). Solution of the Inverse Problem for the Saint Venant Equations. J. Hydrol. 147 (1), 105–120. doi:10.1016/0022-1694(93)90077-M
Teledyne RD Instruments (2013). Versatile River Discharge Measurement System. Available at: https://www.comm-tec.com/Prods/mfgs/RDI/brochures/rio_grande_ds_lr.pdf.
Trimble BX982 (2019). Dual Antenna GNSS Module for Precise Position and Heading Applications. Available at: https://info.intech.trimble.com/bx982-datasheet.
Wu, S., Liu, X., and Peng, Y. (2010). Analysis and Study for Uniformization of Water Level-Discharge Relation of Erlangji Station on Changjiang. Yangtze River 40 (21), 42–45. (in Chinese with English abstract).
Yang, S. L., Gao, A., Hotz, H. M., Zhu, J., Dai, S. B., and Li, M. (2005). Trends in Annual Discharge from the Yangtze River to the Sea (1865–2004). Hydrological Sci. J. 50 (50), 825–836. doi:10.1623/hysj.2005.50.5.825
Zhang, E., Chen, X., and Wang, X. (2003). Water Discharge Changes of the Changjiang River Downstream Datong during Dry Season. J. Geographical Sci. 13 (3), 355–362. doi:10.1007/s11769-003-0027-2
Zhang, L., and Cao, G.-Z. (2014). Study on Single Valued Processing of Water Level-Discharge Relationship at Datong Station. J. Shanghai Second Polytechnic Univ. 31 (1), 74–77. (in Chinese with English abstract). doi:10.3969/j.issn.1001-4543.2014.01.013
Zheng, H., Gohda, N., Noguchi, H., Ito, T., Yamaoka, H., Tamura, T., et al. (1997). Reciprocal Sound Transmission experiment for Current Measurement in the Seto Inland Sea, Japan. J. Oceanography 53, 117–127.
Zhou, Z.-Q., Xie, S.-P., and Zhang, R. (2021). Historic Yangtze Flooding of 2020 Tied to Extreme Indian Ocean Conditions. Proc. Natl. Acad. Sci. USA 118 (12), e2022255118. doi:10.1073/pnas.2022255118
Zhu, X.-H., Zhang, C., Wu, Q., Kaneko, A., Fan, X., and Li, B. (2012). Measuring Discharge in a River with Tidal Bores by Use of the Coastal Acoustic Tomography System. Estuarine, Coastal Shelf Sci. 104-105, 54–65. doi:10.1016/j.ecss.2012.03.022
Keywords: acoustic tomography technology, flow velocity, discharge monitoring, flood, Yangtze River
Citation: Zhu Z-N, Zhu X-H, Zhang C, Chen M, Zheng H, Zhang Z, Zhong J, Wei L, Li Q, Wang H, Li S and Kaneko A (2021) Monitoring of Yangtze River Discharge at Datong Hydrometric Station Using Acoustic Tomography Technology. Front. Earth Sci. 9:723123. doi: 10.3389/feart.2021.723123
Received: 10 June 2021; Accepted: 06 September 2021;
Published: 20 September 2021.
Edited by:
Valentijn Pauwels, Monash University, AustraliaCopyright © 2021 Zhu, Zhu, Zhang, Chen, Zheng, Zhang, Zhong, Wei, Li, Wang, Li and Kaneko. This is an open-access article distributed under the terms of the Creative Commons Attribution License (CC BY). The use, distribution or reproduction in other forums is permitted, provided the original author(s) and the copyright owner(s) are credited and that the original publication in this journal is cited, in accordance with accepted academic practice. No use, distribution or reproduction is permitted which does not comply with these terms.
*Correspondence: Xiao-Hua Zhu, eGh6aHVAc2lvLm9yZy5jbg==