- 1The CAS Key Laboratory of Microwave Remote Sensing, National Space Science Center, Chinese Academy of Sciences, Beijing, China
- 2The State Key Laboratory of Tropical Oceanography (LTO), South China Sea Institute of Oceanology, Chinese Academy of Sciences, Guangzhou, China
This article attempts to analyze the influence of the anisotropic effects of the ocean wave surface on SAR altimetry backscatter coefficient (Sigma-0) measurements, which has not been intensively addressed in publications. Data of Sentinel-3A, Cryosat-2, and Jason-3 altimeters allocated by the WW3 numeric wave model were analyzed, and the patterns of Sigma-0 with respect to the wave direction were acquired under ∼2 m significant wave height. The ocean waves were classified into six categories, among which the moderate swell and short win-wave cases were analyzed intensively. Swell-dominated ocean surface shows less randomness than the wind-wave-dominated ocean surface. Clear and significant sinusoid trends are found in the Sigma-0 and SSB patterns of both operational modes (SAR mode and PLRM mode) of the Sentinel-3A altimeter for the moderate swell case, indicating the sensitivity of Sigma-0 and SSB measurements to the anisotropic features of the altimeter measurements. The anisotropic pattern in the Sentinel-3A PLRM Sigma-0 is somewhat counterintuitive, but the analysis of Jason-3 altimeter data would show similar results. Additionally, by comparing the anisotropic patterns of two orthogonally polarized SAR altimeters (Sentinel-3A and Cryosat-2), we could draw the conclusion that the Sigma-0 measurements are not sensitive to the polarization mode. As for the SSHA patterns, no clear sinusoid could be identified for the moderate swell. A possible explanation is that the SSB pattern may be overwhelmed in the complicated factors that can influence the SSHA pattern.
Introduction
Satellite altimetry is one of the most intriguing ocean remote sensing techniques, which has provided operational products of not only the sea level but also ocean wave and wind, for decades, and has made solid contribution in the global ocean and climate study (Chelton et al., 2001; Stammer and Cazenave, 2017).
In the late 1990s, the concept of the delay-Doppler altimeter (also called the “Synthesis Aperture Radar Altimeter (SARA)” in the altimetry community later) was proposed by Raney (Raney, 1998). SARA outperforms Conventional Radar Altimetry (CRA) in many aspects: the along-track resolution is improved by an order of magnitude, which brings advantages in sea ice and coastal and hydrologic application; the instrument height noise is reduced by roughly a half, which improves the precision of the sea level measurement over open ocean surfaces. Payloads on Cryosat-2 and Sentinel-3 satellites have successfully demonstrated the potentials of this new technique (Wingham and Francis, 2006; Donlon et al., 2012), among which the altimeter on Jason-MF (in memory of the former NASA president Michael Freilich)/Sentinel-6 satellite is the latest (Parisot et al., 2018).
Sea state bias (SSB) is currently the largest uncertainty source in the altimetry error budget with the remarkable improvements in orbit determination technology. By definition, SSB can be derived from the three-dimension backscattering field of the radar (Elfouhaily et al., 2000),
where x, y, z are the three axes of the local Cartesian coordinate system (usually x is the along-track direction, y is the across-track direction, and z is the upward direction), zx
Even the rationale of the SSB for CRA is not sufficient enough, and no theoretical correction method can give better results than empirical ones. The studies on the SSB for SARA can only been traced back to a few years. Bellingham et al. (2016) proposed a simplified theoretic mode and analyzed some Cryosat-2 altimeter SAR mode data, but they did not find significant error due to the swell wave period (equivalent to the square root of wavelength) and wave direction for SWH<4 m. Moreau et al. (2018a, 2018b) analyzed the noise level of SWH and range measurements of Cryosat-2 and Sentinel-3A altimeters. They found that the range and SWH noise level were weak but clearly dependent on the wave direction, and the noise level was higher for shorter swell. The studies by Morrow et al. focused on the range and SWH noise level under long swell (relatively less frequent over the ocean), while the characteristics of Sigma-0 measurements were not addressed. Pires et al. (2018) processed some Sentinel-3A altimeter data with collocated Sentinel-1 SAR mode, finding that longer swell usually corresponded to higher Sigma-0 and the eastward swells were more likely to have larger SWH and smaller Sigma-0 (this feature may be primarily due to the geographic pattern of the westerlies). This work did not present the results of PLRM mode of the Sentinel-3A altimeter, and data under various sea states were analyzed together and the high sea state regions (e. g., westerlies) may introduce additional errors. This paper attempts to analyze the influence of the anisotropic effects on SARA measurements. To the authors’ knowledge, there has been no publication in this issue yet.
Altimetry Geometry and Ocean Surface Anisotropy
Altimetry Geometry
One distinction between CRA and SARA is the anisotropic observation geometry. Satellite altimeters are nadir-pointing radars, except wide swath ones such as the primary payload of SWOT (Surface Water and Ocean Topography, Fjørtoft et al., 2014). For CRA, the resolving ability is achieved solely by the time delay (or range) bins determined by the altimeter pulse width. The equal-delay lines over a flat ocean surface are depicted in Figure 1 (red dotted lines). The echo power of a bin in a CRA waveform is the integral along the annuli formed by neighboring equal-delay lines.
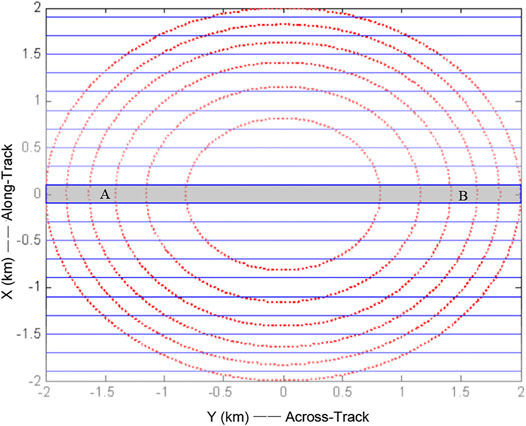
FIGURE 1. Equal-delay and equal-Doppler lines of altimeters (Xu et al., 2010).
On the other hand, the SARA introduces a second resolving dimension: the Doppler domain. Theoretically, the equal-Doppler lines are hyperbolas, but in nadir geometry, they can be well approximated to straight lines in the across-track direction (see blue solid lines in Figure 1). The waveforms are compressed to a narrow stripe, and the echo power of a bin in a waveform is the integral along small blocks formed by neighboring equal-delay lines and neighboring equal-Doppler lines.
Intuitively, the anisotropic features (due to wave or wind directivity) of the ocean surface would not have significant influence on the measurements in CRA because the radar footprint is isotropic. On the other hand, the footprint of a SARA is highly anisotropic (the across-track resolution is roughly a magnitude larger than the along-track resolution), so the echo would be different if the ocean surface is anisotropic.
It can also be noted that the SARA has an intrinsic limitation in across-track resolving (e.g., points A and B in Figure 1 share the same delay bin and Doppler bin, so they are unresolvable unless an across-track interferometric measurement can be provided). Therefore, it can be expected that the anisotropic effect would have a 180° ambiguity (i. e., we cannot determine the wave propagating direction from the two opposite directions).
Characteristics of Ocean Surface Anisotropy
To describe the anisotropy of the sea surface, one can adopt either the ocean wave direction or the ocean surface wind direction. The two directions are approximately consistent when the wind-wave dominates, while for the swell-dominated sea surface, the wave direction can diverge significantly from the wind direction. The wave direction is superior to the wind direction in our analysis because the most cumbersome influence of anisotropy on the altimetry measurements is the SSB, which relies much more on ocean waves than on the ocean surface wind.
The satellite ground track is inclined, so it is the “relative wave direction”, rather than the absolute wave direction that counts,
where
Data
Satellite Altimetry Data
Satellite data from three altimetry missions were processed in this work: Sentinel-3A, Jason-3, and Cryosat-2. Sentinel-3 is the first altimetric mission that can provide global measurements in SAR mode, while it can also act as an equivalent CRA, generating the so-called “PLRM (pseudo low resolution mode)” data product. Jason-3 is the successor of the most recognized altimetry missions (Topex/Poseidon, Jason-1 and Jason-2) and currently the reference mission for the altimetry community. Jason-3 altimeter is a CRA, which is an ideal counterpart of Sentinel-3A SARA. Cryosat-2 is the first satellite that carries an altimeter with SAR mode, but the SAR data are only available over limited regions (Bouffard et al., 2017). Cryosat-2 is the first altimetric mission with SAR mode, the altimeter onboard that has a polarization orthogonal to that of Sentinel-3A, so it is helpful in evaluating the influence of polarization configuration on the measurements.
The data are all GDR (Geophysics Data Record) products downloaded from the official websites. The Sentinel-3A data are distributed by the Copernicus Marine Environment Monitoring Service (CMEMS), ESA (European Space Agency, https://sentinel.esa.int); the Jason-3 data are maintained by the Archiving, Validation, and Interpretation of Satellite Oceanographic Data (AVISO, http://www.aviso.altimetry.fr); the Cryosat-2 data can be downloaded from the ESA CryoSat-2 dissemination server (ftp://science-pds.cryosat.esa.int). For all the satellites, the Sigma-0, SWH (Significant Wave Height) and SSHA (Sea Surface Height Anomaly) measurements were extracted. No valid SSB parameter can be extracted from the SAR mode of CryoSat-2 altimeter GDR, so we only processed the SSB of Sentinel-3A and Jason-3. If not specifically declared, the time span of the analysis is the whole year of 2018. Some data of year 2017 were also processed to clarify if there were time-dependence features.
Numeric Wave Model Data
The numeric wave model data can provide the information of ocean wave, which can be very helpful for the investigation of the ocean surface anisotropy. WaveWatch III (WW3), consisting of hourly, 1 ° × 1 ° gridded field of ocean SWH), wavelength, wave period, and wave direction, is one of the most accredited wave modes (Rascle and Ardhuin, 2013). Some empirical SSB models adopted the wave period as a parameter. For a gravity wave, according to the dispersion theory, the wave period is proportional to the root square of the wavelength. Wavelength is more pertinent to the altimetric observation geometry, so we use wavelength as an index of the ocean wave rather than the wave period. The waves are partitioned into many (usually more than 20) components sorted from the largest wave height to the smallest wave height. In this work, we extract the parameters of the largest wave component, since the largest wave component usually accounts for a large fraction of the wave energy.
Methodology
Wave Type Identification
The ocean waves (restricted to gravity waves in this work) can be categorized into three types: wind-dominated wave, swell-dominated wave, and mixed wave (Ardhuin, 2019). Wind-waves are arisen from local winds, while swells are the waves generated by winds in remote storms. Swells usually have longer wavelength and less randomness, so they are more likely to cause bias in altimetric measurements. The radar altimeter has the advantage to measure the significant wave height (SWH) and wind speed simultaneously, from which the wave type information can be inferred. The wind/swell contribution can be roughly described by the “pseudo wave-age (Fu and Glazman, 1991),”
where Ψ is a function of the ratio of the wave potential energy and wind kinetic energy, a and b are empirical coefficients, and g is the gravity acceleration. For a fully-developed pure wind-wave, Ψ = 1.21; a smaller wave-age infers a developing wind-wave, while a larger wave-age means a contribution of swell (for a pure swell, Ψ = ∞).
The “wind_sea_fraction” parameter in the WW3 data was extracted as the indicator of the ocean wave type. The parameter is proposed by Hanson and Phillips (2001) and implemented as described in Tracy et al. (2007). The value of the “wind-sea fraction of partition (W)” is defined as
where E is the total spectral energy and E|Up>c is the energy in the spectrum for which the projected wind speed Up is larger than the local wave phase velocity c. For the pure wind sea, W = 1, while for the pure swell, W = 0.
For wind_sea_fraction<0.3, the ocean wave is identified as swell-dominated wave (abbreviated to “swell” hereinafter); for wind_sea_fraction>0.7, the ocean wave is identified as the wind-dominated wave (abbreviated to “wind-wave” hereinafter); otherwise, the ocean wave is identified as mixed wave. The thresholds of 0.3 and 0.7 are somewhat arbitrary, while they leave enough margins to alleviate the ambiguity between wind-waves and swells. The mixed waves were not investigated in this work.
In many publications, the wind-wave and swell are distinguished according to the ocean wavelength. For instance, in Toffoli and Bitner-Gregersen. (2017), swells have a typical wavelength that is greater than 260 m (i.e., wave period larger than 13 s) up to maximum of approximately 900 m. We would find that the strategy of wave classification has a very significant influence on the anisotropic patterns, as shown in On the Strategy of Wave Type Identification Section.
Data Matching
The numeric wave model data are gridded data in both time and space domains, so the data must be interpolated to the time and location of the altimeter measurements. In the time domain, we just choose the time stamp closest to the altimeter measurement; this strategy can introduce a mismatching error. The mismatching time errors obey a uniform distribution in the interval of (−0.5 h, +0.5 h), and the wave characteristics are highly correlative in such a short time scale. We carried out experiments to estimate the effect of this simplification with respect to linear interpolation, showing that the difference can be safely negligible. In the space domain, because the spatial resolution of WW3 is relatively coarse, we carried out bilinear interpolations from the four closest grids,
where X is a measurement (it could be wavelength, wave direction, etc.), the subscripts nw, ne, sw, and se denote the northwest, northeast, southwest, and southeast grids around the location of the altimeter measurement respectively, and the Ws are the corresponding weights,
where lon and lat are the longitude and latitude of the grid point, respectively. After the data matching, WW3 wave information (wave height, wavelength, wave direction, and wind-sea fraction) was merged into every altimeter measurement.
Data Editing Criterion
The most stringent requirement for accurate backscatter measurement is the SSB correction, which is significantly dependent on the quality of both the SWH and the radar backscatter coefficient (Sigma-0). To evaluate the influence of the Sigma-0 measurement on SSB, we picked out the altimetry measurements having a SWH within 2 ± 0.1 m. The measurement noise level of SWH is comparable to 0.1 m, so the SWHs are statistically indistinguishable. The data pole-ward of 50°of latitude were discarded to circumvent the influence of sea-ice because a significant portion of altimeter measurements were acquired over high-latitude zones. The rain-contaminated measurements were also discarded according to the rain flag in the data product.
The typical SARA along-track resolution is 250–300 m, so we categorized the ocean wave into three regions according to the wavelength: short wave region (wavelength less than 100 m), moderate wave region (wavelength between 100 and 400 m, comparable to the along-track resolution of SARA), and long wave region (wavelength larger than 400 m). Therefore, six types of ocean waves can be identified: 1) short swell, 2) moderate swell, 3) long swell, 4) short wind-wave, 5) moderate wind-wave, and 6) long wind-wave. The criteria for classification of the wave type are tabulated in Table 1 (L denotes the wavelength and W denotes the wind-sea fraction).
Generation of the Anisotropic Pattern
To establish the relationship between Sigma-0 (and SSB) and the relative wave direction, we computed the relative wave directions of all the measurements. Every altimetric measurement can contain a relative wave direction (computed from the WW3 wave direction interpolation value and the satellite flight direction), and this direction is within the range of 0–360°. This angle range can be split to 72 bins with a step of 5°. We read this direction and allocate the corresponding measurements in a predefined stack. All the measurements in the first stack has a relative wave direction of 0–5°, all the measurements in the second stack has a relative wave direction of 5–10°, etc. Consequently, we have 72 stacks, each of which contains a large number of measurements (every measurement contains Sigma-0, SSB, SWH, SSHA, wavelength, wave direction, etc.). Finally, we computed the statistics of each stack as a represent of each bin and drew a curve called “pattern” from the median value of each bin of the relative wave direction. The pattern of Sigma-0, SSB, and SSHA are all generated in the same way, and they can indicate the features of the anisotropic effect.
Results
Ocean Wave Characteristics
The ocean wave characteristics collocated to the altimeter measurements were analyzed, the waves showed a distinct anisotropic feature, and the east-west propagating wave dominated in the histogram (Figure 2A). The histogram of pseudo wave-age computed from Eq. 3 was also depicted as Figure 2B. The histogram of pseudo wave-age has a long tail, indicating that swell is more popular in the ocean than wind-wave. We computed the pseudo wave-age of Sentinel-3A and Jason-3 measurements using the Topex values (in Topex altimetry, a = 3.24, b = 0.62), but according to the Ψ = 1.21 threshold, only 3% of the waves can be identified as wind-wave, which is unrealistically low. An explanation of this situation is that the coefficients a and b (Eq. 3) should be estimated by individual altimeter data products, while different mission has different estimations due to the residual errors in the altimeter calibration. To circumvent the potential calibration errors, pseudo wave-age is not adopted as a wind/swell indicator. The “wind_sea_fraction” indictor is used to classify the wind-wave and swell.
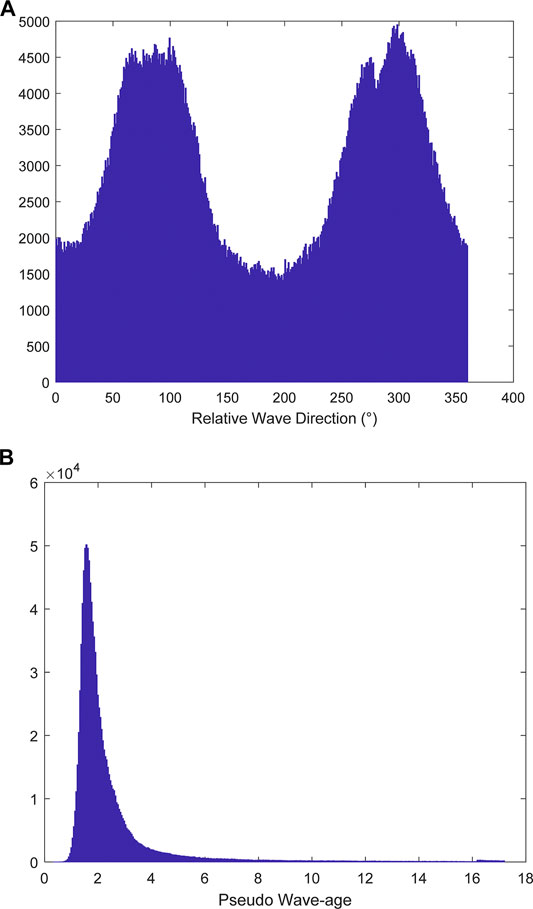
FIGURE 2. Histogram of the Sentinel-3A collocated (A) relative wave directions and (B) pseudo wave-age in 2018 (SWH within 2 ± 0.1 m).
The numbers and percentages of different wave type are summarized in Table 2. Swells are almost twice as frequent as wind-waves in the global oceans. For swells, the waves with moderate wavelength dominate (accounting for ∼80%), while for wind-waves, the waves with short wavelength dominate (accounting for ∼82%). Therefore, only the moderate swell case and the short wind-wave cases are presented intensively.

TABLE 2. Numbers and percentages of different wave types (Sentinel-3A, SWH within 2 ± 0.1 m, year 2018).
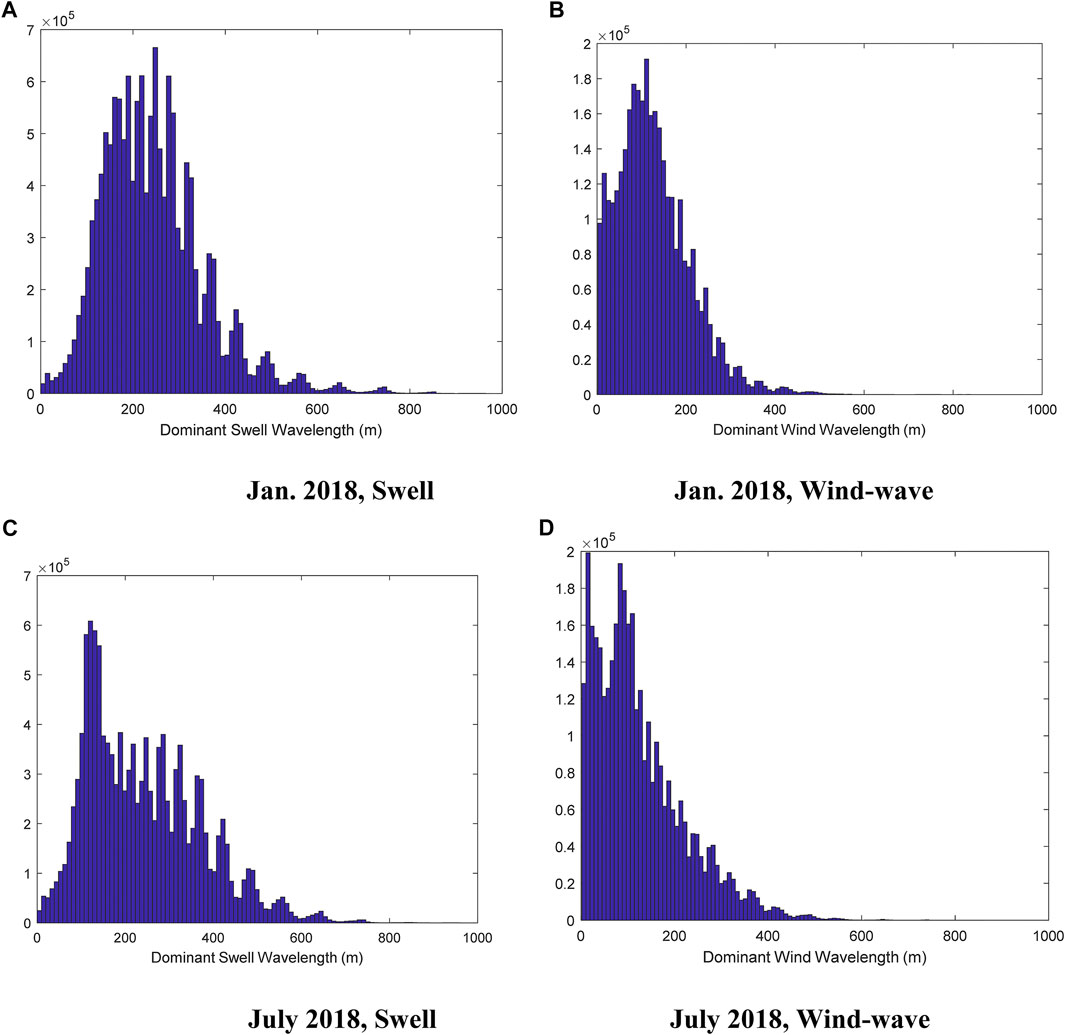
Histograms of the dominant wavelengths of the WW3 swell and wind-wave in different seasons are shown in Figure 3. Both in the north-hemisphere winter and in north-hemisphere summer, the average wavelength of the wind-wave is about half of the wavelength of the swell, which is consistent with our expectation.
Sentinel-3A Anisotropic Pattern
The Sigma-0 anisotropic pattern of Sentinel-3A for the moderate swell and short wind-wave satellite altimeter were analyzed and the results are shown in Figure 4. For the moderate swell, the patterns reach maximum around 0° (360°) or 180°. To investigate the influence of SAR configuration on the measurements, both SAR and PLRM modes were analyzed. Surprisingly, the anisotropic patterns of the two Ku-band modes (and the C-band) are very similar. The pattern for short wind-wave is more irregular: no distinct sinusoid feature can be identified.
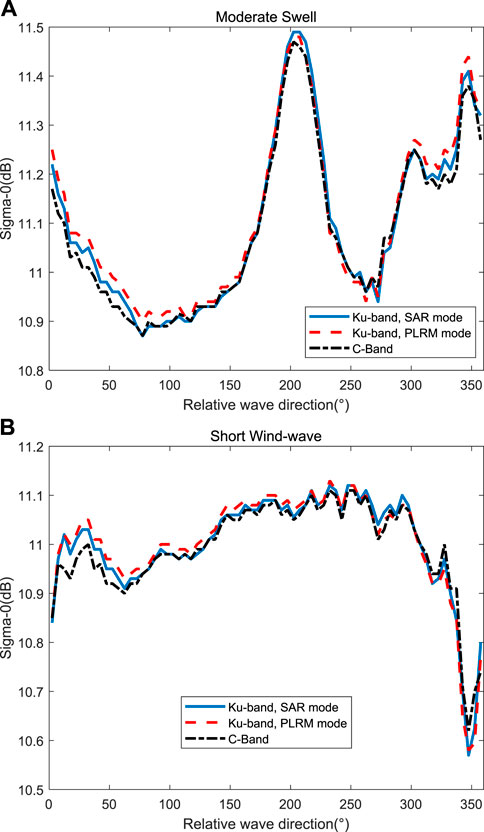
FIGURE 4. Sentinel-3A Sigma-0 anisotropic pattern (A) for moderate swell; (B) for short wind-wave: solid blue: Ku-Band, SAR mode, dashed red: Ku-Band, PLRM mode, dot-dash black: C-Band.
To evaluate the agreement of the patterns between different modes, the correlation coefficients are tabulated in Table 3, 4 for the two most frequent wave types (moderate swell and short wind). All the correlation coefficients are larger than 0.97, indicating that the introduction of the SAR mode has little influence on the Sigma-0 patterns. The dynamic range of the SAR mode is 0.62 dB, only slightly larger than that of the PLRM mode (0.58 dB). The C-band Sigma-0 product may contain an uncalibrated bias: typically, the Sigma-0 of the C-band is 1∼2 dB greater than that of the Ku-band (noting the −1.5 dB offset for the Jason-3 altimeter in Figure 5), but for Sentinel-3 altimeter, the Sigma-0 values for the two bands have little difference. Nevertheless, this bias does not change the shape of the patterns.

TABLE 3. Correlation coefficients of Sentinel-3A Sigma-0 anisotropic patterns between different modes (moderate swell, year 2018).

TABLE 4. Correlation coefficients of Sentinel-3A Sigma-0 anisotropic patterns between different modes (short wind-wave, year 2018).
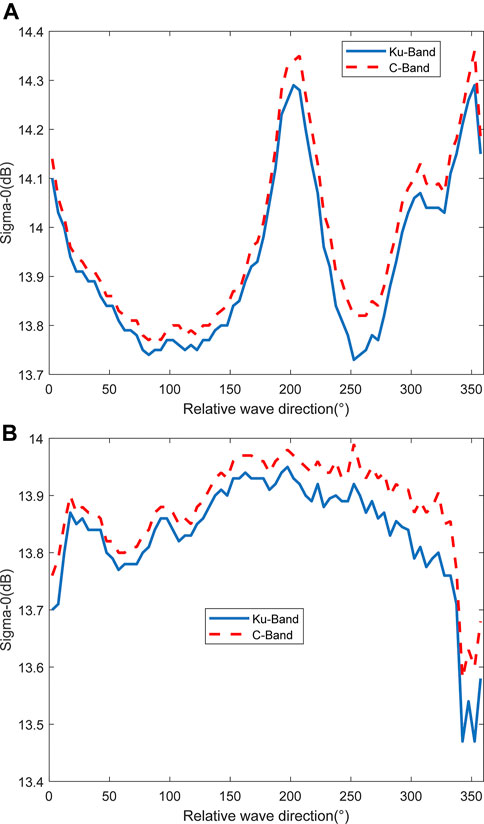
FIGURE 5. Jason-3 Sigma-0 anisotropic pattern (A) for moderate swell; (B) for short wind-wave: solid blue: Ku-Band, dashed red: C-Band. An offset of −1.5 dB is added to the C-band Sigma-0.
Jason-3 Anisotropic Pattern
The unexpected sinusoid feature for the Sentinel PLRM Sigma-0 pattern for the swell case was reinforced by the results of Jason-3. As a representative CRA, the Sigma-0 anisotropic pattern for the moderate swell and short wind-wave of Jason-3 satellite altimeter was analyzed and the results are shown in Figure 5. Similar sinusoid trend can be found in the swell pattern. An offset of −1.5 dB is added to the C-band Sigma-0 for a better demonstration. The patterns or the two bands also show excellent agreement. For the moderate swell condition, the correlation coefficient between two bands is 0.9977, while for the short wind-wave condition, the correlation coefficient between two bands is 0.9896.
Cryosat-2 Anisotropic Pattern
The Sigma-0 anisotropic pattern of the Cryosat-2 satellite altimeter was analyzed and the results are shown in Figure 6 (for moderate swell). The pattern is extremely noisy, mainly due to the poor geographic distribution of Cryosat-2 SAR mode. Most measurements of SAR-mode were acquired from the polar region. In fact, the data pole-ward of 50° of latitude were discarded to circumvent the influence of sea-ice. Only few regions (e.g. the Mediterranean Sea, south to the Southern African coast and north to the Indonesian coast) have enough data, resulting in relatively large representative errors. In spite of this, the Cryosat-2 pattern also shows a roughly sinusoid trend, especially in the region of 0–180°.
Discussion
On the Strategy of Wave Type Identification
As mentioned in the Wave Type Identification section, we use the “wind_sea_fraction” parameter of the WW3 data product as a criterion to classify the ocean wave. A larger fraction corresponds to a wind-dominated wave, while a smaller fraction corresponds to a swell-dominated wave. This strategy is somewhat different to the commonly-used strategy (e. g., Toffoli and Bitner-Gregersen, 2017), which is solely dependent on the wavelength. To investigate the influence of the wave classification strategy, we generated the patterns under different strategies and compared the corresponding patterns of swell and wind-wave. The Sigma-0 patterns for swell and wind-wave of the Sentinel-3 altimeter using different strategies are shown in Figure 7.
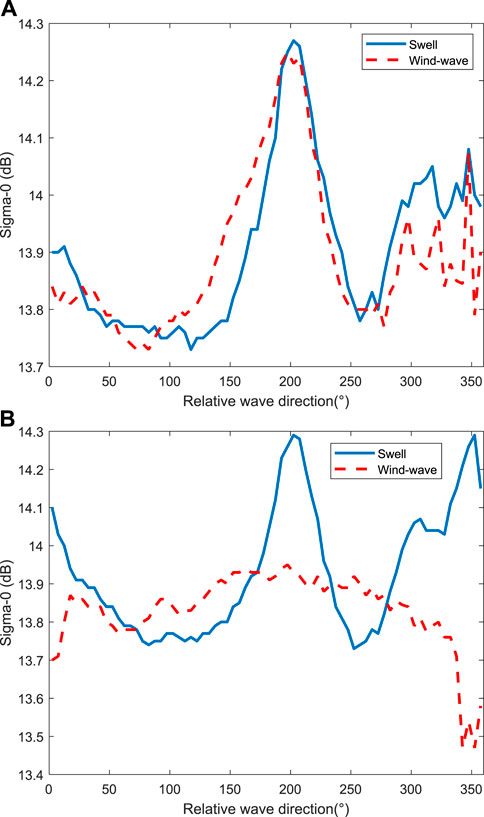
FIGURE 7. The Sigma-0 patterns for swell (solid blue) and wind-wave (dashed red): (A) defined by Toffoli et al.; (B) defined in this work (year 2018, Sentinel-3A).
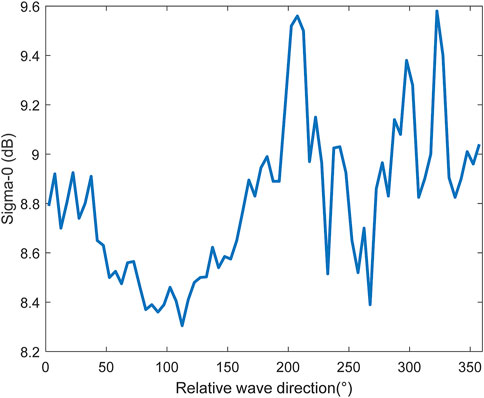
It can be seen from the figures that for the Toffoli and Bitner-Gregersen, (2017) strategy, the patterns of wind-wave and swell both have clear sinusoid features with peaks around 180° (almost undistinguishable), while for our strategy, the anisotropic patterns of wind-wave and swell are very distinct: the wind-wave pattern is more like a random one. Therefore, we deem that the “wind-wave fraction” may be a better indictor to identify the wave type. Indeed, a shorter wave is more likely to be a wind-wave as shown in Figure 3, but it seems that the anisotropic patterns may have much less correlation with wavelength than with the wind-wave fraction parameter.
On the Temporal Consistency of the Pattern Feature
Inter-annual Variation
In order to identify the possible time-dependent effects in the anisotropic patterns, we processed the Sentinel-3A, Jason-3, and Cryosat-2 data of the year 2017 using the same approach as the year 2018. Comparisons of the Sigma-0 patterns of years 2017 and 2018 of the three satellites are shown in Figure 8 for the moderate swell. Correlative coefficients between the patterns of the two years under the swell or wind-wave condition are always larger than 0.9 for Sentinel-3A and Jason-3. For Cryosat-2, the coefficients are relatively low (0.5821 for swell), maybe due to the relatively poor spatial distribution of Cryosat-2 SAR mode. Therefore, it can be concluded that the sinusoid feature under the swell-dominated condition is constant through time.
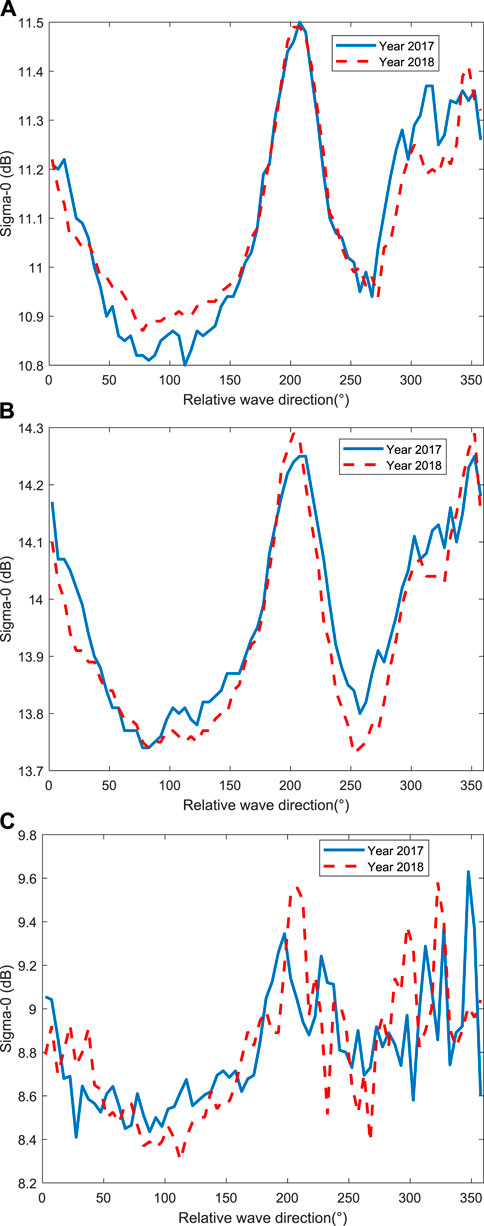
FIGURE 8. (A) Sentinel-3A, (B) Jason-3 and (C) Cryosat-2 Sigma-0 patterns of year 2017 and year 2018 for moderate swell.
On the Seasonal Variation
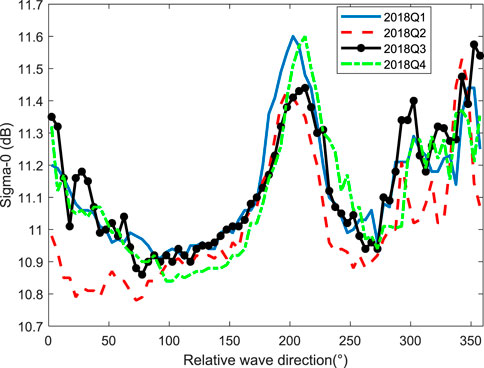
The anisotropic features of different seasons were also compared. Figure 9 depicts the Sentinel-3A Sigma-0 patters for the four quarters of 2018 (under the moderate swell condition). It can be seen that all the quarter share the similar sinusoid pattern. Table 5 (for swell) and Table 6 (for wind-wave) give the correlation matrix of the Sentinel-3A Sigma-0 patterns for the four quarters of 2018. Under the swell condition, the correlation coefficients between different quarters are always higher than 0.7, while for the wind-wave-dominated case, the correlation matrix is always smaller than that of the swell case; particularly, the coefficient correlation between winter (Q1) and summer (Q3) is the lowest (∼0.35), which can be explained by the effects of widespread monsoons over wind sea.

TABLE 5. Correlation matrix of the Sentinel-3A Sigma-0 patters for the four quarters of 2018 (moderate swell condition).

TABLE 6. Correlation matrix of the Sentinel-3A Sigma-0 patters for the four quarters of 2018 (short wind-wave condition).
On the Relationship of Sigma-0 and SWH as well as the SWH and Wave Direction
To exclude the effects of SWH, we only deal with the data with a altimetric SWH between 1.9 and 2.1 m. So there is almost no trend in the SWH–Sigma0 or SWH–wave-direction relationships (Figure 10). The scattering diagrams of the SWH–Sigma0 pair and SWH–wave-direction pair of an arbitrary month (Jan. 2018) are shown as follows. The SWH extracted from WW3 has a larger dynamic (for the swell condition, mean = 1.97 m, std = 0.44 m), no trend can be found in the SWH–Sigma0 or SWH–wave-direction relationships either.
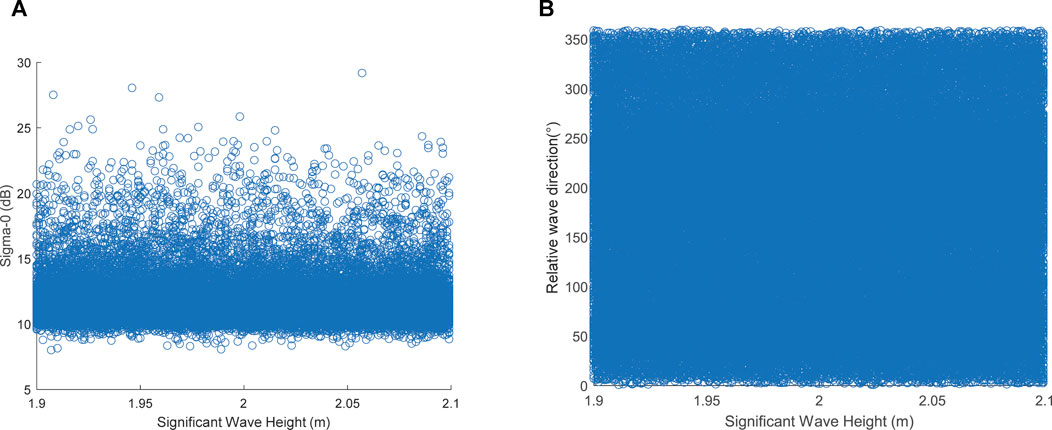
FIGURE 10. (A) SWH-Sigma0 and (B) SWH-wave-direction relationships of Sentinel-3A measurements altimeter in January 2018.
On the Geographic Sampling of the Satellite
It may be argued that the sinusoid feature in the Sigma-0 pattern could arise from the geographic sampling of the satellite. We compared the Sigma-0 patterns of Jason-3, Sentinel-3A, and Cryosat-2 satellites. The orbit configuration of the three satellites is extremely different: Jason-3 is a prograde satellite with a revisiting period of 9.9156 days; Sentinel-3A is a sun-synchronous satellite with a revisiting period of 27 days; Cryosat-2 is non-repeating in one year’s duration (the revisiting period is 369 days, longer than one year). The geographic distribution of Sentinel-3A and Jason-3 Sigma-0 under ∼2 m SWH are shown in Figure 11. No significant correlations can be found between the distributions of the two missions.
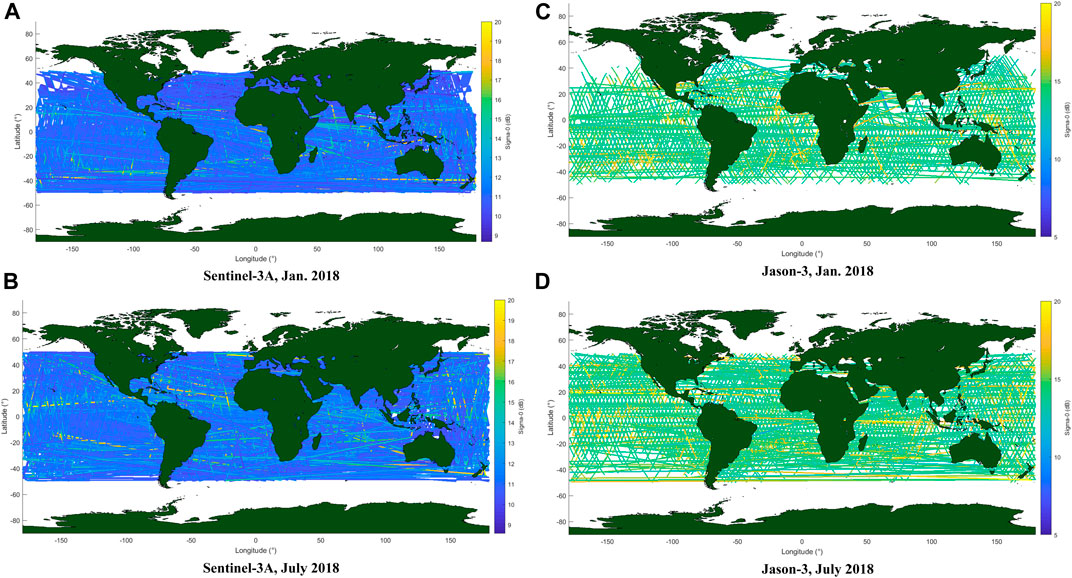
FIGURE 11. Geographic distribution of the Sentinel-3A (A,B) and Jason-3 (C,D) Sigma-0, all the measurements have a SWH between 1.9 m and 2.1 m.
The Sigma-0 patterns of the three satellites are shown in Figure 12. Although there are clear biases between different missions, the trends of the three patterns are very similar. The correlative coefficient between the Sigma-0 patterns of Sentinel-3A and Jason-3 is 0.9662, and the correlative coefficient between the Sigma-0 patterns of Sentinel-3A and Cryosat-2 is 0.8034 (this is high enough in consideration of the poor-sampling and noisy feature of the Cryosat-2 pattern). It seems that the three satellites share the similar Sigma-0 pattern in spite of the distinct geographic sampling.
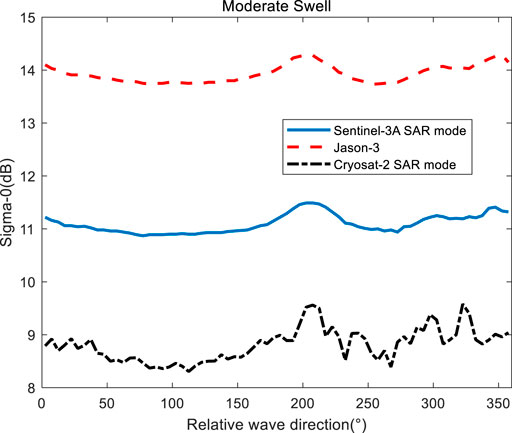
FIGURE 12. Comparison of the Ku-Band Sigma-0 patterns of Sentinel-3A (solid blue, SAR mode), Jason-3 (dashed red) and Cryosat-2 (dot-dash black, SAR mode) for moderate swell.
The Influence of Polarization Mode
Polarization is a very important feature of the microwave. Radar altimeters operate under nadir geometry, so polarization mode is not a serious issue for CRA. Tran and Chapron (2006) reported a small but clear sinusoid anisotropic feature of the Jason-1 altimeter backscatter measurements, but this feature was not discovered in the measurements of TRMM (Tropical Rainfall Measuring Mission) PR (Precipitation Radar) nadir beam (Chu and He, 2012), which is essentially equivalent to an altimeter. For SARA, the issue of polarization has not been addressed in any publication, to the authors’ knowledge.
To include the polarization information, we can redefine the “relative wave direction”: the reference direction should be the electric field direction of the microwave pulse transmitted by the altimeter rather than the flight direction of the satellite. To clarify the influence of the polarization mode, we can compare the Sigma-0 patters of two orthogonal polarization modes. If there were a 90° lag between the two patterns, we could make the assertion that the pattern is sensitive to the polarization. For Jason-3 and Sentinel-3A altimeters (and almost all the dual-band radar altimeters), the polarization mode of the two bands are orthogonal. However, no significant difference could be identified from the two bands for both altimeters. For Sentinel-3A, the standard deviation of the Sigma-0 difference pattern (sigma0-Ku minus sigma0-C) is 0.0187 dB for moderate swell; while for Jason-3, the standard deviation of the Sigma-0 difference pattern (sigma0-Ku minus sigma0-C) is 0.0192 dB for the moderate swell. Both values are well below the altimetric Sigma-0 measurement specification.
Because only Ku-band of the Sentinel-3A altimeter operates in SAR mode (C-band of the Sentinel-3A altimeter is a CRA), we processed the Cryosat-2A SAR mode data as a second SARA. The Cryosat-2 altimeter has an orthogonal polarization mode with respect to the Sentinel-3A Ku-band: for Cryosat-2, the flight direction of the satellite is perpendicular to the electric field vector of the microwave pulses (Rémy et al., 2012), while for Sentinel-3A, the flight direction of the satellite is parallel to the electric field vector. The Sigma-0 pattern of Cryosat-2 for the moderate swell also has a primary peak around 180°, showing no evidence of any possible 90° lag relative to that of Sentinel-3A (see Figure 11). Therefore, we can make the conclusion that the polarization configuration of SARA would not significantly influence the Sigma-0 (in turn, SSB) measurement.
SSB with Respect to the Anisotropic Features
The most important influence of the anisotropic pattern is on the SSB. The patterns of SSB were generated using the same approach to Sigma-0 measurements. The SSB anisotropic patterns for Jason-3, Sentinel-3A SAR mode, and Sentinel-3A PLRM mode for the moderate swell is shown in Figure 13. The correlation coefficient between the SSB patterns of the two modes is 0.9943 and 0.9692 for the moderate swell and short wind-wave, respectively. As the SWH is restricted to ∼2 m throughout this work, the SSB pattern is highly correlative to the corresponding Sigma-0 pattern. The correlative coefficient between the SSB patterns of Sentinel-3A and Jason-3 is 0.9849.
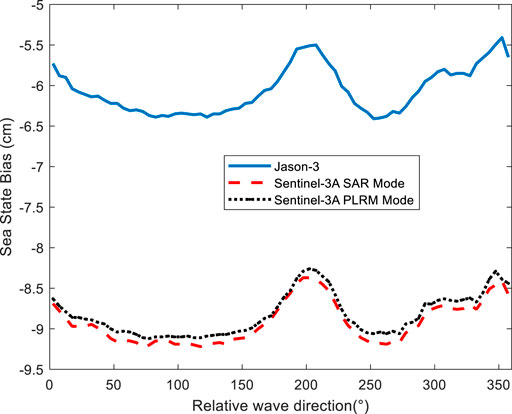
FIGURE 13. Comparison of the Ku-Band SSB patterns of Jason-3 (solid blue), Sentinel-3A SAR mode (dashed red) and Sentinel-3A PLRM mode (dot-dash black) for moderate swell.
No valid SSB value can be extracted from the Cryosat-2 SAR mode GDR, so we did not evaluate the SSB for Cryosat-2.
SSHA with Respect to the Anisotropic Features
SSHA is the primary measurement of the altimeters, so we generated the SSHA patters of Sentinel-3A for analysis. The results are shown in Figure 14A (for moderate swell) and Figure 14B (for short wind-wave). There is a bias between the SSHA of the two modes (the PLRM one is ∼1.4 cm higher), but the correlative coefficients between the two patterns are very high (0.9792 for the moderate swell and 0.9433 for the short wind-wave).
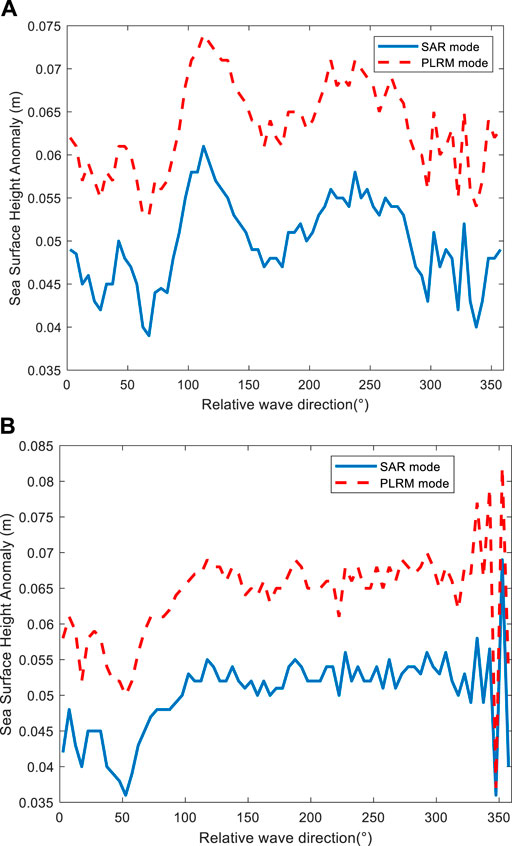
FIGURE 14. Sentinel-3A Ku-band SSHA anisotropic pattern for (A) moderate swell and (B) short wind-wave (lower panel).
Somewhat surprisingly, the correlative coefficients between the SSHA and SSB are very small (−0.1719 for SAR mode and −0.1348 for PLRM mode under the moderate swell situation). If the patterns of the SSHA were dominated by SSB, the correlative coefficients would be close to −1. A possible explanation is that there are many complicated factors (noises as well as oceanographic signals) in the SSH pattern. In fact, the standard deviation of the SSHA pattern is significantly larger than that of the SSB in any case (Table 7), so the sinusoid trend in SSB may be overwhelmed.

TABLE 7. Summary of the statistics properties of the Sigma-0, SSB, and SSHA of Sentinel-3A patterns.
Conclusion
In this article, the influences of ocean surface anisotropy on the backscattering measurements and sea state bias corrections of conventional and SAR altimeters were investigated. Two years’ (2017 and 2018) data record of Sentinel-3A, Jason-3, and Cryosat-2 altimeters were extracted, edited, and collocated with the WW3 wave model. The anisotropic patterns of Sigma-0 and SSB were generated for moderate swell and short wind-wave cases. Several interesting phenomena were found. The main conclusions of this study were as follows:
1) As expected, the anisotropic patterns for the swell condition are much more regular than that of the wind-wave. The moderate swell patterns show a sinusoid feature with a period of roughly 180°, which is due to the 180° ambiguity of the nadir-pointing observation geometry. For the wind-wave, the pattern is less regular. Besides, the “wind-sea-fraction” (which can be extracted from the WW3 numerical model) might be more appropriate than the commonly-used “wavelength” as an indicator of wave type.
2) It is somewhat counterintuitive that the Sigma-0 and SSB patterns of CRA and SARA are almost identical. This feature has never been reported before. We compared the patterns of different time and different missions with different geographic sampling, and all the patterns have the similar clear sinusoid trend for the moderate swell case. The standard deviation is about 0.18 dB for Sigma-0 and 0.26 cm for SSB, while the dynamic range could reach about 0.6 dB for Sigma-0 and 0.86 cm for SSB. This trend could bring impacts on the results in high-accuracy application. A possible explanation of this sinusoid trend is that, although for an individual pulse the footprint of the CRA is isotropic, the movement of the satellite in the along-track direction may elongate the radar footprint and introduce an extra anisotropic feature (the altimeter measurements are averaged to 1 Hz products, and the satellite travels ∼7 km in one second, which is much larger than the ∼2 km across-track resolution).
3) As for the SSHA patterns, no clear sinusoid could be identified for the moderate swell. The correlative coefficients between the SSHA and SSB are relatively small. A possible explanation is that the SSB pattern may be overwhelmed in the complicated factors that can influence the SSHA pattern. Nonetheless, if we correct the trend in SSHA, we may bring subtle improvements to the SSHA product. Given that SSHA is more accurate for SAR mode and the SSB of the two modes are comparable, we can expect that the absolute value of correlative coefficients between the SSHA and SSB would be larger for SAR mode, which has been verified by the analysis results.
4) We show the solid evidence demonstrating that the polarization configuration of the radar altimeter has little (if any) influence on the anisotropic patterns, even for SAR mode.
The results in this work show the complexity of the rationale of satellite altimeter measurements on the anisotropic ocean surface. Not only SARA but also CRA would suffer from the anisotropic errors both in Sigma-0 measurements and the SSB corrections. This finding supports the necessity of introducing the wave direction to the SSB correction algorithms for both CRA and SARA.
Data Availability Statement
Publicly available datasets were analyzed in this study. This data can be found here: https://scihub.copernicus.eu/
Author Contributions
XX: draft, writing – methodology, data processing and results explanation. KX: conceptualization. MJ: validation. BG: WW3 wave data preparation. LS: satellite altimetry data preparation. All authors have read and agreed to the published version of the manuscript.
Funding
This study is supported by the National Natural Science Foundation of China (Grant No. 41876209 and E0112002), the Pandeng Program of National Space Science Center, Chinese Academy of Sciences, the State Key Laboratory of Tropical Oceanography, South China Sea Institute of Oceanology, Chinese Academy of Sciences (Project No. LTO1908) and the Guangdong Basic and Applied Basic Research Foundation (No. 2019A1515012108) and research funds from the State Key Laboratory of Tropical Oceanography (No. LTOZZ2101).
Conflict of Interest
The authors declare that the research was conducted in the absence of any commercial or financial relationships that could be construed as a potential conflict of interest.
Publisher’s Note
All claims expressed in this article are solely those of the authors and do not necessarily represent those of their affiliated organizations, or those of the publisher, the editors and the reviewers. Any product that may be evaluated in this article, or claim that may be made by its manufacturer, is not guaranteed or endorsed by the publisher.
Acknowledgments
We thank the Copernicus Marine Environment Monitoring Service (CMEMS), ESA (European Space Agency) for providing the Sentinel-3A Geophysical Data Records (GDR) and the Archiving, Validation, and Interpretation of Satellite Oceanographic Data (AVISO) for providing Jason-3 GDR products. We also thank the National Center for Environmental Prediction (NCEP), NOAA (National Oceanic and Atmospheric Administration), for distributing the WW3 model data.
References
Bouffard, J., Naeije, M., Banks, C. J., Calafat, F. M., Cipollini, P., Snaith, H. M., et al. (2018). CryoSat Ocean Product Quality Status and Future Evolution. Adv. Space Res. 62, 1549–1563. doi:10.1016/j.asr.2017.11.043
Chelton, D. B., Ries, J. C., Haines, B. J., Fu, L. L., and Callahan, P. S. (2001). “Satellite Altimetry,” in Satellite Altimetry and Earth Sciences: A Handbook Of Techniques And Applications. 2000: Improved Electromagnetic. Editors B. Chapron, and D. Vandemark (San Diego, CA, USA: Academic), 1.
Chu, X., and He, Y. (2012). Asymmetry and Anisotropy of Microwave Backscatter at Low Incidence Angles. IEEE Trans. Geosci. Remote Sensing 50 (10), 4014–4024. doi:10.1109/tgrs.2012.2189010
Donlon, C., Berruti, B., Buongiorno, A., Ferreira, M.-H., Féménias, P., Frerick, J., et al. (2012). The Global Monitoring for Environment and Security (GMES) Sentinel-3 mission. Remote Sensing Environ. 120 (1), 37–57. doi:10.1016/j.rse.2011.07.024
Elfouhaily, T., Thompson, D. R., Chapron, B., and Vandemark, D. (2000). Improved Electromagnetic Bias Theory. J. Geophys. Res. 105, 1299–1310. doi:10.1029/1999jc900277
Fjortoft, R., Gaudin, J.-M., Pourthié, N., Lalaurie, J.-C., Mallet, A., Nouvel, J.-F., et al. (2014). Karin on SWOT: Characteristics of Near-Nadir Ka-Band Interferometric SAR Imagery. IEEE Trans. Geosci. Remote Sensing 52 (4), 2172–2185. doi:10.1109/tgrs.2013.2258402
Fu, L.-L., and Glazman, R. (1991). The Effect of the Degree of Wave Development on the Sea Stale Bias in Radar Altimetry Measurements. J. Geophys. Res. 96, 829–834. doi:10.1029/90jc02319
Hanson, J. L., and Phillips, O. M. (2001). Automated Analysis of Ocean Surface Directional Wave Spectra. J. Atmos. Oceanic Technol. 18, 177–193. doi:10.1175/1520-0426(2001)018<0277:aaoosd>2.0.co;2
Moreau, T., Aublanc, J., Rieu, P., Tison, C., Le Gac, S., and Boy, F. (2018b). “Innovative Coherent Processing Approach for Measuring Ocean Surface Parameters,”. Ocean Surface Topography Science Team Meeting, Ponta Delgada, São Miguel Island Azores Archipelago (Portugal).
Moreau, T., Tran, N., Aublanc, J., Tison, C., Le Gac, S., and Boy, F. (2018a). Impact of Long Ocean Waves on Wave Height Retrieval from SAR Altimetry Data. Adv. Space Res. 62, 1434–1444. doi:10.1016/j.asr.2018.06.004
Parisot, F., Vaze, P., Loving, J., Tavernier, G., and Vuilleumier, P. (2018). “Sentinel-6/Jason-CS: Status of the Project,”. Ocean Surface Topography Science Team Meeting, Ponta Delgada, São Miguel Island Azores Archipelago (Portugal).
Pires, N., Joana Fernandes, J., Gommenginger, C., and Scharroo, R. (2018). “Perspectives on Combining SAR Sentinel-1 Ocean Wave Parameters with Jason-3 and Sentinel-3 Estimations for SSB Models,”. Ocean Surface Topography Science Team Meeting, Ponta Delgada, São Miguel Island Azores Archipelago (Portugal).
Raney, R. K. (1998). The delay/Doppler Radar Altimeter. IEEE Trans. Geosci. Remote Sensing 36 (5), 1578–1588. doi:10.1109/36.718861
Rascle, N., and Ardhuin, F. (2013). A Global Wave Parameter Database for Geophysical Applications. Part 2: Model Validation with Improved Source Term Parameterization. Ocean Model. 70, 174–188. doi:10.1016/j.ocemod.2012.12.001
Rémy, F., Flament, T., Blarel, F., and Benveniste, J. (2012). Radar Altimetry Measurements over Antarctic Ice Sheet: A Focus on Antenna Polarization and Change in Backscatter Problems. Adv. Space Res. 50, 998–1006. doi:10.1016/j.asr.2012.04.003
Stammer, D., and Cazenave, A. (2017). Satellite Altimetry over Oceans and Land Surfaces. Boca Raton: CRC Press, 1–608.
Toffoli, A., and Bitner-Gregersen, E. M. (2017). “Types of Ocean Surface Waves, Wave Classification,” in Encyclopedia of Maritime and Offshore Engineering (Hoboken: John Wiley), 1–8. doi:10.1002/9781118476406.emoe077
Tracy, B., Devaliere, E.-M., Nicolini, T., Tolman, H. L., and Hanson, J. L. (2007). “Wind Sea and Swell Delineation for Numerical Wave Modeling,” in 10th International Workshop on Wave Hindcasting and Forecasting & Coastal Hazards Symposium. JCOMM Tech. Rep. 41, WMO/TD-No. 1442. Paper P12.
Tran, N., and Chapron, B. (2006). Combined Wind Vector and Sea State Impact on Ocean Nadir-Viewing Ku- and C-Band Radar Cross-Sections. Sensors 6 (3), 193–207. doi:10.3390/s6030193
Wingham, D. J., Francis, C. R., Baker, S., Bouzinac, C., Brockley, D., Cullen, R., et al. (2006). CryoSat: A mission to Determine the Fluctuations in Earth's Land and marine Ice fields. Adv. Space Res. 37, 841–871. doi:10.1016/j.asr.2005.07.027
Keywords: SAR altimetry, sentinel-3A, polarization, ocean wave direction, backscatter coefficient, sea state bias (SSB), swell, wind-wave
Citation: Xu X-Y, Xu K, Jiang M, Geng B and Shi L (2021) Investigation of the Anisotropic Patterns in the Altimeter Backscatter Measurements Over Ocean Wave Surfaces. Front. Earth Sci. 9:731610. doi: 10.3389/feart.2021.731610
Received: 27 June 2021; Accepted: 06 September 2021;
Published: 21 October 2021.
Edited by:
Jinyun Guo, Shandong University of Science and Technology, ChinaReviewed by:
Lei Yang, First Institute of Oceanography, Ministry of Natural Resources, ChinaYonggang Gao, Fuzhou University, China
Copyright © 2021 Xu, Xu, Jiang, Geng and Shi. This is an open-access article distributed under the terms of the Creative Commons Attribution License (CC BY). The use, distribution or reproduction in other forums is permitted, provided the original author(s) and the copyright owner(s) are credited and that the original publication in this journal is cited, in accordance with accepted academic practice. No use, distribution or reproduction is permitted which does not comply with these terms.
*Correspondence: Xi-Yu Xu, eHV4aXl1QG1pcnNsYWIuY24=
 Xi-Yu Xu
 Ke Xu
Ke Xu Maofei Jiang1
 Bingxu Geng
