 Lixia Meng
 Yong Zhao
 Mingang Li
- School of Atmospheric Sciences, Chengdu University of Information Technology, Chengdu, China
The effects of sea surface temperature (SST) anomaly in the tropical Indian Ocean (IO) on summer rainfall over central Asia (CA) are investigated using NCEP/NCAR reanalysis circulation data, Hadley Centre SST data, and GPCC gridded precipitation data for 1971–2016. Results show that the SST anomalies over the whole tropical IO play important roles in modulating summer rainfall over southeast CA via the subtropical westerly jet. When the SSTs in the tropical IO are in positive phases, the south Asian monsoon is weakened, which reduces summer rainfall in the Indian monsoon regions corresponding to less release of latent heat. There is an anomalous anticyclone over the Indian Peninsula and an anomalous cyclone in the upper troposphere over CA, corresponding to a shift of the subtropical westerly jet farther south over CA. The southward shift of westerly jet would be responded to anomalous cyclone at 500 hPa over CA and water vapor transported into CA through two steps from the Arabian Sea, above both contribute to more summer rainfall over CA.
Introduction
In the last century the global mean surface air temperature has increased with a warming amplitude of about 0.74 ± 0.18°C (IPCC 2007). Under the background of global warming there have been significant changes in global and regional climate (Nicholson et al., 1998; Dai et al., 2004). Global warming allows the atmosphere to hold more water vapor and accelerates the hydrological cycle, which can result in more frequent and serious extreme events (Katz and Brown 1992; Sheffield and Wood, 2008). Global warming has different effects on rainfall in different regions and the Eurasian continent has received less rainfall in the last few decades (Ma and Fu 2007). The total global rainfall has increased but the rainfall in arid lands has shown a declining trend (Hulme, 1996). Central Asia (CA) is one of the largest arid and semiarid areas in the world, and its surface air temperature has shown a rapid and strongly increasing trend of twice the average warming rate over the whole Northern Hemisphere (Chen et al., 2009). Previous studies have argued that CA maybe highly sensitive to global warming (Smith et al., 2000; Huxman and Smith 2001).
Rainfall is rather rare over CA, but the ecosystems, economy and society are extremely vulnerable to the variations of rainfall. So many studies have been focused on changes of rainfall over CA. The annual rainfall has shown an increasing trend in the last few decades (Huang et al., 2013; Hu et al., 2017), and as measured by the Palmer drought severity index (PDSL) the CA has become wetter since the 1980s (Hu et al., 2018). In eastern CA, rainfall in the Xinjiang province of China has experienced significant decadal changes that differ from the changes in east China (Shi et al., 2002). Huang et al. (2014) and Zhao and Zhang (2016) report that results from multi-CMIP5 models suggest that the projected rainfall will increase in CA in the second half of the 21st century, especially in eastern CA.
What has caused the change in rainfall over CA in recent decades? Some studies attempted to explore this question in terms of atmospheric circulation anomalies. Zhao et al. (2018) suggested that variation in the axis of the western Asian (40°–80°E) subtropical westerly jet plays an important role in changes in summer rainfall over CA. Water vapor over the tropical Indian Ocean (IO) is closely related to rainfall over CA (Mason and Goddard 2001; Oliver et al., 2012). However the drivers of such an atmospheric pattern are still unclear. The tropical oceans have a very important effect on global climate and have become increasingly warmer during the past 100 years, especially the tropical IO (Zeng et al., 2001; Zhou et al., 2004). The Indian Ocean Basin Mode (IOBM) is the first leading mode of annual IO surface sea temperatures (SSTs) variability (Lau and Weng 1999; Ashok et al., 2001), and corresponds to positive or negative SST anomalies over the whole IO. The IOBM reaches its peak in spring and can persist into summer (Yulaeva and Wallace 1994; Klein et al., 1999). It can drive changes in the position of the subtropical westerly jet and strengthen the South Asia high, which contribute to summer rainfall anomalies in East Asian monsoon regions (Alexander et al., 2002; Du et al., 2009; Huang et al., 2011).
These studies made it clear that positive or negative anomalies of SSTs over the whole tropical IO can influence the climate in Asian monsoon regions. A few studies have pointed out that the SSTs in the tropical IO are closely related to the rainfall over CA. Zhou et al. (2015) reported that SST anomalies in the tropical IO in March correlate well with summer rainfall in eastern CA. Our previous study pointed out that SSTs in the tropical IO can influence the summer rainfall over CA by influencing the water vapor transport from the IO (Zhao and Zhang, 2016), but the focus is on the projection of rainfall. So in the current study we explore two questions: 1) What pattern of SST anomalies in the tropical IO is closely related to rainfall over CA? 2) What is a possible mechanism linking SST anomalies in the tropical IO to the summer rainfall over CA?
Accordingly, the manuscript is arranged as follows: the study region, data and method are introduced in section Study Region, Data and Method. In section Results, we first present the correlations of the first and second leading modes of SST anomalies in the tropical IO with summer rainfall over CA; we then describe the anomalous circulation systems related to summer rainfall over CA; finally, the possible mechanism for the influence of the SST anomalies in the tropical IO on summer rainfall over CA is revealed. Section Conclusions and Discussion summarizes the main conclusions and discusses the short comings of this contribution and the need for further work.
Study Region, Data and Method
Region
Covering an area over 4 × 10⁶ km2 across Kazakhstan, Kyrgyzstan, Tajikistan, Turkmenistan, and Uzbekistan and part of northwest China, CA is the largest inland arid region in the world; its climate is mainly controlled by westerlies (Huang et al., 2015). The variability of terrain and landform is very complex, so the distribution of mean summer rainfall shows obvious regional features (Figure 1A). More rainfall occurs over the mountains and plateau, such as the Tianshan Mountains, Altai Mountains and Pamir Plateau, where the summer rainfall is more than 100 mm. In addition, the rainfall is also more than 100 mm in northern parts of Kazakhstan. The Tarim Basin in northwest China, Turkmenistan and Uzbekistan receive rather low summer rainfall below 50 mm. So these regions are mainly deserts. Under the background of global warming, summer rainfall over CA exhibits an obvious increasing trend that is especially significant in the Tianshan Mountains and Pamir Plateau (Figure 1B). The SSTs also present a significant warming trend over the whole tropical IO (Figure 1C).
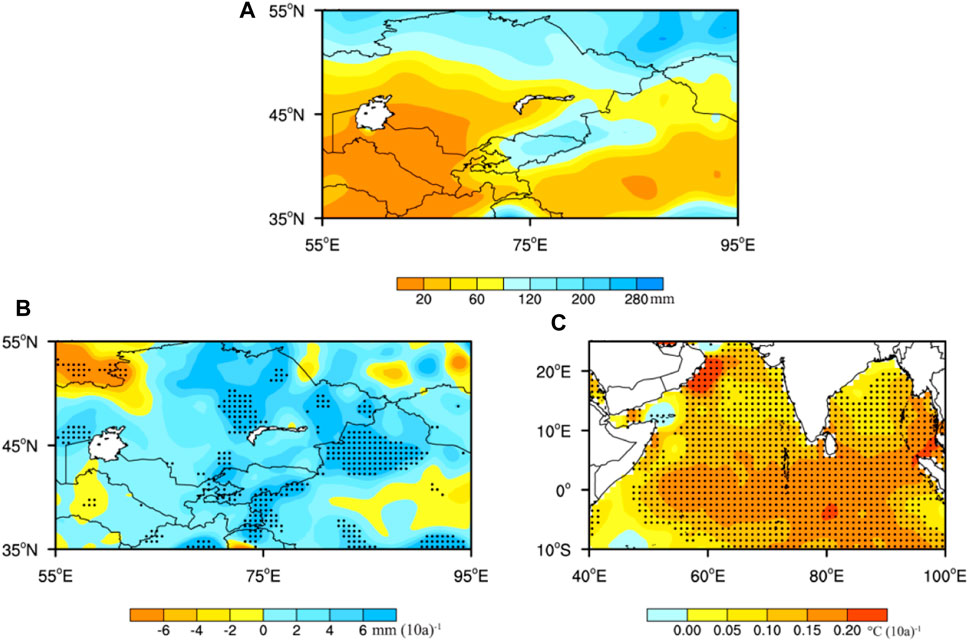
FIGURE 1. (A) Distribution of mean summer rainfall over CA during 1971–2016, (B) linear trend of summer rainfall over CA during 1971–2016, (C) as (B) but for SSTs in the tropical IO. Dotted regions show significance at
Data
In the current study, gridded rainfall data derived from the latest version of Global Precipitation Climatology Center (GPCC) are used for the analysis (Schneider et al., 2014). This is a monthly land-surface rainfall dataset based on 75,000 meteorological stations that has been widely used to discuss climate change because of its good quality control. Hu et al. (2017) suggested that the GPCC dataset had very high accuracy when compared with the observed rainfall data over CA and found that GPCC monthly rainfall is closely related to observational rainfall with a correlation coefficient of 0.9. The GPCC rainfall dataset we use has a spatial resolution of 0.5° × 0.5° and covers the period 1891–2016.
The National Centers for Environment Prediction (NCEP)–National Center for Atmospheric Research (NCAR) reanalysis dataset (Kalnay et al., 1996) with spatial resolution of 2.5° × 2.5° from 1948 to the present is used to reveal the large-scale atmospheric circulation patterns. Observational SST data at a resolution of 1° × 1° are from the Hadley Centre Sea Temperature dataset covering the period from 1870 to the present (Rayner, 2003). In the current study, we mainly consider the period 1971–2016 and concentrate on the analysis of the results averaged over the boreal summer months (June–August).
Methods
The South Asian summer monsoon index (SASMI) (Webster and Yang, 1992) is defined in terms of the zonal wind shear between 850 and 200 hPa averaged over South Asia (0°–20°N, 40°–110°E):
The Pearson correlation coefficient and simple linear regression are used in this study. The t-test is used to test the significance of both the correlation coefficient and simple linear regression as follows:
where r is the correlation coefficient between two time series, n is the sample size for the time series and in this study n = 46. When
Results
Correlation Between Sea Surface Temperatures in the Tropical Indian Ocean and Summer rainfall Over Central Asia
Figure 2A displays the first and second leading EOF modes of the SST anomalies in the domain 10°S–25°N, 40°–100°E. The first leading eigenvector explains 59.8% of the total variance. It is clear that the SST anomalies show either warming or cooling across the whole tropical IO. The principal component corresponding to the leading mode of EOF1 (PC1) shows significant inter-annual and inter-decadal variations (Figure 2C). During 1971–1986, the SST anomalies show cooling across the whole tropical IO, while during 1987–2016 the SST anomalies show warming across the whole tropical IO. So we define the normalized PC1 as the IOBM index (IOBMI). The second leading eigenvector explains 8.9% of the total variance, and the SST anomalies in the tropical IO have opposite phases in the Arabian Sea and Bay of Bengal (Figure 2B). The principal component corresponding to the leading mode of EOF2 (PC2) also shows significant inter-annual and inter-decadal variations (Figure 2D). During 1972–1984, the SST anomalies in the tropical IO show warming in the Arabian Sea and cooling in the Bay of Bengal, while the anomalies are of the opposite signs during 1985–2016. So we define the normalized PC2 as the IOD index (IODI).
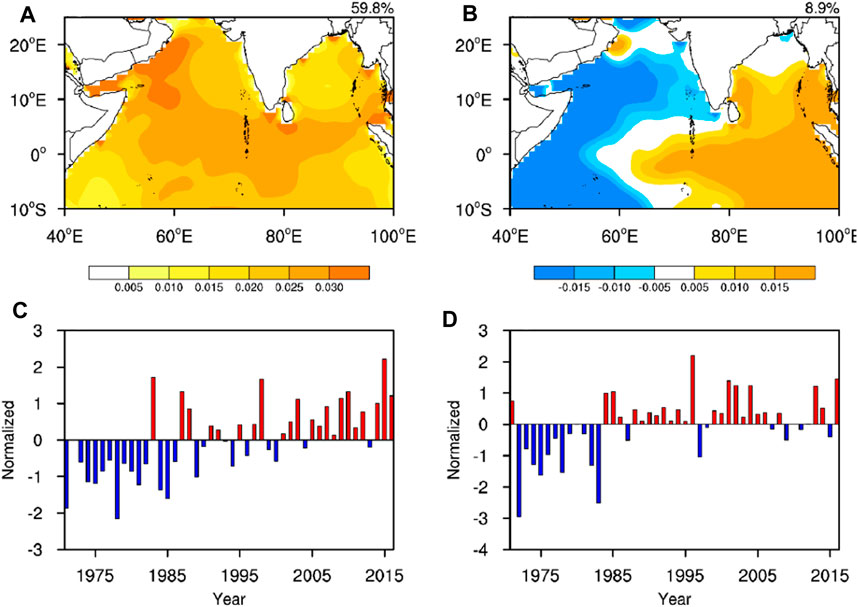
FIGURE 2. The first two leading EOF modes of summer SST anomalies in tropical IO during 1971–2016 in (A) and (B). The normalized principal component (PC) corresponding to the leading mode of EOF1 (C) and EOF2 (D).
Figure 3A displays the correlations between the IOBMI and summer rainfall over CA. It is clear that the IOBMI is strongly related to summer rainfall over CA, especially in southeast central Asia, over the Tianshan Mountains and Pamir Plateau, where the summer rainfall shows a significant increasing trend (Figure 1B). The SSTs show warming across the entire tropical IO corresponding to more summer rainfall over southeast CA. Figure 3B shows the correlations between the IODI and summer rainfall over CA. When the positive anomalies of SSTs occur in the Bay of Bengal and negative anomalies of SSTs occur in the Arabian Sea, which can cause the summer rainfall in northern Xinjiang increasing.
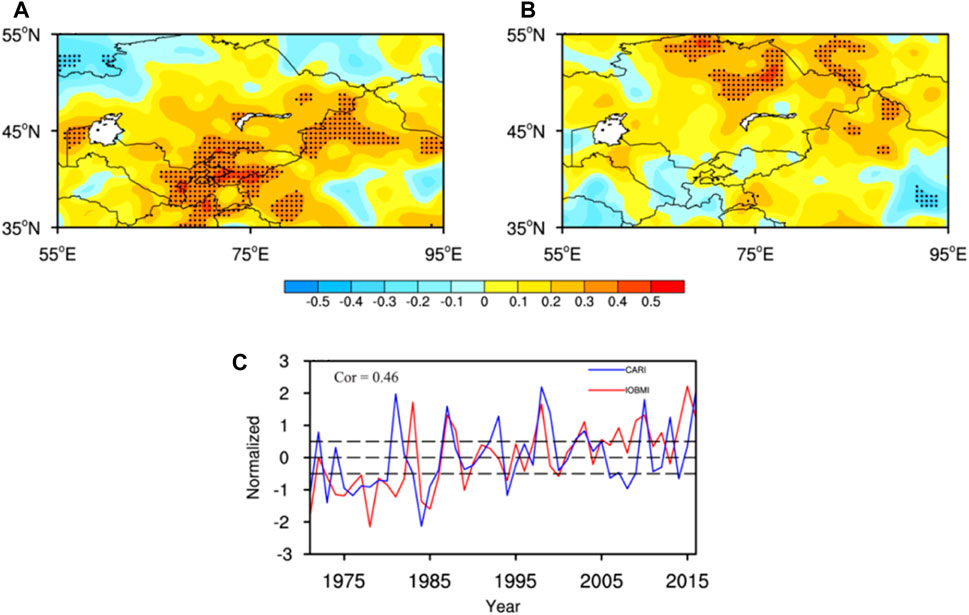
FIGURE 3. Correlation of (A) IOBMI and (B) IODI with summer rainfall over CA; dotted regions show significance at
It is clear that the first leading EOF modes of the SST anomalies dominants the spatial distribution of SST anomalies in the tropical IO and plays more important role in influencing summer rainfall over CA. So in the following analysis we focus on the effects of SST anomalies across the entire tropical IO on summer rainfall over CA. According to Figure 3A the significant area of correlations between the IOBMI and summer rainfall mainly are concentrated on two regions, 65°–80°E, 35°–45°N and parts of northern Xinjiang, respectively, the farmer is more than the latter. So in this study we choose the domain of 65°–80°E, 35°–45°N as key area. Furthermore, the index of central Asia rainfall (CARI) is defined by the normalized rainfall averaged over 65°–80°E, 35°–45°N during 1971–2016. The years with the normalized CARI exceeding +/−0.5 standard deviation are defined as the strong/weak CARI years. Figure 3C displays the time series of the IBOMI and CARI during 1971–2016. The IBOMI correlates well with the CARI and the correlation coefficient is 0.46, significance at
Atmospheric Circulation Systems Related to Anomalous Summer rainfall Over Central Asia
Firstly we examine the large-scale circulation systems that can influence summer rainfall over CA. Figure 4A shows the summer 200-hPa zonal wind regressed against the CARI. It is clear the summer rainfall over CA correlates well with zonal winds at 200 hPa in the domain 25°–55°N, 40°–80°E. When the zonal wind anomalies are of opposite sign in the domains 25°–40°N, 40°–80°E, 40°–55°N, 40°–80°E, there are anomalies in summer rainfall. When the CARI is in strong years, the zonal winds at 200 hPa in the domain 25°–40°N, 40°–80°E strengthen and those in the domain 40°–55°N, 40°–80°Eweaken; this corresponds to a southward shift of the subtropical westerly jet (Figure 4B). When the CARI is in weak years, the zonal wind anomalies reverse in sign and the subtropical westerly jet shifts to the north (Figure 4C).
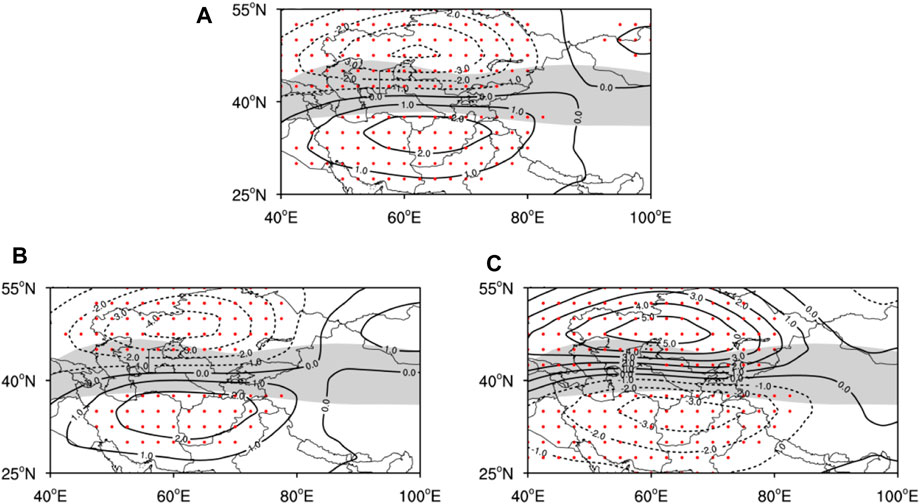
FIGURE 4. (A) Regression of 200-hPa zonal wind against the CARI during 1971–2016, (B) composite distribution of 200-hPa zonal wind anomalies in strong CARI years, (C) as (B), but in weak CARI years. The shaded regions denote the climatological axis of the subtropical westerly jet (where wind speeds are larger than 25 ms−1, dotted regions show significance at
Figure 5A shows the summer 500-hPa winds regressed against the CARI. It is clear the summer rainfall over CA is closely related to an anomalous cyclone or anticyclone over CA. Previous studies have indicated that cyclone or trough at 500 hPa is one of the key circulation systems influencing summer rainfall over CA (Yang and Zhang 2007; Zhang et al., 2012). When the CARI is in strong years, there is an anomalous cyclone over CA. The anomalous southerly winds on the eastern side of the cyclone prevail over eastern CA, and the regions receive more summer rainfall (Figure 5A). On the contrary, when the CARI is in weak years, an anomalous anticyclone controls CA, and the rainfall is hard to occur (Figure 5C).
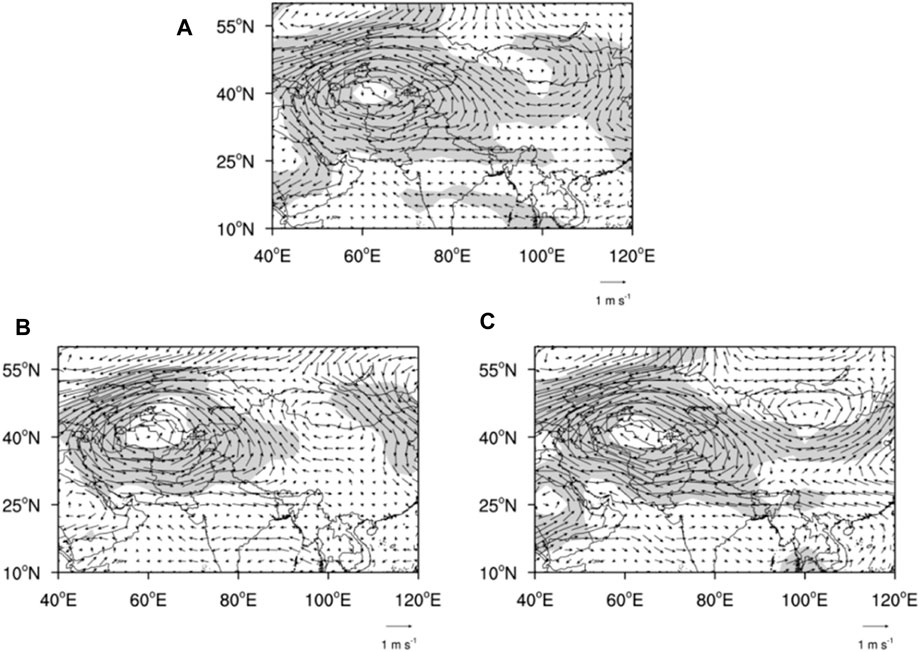
FIGURE 5. (A) Regression of 500-hPa winds against the CARI during 1971–2016, (B) composite distribution of 500-hPa winds anomalies in strong CARI years, (C) as (B), but in weak CARI years. Shaded regions show significance at
In addition, water vapor also plays an important role in influencing summer rainfall over CA. The sources of water vapor are related to different anomalies of summer rainfall over CA. So we need to examine the source and transport path related to the summer rainfall over CA. Figure 6A displays the spatial distribution of the summer vertically integrated (surface to 500 hPa) water vapor flux averaged from 1971 to 2016. It is clear the CA is located in the far inland region of the Eurasian continent with very limited water vapor, generally the water vapor over the Indian Ocean cannot directly transport into the CA. Figure 6B shows the regression of the summer water vapor flux vertically integrated from the surface to 500 hPa against the CARI. The summer rainfall over CA is closely related to the cyclone in CA and anticyclone in the Indian Peninsula. When the CARI is in strong years, the anomalous anticyclone over the Indian Peninsula transports water vapor from the Arabian Sea to middle latitude regions in a first step, and then the anomalous cyclone over CA carries the water vapor into CA (Figure 6C). In addition it is clear that the negative divergences of water vapor flux well match the positive summer rainfall in chosen key area. Oliver et al. (2012) used observations to show that the tropical IO is a key source of water vapor related to summer rainfall over CA. When the CARI is in weak years, the anomalous circulation pattern does not favor the transport of water vapor from the IO to CA (Figure 6D).
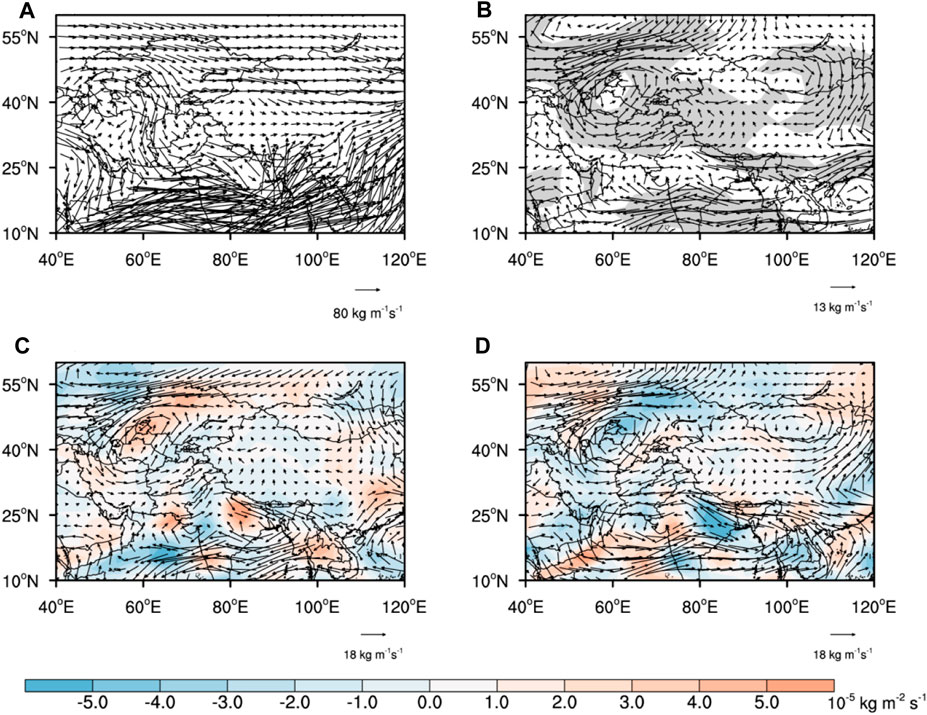
FIGURE 6. (A) The spatial distribution of the summer vertically integrated (surface to 500 hPa) water vapor flux averaged from 1971 to 2016, (B) regression of summer vertically integrated (surface to 500 hPa) water vapor flux against the CARI during 1971–2016, shaded regions show significance at
Possible Mechanism Linking Sea Surface Temperature Anomalies in the Tropical Indian Ocean and Summer rainfall Over Central Asia
In the above analysis, we have identified the close relationship between SST anomalies across the entire tropical IO and summer rainfall over southeast CA, and the circulation systems that are mainly responsible for influencing summer rainfall. The next task is to determine how the SST anomalies across the entire tropical IO influences summer rainfall. Previous studies have suggested that the subtropical westerly jet plays a key role in influencing summer rainfall over CA (Zhao et al., 2018). The position and intensity of the subtropical westerly jet can influence the formation and location of the cyclone and blocking high, which are important circulation systems associated with summer rainfall (Gao and Tao, 1991). So does SST anomalies in the tropical IO affects summer rainfall over CA by moving the subtropical westerly jet? To answer the question, we first investigate the relation between the SST anomalies in the tropical IO and the subtropical westerly jet over CA. Figure 7A shows the summer 200-hPa wind and zonal wind regressed against the IOBMI. Composite analysis (data not shown) indicates that when the IOBMI is in a positive phase, there is an anomalous cyclone over CA, which strengthens (weakens) zonal winds in the domain 25°–40°N, 40°–80°E, (40°–55°N, 40°–80°E). This is also suggested in Figure 4B, where the subtropical westerly jet shifts farther south and more summer rainfall occurs over CA. The index of jet position (JPI) is defined by the normalized difference in the regionally averaged summer 200-hPa zonal wind between the area bounded by 25°–40°N, 50°–80°Eand the area bounded by 40°–55°N, 50°–80°E, during 1971–2016. Figure 7B displays the time series of the IOBMI and JPI; they are closely correlated with a correlation coefficient of 0.48 (significance at the
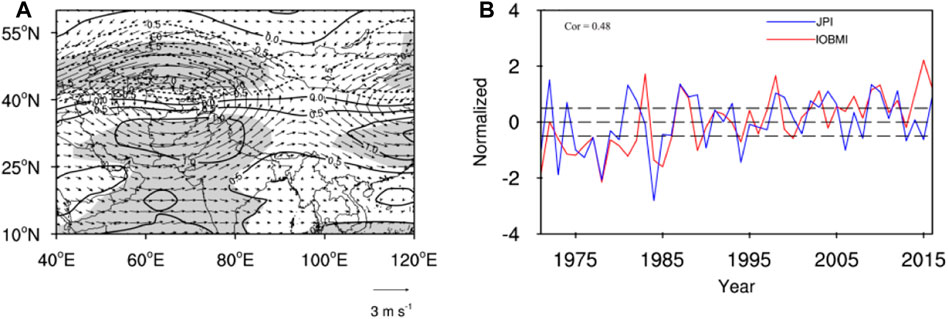
FIGURE 7. (A) Regression of 200-hPa zonal wind (contours) and winds (vectors) against the IOBMI during 1971–2016; Shaded regions show significance at
Why SST anomalies across the entire tropical IO can shift the position of the tropical westerly jet over CA? Figure 8A shows the regression of the summer 850-hPa wind against the IOBMI. When the IOBMI is in a positive phase, there is an anomalous anticyclone over the Indian Peninsula. On one hand the south Asian summer monsoon weakens and Figure 8B indicates the correlation coefficient between the IOBMI and SASMI is –0.69, which is significant at the
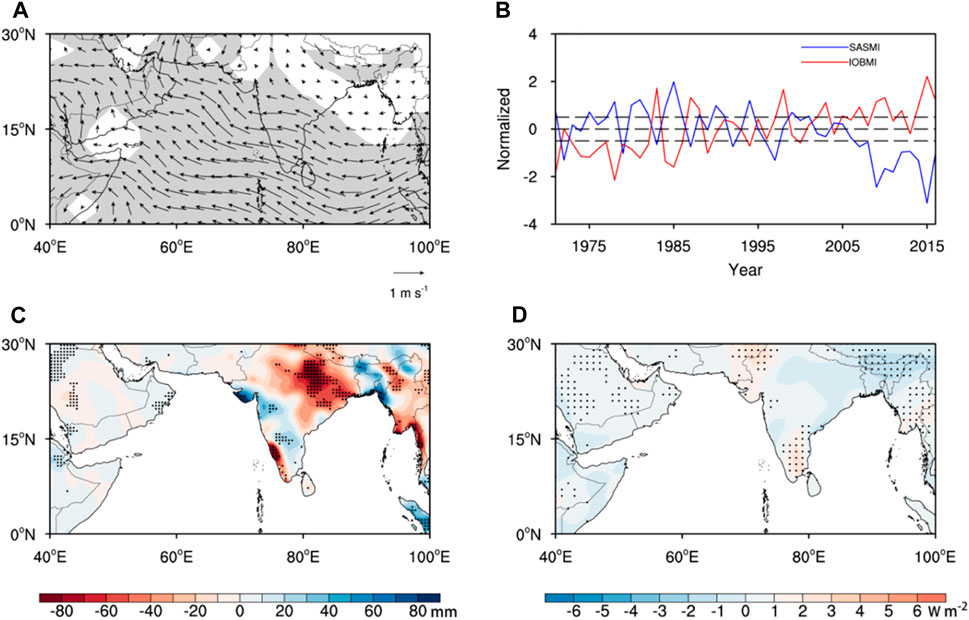
FIGURE 8. (A) Regression of 850-hPa wind against the IOBMI during 1971–2016, shaded regions show significance at
In order to examine whether the jet position can influence the mid-level wind and water vapor, Figure9 displays the regressions of 500-hPa wind and water vapor flux against the JPI. It is clear that when the JPI is in a positive phase there is an anomalous cyclone over CA and southerly winds control southeast CA, which favors increased summer rainfall (Figure 9A). Meanwhile an anomalous anticyclone over the Indian Peninsula transports water vapor from the Arabian Sea to middle latitude regions and a cyclone over CA relays the water vapor into CA. The key path of water vapor transport is also located along 60°E (Figure 9B), which confirms the conclusions obtained from Figure 7 and Figure 8. So the JPI is closely related to CARI with a correlation coefficient of 0.72 (Figure 9C).
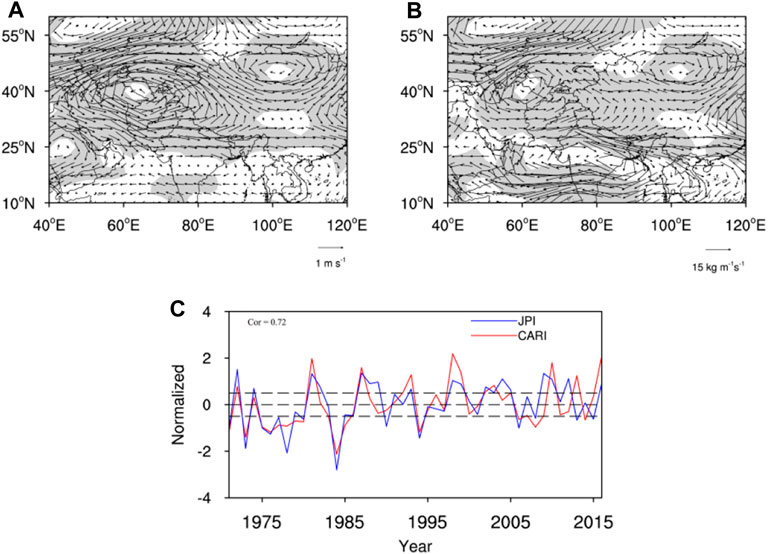
FIGURE 9. Regression of (A) 500-hPa winds and (B) water vapor flux vertically integrated from the surface to 500-hPa against the JPI during 1971–2016, shaded regions show significance at
Conclusions and Discussion
Under the background of global warming, summer rainfall shows a significant increasing trend over the mountains and plateaus known as the “water tower” in CA (Chen et al., 2016). So it is interesting to investigate why these regions in CA receive more summer rainfall. Our analysis suggests that the SST anomalies across the entire tropical IO may contribute to increased summer rainfall in the Tianshan Mountains, Pamir Plateau and western parts of the Tarim Basin. The subtropical westerly jet and cyclone play important roles in influencing summer rainfall over CA. A southward shift of the subtropical westerly jet and an anomalous cyclone over CA favor increased summer rainfall over CA. In addition, water vapor from the tropical IO is also closely related to summer rainfall over CA. Different from the situation in the monsoon regions, water vapor from the tropical IO is transported into CA in two steps. In the first step, an anomalous anticyclone over the Indian Peninsula transports abundant water vapor from the Arabian Sea to middle latitude regions (about 30°N) along 60°E, where the terrain height is less than 1,500 m; in the second step, the anomalous cyclone over CA relays the water vapor to regions farther north and into CA from middle latitude regions.
Correlation analysis indicates that SST warming across the entire tropical IO corresponds to more summer rainfall over CA. When the SSTs in the tropical IO are warmer than normal, they weaken the south Asian summer monsoon and strengthen northward transport of water vapor along 60°E. The weakened summer monsoon reduces the release of latent heat in the Indian Peninsula, and according to a Gill-type response to tropical heating, a low-level anticyclone and upper level cyclone appear on the northwest flank of the heating source (roughly over the Indian monsoon region). Indeed our work shows such features in Figure 7A. The anomalous cyclone over CA strengthens westerly winds in the region40°–80°E, 25°–40°N, which reflects a southward shift of the westerly jet shift. Further analysis indicates that when the westerly jet is located farther south (below 40°N), CA is controlled by an anomalous cyclone, allowing more water vapor to reach CA and favoring increased summer rainfall. So we can confirm that the SST anomalies across the whole tropical IO influences summer rainfall by modulating the subtropical westerly jet over CA.
The mechanisms related to the summer rainfall over CA are known to be quite complex. We have shown a possible mechanism linking the SSTs in the tropical IO and the summer rainfall over CA, but the underlying physical mechanisms are still open questions. Firstly, previous studies have indicated that the shift of the subtropical westerly jet is closely related to SSTs in the Indian Ocean, Pacific and North Atlantic (Du et al., 2016; Zhao et al., 2018; Mei et al., 2019). Our correlation results are in agreement with these studies; the correlation between the JPI and SSTs in these tropical oceans is significant (Figure 10A). Our previous simulated experiments have distinguished between the contributions of SST warming in the IO and east Pacific to CA summer rainfall (Zhao and Zhang, 2016). The results from our previous study indicate that the SST warming in the tropical IO is a key factor and the effects of SSTs warming in east Pacific on summer rainfall over CA are independent. In contrast, the effects of SST anomalies in the North Atlantic on summer rainfall over CA are dependent. Figure 10B displays the regression of 200-hPa wind against the regional mean SSTs over the domain 10°–30°N, 90°–30°W. It is clear that the SST anomalies in the North Atlantic can excite zonal wave trains at middle latitude in upper troposphere along westerlies. Two anomalous cyclones generate over central Asia and eastern Asia, respectively, and cause the two subtropical westerly jets southward shift. The latter has been confirmed by numerical simulation (Mei et al., 2019). Then what are the concurrent effects of SST anomalies in the tropical IO and Atlantic on the subtropical westerly jet and rainfall over CA? More statistical and numerical studies are needed. Secondly, in the current study we do not discuss the decadal time-scale, recent study indicated under the background of different decadal time-scale, the relationships between the subtropical westerly jet and tropical SSTs showed obvious differences (Yin and Zhang 2021). So in next work we also need to focus on decadal time-scale. Thirdly, Wang et al. (2018) found the weakened south Asian summer monsoon in coupled models can be attributed mainly to the antecedent cold SST in the northern Indian Ocean and these cold SST biases develop in winter, reach the peak in spring, and persist until summer. In order to furthermore confirm the effects of SST anomalies in the Indian Ocean on CA summer rainfall, we need to examine their relationships via using different SST data and atmospheric circulation data in future work.
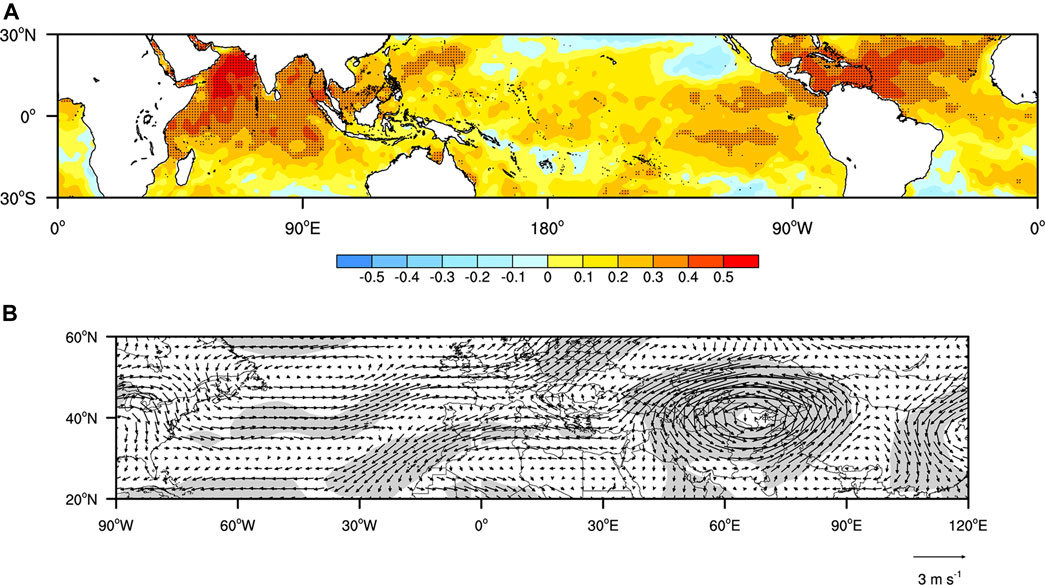
FIGURE 10. (A) Correlation of the JPI and SSTs in the tropical oceans, dotted regions show significance at
Data Availability Statement
The original contributions presented in the study are included in the article/Supplementary Material, further inquiries can be directed to the corresponding author.
Author Contributions
All authors made great contributions to this study. YZ conceived and designed this study. LM performed the experiments. LM, YZ, and ML wrote the manuscript.
Funding
This work was supported by the National Natural Science Foundation of China (Grant Nos. 41875102, U1903113) and Sichuan Science and Technology Program (Grant No. 2020JDJQ0050).
Conflict of Interest
The authors declare that the research was conducted in the absence of any commercial or financial relationships that could be construed as a potential conflict of interest.
Publisher’s Note
All claims expressed in this article are solely those of the authors and do not necessarily represent those of their affiliated organizations, or those of the publisher, the editors and the reviewers. Any product that may be evaluated in this article, or claim that may be made by its manufacturer, is not guaranteed or endorsed by the publisher.
References
Alexander, M. A., Bladé, I., Newman, M., Lanzante, J. R., Lau, N.-C., and Scott, J. D. (2002). The Atmospheric Bridge: the Influence of ENSO Teleconnections on Air-Sea Interaction over the Global Oceans. J. Clim. 15, 2205–2231. doi:10.1175/1520-0442(2002)015<2205:TABTIO>2.0.CO;2
Ashok, K., Guan, Z., and Yamagata, T. (2001). Impact of the Indian Ocean Dipole on the Relationship between the Indian Monsoon Rainfall and ENSO. Geophys. Res. Lett. 28, 4499–4502. doi:10.1029/2001GL013294
Bothe, O., Fraedrich, K., and Zhu, X. (2012). Precipitation Climate of Central Asia and the Large-Scale Atmospheric Circulation. Theor. Appl. Climatol 108, 345–354. doi:10.1007/s00704-011-0537-2
Chen, F., Wang, J., Jin, L., Zhang, Q., Li, J., and Chen, J. (2009). Rapid Warming in Mid-latitude central Asia for the Past 100 Years. Front. Earth Sci. China 3, 42–50. doi:10.1007/s11707-009-0013-9
Chen, Y., Li, W., Deng, H., Fang, G., and Li, Z. (2016). Changes in Central Asia's Water Tower: Past, Present and Future. Sci. Rep. 6, 35458. doi:10.1038/srep35458
Dai, A., Trenberth, K. E., and Qian, T. (2004). A Global Dataset of Palmer Drought Severity Index for 1870-2002: Relationship with Soil Moisture and Effects of Surface Warming. J. Hydrometeorol 5, 1117–1130. doi:10.1175/jhm-386.1
Du, Y., Li, T., Xie, Z., and Zhu, Z. (2016). Interannual Variability of the Asian Subtropical westerly Jet in Boreal Summer and Associated with Circulation and SST Anomalies. Clim. Dyn. 46, 2673–2688. doi:10.1007/s00382-015-2723-x
Du, Y., Xie, S.-P., Huang, G., and Hu, K. (2009). Role of Air-Sea Interaction in the Long Persistence of El Niño-Induced North Indian Ocean Warming*. J. Clim. 22, 2023–2038. doi:10.1175/2008JCLI2590.1
Gao, S. T., and Tao, S. Y. (1991). Acceleration of Upper-Tropospheric Jet Stream and Low-Tropospheric Front Genesis. Chin. J. Atmos. Sci. 15, 11–21. doi:10.3878/j.issn.1006-9895.1991.02.02
Gill, A. E. (1980). Some Simple Solutions for Heat-Induced Tropical Circulation. Q.J R. Met. Soc. 106, 447–462. doi:10.1002/qj.49710644905
Hu, Z. Y., Hu, R., Zhou, Q., Chen, X., Gang, Y., and Jing, Q. (2018). Spatiotemporal Variation of Wetting or Drying in the Arid Regions in Central Asia. Arid Zone Res. 35, 260–268. doi:10.1007/s11430-011-4333-8
Hu, Z., Zhou, Q., Chen, X., Qian, C., Wang, S., and Li, J. (2017). Variations and Changes of Annual Precipitation in Central Asia over the Last century. Int. J. Climatol 37, 157–170. doi:10.1002/joc.4988
Huang, A., Zhou, Y., Zhang, Y., Huang, D., Zhao, Y., and Wu, H. (2014). Changes of the Annual Precipitation over Central Asia in the Twenty-First Century Projected by Multimodels of CMIP5. J. Clim. 27, 6627–6646. doi:10.1175/JCLI-D-14-00070.1
Huang, G., Qu, X., and Hu, K. (2011). The Impact of the Tropical Indian Ocean on South Asian High in Boreal Summer. Adv. Atmos. Sci. 28, 421–432. doi:10.1007/s00376-010-9224-y
Huang, W., Chen, F., Feng, S., Chen, J., and Zhang, X. (2013). Interannual Precipitation Variations in the Mid-latitude Asia and Their Association with Large-Scale Atmospheric Circulation. Chin. Sci. Bull. 58, 3962–3968. doi:10.1007/s11434-013-5970-4
Huang, W., Chen, J., Zhang, X., Feng, S., and Chen, F. (2015). Definition of the Core Zone of the "Westerlies-Dominated Climatic Regime", and its Controlling Factors during the Instrumental Period. Sci. China Earth Sci. 58, 676–684. doi:10.1007/s11430-015-5057-y
Hulme, M. (1996). Recent Climatic Change in the World's Drylands. Geophys. Res. Lett. 23, 61–64. doi:10.1029/95GL03586
Huxman, T. E., and Smith, S. D. (2001). Photosynthesis in an Invasive Grass and Native Forb at Elevated CO2 during an El Niño Year in the Mojave Desert. Oecologia 128, 193–201. doi:10.1007/s004420100658
IPCC (2007). “Climate Change 2007: The Physical Science Basis. Contribution of Working Group I to the Fourth Assessment Report of the Intergovernmental Panel on Climate Change,”. Editors S. Solomon, D. Qin, M. Manning, Z. Chen, M. Marquis, K. B. Averyt, et al (NY: Cambridge University Press), p996. doi:10.1016/S0925-7721(01)00003-7
Kalnay, E., Kanamitsu, M., Kistler, R., Collins, W., Deaven, D., Gandin, L., et al. (1996). The NCEP/NCAR 40-year Reanalysis Project. Bull. Amer. Meteorol. Soc. 77, 437–471. doi:10.1175/1520-0477(1996)077<0437:tnyrp>2.0.co;2
Katz, R. W., and Brown, B. G. (1992). Extreme Events in a Changing Climate: Variability Is More Important Than Averages. Climatic Change 21, 289–302. doi:10.1007/BF00139728
Klein, S. A., Soden, B. J., and Lau, N.-C. (1999). Remote Sea Surface Temperature Variations during ENSO: Evidence for a Tropical Atmospheric Bridge. J. Clim. 12, 917–932. doi:10.1175/1520-0442(1999)012<0917:RSSTVD>2.0.CO;2
Lau, K.-M., and Weng, H. (1999). Interannual, Decadal-Interdecadal, and Global Warming Signals in Sea Surface Temperature during 1955-97. J. Clim. 12, 1257–1267. doi:10.1175/1520-0442(1999)012<1257:IDIAGW>2.0.CO;2
Lawrence, D. M., and Webster, P. J. (2001). Interannual Variations of the Intraseasonal Oscillation in the South Asian Summer Monsoon Region. J. Clim. 14, 2910–2922. doi:10.1175/1520-0442(2001)014<2910:ivotio>2.0.co;2
Ma, Z., and Fu, C. (2007). Global Aridification in the Second Half of the 20th century and its Relationship to Large-Scale Climate Background. Sci. China Ser. D-earth Sci. 50, 776–788. doi:10.1007/s11430-007-0036-6
Mason, S. J., and Goddard, L. (2001). Probabilistic Precipitation Anomalies Associated with ENSO. Bull. Amer. Meteorol. Soc. 82, 619–638. doi:10.1175/1520-0477(2001)082<0619:ppaawe>2.3.co;2
Mei, Y. Q., Chen, H. S., Liu, P., and Li, D. (2019). Zonally Asymmetric Variation of Summer Asian Upper-Tropospheric Jet and its Possible Association with North Atlantic SST Anomaly and Eurasian Land Surface thermal Anomaly (In Chinese). Chin. J. Atmos. Sci. 43, 401–416. doi:10.3878/j.issn.1006-9895.1804.18112
Nicholson, S. E., Tucker, C. J., and Ba, M. B. (1998). Desertification, Drought, and Surface Vegetation: An Example from the West African Sahel. Bull. Amer. Meteorol. Soc. 79 (5), 815–829. doi:10.1175/1520-0477(1998)079<0815:ddasva>2.0.co;2
Rayner, N. A. (2003). Global Analyses of Sea Surface Temperature, Sea Ice, and Night marine Air Temperature since the Late Nineteenth century. J. Geophys. Res. 108. doi:10.1029/2002jd002670
Schneider, U., Becker, A., Finger, P., Meyer-Christoffer, A., Ziese, M., and Rudolf, B. (2014). GPCC's New Land Surface Precipitation Climatology Based on Quality-Controlled In Situ Data and its Role in Quantifying the Global Water Cycle. Theor. Appl. Climatol 115, 15–40. doi:10.1007/s00704-013-0860-x
Sheffield, J., and Wood, E. F. (2008). Projected Changes in Drought Occurrence under Future Global Warming from Multi-Model, Multi-Scenario, IPCC AR4 Simulations. Clim. Dyn. 31, 79–105. doi:10.1007/s00382-007-0340-z
Shi, Y. F., Shen, Y. P., and Hu, R. J. (2002). Preliminary Study on Signal, Impact and Foreground of Climatic Shift from Warm-Dry to Warm-Humid in Northwest China (In Chinese). J. Glaciol Geocryol 24, 219–22615. doi:10.1002/mop.10502
Smith, S. D., Zitzer, S. F., Charlet, T. N., Housman, D. C., Coleman, J. S., Fenstermaker, L. K., et al. (2000). Elevated CO2 Increases Productivity and Invasive Species success in an Arid Ecosystem. Nature 408, 79–82. doi:10.1038/35040544
Wang, Z., Li, G., and Yang, S. (2018). Origin of Indian Summer Monsoon Rainfall Biases in CMIP5 Multimodel Ensemble. Clim. Dyn. 51, 755–768. doi:10.1007/s00382-017-3953-x
Webster, P. J., and Yang, S. (1992). Monsoon and ENSO: Selectively Interactive Systems. Q.J R. Met. Soc. 118, 877–926. doi:10.1002/qj.49711850705
Yang, L. M., and Zhang, Q. Y. (2007). Circulation Characteristics of Inter-annual and Inter-decadal Anomalies of Summer Rainfall in north Xinjiang (In Chinese). Chin. Geophys. 50, 412–419. doi:10.1002/jrs.1570
Yin, J., and Zhang, Y. (2021). Decadal Changes of East Asian Jet Streams and Their Relationship with the Mid-high Latitude Circulations. Clim. Dyn. 56, 2801–2821. doi:10.1007/s00382-020-05613-8
Yulaeva, E., and Wallace, J. M. (1994). The Signature of ENSO in Global Temperature and Precipitation Fields Derived from the Microwave Sounding Unit. J. Clim. 7, 1719–1736. doi:10.1175/1520-0442(1994)007<1719:tsoeig>2.0.co;2
Zhang, Y. H., Yang, L. M., and Xiao, K. T. (2012). The central Asian Vortexes Activity during 1971–2010 (In Chinese). Plateau Meteorol. 23, 312–321. doi:10.1016/j.accre.2017.03.002
Zhao, Y., Yu, X., Yao, J., and Dong, X. (2018). Evaluation of the Subtropical westerly Jet and its Effects on the Projected Summer Rainfall over central Asia Using Multi-CMIP5 Models. Int. J. Climatol 38 (38), e1176–e1189. doi:10.1002/joc.5443
Zhao, Y., and Zhang, H. (2016). Impacts of SST Warming in Tropical Indian Ocean on CMIP5 Model-Projected Summer Rainfall Changes over Central Asia. Clim. Dyn. 46, 3223–3238. doi:10.1007/s00382-015-2765-0
Zhaomei, Z., Zhongwei, Y., and Duzheng, Y. (2001). The Regions with the Most Significant Temperature Trends during the Last century. Adv. Atmos. Sci. 18, 481–496. doi:10.1007/s00376-001-0039-8
Zhou, Y.-k., He, B.-l., Zhou, W.-j., Huang, J., Li, X.-h., Wu, B., et al. (2004). Electrochemical Capacitance of Well-Coated Single-Walled Carbon Nanotube with Polyaniline Composites. Electrochimica Acta 49, 257–262. doi:10.1016/j.electacta.2003.08.007
Keywords: SST anomaly, Indian Ocean, subtropical westerly jet, summer rainfall, Central Asia
Citation: Meng L, Zhao Y and Li M (2021) Effects of Whole SST Anomaly in the Tropical Indian Ocean on Summer rainfall Over Central Asia. Front. Earth Sci. 9:738066. doi: 10.3389/feart.2021.738066
Received: 08 July 2021; Accepted: 30 August 2021;
Published: 10 September 2021.
Edited by:
Gen Li, Hohai University, ChinaCopyright © 2021 Meng, Zhao and Li. This is an open-access article distributed under the terms of the Creative Commons Attribution License (CC BY). The use, distribution or reproduction in other forums is permitted, provided the original author(s) and the copyright owner(s) are credited and that the original publication in this journal is cited, in accordance with accepted academic practice. No use, distribution or reproduction is permitted which does not comply with these terms.
*Correspondence: Yong Zhao, emhhb3k2MDhAY3VpdC5lZHUuY24=