 Peter M. Finocchio
 James D. Doyle
- Naval Research Laboratory, Monterey, CA, United States
We investigate the effects of summer cyclones on sea ice within the Pacific sector of the Arctic by analyzing the surface energy flux and wind forcing from a large sample of cyclones. Consistent with recent studies, we find that cyclones earlier in the melt season tend to be associated with less 1–5 day sea ice loss than what occurs in the absence of cyclones. In contrast, cyclones later in the melt season slightly accelerate the 1-day sea ice loss. The reduced ice loss following cyclones in June is primarily due to increased cloud cover reducing the net shortwave flux at the surface. Clouds associated with cyclones in July and August also reduce the net shortwave flux at the surface, but only over high-concentration sea ice. Southerly winds associated with August cyclones increase both the negative local sea ice advection and the surface heat flux, particularly for the low concentration sea ice that is prevalent in August. Sea ice advection and surface heat flux are the only two factors we examined that can explain the enhanced ice loss on cyclone days in August. We also examined two cyclone cases that impacted sea ice in the East Siberian Sea in June 2012 and August 2016, and found for both cyclones that the sensible heat flux is the largest positive anomalous forcing and the shortwave radiative flux is the largest negative anomalous forcing. Similar to the large sample of cyclones, the shortwave flux has a stronger relationship to local changes in SIC in June than in August. Part of the reason for this is that the cloud shortwave radiative forcing during the August cyclone is 26% weaker than during the June cyclone. In an area averaged sense, the anomalous surface energy and wind forcing of both cyclone cases is similar in magnitude, yet the August cyclone is followed by a greater reduction in both sea ice area and mean sea ice concentration than the June cyclone. This result emphasizes how the underlying sea ice characteristics largely determine cyclone impacts on sea ice on short time scales.
Introduction
Arctic summer sea ice cover is decreasing at such a rate that ice-free summers are projected to occur by the middle of this century (Stroeve et al., 2012; Overland and Wang 2013). This remarkable loss of sea ice is a result of the significant warming of the Arctic atmosphere and ocean that has taken place in recent decades. Whether transient Arctic cyclones during the summer months have contributed to the accelerating loss of sea ice remains unclear. There has been no significant increase in Arctic-wide cyclone frequency or intensity that would suggest stronger or more frequent cyclones during the summer are responsible for accelerating summer ice loss (Screen et al., 2011; Koyama et al., 2017; Semenov et al., 2019). However, cyclones are likely having a larger effect on sea ice cover as young and thin sea ice becomes more widespread in the Arctic (Rampal et al., 2009; Maslanik et al., 2011; Spreen et al., 2011; Lindsay and Schweiger 2015; Itkin et al., 2017). Despite uncertainty in whether cyclones are a significant source of seasonal or interannual variability in pan-Arctic sea ice cover (Rae et al., 2017), numerous studies have demonstrated that cyclones are indeed a source of local and short term variability in sea ice cover and concentration (Zhang et al., 2013; Stern et al., 2020; Lukovich et al., 2021), and these short-term changes in sea ice are critical for navigability within the Arctic region. This study examines how the surface winds and atmospheric energy flux from recent Arctic summer cyclones affects sea ice concentration on synoptic weather time scales of 1–10 days.
The strong surface winds associated with summer cyclones affect sea ice in several ways. Wind-induced drift is a key source of short term sea ice variability—particularly where the sea ice cover is thinner, farther from the coastline, and primarily composed of floes (Thorndike and Colony 1982; Hakkinen et al., 2008; Spreen et al., 2011; Vihma et al., 2012). Whether the wind-induced advection of sea ice increases or decreases sea ice concentration at a given location, however, depends on the direction of the surface winds relative to the local gradient in ice concentration. Cyclonic surface winds enhance sea ice divergence, which locally reduces sea ice concentration in the vicinity of a cyclone (Maslanik and Barry 1989; Kriegsmann and Brümmer, 2014; Lukovich et al., 2021). In addition, strong surface winds later in the summer are increasingly capable of mixing relatively warm sub-surface sea water upward toward the surface, which causes substantial melting along the ocean-facing side of sea ice (Steele et al., 2010; Zhang et al., 2013; Stern et al., 2020).
Cyclones also contribute to the short-term variability in sea ice concentration by changing the local energy balance on the atmosphere-facing side of sea ice. Clouds associated with cyclones reflect solar radiation that would otherwise melt the top surface of sea ice and/or heat the open water areas around sea ice (Finocchio et al., 2020; Schreiber and Serreze 2020). Finocchio et al. (2020) found this cloud shading effect was particularly strong in the Arctic marginal ice zone (MIZ) in June, when shortwave radiation reaches its annual maximum and when clouds have a strong cooling effect at the surface (Kay and L’Ecuyer 2013). Schreiber and Serreze (2020) showed that the cloud shading effect of cyclones temporarily decelerates the seasonal reduction in sea ice concentration near the ice edge during summer. Although cloud cover also increases the downward longwave flux at the surface, which can have important implications for sea ice change in the winter and spring months (Shupe and Intrieri 2004; Persson 2012), Finocchio et al. (2020) found that the average reduction in shortwave radiation due to early summer cyclones more than compensates for the increased longwave radiation from clouds in their sample of cyclone cases, resulting in a net decrease in the atmospheric energy flux at the surface due to cyclones. Although Arctic cyclones tend to decelerate the seasonal loss of sea ice early in the melt season, the strong sensible and latent heat fluxes within the warm sector of cyclones later in the melt season can locally accelerate sea ice loss. For example, Stern et al. (2020) showed that the sensible heat flux in the warm sector of an exceptionally strong cyclone in August 2012 (frequently referred to as the “Great Arctic Cyclone”) contributed to anomalous surface energy forcing that locally accelerated ice loss in the Beaufort Sea.
Cyclone impacts on sea ice vary from case to case not only because of variability in the cyclones themselves, but also because of differences in the underlying sea ice cover. Lukovich et al. (2021) compared the impacts of similarly intense Arctic cyclones in August 2012 and August 2016 on the sea ice. They found that the August 2012 cyclone had a more destructive effect on sea ice primarily because it affected thinner, lower-concentration sea ice than the August 2016 cyclone. The apparent dependency of cyclone impacts on the characteristics of the underlying sea ice motivates a new approach to analyzing the relationship between cyclones and sea ice loss that involves stratifying cyclone impacts based on the underlying sea ice concentration.
Similar to Finocchio et al. (2020), this study adopts a statistical approach to analyzing the effects of Arctic cyclones on sea ice within the marginal ice zone. We focus here on the Pacific sector of the Arctic, which experiences high interannual variability in summer sea ice cover and frequent summer cyclones. Within this region, we stratify the effects of cyclones on sea ice by the sea ice concentration in order to gain a more detailed understanding of the relationship between cyclone impacts and short-term sea ice changes. A description of the methods and data used for this study appears in Methods and Data. The Results section describes the results of the statistical analysis of cyclones located within the Pacific sector of the Arctic from June-August in the years 1999–2018, as well as a comparison of two Arctic cyclones that occurred at the beginning and the end of the melt season. The Discussion and Conclusions section contains a discussion of the results and some concluding remarks.
Methods and Data
The primary data used for this study includes sea ice concentration and atmospheric fields from the European Centre for Medium Range Weather Forecasts (ECMWF) ERA-5 Reanalysis (Hersbach et al., 2020). All ERA-5 fields are available on a common 0.25-degree (∼31 km) grid and the atmospheric fields are updated hourly, though we only use 6-hourly data in this study. Sea ice concentration (SIC) in ERA-5 is updated once daily at 00Z based on the real-time European Organisation for the Exploitation of Meteorological Satellites (EUMETSAT) Satellite Application Facility on Ocean and Sea Ice (OSI-SAF) product (Eastwood et al., 2014; Hirahara et al., 2016). The OSI-SAF product is generated from an algorithm that estimates SIC using corrected brightness temperature observations from passive microwave satellites.
The geographic focus of this study is on the marginal seas in the Pacific sector of the Arctic, defined here as the region from 70 to 80N and from 120E to 130W. Because this region encompasses the East Siberian, Chukchi, and Beaufort Seas, we henceforth refer to it as the ECB region. We focus on this region for multiple reasons. First, the sea ice within the ECB region is frequently impacted by cyclones during the summer months that develop within a low-level baroclinic zone along the northern coast of Siberia (Crawford and Serreze 2016). In addition, this region features high interannual variability in SIC (Figures 1A–C) and large average 5-day losses of SIC (Figures 1D–F) during the summer months. Part of the reason for the large reductions in SIC within this region is that it encompasses a large portion of the summertime MIZ, defined by sea ice concentrations between 15 and 80% (Strong et al., 2017). The MIZ primarily consists of young, thin, and broken sea ice that is more apt to drift in response to surface winds and ocean currents than the more consolidated pack ice. Finally, from a seasonal perspective, the sea ice cover within the ECB region is often what differentiates years with anomalously low and high pan-Arctic sea ice cover.
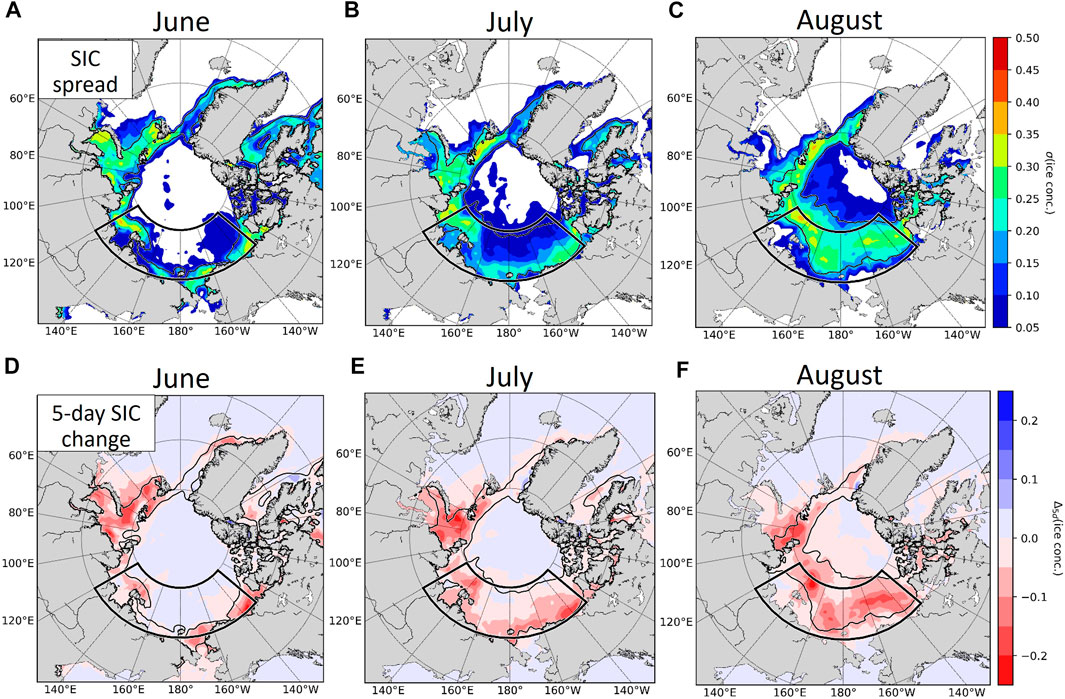
FIGURE 1. Standard deviation of sea ice concentration (SIC) over all days in June (A), July (B), and August (C), and the monthly averaged 5-day change in SIC in June (D), July (E), and August (F). The ECB region is outlined with a thick black line in each panel. The black contours are the 15 and 80% sea ice concentration contours outlining the marginal ice zone.
Although the melt season typically begins in May and ends in September (Persson 2012), we restrict our analysis to the core months of the melt season (June, July, and August) in which each day is climatologically associated with sea ice loss and a sizeable fraction of the study area is covered by the MIZ. We also only consider cyclone cases that occurred during the recent period of 1999–2018 in order to capture the effects of cyclones on the younger and thinner sea ice that has come to characterize the “New Arctic” regime (Landrum and Holland 2020).
We use a database of Arctic cyclone tracks generated from the cyclone tracking algorithm of Sprenger et al. (2017) in order to identify Arctic cyclones that occur within the ECB region during the study period. This algorithm identifies local minima in ERA-5 sea level pressure and tracks the positions of these local minima through time using the method of Wernli and Schwierz (2006, their Section 2D), but using hourly ERA-5 fields rather than 6-hourly ERA-interim data. For this study, we only consider cyclones that achieve a minimum sea level pressure ≤995 hPa and which are tracked continuously for at least 48 h. We define cyclone days as days in which a valid cyclone is located within 300 km of the latitude-longitude box outlining the ECB region defined above. This buffer distance around the ECB region is based on the average cyclone radius from Kriegsmann and Brümmer (2014), and is included to account for cyclone cases whose impacts are felt within the ECB region while the cyclone is located outside of the region. The left panels of Figure 2 show the 00Z positions of the valid cyclone cases and the SIC averaged over the cyclone days in each month. Consistent with Crawford and Serreze (2016), there are more valid cyclone cases in July and August compared to June. Cyclones in June primarily occur in the western half of the region, while cyclones in July and August are more evenly distributed throughout the region.
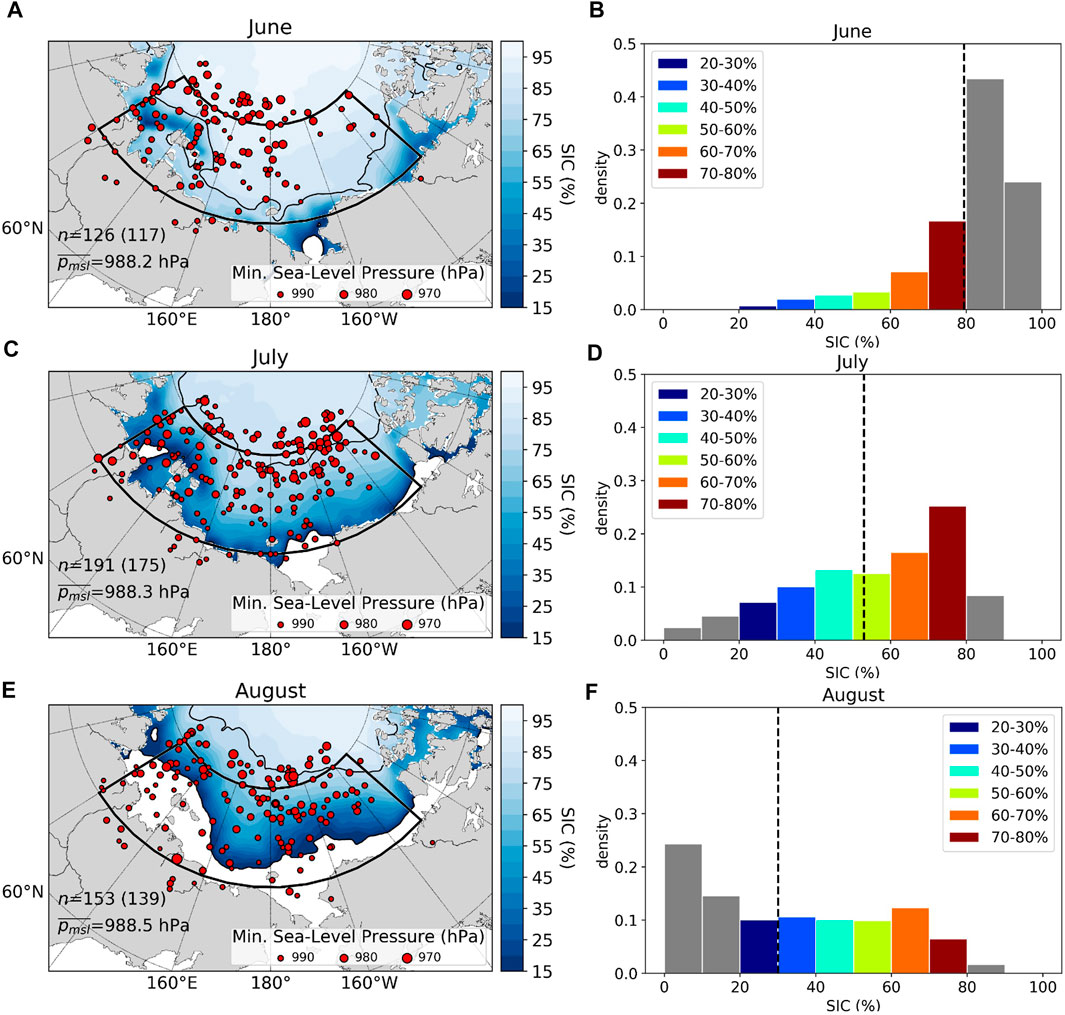
FIGURE 2. (A,C,E) Cyclone cases (red dots) and the average SIC on cyclone days in each month (shading). The black contour is the 80% SIC contour denoting the poleward extent of the marginal ice zone, and the black box outlines the ECB region. The size of the dots corresponds to the cyclone minimum sea level pressure (see legend). The values printed in the lower left are the number of cyclone cases (n) and the number of unique cyclones in parentheses (as multiple cases can correspond to a single cyclone), and the average minimum sea level pressure of all cyclone cases in each month (pmsl); (B,D,F) probability density of monthly averaged SIC within the outlined ECB region. Bars are colored according to the SIC bins, with grey bars denoting SIC<20% or SIC>80%. The vertical dashed line denotes the mean SIC within the ECB region in each month.
The cyclone impacts on sea ice that can be estimated from the uncoupled ERA-5 include SIC advection by the surface winds and the surface energy flux from the atmosphere. Sea ice advection is part of the dynamic contribution of the atmosphere to local changes in SIC. We compute sea ice advection using the 10-m wind vector and the local gradient in SIC at each grid point, and assume that sea ice drifts at 2% of the surface wind speed (Spreen et al., 2011). The net surface energy flux from the atmosphere is the direct thermodynamic contribution that influences melting on top of the sea ice. We believe ERA-5 is the first reanalysis product that is suitable for this analysis because it has been shown to have smaller biases in surface winds and atmospheric surface energy fluxes in the Arctic than previous reanalysis products (Graham et al., 2019). However, ERA-5 does not contain sufficient information about the upper ocean for a detailed analysis of the indirect thermodynamic contributions of the atmosphere to sea ice loss, which involve upper ocean heating due to vertical mixing that results in lateral and basal ice melt (Steele et al., 2010; Zhang et al., 2013).
The right panels in Figure 2 show the distribution of the monthly average SIC within the ECB region. June features predominately high-concentration sea ice with an average concentration of ∼80%, while August features predominately low-concentration sea ice with an average concentration of ∼30%. This distributional shift in SIC over the course of the melt season has important implications for the amount of sea ice loss that can be expected to occur in response to a cyclone. The net shortwave radiative flux at the surface, for example, varies strongly with SIC due to differences in the average surface albedo. Consequently, the cloud shading effect of cyclones is expected to be greater in regions of low-concentration sea ice where more shortwave radiation is absorbed rather than reflected at the surface (Perovich 2018). Furthermore, low concentration sea ice has weaker internal forces than high concentration sea ice, which allows such sea ice to drift more easily in response to the surface wind forcing (Spreen et al., 2011). Therefore, the advective effects of surface winds on sea ice will also tend to be larger in areas with low SIC. In order to account for these ice concentration dependencies in the ensuing analysis, we compute sea ice advection and atmospheric energy flux at the surface separately for grid points categorized by their SIC into six 10%-wide bins ranging from 20 to 80% ice concentration.
Results
Climatology of Short-Term Sea Ice Changes During Summer
We begin by examining the climatological change in SIC and total sea ice area (SIA) during the summer months within the ECB region. We compute SIA by taking the sum across the ECB region of the product of SIC and the area of each grid point. Figure 3 shows the average change in SIA (A-C) and SIC (D-F) from 1–10 days after all days in each month in the 20-year study period of 1999–2018. Error bars represent ± 1 standard deviation of the change in SIA or SIC at each lag day. As expected during the melt season, both SIA and SIC decreases on average from 1–10 days after a given day in June, July, and August. The 10-day reductions in SIA are largest in June and July (Figures 3A,B), and the 10-day reductions in local SIC are largest for low-concentration sea ice in July (Figure 3E). Specifically, grid points with SIC between 20 and 40% in July experience more than 15% SIC reduction after 10 days on average, indicating almost a complete loss of sea ice at these grid points (Figure 3E). The rate of SIC loss in the 20–40% SIC bins starts to level off after about 5 days in both July and August due to the limited amount of possible SIC loss that can occur within these bins (e.g., the SIC loss for a grid point with 20% SIC cannot exceed 20%). The remainder of this analysis focuses on the 1–5 day changes in sea ice in order to exclude the longer lag times when the rate of SIC loss begins to level off in the low SIC bins.
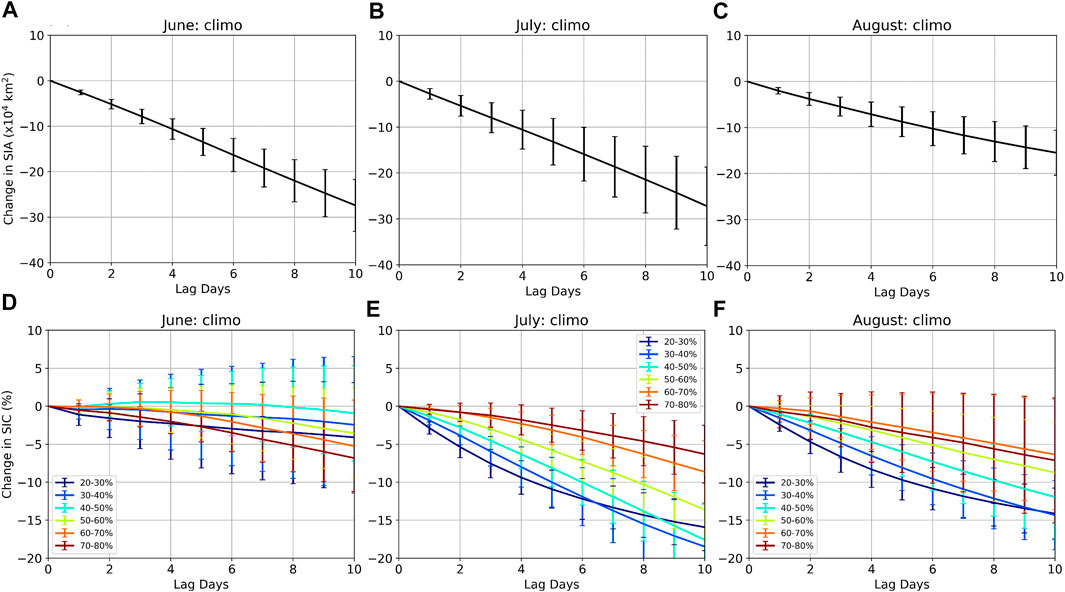
FIGURE 3. Average change in total sea ice area (SIA) within the ECB region (A–C) and the average change in SIC at each grid point in the ECB region and within each 10%-wide bin (D–F) from 1–10 days after a given day in each month. The error bars extend ± 1 standard deviation from the average SIA or SIC change at each lag day.
In order to get a statistical sense for the extent to which each dynamic and thermodynamic forcing is associated with climatological SIC loss in each month, Figure 4 shows the correlation between 3-day SIC loss in each bin and the SIC advective tendency by the 10-m wind (“adv”), the net shortwave (“SW”) flux at the surface, the net longwave (“LW”) flux at the surface, the surface sensible heat flux (“SH”), the surface latent heat flux (“LH”), and the sum of all four surface fluxes (“net”). Red (blue) colors in Figure 4 indicate that a forcing term is statistically associated with more (less) local SIC loss (we multiply the advective tendency by −1 in order for this to be the case). In June, stronger SIC advection and, to a lesser extent, SW flux is associated with enhanced local SIC loss, while stronger LW, SH, and LH fluxes are associated with less SIC loss in June. This is likely due to a strong anticorrelation between the SW flux and each of the LW, SH, and LH fluxes (not shown), and does not actually mean that stronger LW, SH, or LH fluxes cause SIC to increase at a location. In July and August, SIC advection has the strongest relationship to local SIC loss, with larger positive correlations at lower ice concentrations. The relationship between SIC loss and each of the different atmospheric energy fluxes in July and August is similar to June for high concentration sea ice. However, for SIC between 20 and 40%, stronger LW, SH, and LH fluxes start to be weakly associated with more SIC loss later in the melt season. Nevertheless, the net atmospheric energy flux explains no more than about 2% of the variance in local SIC changes throughout the melt season. Among the forcing terms considered here, the wind-induced SIC advection has the strongest and most consistent relationship to local SIC loss during the summer months.
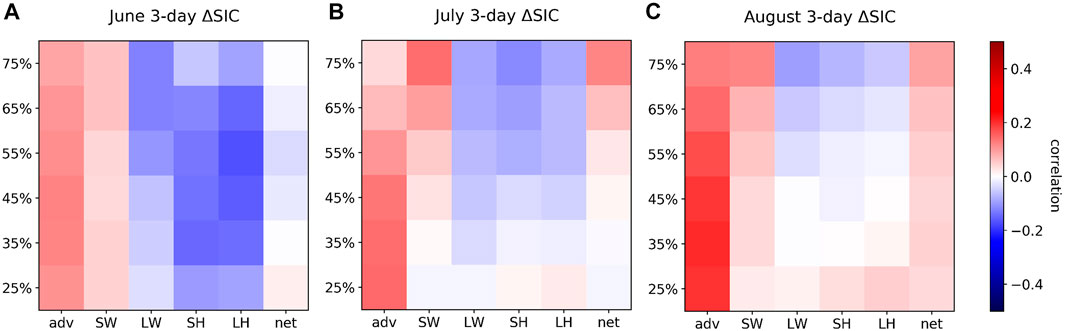
FIGURE 4. Pearson correlation coefficients in June (A), July (B), and August (C) between the 3-day change in sea ice concentration (∆SIC) and the negative SIC advective tendency (“adv”), the net shortwave flux at the surface (“SW”), the net longwave flux at the surface (“LW”), the sensible surface heat flux (“SH”), the latent surface heat flux (“LH”), and the total surface energy flux from the atmosphere (“net”). Correlations are computed separately for grid points in each 10%-wide SIC bin, labeled along the left side of each panel according to the mid-point SIC value in each bin.
If we instead compute correlations between the loss of total SIA within the ECB region and area-averages of each forcing term (Figure 5), we find somewhat different statistical relationships than for local SIC loss. In June and July, SIC advection has a moderate correlation with 1-day SIA loss and a much weaker correlation with 5-day SIA loss. By August, SIC advection has a stronger correlation to 4–5 day SIA loss than in June and July. This statistical signal of a near-instantaneous response of sea ice cover to wind-induced advection of sea ice early in the melt season, followed by a more lagged response later in the melt season is consistent with the findings of Finocchio et al. (2020). Similar to the SIC correlations shown in Figure 4, increased SW flux is associated with more SIA loss in June and July. Because the SW flux is the largest component of the surface atmospheric energy balance during the summer months, correlations between SIA loss and the net flux closely reflect those for the SW flux in all 3 months. In June and July, the magnitude of the correlation between the SW flux and SIA loss increases at longer lag times, indicating that SIA exhibits a lagged response to anomalous surface energy forcing from the atmosphere. This is in contrast to the near-instantaneous response of SIA to the surface wind forcing (i.e., advection), suggesting that surface energy forcing affects sea ice on longer time scales than surface wind forcing during June and July. By August, both the SW flux and the net flux are anti-correlated with SIA loss at all lag times. This negative correlation between SW flux and SIA loss in August suggests that the SW flux is no longer the key component of the surface atmospheric energy budget for understanding short-term SIA changes later in the melt season.
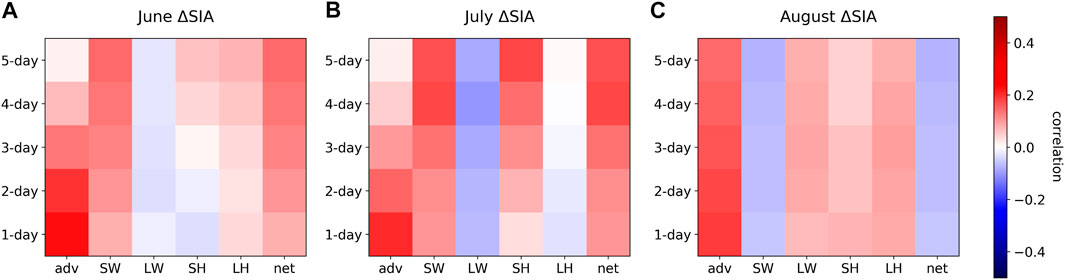
FIGURE 5. Pearson correlation coefficients in June (A), July (B), and August (C) between the 1–5 day change in total sea ice area (∆SIA) within the ECB region and each forcing term shown in Figure 4. The y-axis on each panel indicates the lag time over which SIA is computed.
Physically speaking, an increase in any of the surface energy forcing terms should result in enhanced ice loss because an increase in the energy flux from the atmosphere into the sea ice will increase surface melt. Similarly, stronger negative sea ice advection should locally decrease SIC. Therefore, any instances of negative correlations in Figures 4, 5 are most likely due to covariances between the forcing terms and do not reflect a causal link to sea ice loss, while positive correlations are more likely to indicate the factors that actually cause ice loss. By this reasoning, the advective tendency and the SW forcing are the most likely forcing terms to cause SIA loss in June and July, while the advective tendency and the combination of LW, SH, and LH fluxes are the most likely forcing terms to cause SIA loss in August. Advection and SW flux (for high concentration sea ice) appear to be the only two terms that consistently have a potential causal link to local SIC loss (Figure 4).
Statistical Analysis of Summer Cyclone Effects on Sea Ice
The statistical relationships between each forcing term and both local (Figure 4) and regional (Figure 5) changes in sea ice provide context for understanding how cyclones affect sea ice, as cyclones locally change the surface energy balance in sea ice-covered areas and induce anomalous wind forcing on sea ice. Figure 6 shows the differences in the average 1–5 day change in SIA (A-C) and SIC (D-F) between cyclone and non-cyclone days in each month during the study period, where non-cyclone days are simply the days in which there is no valid cyclone case inside or within 300 km of the ECB region boundary. The presence of a cyclone is associated with an average of about 3 × 10⁴ km2 less SIA loss over a 5-day period in June and July compared to days without cyclones. In August, however, the presence of a cyclone is associated with about 1 × 10⁴ km2 more 1-day SIA loss, on average. The smaller amount of SIA lost from 1–5 day after cyclones in June is greater than the climatological variability in SIA changes (represented by the error bars in Figure 6A extending ± 1 standard deviation from the mean values). Similarly, the increased 1-day SIA loss in August that is associated with cyclones is also outside of the range of climatological variability in SIA changes in August.
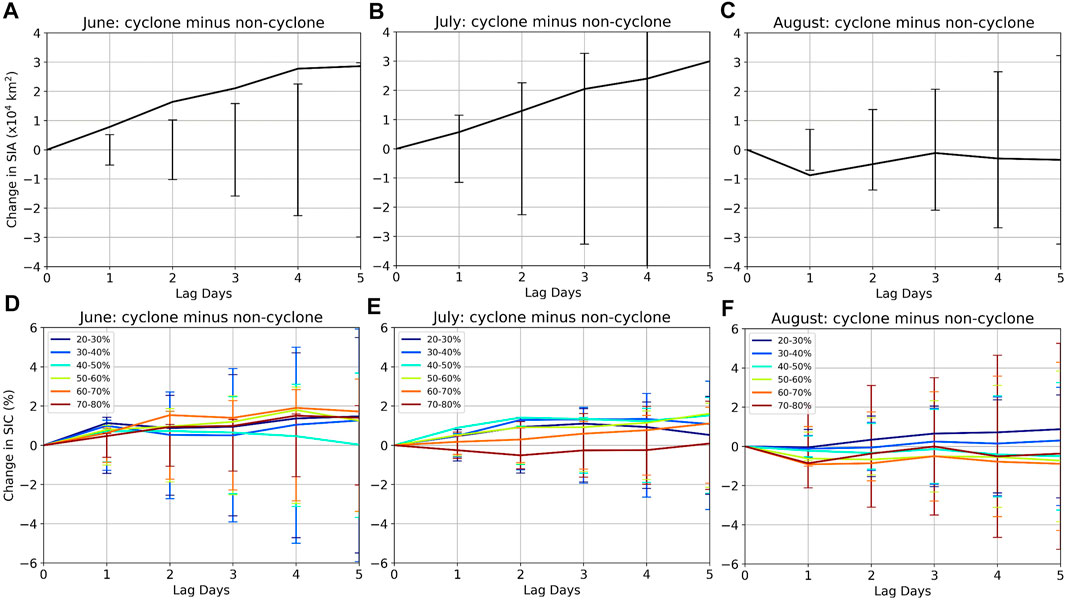
FIGURE 6. (A–C) Difference in the 1–5 day change in SIA in the ECB region between cyclone and non-cyclone days in each month. Error bars are the same as in Figures 3A–C, and indicate ± 1-standard deviation in SIA change at each lag time in each month. (D–F) Difference in the 1–5 day change in SIC at each grid point in the ECB region between cyclone and non-cyclone days. Each line indicates difference for grid points with SIC in each 10%-wide SIC bin. Error bars are the same as in Figures 3D–F, and indicate ± 1-standard deviation in local SIC change at each lag time in each month. Differences are considered significant if they are outside of the error bars.
The presence of a cyclone in June and July is also associated with less local SIC loss, while cyclones in August are associated with slightly more local SIC loss (Figures 6D–F). Cyclones decelerate SIC loss by about 1% in the 20–30% SIC bin in June, and by slightly more than 1% in the 20–50% SIC bins in July. Cyclones in July and August, however, are also associated with an accelerated SIC loss by about 1% for higher concentration sea ice (Figures 4D–F). The differences in local SIC changes between cyclone and non-cyclone days are rarely outside the range of climatological variation of SIC changes in each month, indicating that cyclones have a less significant effect on 1–5 day changes in local SIC than they do on the 1–5 day changes in the region-wide SIA.
The key takeaways from Figure 6 are that 1) cyclone days in June and July have less local and region-wide ice loss compared to days without cyclones, 2) cyclone days in August have slightly more local and region-wide ice loss compared to days without cyclones, and 3) the greater ice loss following August cyclones only persists for about 1 day after the cyclone day. The remainder of this section focuses on the cyclone days in order to understand the cyclone-related surface forcings that are responsible for the reduced 1–5 day ice loss in June and July and the accelerated 1-day ice loss in August.
Figure 7 shows differences in the average 1–5 day change in SIC between grid points in the upper and lower quartiles of each component of the surface atmospheric energy flux on cyclone days. In June, grid points in the upper SW flux quartile experience significantly more 1–5 day SIC loss than grid points in the lower SW flux quartile, regardless of the initial SIC (Figure 7A). In contrast, grid points in the upper quartiles of both LW flux (Figure 7D) and the surface heat flux (Figure 7G) experience significantly less SIC loss than grid points in the lower quartiles of each flux. This unintuitive relationship in which larger surface heat fluxes and LW fluxes are associated with decreased SIC loss suggests that these fluxes do not drive the local changes in SIC, but co-vary with other surface forcings that do. For example, the cloud radiative forcing at the surface is negative in the shortwave and positive in the longwave. Because the negative SW anomalies due to clouds in June tend to be larger in magnitude than the positive LW anomalies (e.g., Finocchio et al., 2020), cloudy grid points frequently end up having less ice loss despite having positive LW flux anomalies.
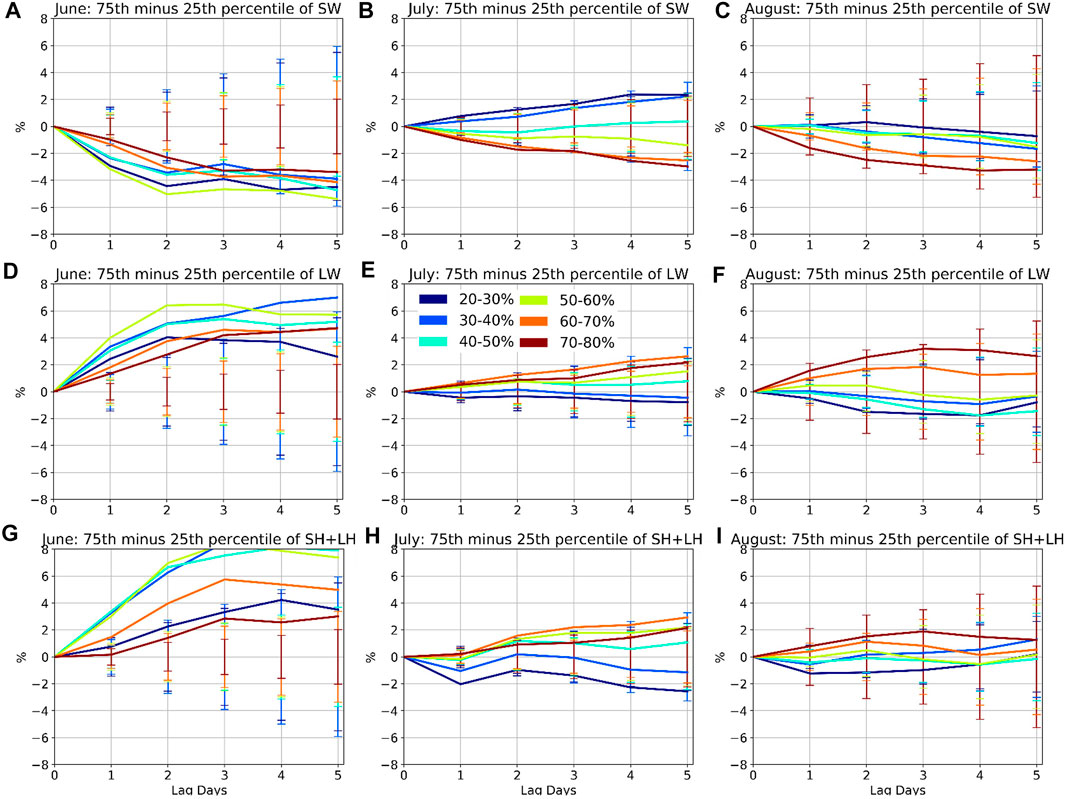
FIGURE 7. Differences in each month in the 1–5 day change in SIC concentration averaged over grid points in the upper versus lower quartiles of the SW flux (A–C), LW flux (D–F), and surface heat flux (H–J). As in Figures 3, 6, line colors indicate the different 10%-wide SIC bins. Error bars are the ± 1 standard deviation of each flux term for grid points with SIC in each bin computed over all days in each month for the 20-year study period.
In July and August, the difference in SIC change between the upper and lower quartiles of SW flux depends on the SIC; strong SW fluxes are associated with less 1–5 day SIC loss for initially low-concentration sea ice, and more SIC loss for initially high-concentration sea ice (Figures 7B,C). This suggests that as the melt season progresses, stronger SW fluxes continue to be an important factor in accelerating the local SIC loss for initially high ice concentrations, while other factors begin to play a greater role in accelerating local SIC loss at lower ice concentrations. One of those factors is the surface heat flux. Low ice concentration (SIC<40%) grid points in the upper quartile of surface heat flux in July and August experience 1–2% more 1-day SIC loss on average than grid points in the lower quartile of surface heat flux (Figures 7H,I). The surface heat flux is a function of both the surface wind speed and the surface temperature and moisture disequilibrium. We find that the 2-m air temperature differentiates grid points in the upper versus lower quartiles of the surface heat flux better than the 10-m wind speed; grid points with ice concentration <40% that are in the upper heat flux quartile in July and August are consistently 2°C warmer, on average, than grid points in the lower heat flux quartile, while the average 10-m wind speed of grid points in each quartile differs by less than 1 m s−1. This indicates that the warm air masses that Arctic cyclones transport poleward into the Arctic (e.g., Fearon et al., 2020) are capable of accelerating the short-term loss of low-concentration sea ice later in the melt season by locally increasing the surface heat flux over sea ice.
Figures 8A–C shows the differences in each term in the surface energy budget between grid points in the upper versus lower-quartiles of 3-day SIC change on cyclone days, where the upper quartile here represents the largest local SIC loss. We note that in all 3 months, differences in each flux are never larger than the climatological variability of each term (indicated by error bars extending ± 1 standard deviation from the mean values), which indicates that factors other than the local surface energy flux from the atmosphere also contribute to local SIC variability during the summer. Nevertheless, these differences are still useful for understanding the relative contributions of each atmospheric flux to local SIC loss. In June, the net flux is ∼19 W m−2 larger on average for grid points in the upper quartile of SIC loss in the 20–30% SIC bins. This larger net flux is due to a larger SW flux that is only partially offset by a smaller LW and sensible heat flux. For the grid points with SIC between 30 and 60%, however, the larger SW fluxes are completely offset by reduced LW and surface heat fluxes. In July and August, differences in the average LW and surface heat fluxes between grid points in the upper and lower quartiles of SIC loss are generally less than 5 W m−2, and differences in the net flux are due primarily to differences in the SW flux. Low-concentration sea ice grid points that experience the most SIC loss have net and SW fluxes that are 10–15 W m−2 smaller than grid points that experience the least SIC loss. For higher concentration sea ice in July and August, however, the largest SIC loss is associated with 10–15 W m−2 larger SW fluxes. This is consistent with Figures 7B,C, which showed that larger SW fluxes in July and August are only associated with enhanced sea ice loss for high concentration sea ice.
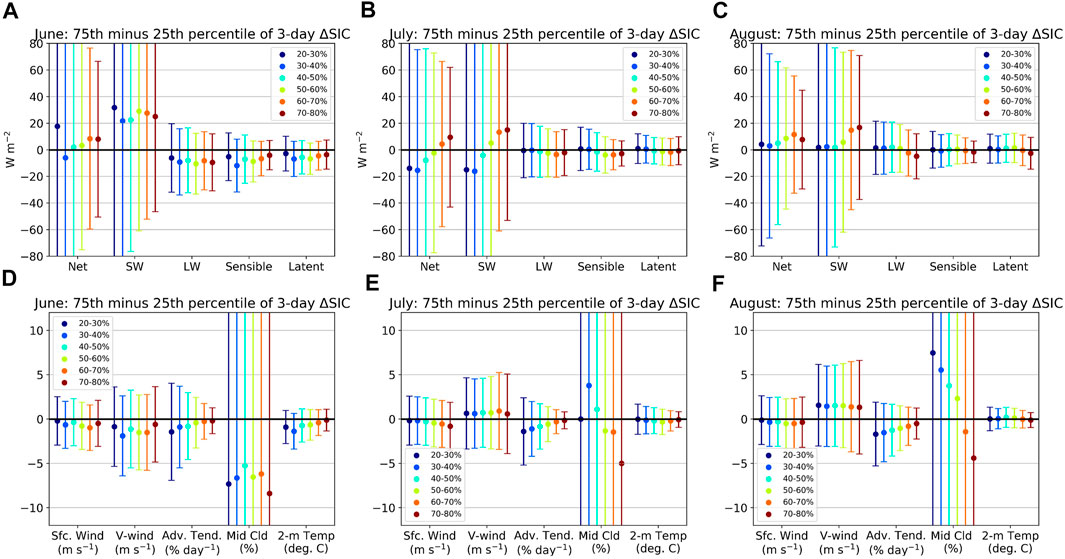
FIGURE 8. Differences in each term in the surface energy budget (A–C) and in the surface wind, advective tendency, mid-level cloud, and 2-m temperature (D–F) between grid points in the upper and lower quartiles of 3-day SIC loss. Differences are computed separately for grid points within each 10%-wide SIC bin. Error bars indicate ± 1 standard deviation in each term computed over all days in each month for the 20-year study period.
Figures 8D–F shows differences in the 10-m wind speed, the 10-m meridional wind, the mid-level (800–450 hPa) cloud fraction, and the 2-m air temperature between grid points in the upper versus lower quartiles of SIC loss on cyclone days. We only consider mid-level clouds because of their relatively large SW radiative forcing and because their variability is more closely tied to cyclones than the fog and low-level stratiform clouds that are prevalent in the Arctic during summer (Eastman and Warren 2010). Similar to the surface fluxes, differences in each of the variables shown in Figures 8D–F are never larger than the climatological variability, but are still useful for understanding the relative contributions of each variable to anomalous local SIC loss. In June, surface winds tend to be slightly weaker and less southerly on average at grid points with the most SIC loss. The SIC advection by the 10-m wind is more negative by about 1.5% per day for low concentration sea ice. Furthermore, the 2-m temperature is cooler by up to 1.5 C and the mid-level cloud fraction is 5–8% lower at grid points with the most SIC loss, which is consistent with a larger SW flux (Figure 8A). Together, these results suggest that the largest 3-day reductions in local SIC during June tend to occur where conditions are calmer, clearer, and cooler. By July and August, the surface wind speed and surface temperature are strikingly similar between grid points with the largest and smallest 3-day SIC loss, but the meridional wind component tends to be more southerly for the largest SIC loss. The differences in the mid-level cloud fraction have more of a dependence on the SIC than in June. For high-concentration sea ice, large local SIC loss is associated with reduced mid-level cloud fraction (Figures 8E,F) and increased SW flux (Figures 8B,C), as in June. However, the largest local reductions in low-concentration sea ice in July and August are associated with a larger cloud fraction and smaller SW fluxes. This combined with the increased southerly wind and more negative SIC advection by about 2% per day on average for low-concentration sea ice in July and August suggests that cloudy, southerly flow regimes increasingly accompany large local SIC loss events in the Arctic as summer progresses.
Certain surface wind regimes may promote the strong, negative SIC advection that is frequently associated with large reductions in low-concentration sea ice. To further explore this, we compute differences in the total wind speed and each component of the local wind vector between cases in the upper versus lower quartiles of SIC advection (Figure 9). In all 3 months, grid points that experience strong SIC advective tendencies have an average total and zonal wind speed that is similar to grid points that experience weak SIC advection. However, the average meridional wind speed is up to 1.5 m s−1 larger (i.e., more southerly) at grid points with the largest negative SIC advection. The more southerly wind component associated with strong negative SIC advection also becomes more apparent as the melt season progresses. Thus, the meridional wind component is what determines how much negative SIC advection occurs within the ECB region—particularly later in the melt season when low concentration sea ice is prevalent. The preference for large negative SIC advection under southerly wind conditions likely relates to the primarily northward-directed SIC gradient within this region of the Arctic (Figure 2).
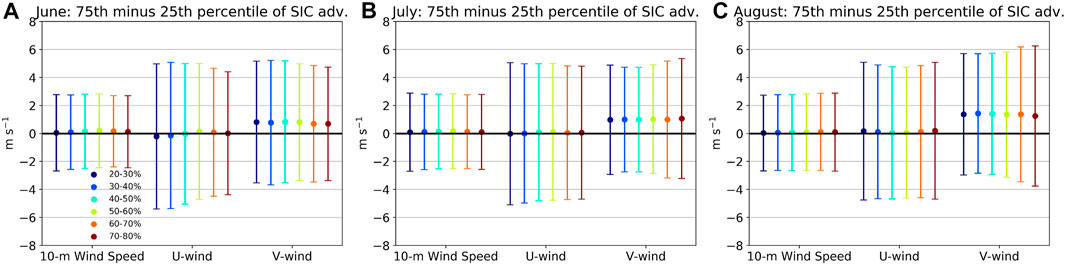
FIGURE 9. Differences in the 10-m wind speed and the u- and v-wind components between grid points in the upper and lower quartiles of SIC advective tendency in each SIC bin. Error bars indicate ± 1 standard deviation in each term computed over all days in each month for the 20-year study period.
Comparison of an Early and a Late Season Cyclone
A key result from the previous section is that the surface forcings that differentiate large from small local and regional ice loss events vary over the course of the melt season and depend to some extent on the initial ice concentration. In this section, we further explore the seasonal dependence of cyclone impacts on sea ice by comparing two cyclone cases that impacted the same region of the Arctic early and late in the melt season. As in the previous section, the analysis of cyclone impacts focuses on the surface wind and energy forcing.
The two selected cyclones occurred in June 2012 and August 2016. Both cyclones reached a similar maximum intensity and affected sea ice in the East Siberian Sea. The June 2012 cyclone emerged from Siberia on 19 June and intensified as it moved toward the northeast, reaching a maximum intensity of 970 hPa at 12Z on 20 June. The August 2016 cyclone was located further north and translated eastward from the Laptev Sea, reaching a maximum intensity of 968 hPa at around 12Z on 15 August and maintaining that intensity for several hours as it made a loop into the central Arctic. Figures 10A,B show the cyclone tracks and the sea level pressure contours at 12Z on the day when the cyclones were near their peak intensity. The color shading denotes the net surface energy flux anomalies relative to the 1999–2018 average. Both cyclones have areas where the net flux over sea ice is more than 20 W m−2 higher than the 20-year average. In both cases, the positive net flux anomalies are primarily associated with positive anomalies in the net longwave, sensible, and latent heat fluxes, while the negative net flux anomalies are associated with negative anomalies in the net SW flux (not shown). The middle panels (10C,D) show SIC and daily averaged 10-m wind vectors, and reveal that positive surface flux anomalies tend to coincide with where the surface winds are directed off of the Eurasian continent. The bottom panels (10E,F) show the distributions of SIC within the boxes outlined in Figures 10A–D. The June cyclone primarily affected sea ice with concentrations >60%, much of which was adjacent to the Siberian coast. Consequently, internal ice forces were likely to be considerably stronger in this case than in August, greatly reducing the wind-induced drift of sea ice. In contrast, the August 2016 cyclone affected lower-concentration sea ice that was further from the Eurasian coastline. This made the sea ice more susceptible to drifting in response to the surface winds of the cyclone.
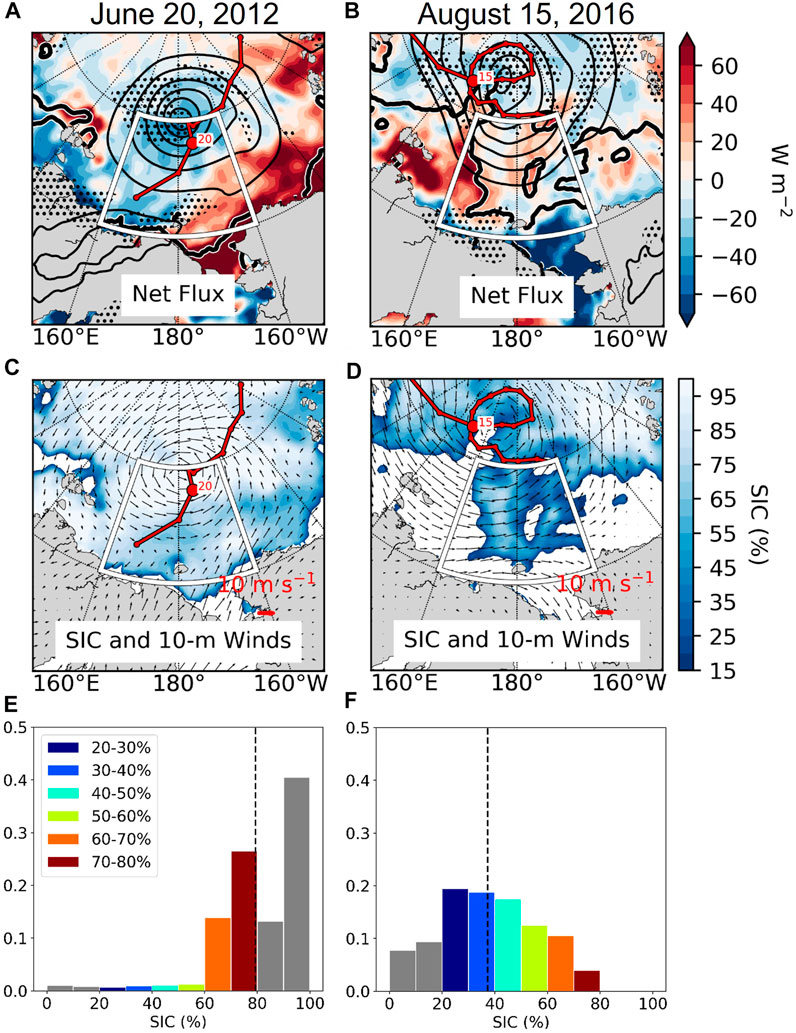
FIGURE 10. (A,B) Cyclone tracks (red line, 00Z cyclone position labeled by day of month), daily averaged net surface energy flux anomalies (shading), mid-level cloud fraction >70% (black stippling), and sea level pressure at 12Z (black contour) on June 20, 2012 (A), and August 15, 2016 (B). The thick black line is the 15% SIC contour indicating the sea ice edge. Sea level pressure contours are drawn every 5 hPa less than 1,000 hPa. (C,D) Sea ice concentration (shading), cyclone track (red line) and daily averaged surface wind vectors on June 20, 2012 (C), and August 15, 2016 (D). (E,F) Probability density of SIC within the white outlined region in A-D on each date colored according to SIC bins as in Figure 2. The vertical dashed line in 10E,F denotes the average SIC within the outlined region.
Figures 11A,B show times series of the area-weighted average within the outlined regions in Figure 10 of the surface energy flux and the mid-level cloud fraction anomalies (relative to the 20-year average) for each cyclone. Quantities are only averaged over grid points covered by sea ice or open water (i.e., land points are excluded). Figures 11C,D show time series of the maximum 10-m wind speed, 2-m temperature, and SST averaged in the same region as in Figures 11A,B. During both cyclones, the largest positive anomaly in the net surface energy flux occurs about 6 h after the largest positive anomaly in mid-level cloud fraction. During the June cyclone, surface flux anomalies reach a local maximum about 12 h before the peak 10-m wind speeds occur, while the peak wind speed and surface flux anomalies roughly coincide during the August cyclone. In both cyclones, the sensible heat flux is the largest positive anomalous energy forcing, which is likely due to the combination of strong surface winds and above average 2-m temperature. The largest negative anomalies in the net SW flux associated with the cloud cover from each cyclone case occur at local noon (∼00Z) on 20 June and 15 August, respectively. Despite clouds reducing the downward SW flux by a larger amount in June, the magnitude of the negative anomalies in the net SW flux is similar during the June and August cyclones, which is likely because the area-averaged surface albedo in June (0.55 on 20 June) is so much larger than in August (0.18 on 15 August).
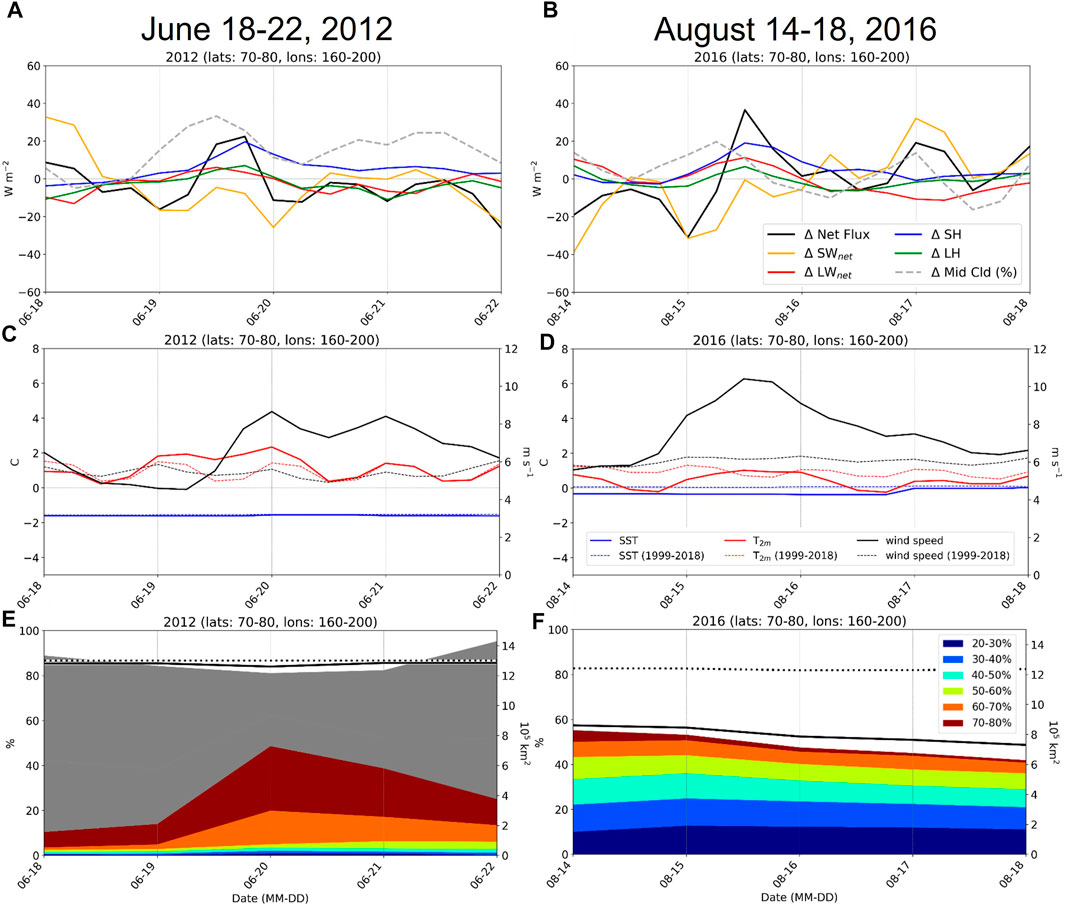
FIGURE 11. (A,B) Time series of the area-weighted average of anomalies in each term in the surface energy budget (W m−2) and the mid-level cloud fraction (%) from 18–22 June 2012 (A) and 14–18 August 2016 (B). Averages are taken within the region outlined in white in Figures 10A–D, and anomalies are computed with the respect to the 20-year average of each quantity in this region. (C,D) As in 11A,B, but for the average SST and 2-m air temperature (left y-axis), and 10-m wind speed (right y-axis) for June 2012 (C) and August 2016 (D). Solid lines denote averages computed in the year in which the cyclone occurred and dotted lines denote the 20-year averages. (E,F) The total fraction of grid points that are in each SIC bin during the same period in June 2012 (E), and August 2016 (F). Color-filled areas indicate the fraction of the region covered by grid points with SIC between 20 and 80%. Gray (white) regions indicate the fraction of area covered by SIC>80% (SIC<20%). The solid black line is the total sea ice area and the dotted black line is the 20-year average sea ice area in the region (right y-axis).
Figures 11E,F show times series of the SIC distributions. In August, the initial SIC distribution has a much higher frequency of low-concentration sea ice compared to in June. Furthermore, the sea ice area in August 2016 (thick black line in Figure 11F) was already 30–50% lower than the 20-year average ice area within this sub-region (dotted black line). As a result, both the reductions in sea ice area and the shift toward lower concentration sea ice associated with the August 2016 cyclone are more apparent than for the June 2012 cyclone. The June 2012 cyclone also induces a distributional shift toward lower concentration sea ice, but has almost no effect on the total sea ice area (Figure 11E). Moreover, the distributional shift in SIC during the June cyclone is only temporary, as the SIC distribution begins to resemble the pre-cyclone distribution 2 days after the passage of the cyclone. These differences in the apparent sea ice impacts of two cyclones that have similar intensity and similar effects on the surface energy balance emphasize the importance of the initial sea ice state for anticipating how cyclones will affect sea ice on short time scales (Lukovich et al., 2021).
Figure 12 shows scatter plots of the 5-day change in SIC versus the various surface forcing terms computed from ERA-5 within the boxed region outlined in Figures 10A,B, and for grid points with SIC between 20 and 80%. The surface energy fluxes in Figures 12A–F and the winds used to compute the advective tendencies in Figures 12G,H are averages of ERA-5 fields at four 6-hourly time steps in each day. In order to increase the sample size, the scatter plots include data from 2 days for each cyclone case during which there were positive net surface flux anomalies in Figures 11A,B (19 and 20 June for the 2012 cyclone, and 15 and 16 August for the 2016 cyclone). Points in Figure 12 that correspond to grid points in the upper decile of total cloud fraction are outlined in black.
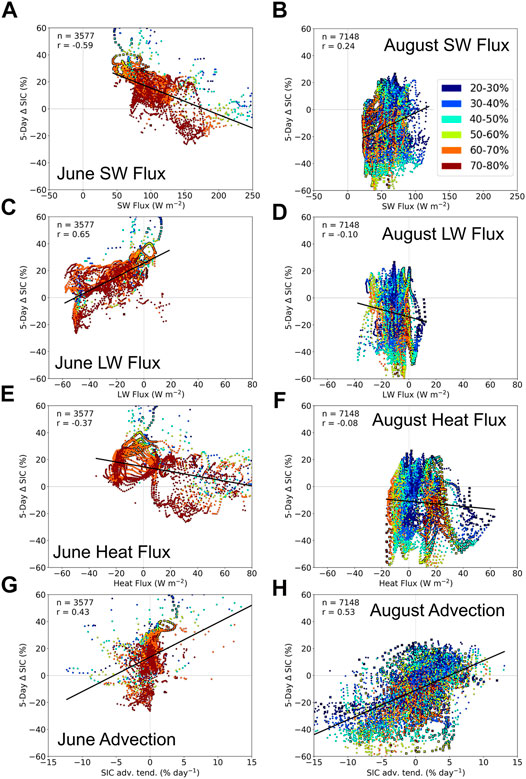
FIGURE 12. Scatter plots of 5-day change in SIC at each grid point and the net SW flux (A,B), the net LW flux (C,D), the surface sensible + latent heat flux (E,F), and the SIC advective tendency (G,H) on 19–20 June 2012 (left column) and on 15–16 August 2016 (right column). Grid points are colored according to the SIC bin. Only grid points with SIC between 20 and 80% are plotted. Grid points that are in the upper decile of total cloud fraction are outlined in black. The black line is the linear fit through the data. The number of grid points (n) and the linear correlation (r) is printed in the upper left corner of each plot. Note the different x-axis ranges in each row. All correlations are significant at the 98% confidence level.
The relationship between the SW flux and changes in SIC varies considerably between the June and August cyclones. For the June cyclone, the relationship between local SIC change and SW flux (Figure 12A) is negative (r = -0.59), indicating that stronger SW flux is associated with enhanced local SIC loss. The sign of the relationship is consistent with climatology (Figure 4A), but the magnitude is much larger. In contrast, the relationship between local SIC change and SW flux for the August cyclone is weakly positive (r = 0.24, Figure 12B). Tables 1 and 2 list the average values of each flux over all the grid points shown in Figure 12 (“All”), grid points with 5-day SIC loss (“Ice Loss”), and grid points in either the lower decile of total cloud fraction (“Clear”) or the upper decile (“Cloudy”). Only a small fraction of the grid points in June experience SIC loss, but among those, the average SW flux is 41% larger than the average SW flux over all grid points in Figure 12A (Table 1). In contrast, the SW flux among the much larger number of grid points that experience SIC loss in August (60 W m−2) is similar to the overall average (63 W m−2), suggesting that the SW flux plays less of a role in local SIC changes in August. The smaller role of the SW flux in modulating sea ice variability in August may relate to a weaker cloud SW radiative forcing during the August cyclone. We estimate the cloud SW radiative forcing by comparing the downward component of the SW flux between the clear and cloudy grid points for each cyclone case. In June, the average downward SW flux is 371 W m−2 for clear grid points and 135 W m−2 for cloudy grid points, so clouds reduce the downward SW flux at the surface by 64%. During the August cyclone, clouds only reduce the downward SW flux by 38% relative to clear skies. Thus, the cloud SW radiative forcing is 26% smaller for the August cyclone than for the June cyclone. Because the average surface albedo is similar for clear and cloudy grid points in June and August, the reduced cloud SW radiative forcing in August means that clouds associated with the August cyclone have a significantly smaller impact on how much SW radiation is absorbed at the surface than clouds associated with the June cyclone.
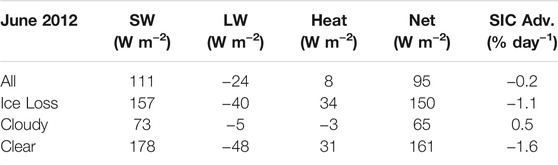
TABLE 1. Average values of each surface energy flux and SIC advective tendency over different sets of grid points shown in Figures 12A,C,E,G during the June 2012 cyclone: All grid points (“All”), only grid points with 5-day SIC loss (“Ice Loss”), grid points in the upper decile of total cloud fraction (“Cloudy”) and grid points in the lower decile of total cloud fraction (“Clear”).
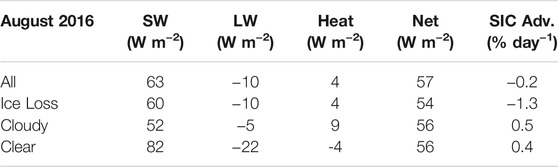
TABLE 2. As in Table 1, but for the grid points shown in Figures 12B,D,F,H during the August 2016 cyclone.
In terms of the LW flux, we find a strong positive relationship between SIC change and LW flux in June (Figure 12C) and a weak negative relationship in August (Figure 12D). The positive relationship in June, in which stronger (or less upward) LW fluxes are associated with less SIC loss, is consistent with the climatology in this region (Figure 4A and Figure 5A) and, as discussed earlier, is likely a result of strong covariances between the LW and SW flux. The average LW flux in clear conditions is more negative than in cloudy conditions by 43 W m−2 in June (Table 1), which on its own would favor less ice loss, but the 105 W m−2 increase in SW flux in clear conditions compared to cloudy conditions more than compensates for the reduced LW flux. In August, the averages of both the SW and LW fluxes over ice loss grid points are similar to the respective averages over all grid points. In addition, the net radiative flux (SW + LW) in cloudy conditions is only about 13 W m−2 larger than in clear conditions in August (Table 2), providing further support for the idea that clouds associated with the June cyclone are much more likely to affect sea ice by changing the surface energy balance than clouds associated with the August cyclone.
Although the surface sensible and latent heat fluxes contribute substantially to the positive surface energy flux anomalies associated with the cyclones (Figures 11A,B), the surface heat flux on its own has only a weak relationship to local SIC loss in both the June and August cyclones (Figures 12E,F). This is because the magnitude of the heat flux is generally much smaller than that of the net radiative flux (Table 1 and Table 2). Nevertheless, the average heat flux for ice loss grid points in June is 26 W m−2 larger than the average over all grid points, indicating a supporting role of stronger heat fluxes in local SIC loss. The average heat flux is larger at clear grid points for the June cyclone (Table 1), and at cloudy grid points for the August cyclone (Table 2). However, the increased heat flux in cloudy conditions during the August cyclone does not appear to be the main cause of local SIC loss within the region of interest, as the average heat flux for ice loss grid points during the August cyclone is the same as the average over all grid points (Table 2).
Figures 12G,H show the relationship between 5-day SIC change and the SIC advective tendency from the 10-m winds. For both the June and August cyclones, the sign of the relationship is positive and significant at the 98% confidence level. In addition, higher concentration sea ice tends to be associated with the weakest advective tendencies, while lower concentration sea ice is associated with stronger advective tendencies. Because the June cyclone primarily impacts higher concentration sea ice, the positive relationship between SIC advection and the local change in SIC is somewhat weaker than that for the August cyclone (r = 0.43 in June vs 0.53 in August). This is consistent with Figure 4, which shows that the magnitude of the correlation between SIC loss and the negative SIC advection is largest for low concentration sea ice in August. Nevertheless, the average advective tendency over ice loss grid points for both of the cyclone cases is more negative than the average over all grid points by about 1% per day (Tables 1 and 2). Unlike the surface energy fluxes, whose contributions to local SIC loss vary considerably between the June and August cyclones, sea ice advection has a consistent relationship to the local changes in SIC for both cyclone cases.
Discussion and Conclusion
This study quantifies the effect of cyclone winds and surface energy forcing on sea ice within the Pacific sector of the Arctic during the melt season months of June, July, and August. We consider the climatology of sea ice change during these months, as well as the statistics of cyclone effects on sea ice for a large sample of cyclone cases and for two individual cyclone cases that impacted sea ice in the East Siberian Sea near the beginning and end of the melt season.
From the statistical analysis of the large set of summer cyclones, we find that cyclone days in June and July have less local SIC loss and less region-wide SIA loss compared to days without cyclones. In contrast, cyclone days in August tend to be followed by slightly more SIC and SIA loss than non-cyclone days, although the relative enhancement of ice loss only persists for about 1 day. Although this analysis is limited to the Pacific sector of the Arctic, these results are broadly consistent with the localized effects of cyclones on sea ice cover throughout the Arctic marginal ice zone (Finocchio et al., 2020; Schreiber and Serreze 2020).
The SW flux has the largest influence of all terms in the surface energy budget on both local and regional ice loss during the summer. In June and July, larger SW fluxes are associated with more short-term ice loss than smaller SW fluxes. Consequently, the largest reductions in local SIC in June tend to occur when skies are clear, indicating that the cloud radiative forcing is a key mechanism by which cyclones affect sea ice on short time scales early in the melt season. Calm and slightly cooler conditions in June also tend to be associated with larger local SIC loss, possibly because such conditions frequently accompany the clear skies that result in stronger SW fluxes at the surface. Later in the melt season, this correspondence between stronger SW fluxes and accelerated ice loss is only apparent for initially higher concentration sea ice. By August, cloudier conditions with more southerly surface winds are associated with slightly more local SIC loss. This suggests that the increased surface heat fluxes and enhanced sea ice advection in the warm sector of August cyclones enable these late-summer cyclones to be statistically associated with slightly enhanced local sea ice loss.
The advective tendency of SIC due to the 10-m wind is one of the most consistent predictors of both local and regional ice loss for the large sample of cyclones in the ECB region. We find the strongest relationship between advection and sea ice loss for low concentration sea ice in August. This supports previous studies arguing that the reduced mechanical strength of lower concentration sea ice makes it more susceptible to wind-induced drift and deformation (Hakkinen et al., 2008; Rampal et al., 2009; Spreen et al., 2011). The magnitude of the SIC advection within the ECB region is primarily controlled by the meridional component of the wind, with southerly winds favoring stronger negative sea ice advection. It is worth noting, however, that wind-driven advection only affects sea ice cover at a particular location, but does not affect the total sea ice volume across the Arctic.
We also analyzed two cyclones that reached a similar maximum intensity and affected a similar area in the East Siberian Sea, but at different times during the melt season. The early season cyclone that occurred in June 2012 primarily affected high concentration sea ice that extended from the central Arctic to the Siberian coast, while the late season cyclone that occurred in August 2016 affected an area of lower concentration sea ice located farther from the coast. In both cyclones, positive anomalies in the net surface energy flux are primarily a result of positive sensible heat flux anomalies, while negative anomalies in the net surface energy flux are due to negative SW flux anomalies. The magnitude and duration of positive anomalies in the net surface energy flux and surface wind speed are comparable between the two cyclones, yet the changes in the underlying sea ice distributions that followed the two cyclone cases are quite different. The August 2016 cyclone was followed by a reduction in sea ice area and a shift toward lower concentration sea ice (Figure 11F). Meanwhile, there was only a temporary shift toward lower SIC and no change in sea ice area (Figure 11E) following the June 2012 cyclone. This temporary shift to lower SIC may be an artifact of melt ponds being misclassified as open ocean (e.g., Meier et al., 2015), and this requires further investigation. Nonetheless, these apparent differences in the sea ice impacts of the two cyclones, despite their similar surface wind and energy forcing anomalies on sea ice, underscore the importance of the initial sea ice state and coupled upper ocean processes for determining the extent to which a cyclone impacts sea ice on short time scales (Lukovich et al., 2021).
A more detailed analysis of the surface energy balance and sea ice advection confirms many of the findings from the large set of cyclones regarding the evolving nature of how each forcing contributes to local sea ice changes during the melt season. For instance, SIC loss has a close relationship to the SW flux at each grid point during the June cyclone, and a relatively weaker relationship to SW flux during the August cyclone. The sign of the relationship between SIC loss and the LW flux is the opposite of that between SIC loss and the SW flux, which is not surprising given the strong anti-correlation between SW and LW fluxes. The different magnitudes of each radiative flux in June versus August ultimately determine which flux is most influential in the net. In June, the SW fluxes are so strong and the modulation of SW fluxes by clouds so large that variability in the SW flux is the most influential term in the surface energy budget in terms of local sea ice loss. Specifically, the decreased SW flux at the surface due to clouds reflecting sunlight far outweighs the increased LW flux at the surface due to clouds in June, such that clouds in June appear to behave more like an umbrella than a blanket (Perovich 2018). By August however, clouds behave like neither an umbrella nor a blanket in the net because the amount by which clouds decrease the SW flux at the surface, on average, is comparable to the amount by which they increase LW flux at the surface. As a result, the difference between clear and cloudy conditions is more likely to determine how much local SIC loss occurs during the June cyclone than during the August cyclone.
Although we generally find that larger surface heat fluxes are associated with enhanced ice loss in both the large sample of cyclones and for the two cyclone cases, this relationship is weaker than what was expected based on previous studies. Zhang et al. (2013) and Stern et al. (2020), for example, found that the anomalous sensible heat flux was the primary cause of the enhanced surface ice melt that occurred during the Great Arctic Cyclone of August 2012. The August 2016 cyclone analyzed in this study is comparable in many ways to the Great Arctic Cyclone, except that it was located further north and, perhaps as a result, was not associated with as much warm air advection from the Eurasian continent over sea ice. Based on our analysis in this study, the surface heat flux during the August 2016 cyclone was too small to explain the enhanced local SIC loss that followed. Instead, the SIC advection due to the surface wind forcing has a stronger statistical relationship to the local SIC loss following the August 2016 cyclone. This difference from the Great Arctic Cyclone in August 2012 highlights how the cyclone location relative to both land and the sea ice edge, and the underlying characteristics of the sea ice critically determine how a given cyclone will affect sea ice. Whether processes such as upper-ocean mixing, which was found to be a key cause of ice loss during the Great Arctic Cyclone, also contribute to the sea ice loss following the August 2016 cyclone requires further investigation. Fully coupled simulations of a diverse sample of Arctic summer cyclones spanning multiple decades would provide a richer understanding of the many ways in which cyclones affect sea ice, and could offer important clues as to how decadal variability and the rapidly evolving Arctic environment affect cyclone impacts on sea ice.
Data Availability Statement
The ERA-5 datasets analyzed for this study can be found on the Copernicus Climate Change Service Climate Data Store (https://cds.climate.copernicus.eu/).
Author Contributions
PF performed the analysis and wrote the manuscript. JD helped conceive the idea for this manuscript and contributed substantially to the analysis and interpretation of the results.
Funding
This research was supported by the Office of Naval Research Arctic Cyclones Departmental Research Initiative (Program Element 0601153N).
Conflict of Interest
The authors declare that the research was conducted in the absence of any commercial or financial relationships that could be construed as a potential conflict of interest.
Publisher’s Note
All claims expressed in this article are solely those of the authors and do not necessarily represent those of their affiliated organizations, or those of the publisher, the editors and the reviewers. Any product that may be evaluated in this article, or claim that may be made by its manufacturer, is not guaranteed or endorsed by the publisher.
Acknowledgments
We would like to thank the reviewers for their helpful feedback on an earlier version of this manuscript, Dave Ryglicki and Matt Fearon for preparing the ERA-5 data, and Michael Sprenger at ETH-Zurich for generating the cyclone tracks from the ERA-5 data.
References
Crawford, A. D., and Serreze, M. C. (2016). Does the Summer Arctic Frontal Zone Influence Arctic Ocean Cyclone Activity? J. Clim. 29 (13), 4977–4993. doi:10.1175/JCLI-D-15-0755.1
Eastman, R., and Warren, S. G. (2010). Interannual Variations of Arctic Cloud Types in Relation to Sea Ice. J. Clim. 23 (15), 4216–4232. doi:10.1175/2010JCLI3492.1
Eastwood, S., Lavergne, T., and Tonboe, R. (2014). Algorithm Theoretical Basis Document for the OSI SAF Global Reprocessed Sea Ice Concentration Product OSI-409. The EUMETSAT Network of Satellite Appl. Fac.
Fearon, M. G., Doyle, J. D., Ryglicki, D. R., Finocchio, P. M., and Sprenger, M. (2021). The Role of Cyclones in Moisture Transport Into the Arctic. Geophys. Res. Lett. 48, e2020GL090353. doi:10.1029/2020gl090353
Finocchio, P. M., Doyle, J. D., Stern, D. P., and Fearon, M. G. (2020). Short‐Term Impacts of Arctic Summer Cyclones on Sea Ice Extent in the Marginal Ice Zone. Geophys. Res. Lett. 47, e2020GL088338. doi:10.1029/2020gl088338
Graham, R. M., Cohen, L., Ritzhaupt, N., Segger, B., Graversen, R. G., Rinke, A., et al. (2019). Evaluation of Six Atmospheric Reanalyses Over Arctic Sea Ice From Winter to Early Summer. J. Clim. 32 (14), 4121–4143. doi:10.1175/JCLI-D-18-0643.1
Hakkinen, S., Proshutinsky, A., and Ashik, I. (2008). Sea Ice Drift in the Arctic Since the 1950s. Geophys. Res. Lett. 35 (19), 1–5. doi:10.1029/2008GL034791
Hersbach, H., Bell, B., Berrisford, P., Hirahara, S., Horányi, A., Muñoz‐Sabater, J., et al. (2020). The ERA5 Global Reanalysis. Q.J.R. Meteorol. Soc. 146 (730), 1999–2049. doi:10.1002/qj.3803
Hirahara, S., Balmaseda, M. A., Boisseson, E. De., and Hersbach, H. (2016). Sea Surface Temperature and Sea Ice Concentration for ERA5. ERA Report Series. Available at: http://old.ecmwf.int/publications/.
Itkin, P., Spreen, G., Cheng, B., Doble, M., Girard-Ardhuin, F., Haapala, J., et al. (2017). Thin Ice and Storms: Sea Ice Deformation From Buoy Arrays Deployed During N-Ice2015. J. Geophys. Res. Oceans. 122 (6), 4661–4674. doi:10.1002/2016JC012403
Kay, J. E., and L'Ecuyer, T. (2013). Observational Constraints on Arctic Ocean Clouds and Radiative Fluxes During the Early 21st Century. J. Geophys. Res. Atmos. 118 (13), 7219–7236. doi:10.1002/jgrd.50489
Koyama, T., Stroeve, J., Cassano, J., and Crawford, A. (2017). Sea Ice Loss and Arctic Cyclone Activity From 1979 to 2014. J. Clim. 30 (12), 4735–4754. doi:10.1175/JCLI-D-16-0542.1
Kriegsmann, A., and Brümmer, B. (2014). Cyclone Impact on Sea Ice in the Central Arctic Ocean: A Statistical Study. The Cryosphere. 8 (1), 303–317. doi:10.5194/tc-8-303-2014
Landrum, L., and Holland, M. M. (2020). Extremes Become Routine in an Emerging New Arctic. Nat. Clim. Chang. 10, 1108–1115. doi:10.1038/s41558-020-0892-z
Lindsay, R., and Schweiger, A. (2015). Arctic Sea Ice Thickness Loss Determined Using Subsurface, Aircraft, and Satellite Observations. The Cryosphere. 9 (1), 269–283. doi:10.5194/tc-9-269-2015
Lukovich, J. V., Stroeve, J., Crawford, A., Hamilton, L., Tsamados, M., Heorton, H., et al. (2021). Summer Extreme Cyclone Impacts on Arctic Sea Ice. J. Clim. 34 (12), 1–54. doi:10.1175/jcli-d-19-0925.1
Maslanik, J. A., and Barry, R. G. (1989). Short-Term Interactions Between Atmospheric Synoptic Conditions and Sea-Ice Behaviour in the Arctic. A. Glaciology. 12 (January), 113–117. doi:10.3189/s0260305500007059
Maslanik, J., Stroeve, J., Fowler, C., and Emery, W. (2011). Distribution and Trends in Arctic Sea Ice Age Through Spring 2011. Geophys. Res. Lett. 38 (13), a–n. doi:10.1029/2011GL047735
Meier, W. N., Fetterer, F., Stewart, J. S., and Helfrich, S. (2015). How Do Sea-Ice Concentrations From Operational Data Compare With Passive Microwave Estimates? Implications for Improved Model Evaluations and Forecasting. Ann. Glaciol. 56 (69), 332–340. doi:10.3189/2015aog69a694
Overland, J. E., and Wang, M. (2013). When Will the Summer Arctic Be Nearly Sea Ice Free? Geophys. Res. Lett. 40 (10), 2097–2101. doi:10.1002/grl.50316
Perovich, D. K. (2018). Sunlight, Clouds, Sea Ice, Albedo, and the Radiative Budget: The Umbrella versus the Blanket. The Cryosphere. 12 (6), 2159–2165. doi:10.5194/tc-12-2159-2018
Persson, P. O. G. (2012). Onset and End of the Summer Melt Season over Sea Ice: Thermal Structure and Surface Energy Perspective From SHEBA. Clim. Dyn. 39 (6), 1349–1371. doi:10.1007/s00382-011-1196-9
Rae, J. G. L., Todd, A. D., Blockley, E. W., and Ridley, J. K. (2017). How Much Should We Believe Correlations Between Arctic Cyclones and Sea Ice Extent? The Cryosphere. 11, 3023–3034. doi:10.5194/tc-11-3023-2017
Rampal, P., Weiss, J., and Marsan, D. (2009). Positive Trend in the Mean Speed and Deformation Rate of Arctic Sea Ice, 1979-2007. J. Geophys. Res. 114 (5), 1–14. doi:10.1029/2008JC005066
Schreiber, E. A. P., and Serreze, M. C. (2020). Impacts of Synoptic-Scale Cyclones on Arctic Sea-Ice Concentration: a Systematic Analysis. Ann. Glaciology. 61 (82), 1–15. doi:10.1017/aog.2020.23
Screen, J. A., Simmonds, I., and Keay, K. (2011). Dramatic Interannual Changes of Perennial Arctic Sea Ice Linked to Abnormal Summer Storm Activity. J. Geophys. Res. 116 (15), 1–10. doi:10.1029/2011JD015847
Semenov, A., Zhang, X., Rinke, A., Dorn, W., and Dethloff, K. (2019). Arctic Intense Summer Storms and Their Impacts on Sea Ice-A Regional Climate Modeling Study. Atmosphere. 10 (4), 218. doi:10.3390/atmos10040218
Shupe, M. D., and Intrieri, J. M. (2004). Cloud Radiative Forcing of the Arctic Surface: The Influence of Cloud Properties, Surface Albedo, and Solar Zenith Angle. J. Clim. 17 (3), 616–628. doi:10.1175/1520-0442(2004)017<0616:CRFOTA>2.0.CO;2
Spreen, G., Kwok, R., and Menemenlis, D. (2011). Trends in Arctic Sea Ice Drift and Role of Wind Forcing: 1992-2009. Geophys. Res. Lett. 38 (19), a–n. doi:10.1029/2011GL048970
Sprenger, M., Fragkoulidis, G., Binder, H., Croci-Maspoli, M., Graf, P., Grams, C. M., et al. (2017). Global Climatologies of Eulerian and Lagrangian Flow Features Based on ERA-Interim. Bull. Am. Meteorol. Soc. 98 (8), 1739–1748. doi:10.1175/BAMS-D-15-00299.1
Steele, M., Zhang, J., and Ermold, W. (2010). Mechanisms of Summertime Upper Arctic Ocean Warming and the Effect on Sea Ice Melt. J. Geophys. Res. 115 (11), 1–12. doi:10.1029/2009JC005849
Stern, D. P., Doyle, J. D., Barton, N. P., Finocchio, P. M., Komaromi, W. A., and Metzger, E. J. (2020). The Impact of an Intense Cyclone on Short‐Term Sea Ice Loss in a Fully Coupled Atmosphere‐Ocean‐Ice Model. Geophys. Res. Lett. 47, 1–10. doi:10.1029/2019gl085580
Stroeve, J. C., Serreze, M. C., Holland, M. M., Kay, J. E., Malanik, J., and Barrett, A. P. (2012). The Arctic's Rapidly Shrinking Sea Ice Cover: a Research Synthesis. Climatic Change. 110 (3–4), 1005–1027. doi:10.1007/s10584-011-0101-1
Strong, C., Foster, D., Cherkaev, E., Eisenman, I., and Golden, K. M. (2017). On the Definition of Marginal Ice Zone Width. J. Atmos. Oceanic Technology. 34 (7), 1565–1584. doi:10.1175/JTECH-D-16-0171.1
Thorndike, A. S., and Colony, R. (1982). Sea Ice Motion in Response to Geostrophic Winds. J. Geophys. Res. 87 (C8), 5845. doi:10.1029/jc087ic08p05845
Vihma, T., Tisler, P., and Uotila, P. (2012). Atmospheric Forcing on the Drift of Arctic Sea Ice in 1989-2009. Geophys. Res. Lett. 39 (2), a–n. doi:10.1029/2011GL050118
Wernli, H., and Schwierz, C. (2006). Surface Cyclones in the ERA-40 Dataset (1958-2001). Part I: Novel Identification Method and Global Climatology. J. Atmos. Sci. 63, 2486. doi:10.1175/jas3766.1
Keywords: sea ice, marginal ice zone, melt season, arctic, cyclone
Citation: Finocchio PM and Doyle JD (2021) Summer Cyclones and Their Association With Short-Term Sea Ice Variability in the Pacific Sector of the Arctic. Front. Earth Sci. 9:738497. doi: 10.3389/feart.2021.738497
Received: 08 July 2021; Accepted: 02 September 2021;
Published: 20 September 2021.
Edited by:
Ivy Tan, McGill University, CanadaReviewed by:
Tomoko Koyama, Japan Aerospace Exploration Agency (JAXA), JapanYouichi Kamae, University of Tsukuba, Japan
Copyright © 2021 Finocchio and Doyle. This is an open-access article distributed under the terms of the Creative Commons Attribution License (CC BY). The use, distribution or reproduction in other forums is permitted, provided the original author(s) and the copyright owner(s) are credited and that the original publication in this journal is cited, in accordance with accepted academic practice. No use, distribution or reproduction is permitted which does not comply with these terms.
*Correspondence: Peter M. Finocchio, cGV0ZXIuZmlub2NjaGlvQG5ybG1yeS5uYXZ5Lm1pbA==