 Akihiko Terada
 Muga Yaguchi
 Takeshi Ohba
- 1Volcanic Fluid Research Center, School of Science, Tokyo Institute of Technology, Meguro, Japan
- 2Meteorological Research Institute, Japan Meteorological Agency, Tsukuba, Japan
- 3Department of Chemistry, School of Science, Tokai University, Hiratsuka, Japan
Regular sampling of lake water has been performed at many volcanoes to assess the state of volcanic activity. However, it is not clear whether the absolute concentrations or, instead, rate of changes in concentrations are more suitable for such assessments. In this study, we show that temporal changes in concentrations of an element in lake water are described by a simple differential equation, assuming changes in lake volume and chemical processes are negligible. The time constants (63% response time for changes in the chemical concentration in lake water) have a wide range varying between 20 and 1,000 days for the studied volcanoes in Japan, meaning it takes a long time to assess volcanic activity based on the absolute concentration of an element. In order to assess the volcanic activity in a shorter time period, based on a time-series of lake element concentration data, we developed a numerical model to calculate temporal changes in the steady-state concentration, which is proportional to the elemental concentrations of the bulk hydrothermal fluid injected from subaqueous fumaroles and hot springs. We applied our method to Yugama crater lake at Kusatsu–Shirane volcano, Japan, and quantitatively evaluated temporal changes in the hydrothermal input from 1964 to 2020. As a result, we detected changes in the Cl concentrations of the bulk hydrothermal input that were associated with unrest including the phreatic eruption in 1976 and earthquake swarms in 1989–1992 and 2014–2020. The future concentration in the lake water can be predicted from the most recent steady-state concentrations. Comparing the predicted concentration curve with the concentration obtained from lake water samples, it is possible to quickly assess whether the concentration of the bulk hydrothermal input has increased/decreased or remained constant.
1 Introduction
Volcanic lakes can cause a variety of hazards, such as phreatic eruptions, mud eruptions, tsunamis, base surges, and lahars (Morrissey et al., 2010; Manville, 2015; Edwards et al., 2017). These can be hazards near the volcanic lake, and also near rivers that drain the lake. Therefore, assessing activity of a volcanic lake is a critical issue for society. In addition, volcanic lakes can act as condensers of heat and materials released from hydrothermal systems. To understand material circulation in hydrothermal systems, measurements of lake water levels, temperatures, and concentrations of elements have been undertaken at crater lakes worldwide (e.g., Pasternack and Varekamp, 1997).
Prior to an eruption, increases/decreases in lake volume have occurred (Barberi et al., 1992; Werner et al., 2008; Fournier et al., 2009, 2011; Christenson et al., 2017), which have been interpreted to reflect changes in the mass flux and enthalpy of fluid emitted from the lake bottom (Terada and Hashimoto, 2017). Monitoring the surface water temperature of volcanic lakes, which is a simple remote measurement by infrared thermometry, is a key observation for monitoring volcanic activity (Oppenheimer, 1997; Lewicki et al., 2016; Cigolini et al., 2018; Candela-Becerra et al., 2020). In addition, regular sampling of lake water has been performed at many volcanoes, including Ruapehu (Giggenbach and Glover, 1975; Hurst et al., 1991; Christenson, 2000), Kusatsu–Shirane (Ohba et al., 1994, 2008), Poás (Rowe et al., 1992; Martínez et al., 2000; Rouwet et al., 2017), Kawah Ijen (van Hinsberg et al., 2017), Copahue (Agusto et al., 2017), and crater lakes in Mexico (Armienta et al., 2000; Rouwet et al., 2008; Peiffer and Taran, 2013; Peiffer et al., 2015).
Yugama crater lake of Kusatsu–Shirane volcano has repeatedly experienced gradual increases/decreases in concentrations of chemical components, although water temperatures and levels have not changed significantly (Ohba et al., 2008). Such changes in concentrations are accompanied by earthquake swarms, ground deformation, and thermal demagnetization beneath the crater lake (Takahashi and Fujii, 2014), corresponding to a volcano with slow unrest (Stix, 2018).
Although phreatic eruptions have occurred repeatedly at Yugama crater lake since the 1880s, the lake is a popular tourist attraction. In the assessment of volcanic activity at Kusatsu–Shirane volcano, the Japan Meteorological Agency (JMA) considers changes in concentrations of elements to be a key parameter, in addition to geophysical observations. However, it is unclear whether the absolute concentrations or rate of changes in concentrations are more suitable for such assessments. Concentrations of lake water are adjusted according to the mass balance of the lake system (Pasternack and Varekamp, 1997; Rouwet and Tassi, 2011). Furthermore, the absolute lake concentration depends on the history of the lake concentration because the current concentration is a result of integrating the past inputs and outputs of the element. The rate of changes in concentrations can occur slowly in large-volume crater lakes (Varekamp, 2002, 2015; Rouwet et al., 2014), and thus it takes a long time to assess changes in volcanic activity based on absolute concentrations. To assess changes in volcanic activity, monitoring changes in the concentration of the hydrothermal fluid injected from the lake bottom is more suitable rather than tracking element concentrations in lake water.
In this study, we developed a simple numerical model to calculate temporal changes in concentrations of the bulk hydrothermal fluid injected from the lake bottom, by assuming the water volume remains largely constant during each analytical period. If pH of lake water is not extremely low (pH > 0), this model can be applied to elements such as chloride (Cl) for which chemical reactions and evaporation from the lake surface are negligible (Rouwet and Ohba 2015; Capaccioni et al., 2017). In addition, we propose a method for predicting future lake concentrations based on a time-series of recent concentrations of water samples taken from crater lakes. Our model is applied to active crater lakes in Japan, particularly Yugama crater lake at Kusatsu–Shirane volcano, in order to test the validity of our assessment of volcanic activity.
2 Modeling
Volcanic lakes, particularly active hot crater lakes, exhibit variable chemical characteristics from lake to lake (e.g., Rouwet et al., 2014). Such lakes with diameters greater than several tens of meters in Japan are Yugama crater lake at Kusatsu–Shirane volcano (Kusakabe et al., 2000; Ohba et al., 2008), Yudamari cater lake at Aso volcano (Terada et al., 2012), Oyunuma crater lake at Noboribetsu volcano (Murozumi et al., 1966; Fukutomi et al., 1968; Inoue and Aoki, 2000), and Okama crater lake at Zao volcano (Anzai, 1961; Miura et al., 2012) (Figure 1). In such crater lakes, the annual water level is largely maintained throughout periods of volcanic quiescence, although there are seasonal fluctuations due to meteorological factors. Our model does not take into account chemical reactions.
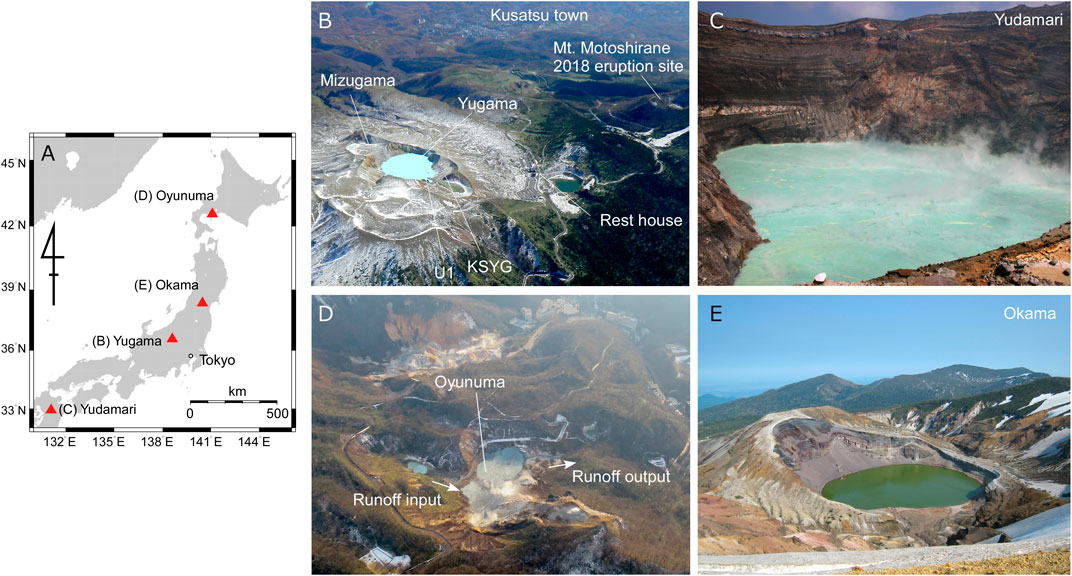
FIGURE 1. (A) Location map of active crater lakes in Japan. Photographs of (B) Yugama crater lake at Kusatsu–Shirane volcano taken on November 6, 2017, (C) Yudamari crater lake at Aso volcano taken by Shin Yoshikawa on July 27, 2007, (D) Oyunuma crater lake at Noboribetsu volcano taken by Hiroshi Aoyama on December 7, 2020 with the cooperation of the Hokkaido Regional Development Bureau, and (E) Okama crater lake at Zao volcano taken by Mare Yamamoto on May 29, 2017.
2.1 General Mass Balance of a Chemical Component of Interest
We assumed that fumaroles and hot-water fountains exist on the bottom of the crater lakes. All mass injected from the lake bottom is absorbed by the lake water. For simplicity, it was assumed that the lake water is well mixed, and thus the element concentration in the lake water is homogeneous. We considered a closed lake without surface runoff outlets and inlets, which is the case for Yugama, Yudamari, and Okama crater lakes (Figures 1A–C). Oyunuma crater lake (Figure 1D) is affected by surface runoff inlets and outlets, and is discussed further in Notes on the Analysis.
The lake water is supplied by fluid injected from the hydrothermal system beneath the lake bottom (
where
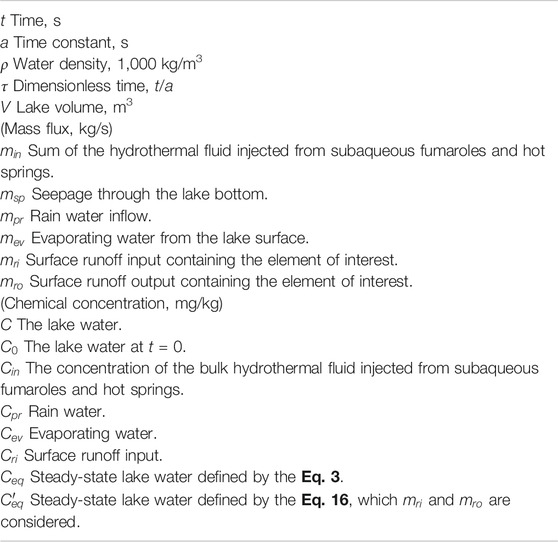
TABLE 1. Definitions of abbreviations.
2.2 Steady-State Condition
We assumed that evaporation loss of elements from the lake surface is negligible. This assumption can be applied to elements such as Cl (Simonson and Palmer, 1993) as long as pH of lake water is not extremely low to evaporate HCl (Rouwet and Ohba 2015; Capaccioni et al., 2017). Assuming conservative elements such as Cl or Mg as the chemical tracers in our model,
If
2.3 Non-steady State Conditions
In a lake system where a fluid with a constant concentration of an element enters at a constant rate and the lake water leaves at a constant rate, the temporal change in the concentration can be represented by a response of a first-order system (Albarède, 1995; Varekamp, 2002, 2015). In this section, we represent the time constant of the system, assuming the water volume is constant.
If the temporal change in water volume is negligible, Eq. 3 can be rewritten with
A nearly constant water volume suggests that temporal changes in
where
The time constant
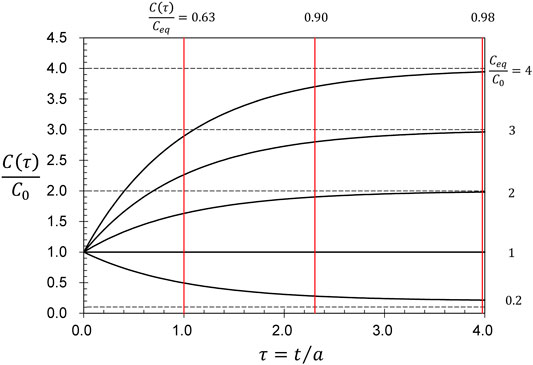
FIGURE 2. The dimensionless concentration
2.4 Estimations of the Time Constant
The seepage flux
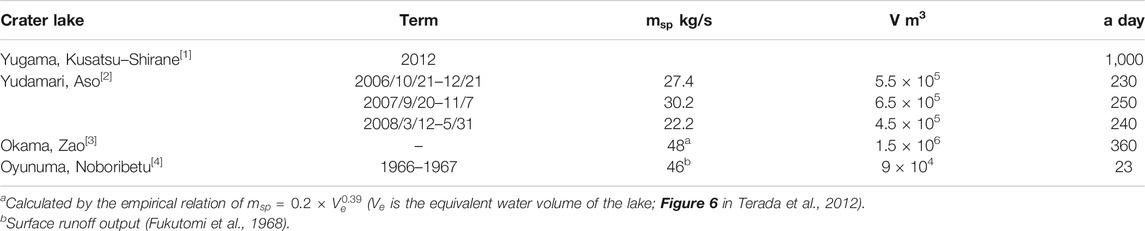
TABLE 2. Summary of the seepage flux
In the case of Yudamari crater lake (Figure 1C),
For Okama crater lake (Figure 1D), the
3 Evaluation of Changes in the Steady State Concentration
In this section, we calculate temporal changes in
3.1 Estimation of the Temporal Changes in the Steady-State Concentration
We define
Here we define
Combining Eqs 7, 8, the lake concentration
This equation corresponds to the form of a recursive filter (Smith, 1997; Robert et al., 2014). The time-series of
The concentration of the lake water can fluctuate due to meteorological factors and analytical uncertainties. To reduce the effects of such fluctuations, we used
where
Summing Eqs 9, 12,
Assuming
3.2 Computational Test of
Figure 3 shows the time-series computational test for the
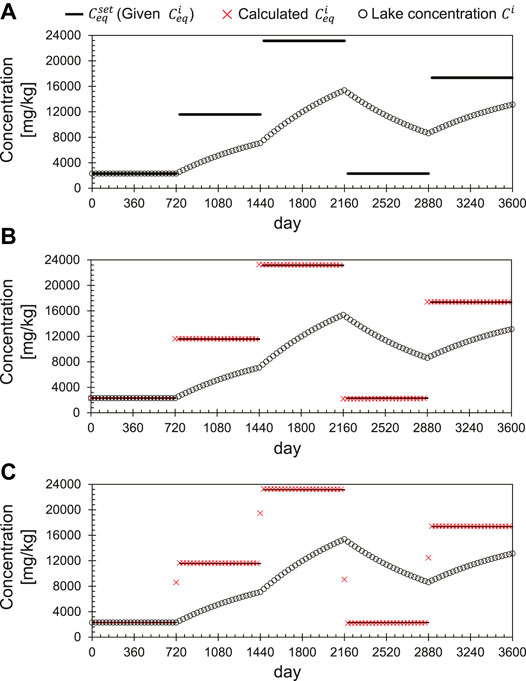
FIGURE 3. Time-series computational test of the
4 Analysis of Yugama Crater Lake at Kusatsu–Shirane Volcano
In this section we apply the model introduced in Evaluation of Changes in the Steady State Concentration to Kusatsu-Shirane volcano, as a representative case for which long-term time series of lake element concentration data have been obtained. Kusatsu–Shirane volcano has a hot crater lake, called Yugama, with a pH ∼ 1.0. Phreatic eruptions have occurred repeatedly at the volcano, including from the Mizugama Crater in 1976 (Ossaka et al., 1980) (Figure 1B) and from the Yugama Crater in 1982–1983 (Ohba et al., 2008) and 1989 (Ida et al., 1989). In 2018, a phreatic eruption occurred at the Motoshirane pyroclastic cone group, which is located 1.2 km south of Yugama crater lake (Kametani et al., 2021; Terada et al., 2021; Yamada et al., 2021). In 1989–1993 and 2014–2020, earthquake swarms were observed around Yugama crater lake. In this section, we analyze temporal changes in Cl concentrations. We assumed a time constant
4.1 Chloride Concentrations of Yugama Crater Lake
The earliest Cl concentration data are from 1949 (Minami et al., 1952). After 1967, regular sampling of the lake water has been carried out at site U1 located on its southern shore (Figure 1B) (Ohba et al., 2008). We used the data of Ossaka et al. (1997) from 1967/7/4–1985/7/26 and Ohba et al. (2008) from 1985/10/22–2005/10/3. Lake waters sampled by us from 2005/11/4 to 2005/11/4 were analyzed by ion chromatography at the Meteorological Research Institute, JMA (Yaguchi et al., 2021).
Figure 4A shows the temporal changes in Cl concentrations. Sampling prior to 1984 was undertaken once a year in summer and, since April 1985, monthly sampling has been carried out except in winter. Snow cover hinders fieldwork during winter, but from 1990 to the early 2000s, helicopters allowed sampling at site U1. Apart from the period prior to 1984 and 2010–2014, the mean sampling interval was 44 days. We labeled the periods (a)‒(d), based on the trend of temporal changes in Cl concentrations. Figure 4B shows the monthly numbers of earthquakes around Yugama crater lake. Earthquake swarms in periods (b) and (d) were accompanied by an increase in Cl concentrations (arrows in Figure 4A). During a series of phreatic eruptions in 1982–1983 (Figure 4A) earthquake swarms occurred, but Cl concentrations remained unchanged (Ohba et al., 2008). The annual precipitation (Figure 4C) observed at Kusatsu town, which is located 6 km east of the Yugama Crater, is almost constant at ∼1,700 mm and does not affect the temporal changes in Cl concentrations over the long term.
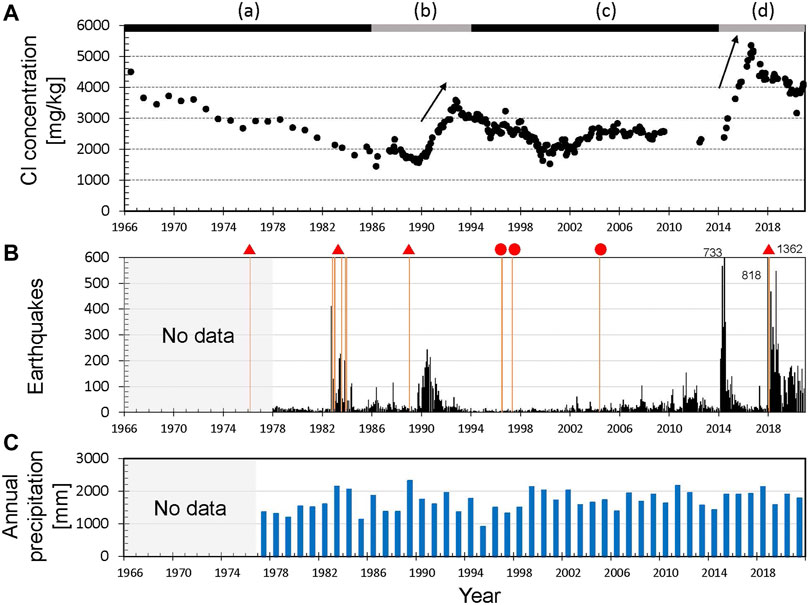
FIGURE 4. (A) Cl concentrations of Yugama crater lake. (a–d) represent the periods defined in estimations of
4.2 Estimations of
A moving average of ±60 days at intervals of 60 days was applied to smooth the raw data (Figure 4A), because Cl concentrations can fluctuate due to atmospheric conditions, such as heavy rain, snow melt, and drought, leading to changes in lake water volume. The moving average also reduces uncertainties related to the analyses and potential concentration heterogeneities around the sampling site.
Computational results for
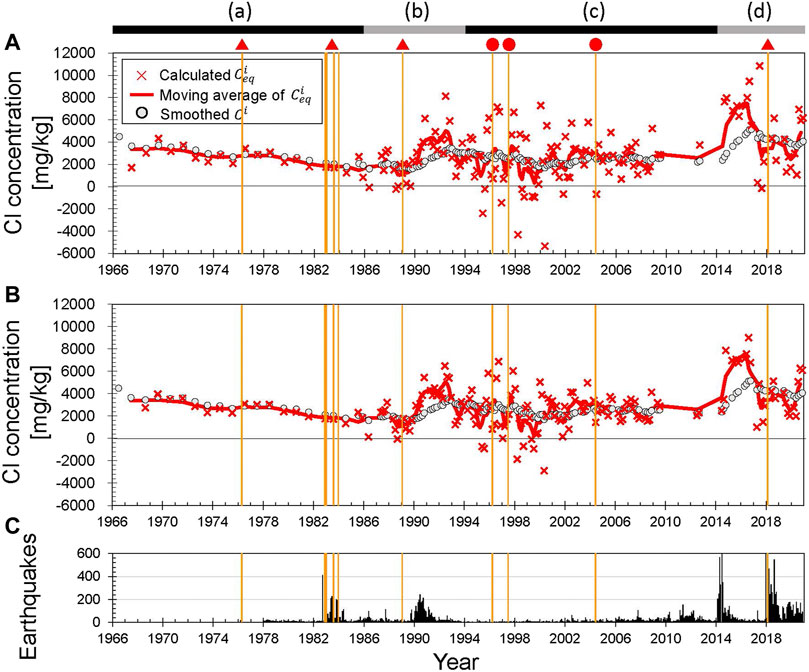
FIGURE 5. Computational results for
4.2.1 Period (a), 1966–1986
Prior to the eruptions in 1982–1983, calculated
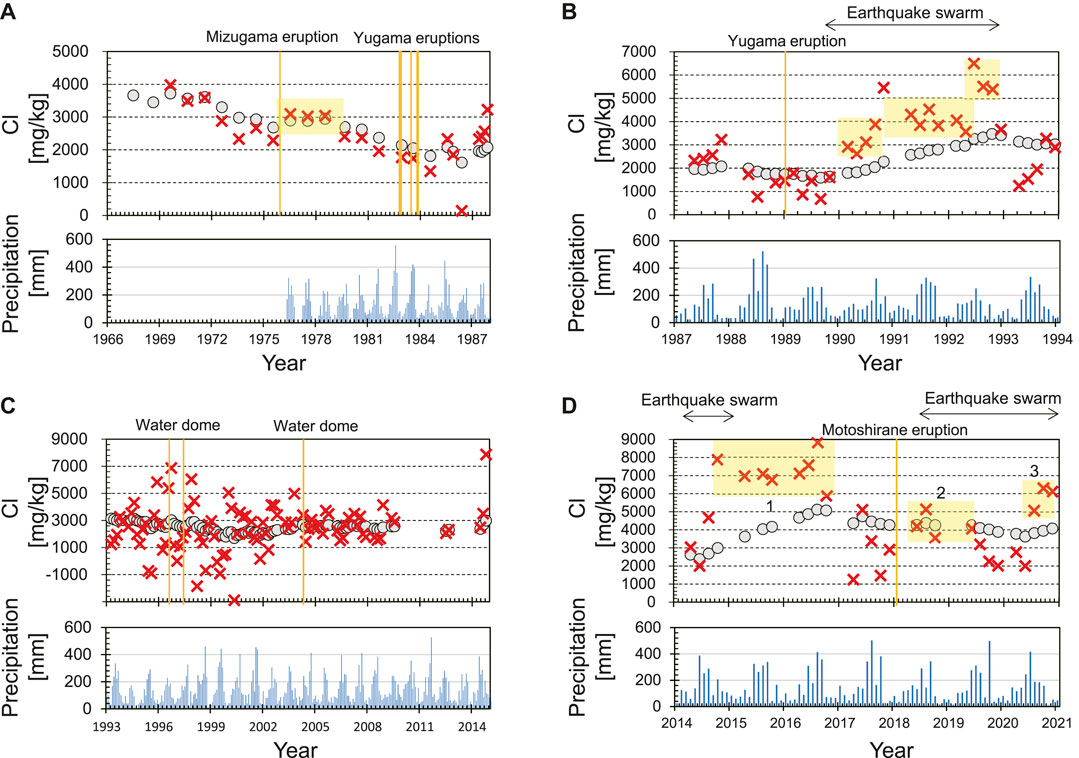
FIGURE 6. Smoothed
However, calculated
During the series of eruptions in 1982–1983, Cl concentrations of the lake water showed no eruption-related changes, resulting in no eruption-related changes in
Our calculation results show that the concentration of the bulk hydrothermal input gradually decreased over the long term, except for 1976–1978 after the Mizugama eruption. The lowest value of
4.2.2 Period (b), 1987–1993
This period includes unrest in terms of an earthquake swarm and increase in Cl concentrations from 1989 to 1992. After the temporary increase in
After the earthquake swarm from 1989 to 1992, the annual mean water temperature increased by 5°C (Ohba et al., 2008), suggesting that evaporative loss from the lake surface increased. The water level did not decrease at this time, which means that the mass flux of the hydrothermal fluid injected from the subaqueous fumaroles and hot springs (
Our calculations reveal that the small eruption in 1989 occurred when
4.2.3 Period (c), 1994–2013
Chloride concentrations decreased slowly, albeit with large fluctuations, from 1993 to 2000, and increased slowly in the early 2000s (Figure 6C). This period is characterized by significant short-term fluctuations in calculated
Such significant short-term fluctuations in
It is difficult to identify the reason for the significant short-term fluctuations in
4.2.4 Period (d), 2014–2020
This period corresponds to a phase of unrest and unusual volcanic activity. A marked increase in Cl concentrations from 2014 to 2016 (Figure 6D) was followed by a slight decrease in Cl concentrations from 2017 to 2020 while calculated
During the first event in 2014–2016, calculated
Since 2017, Cl concentrations of Yugama crater lake have decreased slowly, but fluctuated. In 2017, calculated
In 2018, during the second event, calculated
During this period, we have detected changes in
5 Discussion
In order to assess changes in volcanic activity, based on a time-series of concentrations of an element in lake water, such as Cl, we developed a numerical model to calculate temporal changes in
5.1 Estimation of the Concentration of the Bulk Hydrothermal Input
For some volcanic lakes,
For Yugama crater lake of Kusatsu-Shirane volcano,
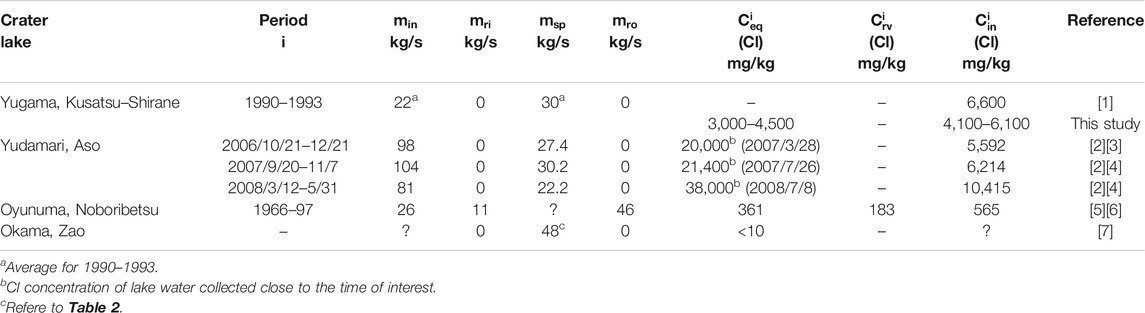
TABLE 3. Summary of the Cl concentrations of the bulk hydrothermal fluid injected from subaqueous fumaroles and hot springs
At Yudamari crater lake of Aso volcano, regular water samplings have not been performed due to steep topography, but a few water samples have revealed that the Cl concentrations of Yudamari crater lake during quiescent period were 20,000–38,000 mg/ kg (Miyabuchi and Terada, 2009; Shinohara et al., 2015). During this period,
5.2 Effects of Surface Runoff Input and Output
If the surface runoff output and input contain the element of interest, the mass balance in Eq. 2 is modified as follows:
where
where
Oyunuma crater lake at Noboribetsu volcano has both surface runoff inputs and outputs relevant to the element of interest (Murozumi et al., 1966; Fukutomi et al., 1968; Inoue and Aoki, 2000) (Figure 1D). The seepage through the lake bottom is unconstrained, and thus we assumed the surface runoff output is dominant compared with the seepage through the lake bottom (
In this case,
5.3 Notes on the Analysis
Our model is based on a simple mass balance model represented in Eq. 2. This model has been applied to other volcanoes including El Chichón in Mexico (Taran and Rouwet, 2008) and Maly Semyachik in Kamchatka (Taran et al., 2021). This model can be applied to non-reactive elements (e.g. Cl and Mg) in various volcanic lakes if the evaporation losses of the elements from the lake surface are negligible. However, in the case of extremely low pH crater lakes (less than ∼0) (Rouwet and Ohba 2015; Capaccioni et al., 2017) such as Poás during eruption period (Martínez et al., 2000), Kawah Ijen (van Hinsberg et al., 2017), White Island (Christenson et al., 2017) and Yudamari crater lake at Aso volcano (Shinohara et al., 2015), the application of this model requires the evaluation of evaporation loss of HCl.
One of the factors that create uncertainty in
Our model yields a time-series for
An element concentration in lake water can fluctuate due to meteorological factors and local heterogeneity around the water sampling site. In such a situation, a low-path filter including the moving average is effective in smoothing out the short-term fluctuations. When a moving average of ±60 days at intervals of 60 days was applied to the time-series of Cl concentrations in Yugama crater lake, temporal changes in
The time constant (
This equation is obtained by taking the logarithm of Eq. 5. Although the time range for fitting Eq. 17 to the data is somewhat arbitrary, time constant
5.4 Prediction and Monitoring of Lake Water
Provided
In this section, we predict temporal changes in Cl concentration of Yugama crater lake at Kusatsu-Shirane volcano, as a representative case for which a long-term time series has been obtained. We believe that the crystallizing magma, surrounded with a self-sealing zone (Fournier, 1999), is underlain in a shallow depth beneath Yugama crater lake (Ohba et al., 2008; Tseng et al., 2020; Yaguchi et al., 2021). When the overpressure of the crystallizing magma causes fractures in the self-sealing zone, the supply of magma fluid such as HCl from within the self-sealing zone is expected to increase. Therefore, measurements of temporal changes in Cl concentration are essential to monitor the volcanic activity of Kusatsu-Shirane volcano.
Figure 7A shows the predicted Cl concentrations of Yugama crater lake after June 2014, as a representative period when the concentration increased steadily. Here, the initial concentration
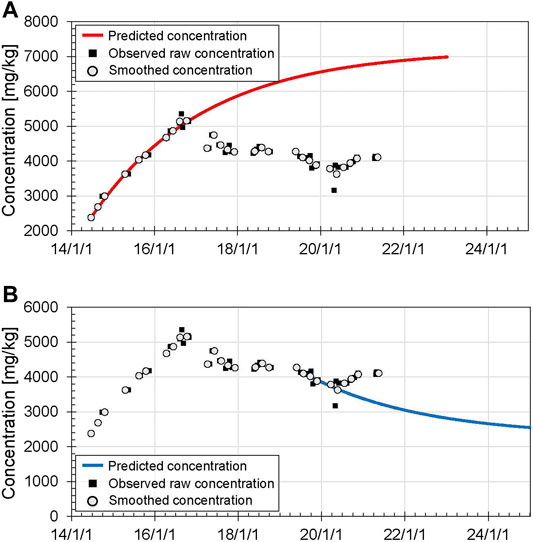
FIGURE 7. Predicted Cl concentrations of Yugama crater lake calculated with Eq. 5, assuming
The predicted Cl concentration increases with time because
Figure 7B shows the predicted Cl concentrations after September 2019, as a representative period when the concentration decreased steadily. Here, the initial concentration
The curve predicts that chloride concentrations of the lake water will decrease from 4,020 mg/ kg in September 2019 to 2,470 mg/ kg in January 2026 as the 90% response, or 2,335 mg/ kg in May 2030 as the 98% response. Thus, it takes a long time if absolute concentrations are to be used as the basis for assessing the end of unrest. However, by the end of 2019, our model indicates the decreases in the Cl concentrations of the bulk hydrothermal input using the three recent concentration data. Furthermore, the predicted curve also clearly reveals an increase Cl concentration in the bulk hydrothermal input (
6 Conclusions
Temporal changes in the concentrations in the lake can take a long time to be evident (e.g., >1,000 days). In order to assess volcanic activity based on a time-series of concentrations of an element in crater lake waters, we developed a numerical model to calculate temporal changes in the steady-state concentration
Data Availability Statement
Chemical concentration data for Yugama crater lake were published in Ossaka et al. (1997), Ohba et al. (2008), and Yaguchi et al. (2021).
Author Contributions
AT constructed the numerical model, analyzed the time-series of the lake data, and drafted the manuscript. MY and TO analyzed the water chemistry and helped interpret the data. All authors read and approved the final manuscript.
Funding
This research was supported by the Ministry of Education, Culture, Sports, Science, and Technology (MEXT) of Japan through its Second Earthquake and Volcano Hazards Observation and Research Program (Earthquake and Volcano Hazard Reduction Research) and Integrated Program for Next Generation Volcano Research and Human Resource Development.
Conflict of Interest
The authors declare that the research was conducted in the absence of any commercial or financial relationships that could be construed as a potential conflict of interest.
Publisher’s Note
All claims expressed in this article are solely those of the authors and do not necessarily represent those of their affiliated organizations, or those of the publisher, the editors and the reviewers. Any product that may be evaluated in this article, or claim that may be made by its manufacturer, is not guaranteed or endorsed by the publisher.
Acknowledgments
Officials of Kusatsu town and the Ministry of Agriculture, Forestry, and Fisheries provided approval for our research observations. We also thank Jun’ichi Hirabayashi and the staff at the Volcanic Fluid Research Center, School of Science, Tokyo Institute of Technology, for their valuable comments. Hiroshi Aoyama, Mare Yamamoto, and Shin Yoshikawa kindly allowed us to use their photographs. The Japan Meteorological Agency provided the number of earthquakes at Kusatsu–Shirane volcano. We used Generic Mapping Tools (Wessel and Smith, 1998) to generate the maps. We thank Dmitri Rouwet and the reviewers for their constructive revision.
References
Agusto, M. R., Caselli, A., Daga, R., Varekamp, J., Trinelli, A., Dos Santos Afonso, M., et al. (2016). The Crater Lake of Copahue Volcano (Argentina): Geochemical and Thermal Changes between 1995 and 2015. Geol. Soc. Lond. Spec. Publications 437, 107–130. doi:10.1144/SP437.16
Albarède, F. (1995). Introduction to Geochemical Modeling. Cambridge: Cambridge University Press. doi:10.1017/CBO9780511622960
Anzai, T. (1961). The Mysterious Crater Lake Okama, Zao Volcano. Yamagata, Japan: Yamagata Geological Institute, 224 p.
Armienta, M. A., De la Cruz-Reyna, S., and Macías, J. L. (2000). Chemical Characteristics of the Crater Lakes of Popocatetetl, El Chichon, and Nevado de Toluca Volcanoes, Mexico. J. Volcanol. Geotherm. Res. 97, 105–125. doi:10.1016/S0377-0273(99)00157-2
Barberi, F., Bertagnini, A., Landi, P., and Principe, C. (1992). A Review on Phreatic Eruptions and Their Precursors. J. Volcanol. Geotherm. Res. 52, 231–246. doi:10.1016/0377-0273(92)90046-G
Candela-Becerra, L. J., Toyos, G., Suárez-Herrera, C. A., Castro-Godoy, S., and Agusto, M. (2020). Thermal Evolution of the Crater Lake of Copahue Volcano with ASTER during the Last Quiescence Period between 2000 and 2012 Eruptions. J. Volcanol. Geotherm. Res. 392, 106752. doi:10.1016/j.jvolgeores.2019.106752
Capaccioni, B., Rouwet, D., and Tassi, F. (2017). HCl Degassing from Extremely Acidic Crater Lakes: Preliminary Results from Experimental Determinations and Implications for Geochemical Monitoring. Geol. Soc. Lond. Spec. Publications 437, 97–106. doi:10.1144/SP437.12
Christenson, B. W. (2000). Geochemistry of Fluids Associated with the 1995-1996 Eruption of Mt. Ruapehu, New Zealand: Signatures and Processes in the Magmatic-Hydrothermal System. J. Volcanol. Geotherm. Res. 97, 1–30. doi:10.1016/S0377-0273(99)00167-5
Christenson, B. W., White, S., Britten, K., and Scott, B. J. (2017). Hydrological Evolution and Chemical Structure of a Hyper-Acidic spring-Lake System on Whakaari/White Island, NZ. J. Volcanol. Geotherm. Res. 346, 180–211. doi:10.1016/j.jvolgeores.2017.06.017
Cigolini, C., Coppola, D., Yokoo, A., and Laiolo, M. (2018). The Thermal Signature of Aso Volcano during Unrest Episodes Detected from Space and Ground-Based Measurements. Earth Planets Space 70, 67. doi:10.1186/s40623-018-0831-7
Edwards, M. J., Kennedy, B. M., Jolly, A. D., Scheu, B., and Jousset, P. (2017). Evolution of a Small Hydrothermal Eruption Episode through a Mud Pool of Varying Depth and Rheology, White Island, NZ. Bull. Volcanol. 79, 16. doi:10.1007/s00445-017-1100-5
Fournier, N., Moreau, M., and Robertson, R. (2011). Disappearance of a Crater Lake: Implications for Potential Explosivity at Soufrière Volcano, St Vincent, Lesser Antilles. Bull. Volcanol. 73, 543–555. doi:10.1007/s00445-010-0422-3
Fournier, N., Witham, F., Moreau-Fournier, M., and Bardou, L. (2009). Boiling Lake of Dominica, West Indies: High-Temperature Volcanic Crater Lake Dynamics. J. Geophys. Res. 114, B02203. doi:10.1029/2008jb005773
Fournier, R. O. (1999). Hydrothermal Processes Related to Movement of Fluid from Plastic into Brittle Rock in the Magmatic-Epithermal Environment. Econ. Geol. 94, 1193–1211. doi:10.2113/gsecongeo.94.8.1193
Fukutomi, T., Nakao, K., Miyoshi, H., and Tanoue, R. (1968). Studies of Water Balance and Heat Budget at Ōyunuma Hot Lake in Noboribetsu, Hokkaido. Geophys. Bull. Hokkaido Univ. 19, 1–19. doi:10.14943/gbhu.19.1
Giggenbach, W. F., and Glover, R. B. (1975). The Use of Chemical Indicators in the Surveillance of Volcanic Activity Affecting the Crater Lake on Mt Ruapehu, New Zealand. Bull. Volcanol. 39, 70–81. doi:10.1007/BF02596947
Hirayama, Y., Okawa, A., Nakamachi, K., Aoyama, T., Okada, Y., Oi, T., et al. (2020). Estimation of Water Seepage Rate in the Active Crater Lake System of Kusatsu-Shirane Volcano, Japan, Using FDNPP-Derived Radioactive Cesium as a Hydrological Tracer. J. Environ. Radioactivity 218, 106257. doi:10.1016/j.jenvrad.2020.106257
Hurst, A. W., Bibby, H. M., Scott, B. J., and McGuinness, M. J. (1991). The Heat Source of Ruapehu Crater Lake; Deductions from the Energy and Mass Balances. J. Volcanol. Geotherm. Res. 46, 1–20. doi:10.1016/0377-0273(91)90072-8
Ida, Y., Osada, N., Sawada, M., Koyama, E., and Kagiyama, T. (1989). Seismological Study Based on Recently Installed Permanent Stations and a Small Eruptive Event on January 6, 1989 at Kusatsu-Shirane Volcano. Bull. Earth. Res. Ins. 64, 325–345. (in Japanese with English abstract). doi:10.15083/0000032805
Inoue, A., and Aoki, M. (2000). Mineralogy of Ohyunuma Explosion Crater Lake, Hokkaido, Japan Part 1: Geochemistry, Hydrology, and Bulk Mineralogy. Clay Sci. 11, 147–168. doi:10.11362/jcssjclayscience1960.11.147
Kametani, N., Ishizaki, Y., Yoshimoto, M., Maeno, F., Terada, A., Furukawa, R., et al. (2021). Total Mass Estimate of the January 23, 2018 Phreatic Eruption of the Kusatsu-Shirane Volcano, Central Japan. Earth Planets Space 73, 141. doi:10.1186/s40623-021-01468-3
Kato, T. (1960). Some Limnological Remarks on the Crater Lake, “Okama”. Jpn. J. Limnol. 21, 141–150. doi:10.3739/rikusui.21.141
Kusakabe, M., Komoda, Y., Takano, B., and Abiko, T. (2000). Sulfur Isotopic Effects in the Disproportionation Reaction of Sulfur Dioxide in Hydrothermal Fluids: Implications for the δ34S Variations of Dissolved Bisulfate and Elemental Sulfur from Active Crater Lakes. J. Volcanol. Geotherm. Res. 97, 287–307. doi:10.1016/S0377-0273(99)00161-4
Lewicki, J. L., Caudron, C., van Hinsberg, V. J., and Hilley, G. E. (2016). High Spatio-Temporal Resolution Observations of Crater Lake Temperatures at Kawah Ijen Volcano, East Java, Indonesia. Bull. Volcanol. 78, 53. doi:10.1007/s00445-016-1049-9
Manville, V. (2015). “Volcano-Hydrologic Hazards from Volcanic Lakes,” in Volcanic Lakes. Advances in Volcanology. Editors D. Rouwet, B. Christenson, F. Tassi, and J. Vandemeulebrouck (Berlin, Heidelberg: Springer), 21–71. doi:10.1007/978-3-642-36833-2_2
Martínez, M., Fernández, E., Valdés, J., Barboza, V., Van der Laat, R., Duarte, E., et al. (2000). Chemical Evolution and Volcanic Activity of the Active Crater Lake of Poás Volcano, Costa Rica, 1993–1997. J. Volcanol. Geotherm. Res. 97, 127–141. doi:10.1016/S0377-0273(99)00165-1
Minami, E., Yamagata, N., Shima, M., and Saijô, Y. (1952). Crater Lake "Yugama" of Volcano Kusatsu-Shirane. I. Jpn. J. Limnol. 16, 1–5. (in Japanese). doi:10.3739/rikusui.16.1
Miura, K., Ban, M., Ohba, T., and Fujinawa, A. (2012). Sequence of the 1895 Eruption of the Zao Volcano, Tohoku Japan. J. Volcanol. Geotherm. Res. 247-248, 139–157. doi:10.1016/j.jvolgeores.2012.08.005
Miyabuchi, Y., and Terada, A. (2009). Subaqueous Geothermal Activity Revealed by Lacustrine Sediments of the Acidic Nakadake Crater Lake, Aso Volcano, Japan. J. Volcanol. Geotherm. Res. 187, 140–145. doi:10.1016/j.jvolgeores.2009.08.001
Morrissey, M., Gisler, G., Weaver, R., and Gittings, M. (2010). Numerical Model of Crater Lake Eruptions. Bull. Volcanol. 72, 1169–1178. doi:10.1007/s00445-010-0392-5
Munekane, H. (2021). Modeling Long-Term Volcanic Deformations at the Kusatsu-Shirane and Asama Volcanoes, Japan Using the GNSS Coordinate Time Series. Earth Planets Space 73, 192. doi:10.1186/s40623-021-01512-2
Murozumi, M., Abiko, T., and Nakamura, S. (1966). Geochemical Investigation of the Noboribetsu Oyunuma Explosion Crater Lake. J. Volcanol. Soc. Jpn. 11, 1–16. doi:10.18940/kazanc.11.1_1
Ohba, T., Hirabayashi, J., and Nogami, K. (2008). Temporal Changes in the Chemistry of Lake Water within Yugama Crater, Kusatsu-Shirane Volcano, Japan: Implications for the Evolution of the Magmatic Hydrothermal System. J. Volcanol. Geotherm. Res. 178, 131–144. doi:10.1016/j.jvolgeores.2008.06.015
Ohba, T., Hirabayashi, J., and Nogami, K. (1994). Water, Heat and Chloride Budgets of the Crater Lake, Yugama at Kusatsu-Shirane Volcano, Japan. Geochem. J. 28, 217–231. doi:10.2343/geochemj.28.217
Ohba, T., Yaguchi, M., Nishino, K., Numanami, N., Tsunogai, U., Ito, M., et al. (2019). Time Variation in the Chemical and Isotopic Composition of Fumarolic Gasses at Kusatsu-Shirane Volcano, Japan. Front. Earth Sci. 7, 249. doi:10.3389/feart.2019.00249
Oppenheimer, C. (1997). Ramifications of the Skin Effect for Crater Lake Heat Budget Analysis. J. Volcanol. Geotherm. Res. 75, 159–165. doi:10.1016/S0377-0273(96)00037-6
Ossaka, J., Ossaka, T., Oi, T., Kikawada, K., Yamano, M., Hukuhara, H., et al. (1997). Volcanic Activity of Kusatsu-Shirane Volcano, Gunma, and Secular Change in Water Quality of Crater Lake, Yugama. Chikyukagaku 31, 119–128. (in Japanese).
Ossaka, J., Ozawa, T., Nomara, T., Ossaka, T., Hirabayashi, J., Takaesu, A., et al. (1980). Variation of Chemical Compositions in Volcanic Gases and Water at Kusatsu-Shirane Volcano and its Activity in 1976. Bull. Volcanol. 43, 207–216. doi:10.1007/BF02597622
Pasternack, G. B., and Varekamp, J. C. (1997). Volcanic Lake Systematics I. Physical Constraints. Bull. Volcanol. 58, 528–538. doi:10.1007/s004450050160
Peiffer, L., Rouwet, D., and Taran, Y. (2015). “Fluid Geochemistry of El Chichón Volcano-Hydrothermal System,” in Active Volcanoes of Chiapas (Mexico): El Chichón and Tacaná. Active Volcanoes of the World. Editors T. Scolamacchia, and J. Macías (Berlin, Heidelberg: Springer), 77–95. doi:10.1007/978-3-642-25890-9_4
Peiffer, L., and Taran, Y. (2013). Heat and Mass Fluxes Monitoring of El Chichon Crater Lake. Rev. Mex. Cienc. Geol. 30, 500–511.
Roberts, T. J., Saffell, J. R., Oppenheimer, C., and Lurton, T. (2014). Electrochemical Sensors Applied to Pollution Monitoring: Measurement Error and Gas Ratio Bias - A Volcano Plume Case Study. J. Volcanol. Geotherm. Res. 281, 85–96. doi:10.1016/j.jvolgeores.2014.02.023
Rouwet, D. (2011). A Photographic Method for Detailing the Morphology of the Floor of a Dynamic Crater Lake: the El Chichón Case (Chiapas, Mexico). Limnology 12, 225–233. doi:10.1007/s10201-011-0343-7
Rouwet, D., Mora-Amador, R., Ramírez-Umaña, C. J., González, G., and Inguaggiato, S. (2017). Dynamic Fluid Recycling at Laguna Caliente (Poás, Costa Rica) before and during the 2006-ongoing Phreatic Eruption Cycle (2005-10). Geol. Soc. Lond. Spec. Publications 437, 73–96. doi:10.1144/SP437.11
Rouwet, D., and Ohba, T. (2015). “Isotope Fractionation and HCl Partitioning during Evaporative Degassing from Active Crater Lakes,” in Volcanic Lakes. Advances in Volcanology. Editors D. Rouwet, B. Christenson, F. Tassi, and J. Vandemeulebrouck (Berlin, Heidelberg: Springer), 179–200. doi:10.1007/978-3-642-36833-2_7
Rouwet, D., Taran, Y., Inguaggiato, S., Varley, N., and Santiago Santiago, J. A. (2008). Hydrochemical Dynamics of the “Lake-spring” System in the Crater of El Chichón Volcano (Chiapas, Mexico). J. Volcanol. Geotherm. Res. 178, 237–248. doi:10.1016/j.jvolgeores.2008.06.026
Rouwet, D., and Tassi, F. (2011). Geochemical Monitoring of Volcanic Lakes. A Generalized Box Model for Active Crater Lakes. Annal. Geophys. 54. doi:10.4401/ag-50310.4401/ag-5035
Rouwet, D., Tassi, F., Mora-Amador Sandri, R. L., Sandri, L., and Chiarini, V. (2014). Past, Present and Future of Volcanic Lake Monitoring. J. Volcanol. Geotherm. Res. 272, 78–97. doi:10.1016/j.jvolgeores.2013.12.009
Rowe, G. L., Brantley, S. L., Fernandez, M., Fernandez, J. F., Borgia, A., and Barquero, J. (1992). Fluid-volcano Interaction in an Active Stratovolcano: the Crater Lake System of Poás Volcano, Costa Rica. J. Volcanol. Geotherm. Res. 49, 23–51. doi:10.1016/0377-0273(92)90003-V
Shinohara, H., Yoshikawa, S., and Miyabuchi, Y. (2015). “Degassing Activity of a Volcanic Crater Lake: Volcanic Plume Measurements at the Yudamari Crater Lake, Aso Volcano, Japan,” in Volcanic Lakes. Advances in Volcanology. Editors D. Rouwet, B. Christenson, F. Tassi, and J. Vandemeulebrouck (Berlin, Heidelberg: Springer), 201–217. doi:10.1007/978-3-642-36833-2_8
Simonson, J. M., and Palmer, D. A. (1993). Liquid-vapor Partitioning of HCl(aq) to 350°C. Geochimica et Cosmochimica Acta 57, 1–7. doi:10.1016/0016-7037(93)90462-6
Smith, S. W. (1997). The Scientist and Engineer's Guide to Digital Signal Processing. San Diego, California, USA: California Technical Publishing, 626. Chapter 19.
Stix, J. (2018). Understanding Fast and Slow Unrest at Volcanoes and Implications for Eruption Forecasting. Front. Earth Sci. 6, 56. doi:10.3389/feart.2018.00056
Takahashi, K., and Fujii, I. (2014). Long-term Thermal Activity Revealed by Magnetic Measurements at Kusatsu-Shirane Volcano, Japan. J. Volcanol. Geotherm. Res. 285, 180–194. doi:10.1016/j.jvolgeores.2014.08.014
Taran, Y., Kalacheva, E., Dvigalo, V., Melnikov, D., and Voloshina, E. (2021). Evolution of the Crater Lake of Maly Semyachik Volcano, Kamchatka (1965-2020). J. Volcanol. Geotherm. Res. 418, 107351. doi:10.1016/j.jvolgeores.2021.107351
Taran, Y., and Rouwet, D. (2008). Estimating Thermal Inflow to El Chichón Crater Lake Using the Energy-Budget, Chemical and Isotope Balance Approaches. J. Volcanol. Geotherm. Res. 175, 472–481. doi:10.1016/j.jvolgeores.2008.02.019
Terada, A., Hashimoto, T., and Kagiyama, T. (2012). A Water Flow Model of the Active Crater Lake at Aso Volcano, Japan: Fluctuations of Magmatic Gas and Groundwater Fluxes from the Underlying Hydrothermal System. Bull. Volcanol. 74, 641–655. doi:10.1007/s00445-011-0550-4
Terada, A., Hashimoto, T., Kagiyama, T., and Sasaki, H. (2008). Precise Remote-Monitoring Technique of Water Volume and Temperature of a Crater Lake in Aso Volcano, Japan: Implications for a Sensitive Window of a Volcanic Hydrothermal System. Earth Planet. Space 60, 705–710. doi:10.1186/BF03353134
Terada, A., and Hashimoto, T. (2017). Variety and Sustainability of Volcanic Lakes: Response to Subaqueous Thermal Activity Predicted by a Numerical Model. J. Geophys. Res. Solid Earth 122, 6108–6130. doi:10.1002/2017JB014387
Terada, A., Kanda, W., Ogawa, Y., Yamada, T., Yamamoto, M., Ohkura, T., et al. (2021). The 2018 Phreatic Eruption at Mt. Motoshirane of Kusatsu–Shirane Volcano, Japan: Eruption and Intrusion of Hydrothermal Fluid Observed by a Borehole Tiltmeter Network. Earth Planets Space 73, 157. doi:10.1186/s40623-021-01475-4
Tseng, K. H., Ogawa, Y., Nurhasan, , , Tank, S. B., Ujihara, N., Honkura, Y., et al. (2020). Anatomy of Active Volcanic Edifice at the Kusatsu-Shirane Volcano, Japan, by Magnetotellurics: Hydrothermal Implications for Volcanic Unrests. Earth Planets Space 72, 161. doi:10.1186/s40623-020-01283-2
van Hinsberg, V., Vigouroux, N., Palmer, S., Berlo, K., Mauri, G., Williams-Jones, A., et al. (2017). Element Flux to the Environment of the Passively Degassing Crater Lake-hosting Kawah Ijen Volcano, Indonesia, and Implications for Estimates of the Global Volcanic Flux. Geol. Soc. Lond. Spec. Publications 437, 9–34. doi:10.1144/SP437.2
Varekamp, J. C. (2002). Lake Contamination Models for Evolution towards Steady State. J. Limnol. 62, 67–72. doi:10.4081/jlimnol.2003.s1.67
Varekamp, J. C. (2015). “The Chemical Composition and Evolution of Volcanic Lakes,” in Volcanic Lakes. Advances in Volcanology. Editors D. Rouwet, B. Christenson, F. Tassi, and J. Vandemeulebrouck (Berlin, Heidelberg: Springer), 93–123. doi:10.1007/978-3-642-36833-2_4
Werner, C., Hurst, T., Scott, B., Sherburn, S., Christenson, B. W., Britten, K., et al. (2008). Variability of Passive Gas Emissions, Seismicity, and Deformation during Crater Lake Growth at White Island Volcano, New Zealand, 2002-2006. J. Geophys. Res. 113, B01204. doi:10.1029/2007JB005094
Wessel, P., and Smith, W. H. F. (1998). New, Improved Version of Generic Mapping Tools Released. EOS Trans. AGU 79, 579. doi:10.1029/98EO00426
Yaguchi, M., Ohba, T., and Terada, A. (2021). Groundwater Interacting at Depth with Hot Plastic Magma Triggers Phreatic Eruptions at Yugama Crater Lake of Kusatsu-Shirane Volcano (Japan). Front. Earth Sci. 9, 741742. doi:10.3389/feart.2021.741742
Keywords: active crater lake, volcanic lake, chloride, volcanic unrest, monitoring, Kusatsu-Shirane Volcano, Aso volcano
Citation: Terada A, Yaguchi M and Ohba T (2022) Quantitative Assessment of Temporal Changes in Subaqueous Hydrothermal Activity in Active Crater Lakes During Unrest Based on a Time-Series of Lake Water Chemistry. Front. Earth Sci. 9:740671. doi: 10.3389/feart.2021.740671
Received: 13 July 2021; Accepted: 18 November 2021;
Published: 07 January 2022.
Edited by:
Dmitri Rouwet, Istituto Nazionale di Geofisica e Vulcanologia, ItalyReviewed by:
Jacob B. Lowenstern, Cascades Volcano Observatory, United StatesBen Matthew Kennedy, University of Canterbury, New Zealand
Copyright © 2022 Terada, Yaguchi and Ohba. This is an open-access article distributed under the terms of the Creative Commons Attribution License (CC BY). The use, distribution or reproduction in other forums is permitted, provided the original author(s) and the copyright owner(s) are credited and that the original publication in this journal is cited, in accordance with accepted academic practice. No use, distribution or reproduction is permitted which does not comply with these terms.
*Correspondence: Akihiko Terada, dGVyYWRhQGtzdm8udGl0ZWNoLmFjLmpw