 Ayush Goyal
 Shu-Huei Hung
- Department of Geosciences, National Taiwan University, Taipei, Taiwan
Multiple tectonic events since the Neoproterozoic era have framed the present-day lithosphere in the Fujian province affiliated with the eastern part of the South China Block. Comprehensive information of the crustal structure and bulk properties can aid to understand the geological features and tectonic processes of still much debate in this region. An attempt is made in this study to explore crustal thickness and internal velocities across Fujian using the teleseismic receiver functions (RFs). The H-V stacking of joint P and S RFs improves to simultaneously estimate crustal thickness, average Vp and Vs, and derived Vp/Vs ratio and bulk sound speed in three backazimuth sectors for each of 17 stations. Furthermore, a Neighborhood Algorithm nonlinear inversion of P RFs is employed to determine the layered structures of Vs and Vp/Vs beneath all the stations. Results indicate the crustal thickness varies from at most ∼35 km in northwest Fujian to 30–35 km in the inland mountains and 27–30 km in the southeastern coasts. The inferred Moho geometry is nonplanar or inclined across the Zhenghe-Dapu (ZD) and Changle-Zhaoan (CZ) fault zones, especially in the southern ZD fault area. The average Vp/Vs suggests that the crust is predominantly felsic in the Wuyi-Yunkai orogen and intermediate-to-mafic in the Cretaceous magmatic and metamorphic zones. A high-velocity upper crust along the coastline is revealed, which attributes to the Pingtan-Dongshan metamorphic belt. At the sites near the ZD fault zone, the intracrustal negative discontinuity occurs at a shallower depth of ∼15 km marking an abrupt Vs decrease into the low-velocity mid-to-lower crustal layer, probably linked to the closed paleo-rift basin remnants. The lower crust across the Fujian is generally characterized by relatively lower Vs and higher Vp/Vs (1.80–1.84) consistent with those of the mafic-ultramafic rocks, which do not support the proposed extensive magmatic underplating in the Late Mesozoic.
Introduction
The Fujian province on the southeastern coast of China resides on the Cathaysia Block, the southeast part of the South China Craton formed by collision with the Yangtze Block in the northwest during the Neoproterozoic era (Figure 1A). Since the Paleozoic era, it had undergone several active tectonic events, such as the intracontinental orogenesis and collapse, westward subduction of the paleo-Pacific plate, lithospheric thinning, and extensive magmatism (Hsü et al., 1990; Li, 2000; Wang et al., 2013; Lin et al., 2021). The tectonic environment had thus changed from intraplate compressional to extensional stress regime in the Mesozoic (Li and Li, 2007) and then been under extension again in the Cenozoic (Qiu et al., 2018). These tectonic events had led to the formation of numerous uplifted and depressed blocks separated by the NE-SW and NW-SE oriented faults or sutures (Wang et al., 1993; Figure 1A), among which the major ones are the NNE-NE trending Shaowu-Heyuan (SH), Zhenghe-Dapu (ZD), Changle-Zhaoan (CZ) fault zones, and offshore Fujian littoral (FL) fault. The Wuyi-Yunkai orogenic belt located in the western Fujian is bounded by the SH and ZD suture zones while its eastern neighboring terrane is the Cretaceous magmatic downfaulted zone sided by the ZD and CZ fault zones (see Figure 1B). To the east of the CZ fault zone lies the Mesozoic Pingtan-Dongshan metamorphic belt (PDMB) along the coastline (Chen et al., 2002), which is delimited by the active FL fault in the western Taiwan Strait (Xu et al., 2010; Zhang et al., 2020a). The FL fault marks the western boundary of the strongly rifted Cenozoic basins in the Eurasian continental margin that has been flexed down by the load of the Taiwan orogen to the east (Lin et al., 2003; Zhan et al., 2004).
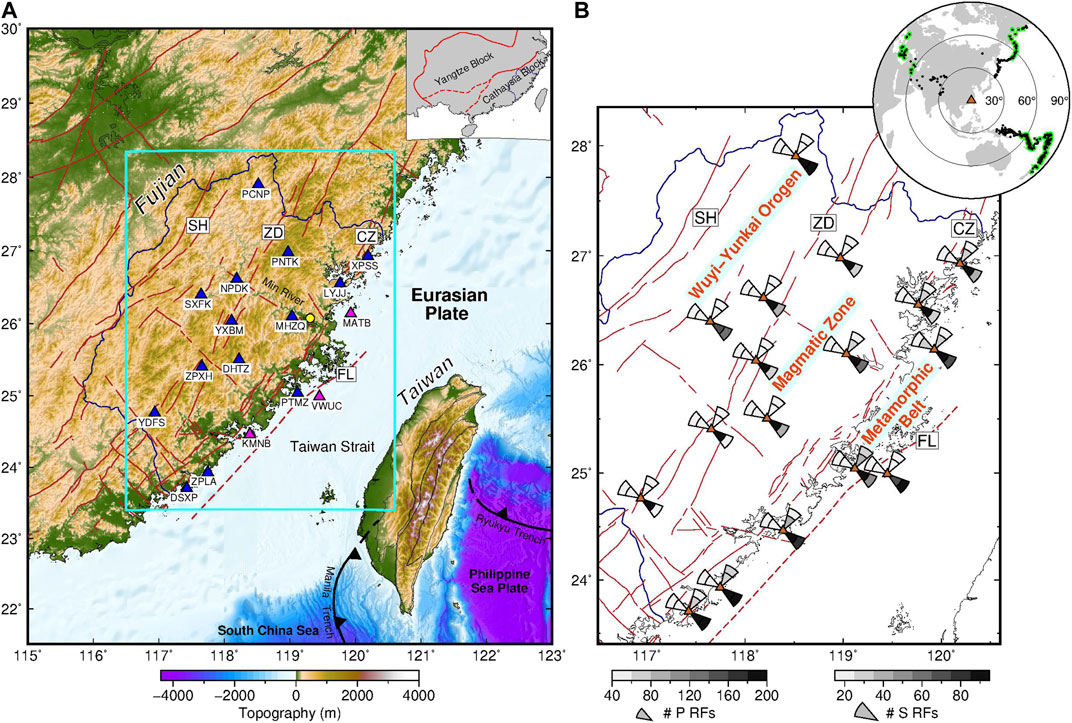
FIGURE 1. (A) Topographic map of SE China showing the locality of the Fujian province in the northeast Cathaysia Block and the distribution of stations used in the study. The upper right inset map displays the Yangtze and Cathaysia Blocks amalgamated to form the South China Craton. The 14 FEA and three BATS stations, located within our study region bounded by the cyan box, are denoted by blue and magenta triangles, respectively. Red lines delineate the faults mapped in the land (solid) and offshore areas (dashed) (Ding et al., 1999), while black lines draw the border of the Fujian province. A solid yellow dot near the Min River marks the location of Fuzhou basin. The NE-SW trending suture zones in the Fujian region are abbreviated: SH, Shaowu-Heyuan fault zone; ZD, Zhenghe-Dapu fault zone; CZ, Changle-Zhaoan fault zone; FL, the Fujian littoral fault. (B) The numbers of P and S RFs from individual backazimuth sectors (NW, NE, and SE) used for H-V stacking. Gray-colored sectors with smaller and larger radii indicate the respective numbers of P and S RFs in the three backazimuth ranges. The upper right inset map shows the epicentral distance and azimuthal distribution of teleseismic events providing usable P (solid black circle) and S (green open circle) RFs.
The aforementioned geological blocks are characterized by the widespread Triassic to Cretaceous igneous rocks resulting from extensive magmatism (Zhou et al., 2006; Guo et al., 2012). The outcrop of the western Fujian mainly consists of Triassic and Jurassic granitic rocks while that of the eastern Fujian is comprised of Cretaceous granitic and volcanic rocks. The geological and geophysical studies have put forward several possible subsurface features that may prevail in the present-day lithosphere beneath Fujian, for example, replenished thin lithosphere (Ye et al., 2014; Zhang et al., 2020b), upper mantle lateral heterogeneity (Huang et al., 2010; Cai et al., 2015), deep crustal melting and mantle-derived magmatic underplating (Zhou and Li, 2000; Huang et al., 2011), intracrustal low-velocity zone (Cai et al., 2015; Zhang et al., 2018), lithosphere delamination with foundering of lower crust (Wang et al., 2013; Lin et al., 2021), crustal thinning and modification (Dong et al., 2020). However, more promising in-depth evidence for the nature and properties of these features is a prerequisite and worth being explored for better understanding of the geological evolution of the crust and upper mantle of Fujian and the earthquake-prone fault mechanisms. The receiver function based investigations for the Fujian region are mostly centered on the overall regional variation of crustal thickness and Vp/Vs ratios (Ai et al., 2007; Li et al., 2013; He et al., 2014), despite a few on the lithosphere thickness and upper mantle discontinuities (Ye et al., 2014; Huang et al., 2015), but they lack in seeking out the information of detailed crust and upper mantle structure.
In this study, we first employ P and S receiver functions (RFs) to explore both the azimuthal and lateral variation of the crustal thickness and bulk properties beneath available seismic broadband stations distributed across the Fujian province using the H-V stacking approach which was first introduced in detail by Rychert and Harmon, 2016 and later applied scrupulously to the Taiwan orogen in our previous study (Goyal and Hung, 2021). We next conduct a comprehensive nonlinear inversion of the stacked P RFs for each site to scrutinize the underlying shear velocity (Vs) structure of the crust. The results reveal the crust-mantle interface or Moho geometry derived from the RFs observed at three available backazimuth swaths, the pronounced intracrustal discontinuities and low-velocity layers, and the depth-varying Vs and Vp/Vs ratio of the crust beneath each station. Lastly, we discuss their possible implications for the internal structures and tectonic processes of the southeastern China.
Data and Receiver Function Processing
A total of 17 permanent broadband stations providing accessible waveform data are utilized to jointly evaluate the crustal properties and seismic velocity structure beneath the Fujian province (see Figure 1A). Most of these stations started operating in mid-2011, and since then, they have been maintained by the Fujian Earthquake Agency (FEA), while the remaining three located at nearshore islands belong to Broadband Array in Taiwan for Seismology (BATS) of the Institute of Earth Sciences (IES), Academia Sinica. We target seismic waveform records generated from the teleseismic earthquakes occurring between 2012 and 2021 with moment magnitude (Mw) greater than or equal to 5.7 and within the epicentral distance range of 30°–90° from the study region. The depths of events are limited to be less than 300 km to avoid the contamination of strong multiple surface-reflected P wave energy from deep-focus earthquakes (Wilson et al., 2006). To extract the P receiver function (RF) for each event-station pair, we first window the three-component seismograms starting from 30 s before and ending 120 s after the predicted P arrival and rotate them to the R(radial)-T(tangential)-Z(vertical) coordinate system. A zero-phase Butterworth bandpass filter of 0.05–1.00 Hz is applied to all the traces, following which the R-component trace is deconvolved from its Z-component counterpart using an iterative time-domain deconvolution scheme (Ligorría and Ammon, 1999). A Gaussian width (Gw) of 2.5 for the H-V stacking and 4.0 for the nonlinear RF inversion is chosen which yields the pulses with a dominant period of 1.6 and 1.0 s, respectively. The obtained RF is accepted for further analysis only if the variance reduction between the corresponding observed and predicted R-component waveforms is larger than 70%, thereby leading to nearly 330 events that have produced good-quality P RFs.
The S RF that comprises the S-to-p conversion from the Moho and its crustal multiples arriving before and after the direct S, respectively, is most prominent in optimal epicentral distances of 55°–85° (Yuan et al., 2006). Hence, we first window 200-s long waveforms centered at the predicted S arrival and rotate them from the Z-N-E to P-SV-SH coordinate system using the free surface transformation (Bostock, 1998). The direct S phases are identified and marked on the SV component using the AIMBAT software, which provides an interactive interface to measure phase arrival times from waveform cross-correlation (Lou et al., 2013). For the upkeep of quality, only those S waveforms that have signal-to-noise ratios (SNR) greater than three are retained. We utilize the extended-time multi-taper frequency-domain cross-correlation estimation (Helffrich, 2006) for deconvolution of the P from the SV component, and the deconvolved traces are then bandpassed between 0.03 and 0.50 Hz using a fourth-order Butterworth filter. We carefully inspected every calculated S RF to ensure that the direct converted and reverberated phase arrivals are coherent and have discernible amplitudes and correct moveouts varying with epicentral distance. Such selection procedure yields approximately a total of 100 S RFs per station. The azimuthal and distance distribution of the teleseismic events providing P and S RFs for our study are shown in Figure 1B.
Methods
H-V Stacking of P and S RFs
Fundamentals of Methodology
The P RFs are fundamentally bedecked with direct P-to-s conversion (Ps) and associated reverberated phases (PpPs and PpSs+PsPs) due to the confrontation of an incoming P-wave with a lateral seismic discontinuity at depth. From a ray-theoretical point of view, the arrival times of these phases (
where H is the depth of the accountable seismic discontinuity, p is the horizontal slowness of an incoming teleseismic P wave, and Vp and Vs are the average compressional and shear wave velocity of the aggregate structure between the discontinuity and recording site, respectively. The above formulation presumes a high-frequency wave to encounter a flat discontinuity with sharp impedance or velocity contrast along with the laterally smoothly varying isotropic velocity structure.
The crust-mantle boundary or the Moho is in general known as one of the most significant discontinuity featuring high-amplitude converted and reverberated phases in P RFs. The above equations have been widely used to evaluate the crustal thickness (H) and Vp/Vs ratio or κ by means of the H-κ stacking technique of Zhu and Kanamori (2000), which performs a grid search for the optimal H and Vp/Vs ratio, given a priori assumed constant Vp of the crust, to reach the maximum value of a function defined as the weighted sum of amplitudes of the Moho related phases marked at the corresponding predicted arrival times relative to direct P. In reality, the Moho discontinuity can be inclined or nonplanar and behave as a gradual velocity transition (Endrun et al., 2005; Tang et al., 2011; Saikia et al., 2016). Moreover, the continental crust is usually multi-layered and anisotropic and may consist of a thick, low-velocity sedimentary cover on the top (Schulte-Pelkum and Mahan, 2014; Yu et al., 2015). Consequently, the P RFs may not exhibit coherent and prominent Moho converted and reverberated phases, which restrain the H-κ technique from determining a well-constrained global maximum solution of H and Vp/Vs.
On the other hand, the S RFs have been proved useful as the conversion phase (Sp) arrives earlier and the associated reverberations (SsPp, SsSp) later than the direct S, hence mitigating some of the stated difficulties while using the P RFs only. The equations for the arrival times of these phases (
It is important to note that the three arrival-time equations for P or S RFs could not uniquely determine all the three parameters (H, Vp, and Vs) and, in addition, the secondary multiples, PpSs+PsPs and SsSp phases, are often less coherent and weakly ambiguous. Thus, only two crustal parameters (H and Vp/Vs) are evaluated in the H-κ stacking of P or S RFs using the above equations. Because the other direct conversions and primary multiples (Ps, PpPs, Sp, and SpPp) in P and S RFs are usually more prominently identified, their arrival-time equations can be jointly incorporated into simultaneously robust estimation of all the three parameters in H-Vp-Vs space, which was first introduced as H-V stacking method (Rychert and Harmon, 2016) and later modified for mapping the complex Moho and crustal elastic properties beneath the Taiwan orogen (Goyal and Hung, 2021). In this H-V method, no a priori information for Vp is required, and the trade-off between H and Vp/Vs largely involved in the conventional H-κ analysis is much reduced (Goyal and Hung, 2021). The 3-D grid search for the first-order crustal parameters (H, Vp, and Vs) can be carried out by maximizing the value of function (F) defined as
where a is the amplitude at the respective phase arrival time, and w1,.., 6 represents the weights of the corresponding phases.
Practical Approach
We conduct the joint H-V stacking of P and S RFs for each of the three main backazimuth sectors of teleseismic events separately at every station site. Since the obtained P and S RFs span over a wide range of backazimuths and epicentral distances (Figure 1B), we categorize the usable RFs into three directional subsets: northwest (NW), northeast (NE), and southeast (SE) with their respective backazimuth intervals of 280°–320°, 20°–50°, and 110°–140°. Except for the southwest from which the usable RFs are considerably fewer and insufficient enough to carry out the H-V stacking protocol, we stack both the P and S RFs from each of the rest three backazimuth quadrants in 5°-wide bins of epicentral distance. Figures 2A,B present the stacked P and S RFs from the SE quadrant at an example station DSXP, where the Moho conversions, including Ps with positive and Sp with negative polarity, are visually identified and verified from the negative moveout of their arrival times with increasing epicentral distance, while the associated crustal multiples, PpPs and SsPp, with positive polarities from their positive moveout.
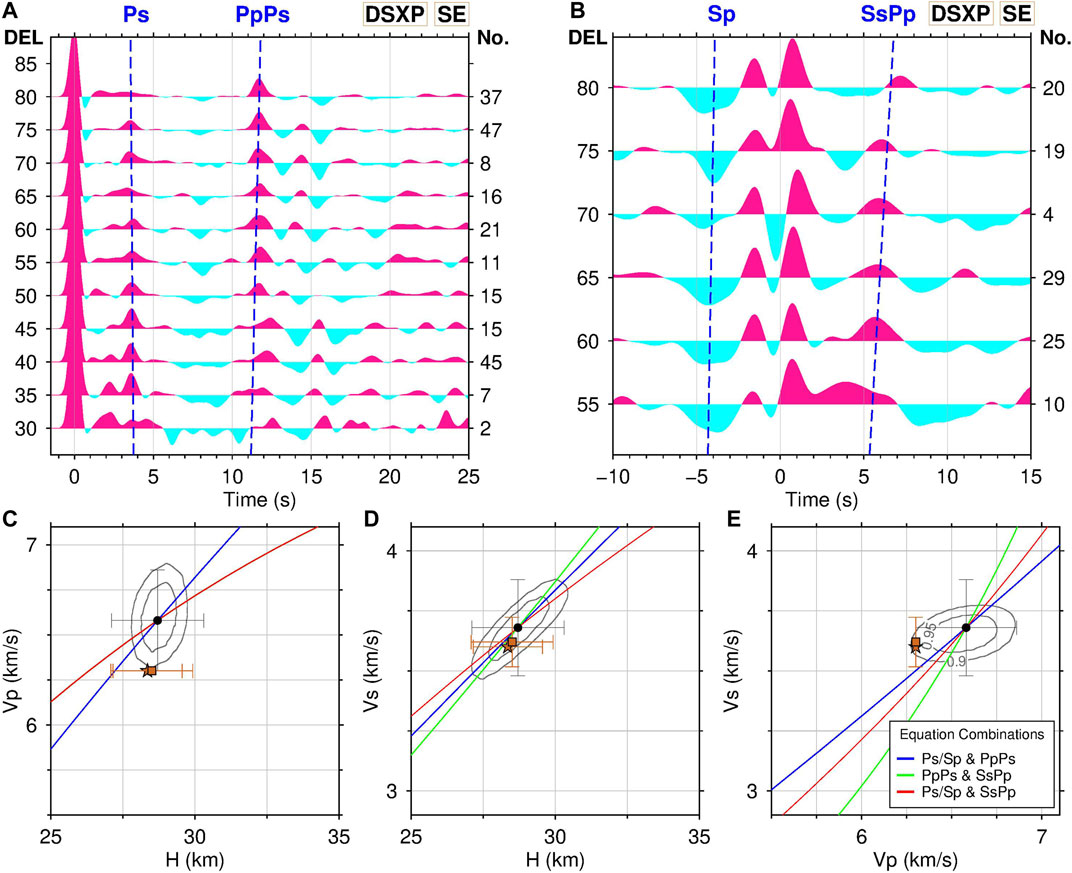
FIGURE 2. Illustration of our H-V stacking approach to determine crustal thickness (H), average Vp and Vs for the SE quadrant of station DSXP. (A) P and (B) S RF stacks for every 5° epicentral distance bins with their respective positive and negative polarity phases denoted in magenta and cyan colors. The number of individual RFs used in each stack is displayed on the right. Dashed blue lines mark the theoretical arrival times of Moho-related phases (Ps, Sp, PpPs, and SsPp) predicted from the H-V analysis. (C–E) The contours of the defined function to be maximized in H-V grid search and our optimal solution of H, Vp, and Vs (black circle) shown by the point of intersection of three curves that represent the arrival-time equation combinations projected onto the H-Vp, H-Vs, and Vp-Vs planes, respectively. The two gray contours represent the 90% and 95% confidence regions. The colored solid lines denote the curves of intersection of the three equations, mean(1,4), (2), and (5), associated with the theoretical arrival times of Ps/Sp, PpPs, and SsPp phases. The projected brown square and star represent the result of Guo et al. (2019) and He et al. (2014), respectively, for the same station DSXP.
For each station, a 3-D grid search is performed for individual backazimuth quadrants over a wide range of H, Vp, and Vs which are set to vary from 20 to 60 km, 5.5 to 7.0 km/s, and 3.0 to 4.0 km/s, respectively. In practice, we stack all the P RFs as one set, the S RFs as the other, normalize each set by the respective number of the stacked traces, and then seek the optimal combination of H, Vp, and Vs to maximum the function F defined in Equation 7. Because the secondary multiples, PpSs+PsPs and SsSp, are less coherent and difficult to discern for most of the stations, we choose the weighting scheme similar to that in Rychert and Harmon, 2016 as: w1 = 0.25, w2 = 0.20, w3 = 0.00, w4 = 0.30, w5 = 0.25, and w6 = 0.00 in the Equation 7. As the S RFs provide key constraints on Vp as demonstrated in Equation 5, we assign slightly higher weights for the S RF phases. In the grid search outcomes, we find the calculated F values in the 3-D H-V space are not sharply centralized around the global maximum value such that the volume for the 95th percentile isovalue contour is quite large for most of the stations, possibly due to the broader pulses in lower-frequency S RFs. This suggests that the solution corresponding to the maximum F value may not represent the most reliable and unbiased one and differs substantially that taken from the mean of statistically acceptable solutions around the maximum, as also reported in Rychert and Harmon, 2016. Therefore, instead of directly picking up the maximum value from the grid search, we determine the optimal solution of H, Vp, and Vs by taking the mean of the solution grids with F values over 95% confidence level and the associated uncertainties from their respective standard deviations. Besides, we also test other slightly different combinations of the weights for the four retained phases. They all yield similarly broad F-value distributions and comparable mean solutions within the 95% confidence regions, demonstrating that our H-V results are not affected substantially by the chosen weighting scheme.
To illustrate our H-V stack approach, we plot the contours for 90% and 95% confidence regions of the F values around the resulting global maximum projected onto H-Vp, H-Vs, and Vp-Vs planes using RFs from the SE quadrant for station DSXP as shown in Figures 2C–E. The solution of H, Vp, and Vs that leads to the maximum F can be perceived from the intersection point of the three surfaces in H-Vp-Vs space, which simultaneously satisfies the respective arrival-time equations, mean(1,4), (2), and (5), and graphically demonstrated by the intersection point of the three curves associated with the combined pairs of arrival-time equation, (mean(1,4), 2), (mean(1,4), 5), and (2, 5).
More details of our H-V grid search procedure can be referred to Goyal and Hung (2021) in which we effectively applied it for determining average crustal Vp, Vs, and Moho depth beneath stations in the highly complex tectonic setting and orogenic structure of Taiwan. The results are remarkably consistent with those from the previous P RF analysis at several common stations and the depth-averaged Vp, Vs, and Vp/Vs over the vertical crustal column beneath each site calculated from established local tomography models. Moreover, a synthetic test was presented the supplementary figure in the published paper of Goyal and Hung (2021) to demonstrate that the H-V approach works capably for a site with a thick low-velocity sedimentary cover over a sharp intracrustal discontinuity that mimics the intra-continental crustal structure observed in Taiwan and Fujian. Here, we compare our findings of Vs, Vp, and H for a given example station DSXP by juxtaposing them with those from the two previous studies in South China based on the H-κ analysis of P RFs only (He et al., 2014) and the joint inversion of P RF and gravity data (Guo et al., 2019) in Figures 2C–E. Their results comply substantially with ours within the uncertainties except for the average Vp which was therein assumed to be fixed at a constant value of 6.3 km/s. All of these suggest that the employed H-V method is quite suitable for deciphering the first-order crustal features at sites beneath the Fujian province.
Inversion Modeling of P RF Stacks
The RFs are primarily sensitive to velocity contrasts across lateral discontinuities, although some investigations claim their potential to resolve the absolute velocities as well (Ammon, 1991; Svenningsen and Jacobsen, 2007). We adopt a nonlinear and derivative-free direct search method, named as the Neighborhood Algorithm (NA; Sambridge, 1999) to invert for the layered shear velocity (Vs) structure beneath each station from the P RF stacks. In this well-established and tested inversion scheme, the earth model is composed of six horizontal layers from the top, corresponding to sediment, basement, upper, middle, lower crust, and upper mantle, and each of them is characterized by four parameters: the layer thickness, Vs at the top and bottom depth of the layer, and constant Vp/Vs ratio in the layer, which totally makes up a 24-dimensional parameter space. The model is estimated to minimize the objective function defined by the chi-square misfit (χ2) between observed and predicted data as follows:
where N is the total number of data points in a stacked RF trace used for the inversion, Oi and Pi are the ith observed and predicted value of the RF, respectively, and
To resolve the layered structures beneath each station with higher resolution by the NA inversion, first of all, we select and stack the best quality, shorter-period P RFs which are calculated with Gw of 4.0 (equivalent to 1-s dominant period) and unambiguously consistent in a narrow range of epicentral distance and backazimuth. Thus, a total of five to nine stacked P RFs per station is obtained for a variety of distinct azimuth and distance bins, and each of them is then processed for the Vs and Vp/Vs models using the NA inversion approach. Each inversion run involves 800 iterations generating a total of 64,100 candidate velocity models and forward calculating the corresponding predicted synthetic RF and the objective function to be minimized, which measures L2-norm misfit between the observed and synthetic RF data. The NA inversion procedure is exemplified in Figures 3A,B for station DHTZ, showing the comparison between an observed stacked P RF and its synthetic counterpart predicted by the model at the minimum objective function (Figure 3A), all the trial models (in grey) along with the 1000 best models (colored) and the best-fit model (thick red line) (Figure 3B), and the monotonically decreasing χ2 misfit with the increasing iterations that ultimately reaches a stable minimum (Figure 3C). Finally, a laterally averaged Vs and Vp/Vs model is derived by averaging all the best-fit models resulting from the inversion of individual RF stacks (Figures 3D,E). Since the NA approach implicitly assumes a laterally smooth layered structure beneath the targeted site, we exclude station YDFS from the current inversion procedure as its H-V results show considerably large variation of crustal thickness and average velocities among the three backazimuth sectors and will be discussed further in the next section.
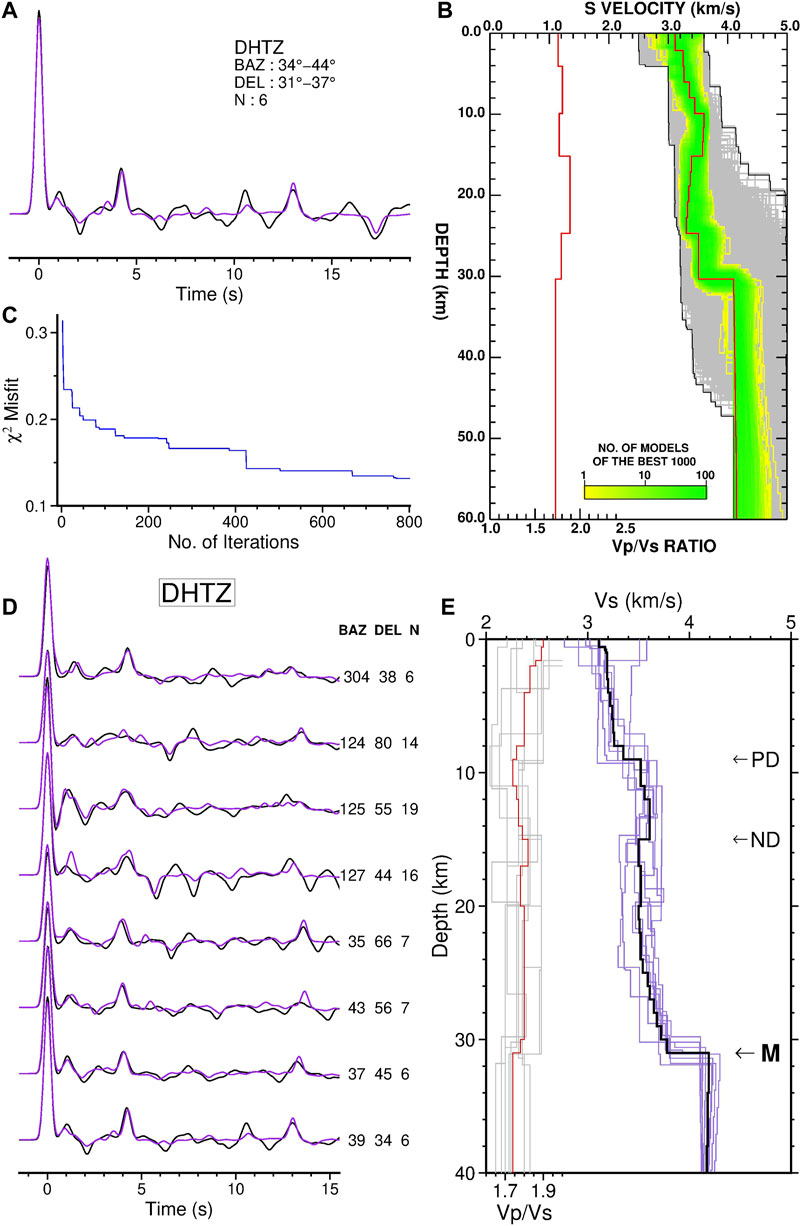
FIGURE 3. Results of the Neighborhood Algorithm (NA) inversion of P RFs for station DHTZ. (A) Example of an observed P RF (black line) and its corresponding synthetics (purple line) predicted by the optimal Vs and Vp/Vs models obtained with the nonlinear NA inversion. The observed P RF as the input data is calculated by the stack of a number (N) of selected high-quality RFs in a narrow range of back azimuth (BAZ) and epicentral distance (DEL). For this example case, N = 6. (B) The best-fit Vs (black line) and Vp/Vs (red line) models out of the best 1000 models (yellow and green regions) searched among a total of 64,100 models (grey region). (C) The misfit function at subsequent iterations. (D) Eight observed stacked P RFs (black lines) and their corresponding model-predicted synthetics (purple lines) adopted in the NA inversion for station DHTZ. The respective average back azimuth, epicentral distance, and number of RFs involved for each stack are displayed on the right. (E) Final Vs (thick black line) and Vp/Vs (red line) models calculated by averaging all the best-fit models (purple and grey lines) from the NA inversion of individual P RF stacks. The Moho and intracrustal positive and negative discontinuities are identified and marked by M, PD, and ND, respectively.
Results
Crustal Thickness and Average Seismic Velocities
As discussed in our earlier study (Goyal and Hung, 2021), the conversion points of Ps and Sp phases from useful epicentral distance ranges are located apart and off from the station by a horizontal distance of 6–11 and 21–30 km, respectively, given that the Moho lies at a depth of 35 km. Yet, despite that, their associated strong off-path sensitivity due to the inherently broad finite-frequency kernels (on the order of 15 and 35 km in cross-path width for Ps and Sp at a dominant period of 1.6 and 4 s, respectively) does partially overlap each other between the conversion points (Hung et al., 2000; Hung et al., 2001). Hence, the joint H-V stack of P and S RFs essentially yields the crustal thickness (H) and velocities (Vp and Vs) that are averaged laterally over the overlapping area about a dozen of kilometer wide toward the backazimuth quadrant. We thus employ this method to explore the variation of the bulk crustal properties over three different backazimuth sectors (280°–320°, 20°–50°, and 110°–140°) surrounding each station as shown in Figures 4, 5. Table 1 provides the location of each used station and obtained H-V results, including the determined thickness (H) and average Vp and Vs of the crust and the derived Vp/Vs ratio and Vb (bulk sound speed) with their associated uncertainties.
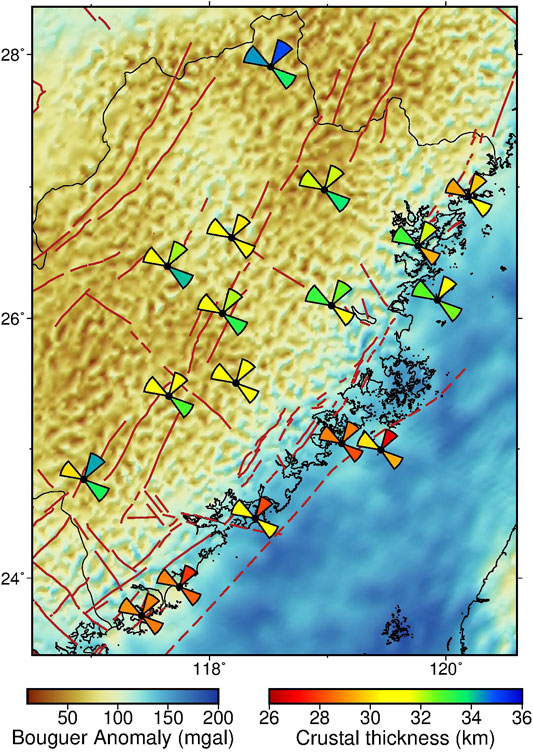
FIGURE 4. Variation of crustal thickness between the stations estimated by the H-V stacking over the background Bouguer gravity anomaly map. The thickness resulting from the three backzimuth quadrants is shown by colored sectors with the radius also proportional to the corresponding thickness.
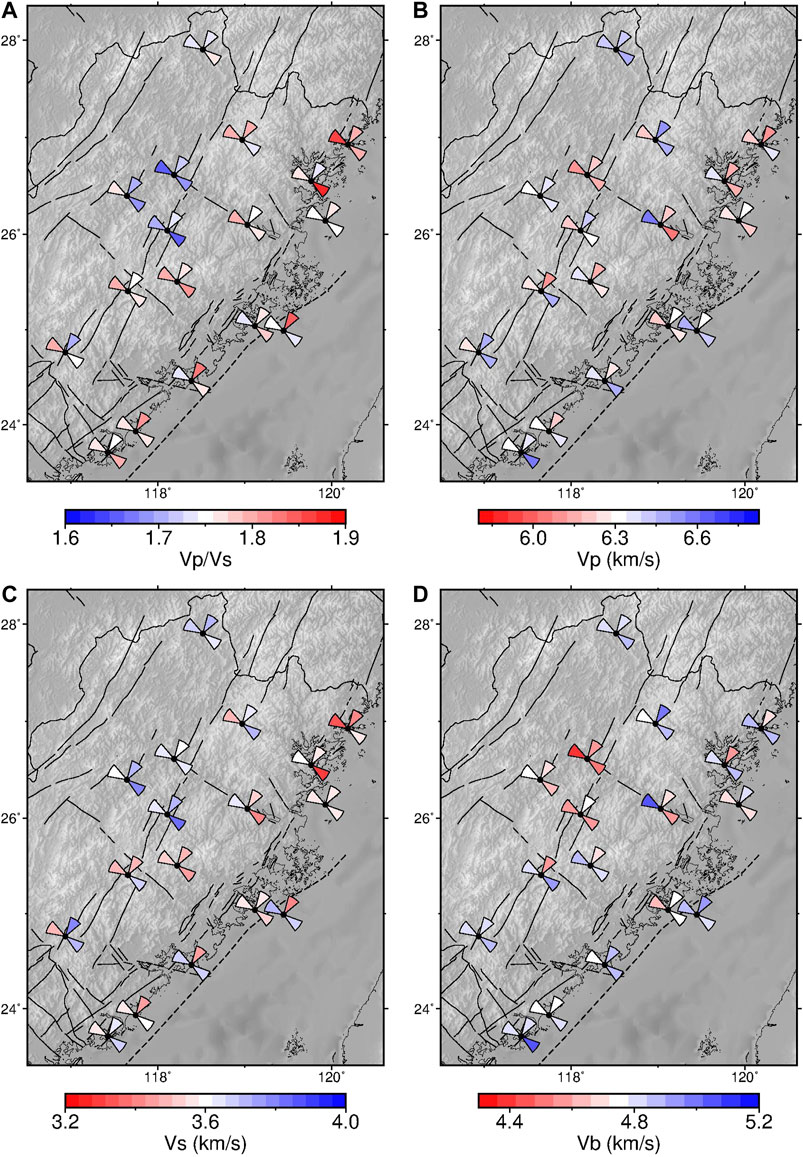
FIGURE 5. Variation of average (A) Vp/Vs, (B) Vp, (C) Vs, and (D) Vb (bulk sound speed) of the crust between the stations observed in the three backazimuth sectors determined by the H-V stacking.
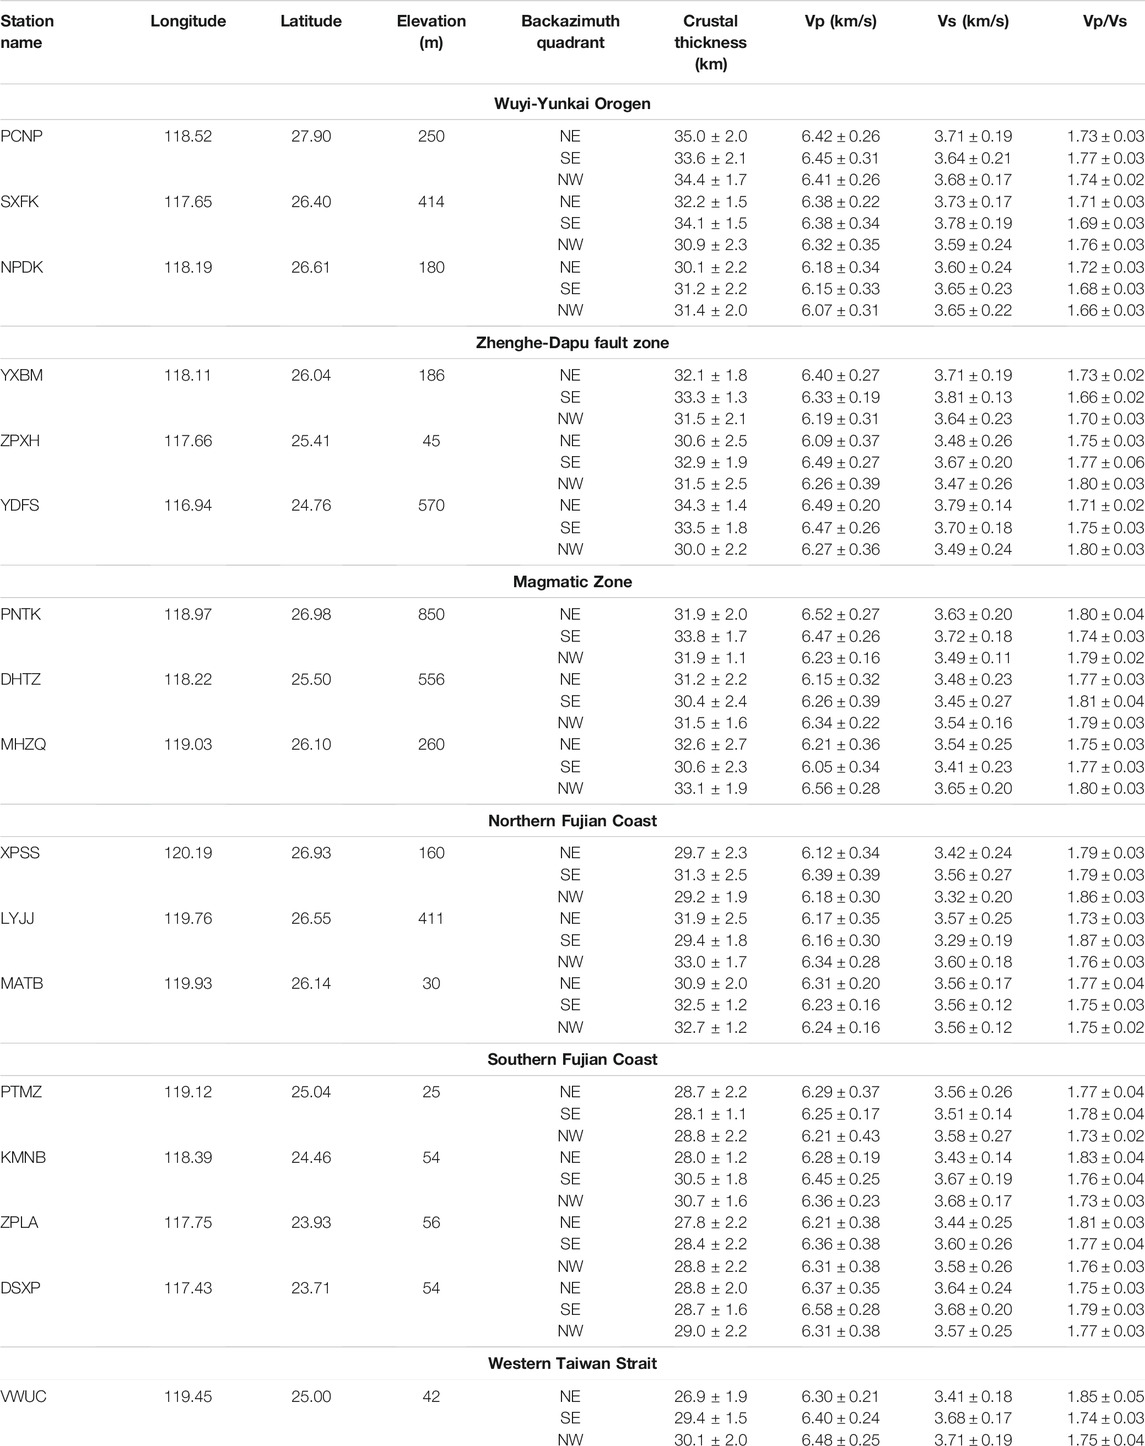
TABLE 1. Summary of crustal thickness (H) and average P- and S-wave velocity (Vp and Vs) of the crust including their estimated uncertainties resulting from the H-V stacking for all the three backazimuth sectors at 17 broadband stations.
The H-V stack reveals that the crustal thickness varies gently from 27 km in the southeastern coast to 35 km in the northwestern end of the Fujian province. In western Fujian affiliated with the early Paleozoic Wuyi-Yunkai orogenic belt in South China, the crust has the thickness of 30–35 km and the low to normal Vp/Vs ratio of ∼1.66–1.77 typical for an intraplate continental crust with dominantly felsic composition. The thickest crust (34–35 km) is found in the northernmost Fujian with moderate Vp/Vs but higher Vp and Vs. The downfaulted magmatic belt in central Fujian shows the similarly thick crust (30–34 km), but having an increased Vp/Vs of 1.75–1.80 likely due to a decrement in Vs. Along the Fujian coastline, the crust exhibits the most undulating thicknesses varying from 27–30 km in the south to 29–33 km in the north and the overall slightly higher Vp/Vs than normal, except for the unusually high Vp/Vs (∼1.86) and much lower Vs (∼3.3 km/s) observed in few directional quadrants. Unlike greater variability in Vp values found in inland stations, those in the coastal stations are much close to 6.3 km/s.
Some of the stations located near the Zhenghe-Dhapu (ZD) and Changle-Zhaoan (CZ) fault zones reveal quite different crustal thickness or Moho depths from the three backazimuth bins, implying a localized nonplanar Moho geometry. In general, the Moho is found deeper in the east of the ZD and the west of the northern CZ fault zone by about 2–4 km. The largest backazimuthal difference in the Moho depth over 4 km is obtained for station YDFS in the southern ZD. At this site, the crustal velocities estimated in the three different quadrants are contrasting as well, indicating the possibly distorted or disrupted Moho interface and substantial velocity contrast across the fault zone. The other noticeable difference in the Moho depth is observed at station MHZQ, where the crust in the Fuzhou Basin sampled by the RFs from the SE is shallower by 2.5–3 km than that from the NE and NW quadrants. Besides, for the two stations at the nearshore islands, VWUC in the eastern proximity of the littoral fault (FL) and KMNB just off the southeast coast of China, both exhibit a shallowing Moho toward the NE.
Thickness, Vs, and Vp/Vs of Layered Crustal Structure
The Fujian region has undergone several stages of tectonic activities that gave rise to the compositionally differentiated crustal strata cut by widespread faulted sutures. The layered intracrustal structures and properties can be hardly known from the average seismic velocities beneath the station sites determined by the H-V stacking. In order to gain a more comprehensive understanding of the crustal structure and its implications for regional geotectonics, the detailed velocity structure of the crust and uppermost mantle is required to be investigated. Here, we derive the Vs and Vp/Vs models beneath each station (except YDFS) from the stacked P RFs with Gw of 4.0 using the NA inversion approach. The inversion is performed individually for each RF trace calculated from the linear stack of carefully selected high-quality P RFs within a narrow range of backazimuth and epicentral distance. As the Ps piercing points at the intracrustal and Moho discontinuities are very close, less than 10 km to a station site and the sensitivity zone of high-frequency Ps phases dominated at 1 s is quite slim about 10 km wide, we integrate and average all the best-fit models inverted from each of the RF stacks over various backazimuth and distance bins to yield a robust estimate of the layered velocity structure beneath the station (e.g., Borah et al., 2016). Figure 6 and Table 2 shows all the obtained Vs and Vp/Vs models in various geological blocks along with the identified sediments colored in orange, the Moho, intracrustal positive (PD), and negative (ND) discontinuities marked by arrows. It may be noted that the most resolvable parameter in the RF inversion is the depth and sharpness (velocity contrast) of seismic discontinuities and then the absolute shear velocities of the crustal layers and their corresponding Vp/Vs variation.
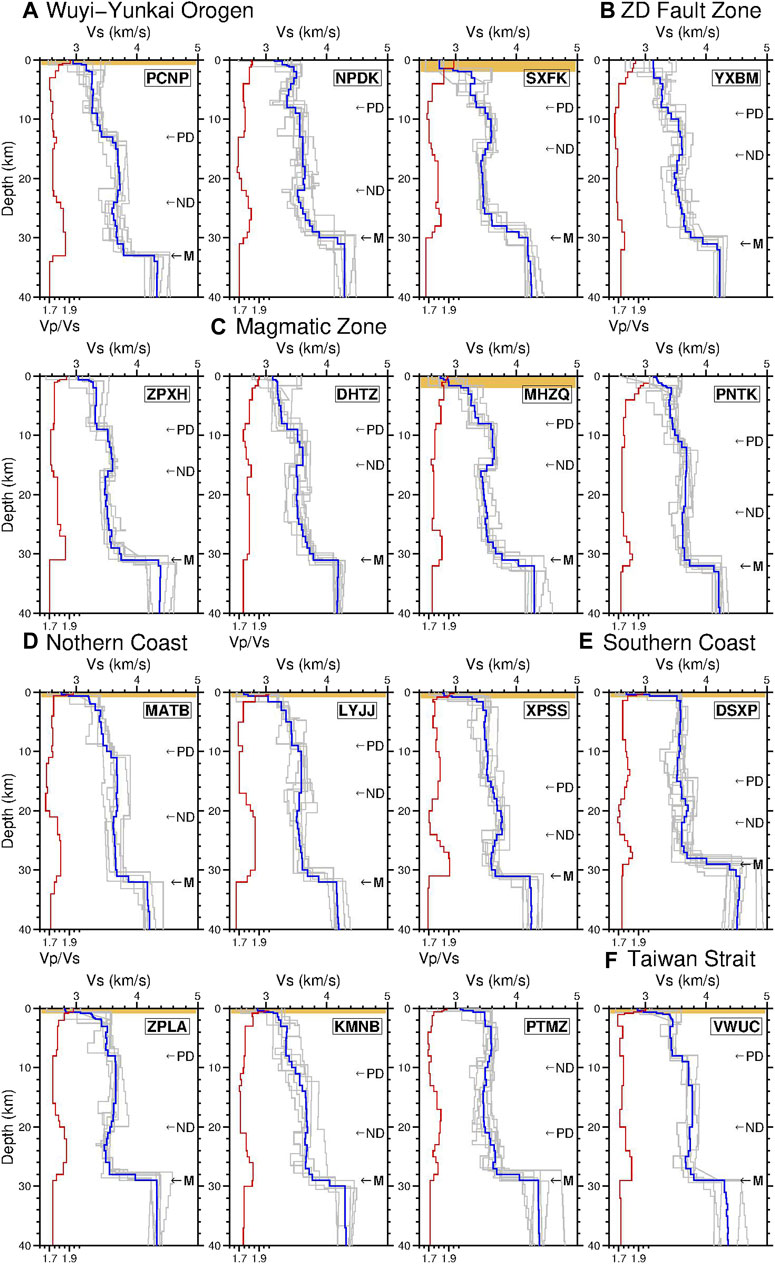
FIGURE 6. Layered shear-wave velocity (Vs) structure of the crust beneath each station (except for YDFS) arranged according to its geological setting, from west to east, (A) Wuyi-Yunkai orogen, (B) Zhenghe-Dapu (ZD) suture zone, (C) Magmatic zone, (D) Northern Fujian coasts, (E) Southern Fujian coasts, and (F) Western Taiwan Strait. The optimal Vs and Vp/Vs models denoted by blue and red lines, respectively, are obtained by averaging all the best-fit models (gray lines) from the NA inversion of individual P RF stacks with the ray paths sampling the crust around each station. The sedimentary layer is highlighted as brown-colored shades. The Moho and intracrustal positive and negative discontinuities are identified and marked by M, PD, and ND, respectively. Note the higher velocity upper crustal layer in the coastal region and a shallower ND beneath SXFK, YXBM, ZPXH, DHTZ, and MHZQ.
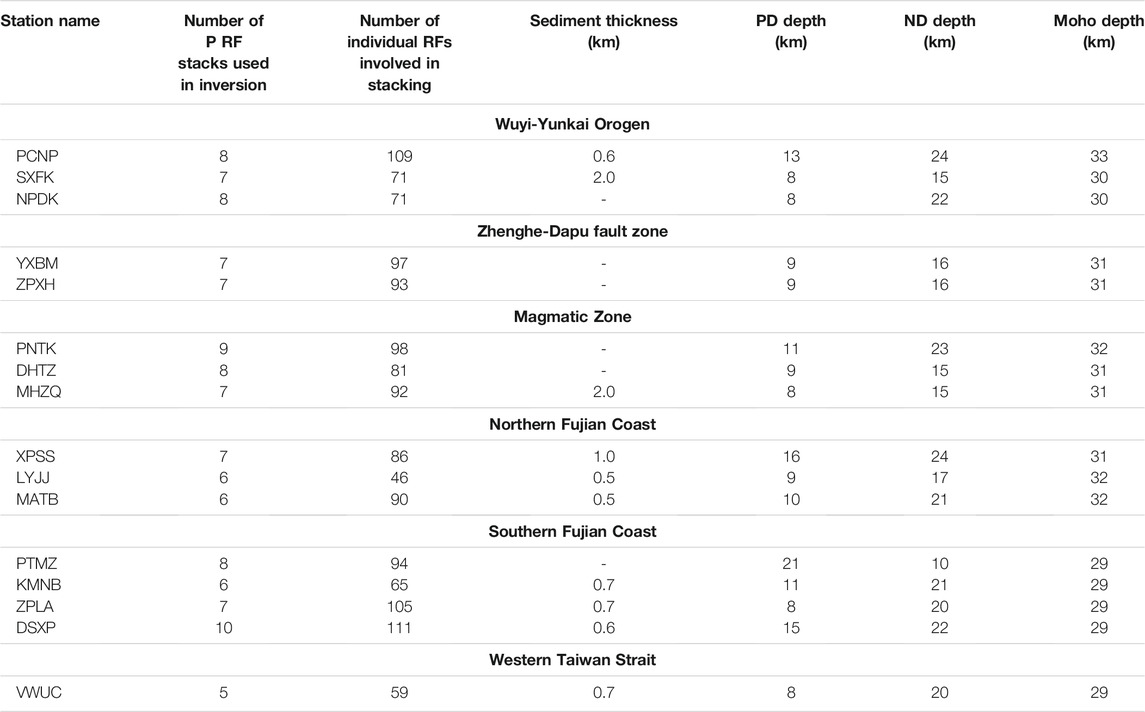
TABLE 2. Summary of the NA inversion results for the sediment thickness and depths of the intracrustal positive (PD), negative (ND), and Moho discontinuities at all the stations.
The inverted shear velocity (Vs) models of the crust beneath the stations across Fujian, in general, resolve a PD followed by a ND as going deeper which grants us to identify four crustal layers: upper, middle, and lower crust separated well by the PD and ND, and the sediments, if any. The sedimentary layer is absent in most of the sites in the inland mountainous Fujian except at stations SXFK and MHZQ underlain by unusual, about 2-km thick sediments. In contrast, the crust beneath all the stations situated along the coast is overlain by 0.5–1-km thick sediments with Vs between 2.6 and 2.9 km/s (Figure 6). The upper crust is generally 8–11 km thick with Vs ranging from 3.2 to 3.4 km/s in the Wuyi-Yunkai orogen and Magmatic zone, and from 3.4 to 3.6 km/s in the coastal regions and all with a normal Vp/Vs ratio. We also notice an unusually thicker upper crust of ∼15 km beneath stations DSXP and XPSS in northernmost and southernmost coast of Fujian, respectively.
Among all the models, those of the five stations (SXFK, YXBM, ZPXH, DHTZ, and MHZQ) situated in the inland central Fujian region around the ZD fault zone comprise of a uniquely shallow ND at the depth of 15–16 km (Figure 6). The middle crust beneath these sites is only about ∼7 km thick, about one-half to two-thirds of the thickness (10–13 km) in the rest of sites. The seismic velocity property of the middle crust commonly pertains to a Vs of 3.6–3.7 km/s and a low-to-normal Vp/Vs. The lower crust throughout the Fujian province is found to be as slow as 3.5–3.7 km/s in Vs but has a relatively higher Vp/Vs ratio (≥1.80), and its thickness varies between 8 and 10 km except beneath those five stations where it increases to nearly 15 km. Besides, the uppermost mantle velocity is 4.20–4.30 km/s in the inland Fujian, ∼4.20 in the northern coast, and 4.30–4.45 km/s in the southern and central coast.
Lastly, we compare our resulting Moho depth, average Vs, and Vp/Vs calculated from the inversion models with those derived from the H-V stacking for three backazimuth sectors at each station site in Figure 7. The results obtained using the two independent methods are generally in good agreement with each other. Despite of some differences observed such as the average Vs at three stations, PCNP, SXFK, and YXBM, and Vp/Vs at NPDK situated in western Fujian, they still match decently well within our estimated uncertainty range.
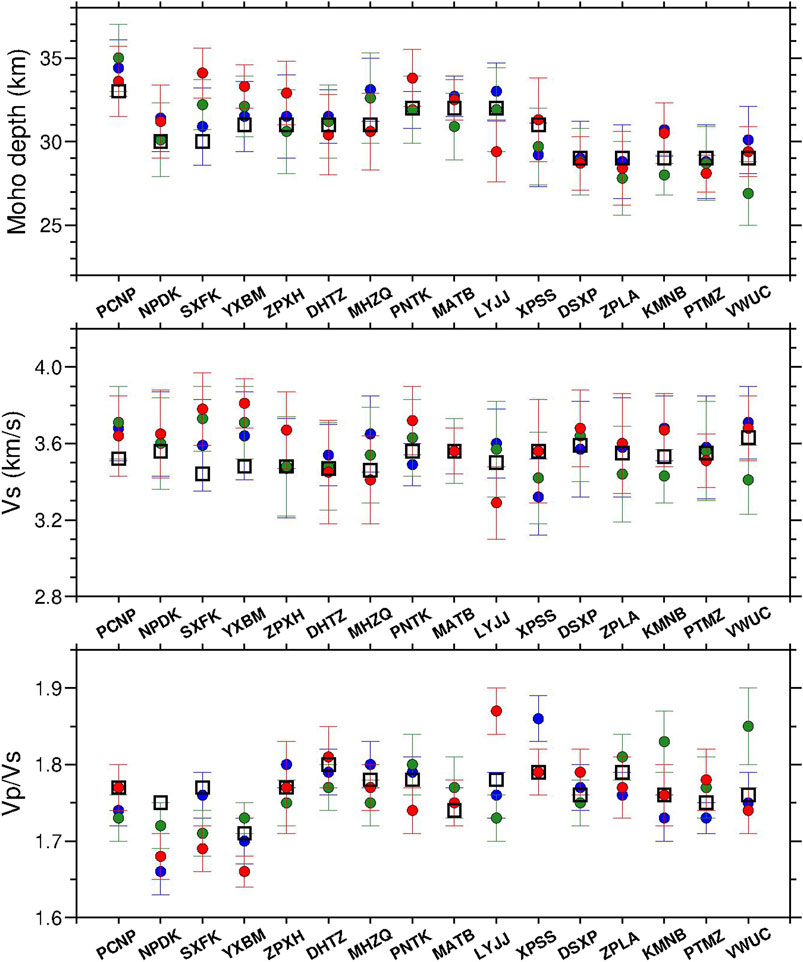
FIGURE 7. Comparison of our results of the Moho depth, average crustal Vs, and Vp/Vs derived from the inversion models and H-V stacking for each station, arranged according to its geological setting in the same order as that in Figure 6 and Table 2. The open black squares represent the results from the NA inversion while the red-, green-, and blue-filled circles show those from the H-V stacking method for the quadrants of NW, NE, and SE backazimuths, respectively.
Discussion
Variation of Crustal Thickness and Properties in the Fujian Province
The decrease in crustal thickness from 30–35 km in the inland Fujian to 27–30 km in the southern coast which lies the Pingtan-Dongshan metamorphic belt (PDMB) is readily observed from both the H-V stacking and NA inversion results. The findings are in good agreement with the previous RF studies mainly based on H-κ stacking of P RFs (Ai et al., 2007; He et al., 2014; Li et al., 2013), and largely consistent with the lateral variation of the Moho interface mapped from local earthquake travel-time tomography (Cai et al., 2015; Kuo et al., 2016) and joint inversion of P RF and gravity data (Guo et al., 2019). Moreover, the featured larger velocity jump across the Moho and higher uppermost mantle velocity in the south-central Fujian coast are in accordance with those seen in the tomographic results (Huang et al., 2010; Cai et al., 2015). Such crustal thinning from the inland to coastal region can be ascribed to the combined effect of the back-arc extension and lithospheric erosion due to the westward subduction and dehydration of the paleo-Pacific plate (Arcay et al., 2006; Niu et al., 2015). A consistently thinner crust (27–29 km) in the southern coastline than that in the northern (29–33 km) may demonstrate an important role of the NW-striking Min River fault in separation and interaction of the two blocks by regional stress adjustment as also proposed previously (Li et al., 2013; Ye et al., 2014). While considering the H-V stack results obtained in three different backazimuth sectors as a whole, a gently eastward and westward deepening Moho boundary exists across the Zhenghe-Dapu (ZD) and northern Changle-Zhaoan (CZ) suture zones, respectively, including a slight Moho uplift in the proximity of Fuzhou basin (Figure 4). These Moho undulations are plausibly a consequence of the Cretaceous magmatic belt bounded by the deep downfaulted ZD and CZ sutures. In addition, the Moho is found to be substantially nonplanar beneath the southern ZD fault (station YDFS) where the seismicity is most abundant and reaches deeper into the mid-lower crust, suggesting that the ZD fault is deeply rooted and highly active in this region (Lin et al., 2021). The significant variation of crustal properties and large historical earthquakes recorded in this region compels for a further in-depth investigation of fault mechanism and stress pattern that prevail in the crust.
The Vp/Vs is widely accepted to be more effective than Vp or Vs alone for inferring the changes in chemical composition, temperature, and pore fluid of rocks (e.g., Christensen, 1996). The resulting average crustal Vp/Vs ratio is lower in the Wuyi-Yunkai fold belt (1.68–1.73) and comparatively higher in the Cretaceous magmatic zone (1.74–1.80). Such discernible Vp/Vs variation may mostly reflect the different/distinct compositional characteristics of crustal rocks beneath these regions, suggesting that the crust in the Wuyi-Yunkai orogen is more felsic and that in the magmatic downfaulted belt is intermediate-to-mafic in nature. As the peraluminous granitoids and Mesozoic volcanic rocks are widespread in the Fujian province, they are chemically characterized by high silica content and calc-alkaline rich plagioclase feldspar, respectively (Zhou and Li, 2000). From the compilation of laboratory-based seismic velocity measurements of igneous rocks at the P-T conditions at crustal depths (Christensen, 1996), either a decrease of silica or an increase of calc-alkaline content could lower the Vp/Vs ratio significantly, which offers the most probable explanation for the increased Vp/Vs in the eastern Fujian.
In the coastal and nearshore region, though the average Vp/Vs ratios obtained from different backazimuth sectors mostly fall within the normal-to-high range of 1.73–1.79, a few stations like LYJJ and XPSS yield considerably higher values (∼1.83–1.87) which seem to appear intermittently and irregularly with no specific locations and backazimuths (Figure 5A). This indicates the crust at the shore area is laterally inhomogeneous with the change in rock composition sporadically from being intermediate to highly mafic. Such diverse characteristics can be also noticed in the velocity inversion model, discussed later in the next section. The unusually increased Vp/Vs along with the decreased Vs at few locations may also be related to a high geothermal gradient as there are many hot springs along the Fujian coastline.
Not only is the Vp/Vs derived from the H-V stacking but also the bulk sound speed (Vb) being directly linked to the bulk modulus or incompressibility of rocks can also provide a measure of the crustal resistance to compressional or extensional tectonic stress. The average crustal Vb is found to be remarkably low in the Wuyi-Yunkai orogenic belt near the ZD fault zone and consistently higher in the magmatic and coastal zones. We thus speculate that the crust to the west of the ZD suture has become mechanically weaker in response to the subsequent collisional and extensional tectonics since Paleozoic; while it remains relatively strong, less deformed in the eastern Fujian area. Interestingly, the characteristics of the lowest crustal Vb and Vp/Vs in the ancient Wuyi-Yunkai orogen are similar to that observed in the young central Taiwan orogen with the most thickened, compressible crust (Goyal and Hung, 2021).
Layered Crustal Structure and Its Implications
A clear positive discontinuity (PD) corresponding to a sudden increase in shear velocity with depth pertains throughout the Fujian province mostly occurring at depths of 8–11 km, and we identify it as the interface between the upper and middle layer of the crust. The slower upper crustal layer atop the intracrustal PD in inland Fujian is similarly found in the joint inversion results of P RFs and surface-wave dispersion with Vp constraints (Deng et al., 2019) where it was explained by the formation of the granitoids, which would eventually be exposed on the surface after long-time erosion. On the other hand, the resulting negative velocity contrasts (ND) show different degrees of Vs reduction and variable depth range (15–24 km). In our view, the explicitly pronounced positive interface (PD) at 8–11 km depth range can be possibly related to the Conrad discontinuity commonly found in the continental regions and correspond to the transition from the upper crust dominated by more felsic granitoids to the mid-to-lower crust with more mafic rock composition. Along the coastline, between the CZ and FL fault zones, the shear velocities of the upper crust are consistently faster than those in the inland Fujian by ∼0.2 km/s. Such anomalously high-velocity feature in the upper crust has also been found in the tomography results (Cai et al., 2015; Kuo et al., 2016; Zhang et al., 2018), and it resides within the proximity of PDMB where the crustal rocks are mainly composed of granites and high-pressure amphibolite-facies metamorphic rocks (Chen et al., 2002; Liu et al., 2012). The relatively uniform, flat-layered sediments of ∼0.5–1 km thick are deposited along the coastline while they are seemingly absent in the inland Fujian, except for the 2-km thick sedimentary layer found at two sites (MHZQ and SXFK) which might be related to the adjacent Fuzhou basin and river valleys of the Wuyi-Yunkai mountains (Figure 6).
On the other hand, the shear velocities are nearly uniform in the middle crustal layer of 3.6–3.7 km/s along with the low Vp/Vs (1.68–1.74), possibly attributed to the less adulterated felsic rocks in the ancient orogenic belt. At the base of the middle crust, there exists a negative velocity gradient (ND) at the depth range of 20–24 km except for that beneath the five sites in the south-central Fujian around the ZD fault zone is located at the shallower depths of 15–16 km. The low-velocity anomalies in the depths of the mid-to-lower crust have been reported in this region from the tomography studies as well (Cai et al., 2015; Zhang et al., 2018), though the 3-D tomographic images show they are distributed more irregularly at varying depths. Since RFs are mainly sensitive to the velocity contrast between layered structures, we detect that this slow zone appears from ∼15 km depth and extends down to the base of the crust, and has a normal to slightly higher Vp/Vs between 1.77 and 1.83. The closure of a paleo-oceanic rifted basin as a result of the Indosinian collision has been proposed from the observations of the symmetrical step-like velocity structure (Kuo et al., 2016) and the exposed surface rocks near the ZD fault zone such as ophiolite mélange, pelagic sediments, and basaltic debris (Li, 2013). Our low-velocity layer present in the mid-to-lower crust with high Vp/Vs complies well with that of the oceanic basin remnants (Hyndman, 1979). Intriguingly, a recent study based on the pre-stack migration of P RFs found a similar low-velocity mid-crustal layer which is laterally broadly distributed over the southeastern China block and vertically varies from 10 to 16 km depths (Zhou et al., 2020). However, they deduced a lower Vp/Vs ratio (∼1.66) for this layer and thus related it to be trapped fluids released from dehydration of the subducted paleo-Pacific plate. Nevertheless, a conspicuous low-velocity layer in the mid-to-lower crust prevails in the southeastern China margin near to the ZD suture zone and a more comprehensive seismic, and other geophysical evidence for this feature is yet to be explored in order to explain its origin.
Though the interpretation of the earth’s gravitational field for the depth, shape, and density of causative bodies is theoretically nonunique, the Bouguer gravity anomaly corrected for the known terrain attraction has been commonly used to deduce the variation of crustal thickness and density distribution. As extracted from the global gravity model of WGM 2012 (Bonvalot et al., 2012), the Bouguer gravity map in the Fujian region reveals the lateral variation trending NE-SW roughly parallel to the coastline (Figure 4), showing regional lows in the inland Fujian and highs in the coastal and eastern offshore areas. Such variation most probably implies either the thinning of the crust or the increase of crustal density or both toward the coast which overall match the crustal features resulting from our RF study. Namely, compared to the crustal structure found in the coastal metamorphic belt, a thicker crust along with a lower Vs (usually lower density) upper crust is revealed in the inland Fujian. In addition, a thicker, low-Vs layer in the mid-to-lower crust around the ZD fault zone may also contribute to the lower Bouguer anomaly there.
There are a few sites along the coastline that exhibit a distinct Vs structure. For instance, stations XPSS and DSXP located far apart in the northernmost and southernmost Fujian coast, respectively, both similarly consist of a sharp velocity increase across the sediment-basement interface and thicker upper crust (∼15 km thick) with nearly constant, relatively higher Vs (∼3.5 km/s), while the others (except for PTMZ) yield a thinner upper crust (≤10 km thick) usually with a gradational increase of Vs with depth. Unlike the velocity models for the rest of stations comprising a low-velocity sediment cover and a distinct positive discontinuity between the upper and middle crust, that for station PTMZ in the central coast situated at the exposed surface basement rock reveals a transitional decrease in Vs from the lower upper crust to the middle crust and a broad low-velocity zone in the middle crust. These seismic signatures are likely associated with the very locally distributed volcanic and intrusive rocks formed from the frequent magmatic and extensional events in the Mesozoic (Liu et al., 2012; Wang et al., 2017).
Based on geochemical and petrological studies (Zhou and Li, 2000; Zhou et al., 2006; Jiang et al., 2009; Huang et al., 2011), the widespread granitoid rocks are largely believed to be the product of crustal material melting associated with the asthenosphere upwelling and thinning of lithosphere and/or magmatic underplating at the base of crust. The lower crustal layer is found to have low shear velocities of 3.5–3.7 km/s and higher Vp/Vs (1.80–1.84) throughout the Fujian region that deduces compressional velocities of 6.37–6.80 km/s. These velocities are not fast enough to represent those of the underplated rocks which typically exceed 4.0 km/s for Vs (Saikia et al., 2017) and 7.0 km/s for Vp (Thybo and Artemieva, 2013). Rather, they are more consistent with the lower crustal rocks containing a mafic-ultramafic composition. The magmatic underplating frequently induces remelting of the lower crust (Fountain, 1989; Ma et al., 2012); therefore, it could also potentially generate the extensive granitoid magmatism (Wei et al., 2020). Such remelting could have reduced the lower crustal velocities despite remaining the Vp/Vs approximately unchanged. Alternatively, the thinning of lithosphere accompanied by asthenosphere upwelling may also explain the late Mesozoic magmatism (Deng et al., 2019; Lin et al., 2021).
Conclusion
We perform a thorough analysis of P and S RFs by employing the H-V stacking and nonlinear inversion methods to investigate the thickness, average seismic properties, and layered velocity structure of the crust beneath the Fujian province in southeastern China. The resulting crustal thickness varies from 30 to 34 km in the inland Fujian, being thickest about 34–35 km in the northwestern end and gradually thinned to 27–30 km in southern coastal region. The Moho boundary is found to be nonplanar or inclined across the active Zhenghe-Dapu (ZD) and Changle-Zhaoan (CZ) fault zones, with the most distorted geometry across the southern ZD fault, implying the fault roots deeply into the crust. The average crustal Vp/Vs reflects a more felsic composition in the Wuyi-Yunkai orogen (1.68–1.74), while more close to the intermediate-to-mafic characters in the Mesozoic magmatic and metamorphic coastal zones (1.73–1.81). The inverted Vs and Vp/Vs models reveal two distinct intracrustal discontinuities with an abrupt positive and negative velocity change with depth throughout the Fujian region, which mostly occurs at approximate depths of 8–11 and 20–24 km, respectively. The models manifest a 0.5–1 km thick sediment layer underlain by a relatively fast upper crust in the metamorphosed belt along the coastline. Beneath the sites in close proximity to the ZD fault zone, the negative discontinuity rather appears shallower at ∼15 km depth as the top boundary of a thick mid-to-lower crustal low-velocity zone. The lower crustal layer across Fujian is observed with lower Vs (3.5–3.7 km/s) and higher Vp/Vs (1.80–1.84) in accordance with the seismic properties of mafic-ultramafic rocks. A comprehensive interpretation of our main findings stated above is summarized and illustrated through a 3-D schematic diagram presented in Figure 8.
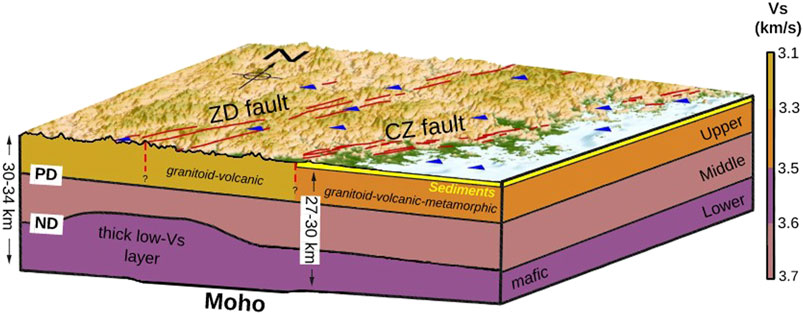
FIGURE 8. A 3-D interpretation diagram of the crustal features in the Fujian province resulting from our receiver function analysis.
Data Availability Statement
The data analyzed in this study is subject to the following licenses/restrictions: the waveform data used in this study are made available through the Fujian Earthquake Agency (FEA) in China, Department of Earth Sciences at National Central University (NCU), Taiwan, and Broadband Array in Taiwan for Seismology (BATS) of Institute of Earth Sciences, Academia Sinica (http://bats.earth.sinica.edu.tw, doi:10.7914/SN/TW). The raw waveform data is not open to public and the requests for original data can be sent to the above mentioned institutes.
Author Contributions
AG performed the processing and inversion with proper guidance from S-HH. AG wrote the initial version of manuscript. Both the authors contributed to the interpretation and manuscript writing and approved the submitted version.
Funding
This work was supported by the Ministry of Science and Technology of Taiwan under Grant Numbers 108-2116-M-002-026, 109-2116-M-002-010, and 110-2116-M-002-010.
Conflict of Interest
The authors declare that the research was conducted in the absence of any commercial or financial relationships that could be construed as a potential conflict of interest.
Publisher’s Note
All claims expressed in this article are solely those of the authors and do not necessarily represent those of their affiliated organizations, or those of the publisher, the editors and the reviewers. Any product that may be evaluated in this article, or claim that may be made by its manufacturer, is not guaranteed or endorsed by the publisher.
Acknowledgments
We thank W.-T. Liang and W.-H. Li for the assistance of acquiring seismic waveform data from the FEA, NCU, and BATS, and Y. Zhang and H. Yao for kindly providing the digital database for faults in China. We also like to thank the two reviewers whose help improved the manuscript. All the figures are generated using the GMT (Wessel et al., 2013).
References
Ai, Y., Chen, Q.-f., Zeng, F., Hong, X., and Ye, W. (2007). The Crust and Upper Mantle Structure Beneath Southeastern China. Earth Planet. Sci. Lett. 260, 549–563. doi:10.1016/j.epsl.2007.06.009
Ammon, B. Y. C. J. (1991). The Isolation of Receiver Effects from Teleseismic P Waveforms. Bull. Soc. Am. 81, 2504–2510. doi:10.1785/BSSA0810062504
Arcay, D., Doin, M.-P., Tric, E., Bousquet, R., and De Capitani, C. (2006). Overriding Plate Thinning in Subduction Zones: Localized Convection Induced by Slab Dehydration. Geochem. Geophys. Geosyst. 7, Q02007. doi:10.1029/2005GC001061
Bonvalot, S., Balmino, G., Briais, A., Kuhn, M., Peyrefitte, A., Vales, N., et al. (2012). World Gravity Map. Eds. BGI-CGMW-CNES-IRD, Paris: Comm. Geol. Map World.
Borah, K., Bora, D. K., Goyal, A., and Kumar, R. (2016). Crustal Structure Beneath Northeast India Inferred from Receiver Function Modeling. Phys. Earth Planet. Interiors. 258, 15–27. doi:10.1016/j.pepi.2016.07.005
Bostock, M. G. (1998). Mantle Stratigraphy and Evolution of the Slave Province. J. Geophys. Res. 103, 21183–21200. doi:10.1029/98jb01069
Cai, H.-T., Kuo-Chen, H., Jin, X., Wang, C.-Y., Huang, B.-S., and Yen, H.-Y. (2015). A Three-Dimensional Vp, vs, and Vp/Vs Crustal Structure in Fujian, Southeast China, From Active- and Passive-Source Experiments. J. Asian Earth Sci. 111, 517–527. doi:10.1016/j.jseaes.2015.06.014
Chen, W.-S., Yang, H.-C., Wang, X., and Huang, H. (2002). Tectonic Setting and Exhumation History of the Pingtan-Dongshan Metamorphic Belt Along the Coastal Area, Fujian Province, Southeast China. J. Asian Earth Sci. 20, 829–840. doi:10.1016/S1367-9120(01)00066-9
Christensen, N. I. (1996). Poisson's Ratio and Crustal Seismology. J. Geophys. Res. 101, 3139–3156. doi:10.1029/95jb03446
Deng, Y., Li, J., Peng, T., Ma, Q., Song, X., Sun, X., et al. (2019). Lithospheric Structure in the Cathaysia Block (South China) and its Implication for the Late Mesozoic Magmatism. Phys. Earth Planet. Interiors. 291, 24–34. doi:10.1016/j.pepi.2019.04.003
Ding, X. H., Wang, Y. D., and Ye, S. J. (1999). Active Faults and Earthquakes in Southeastern Coast of Fujian. Fugian: Fujian Sci. Technol. Publ. China, 223.
Dong, S., Li, J., Cawood, P. A., Gao, R., Zhang, Y., and Xin, Y. (2020). Mantle Influx Compensates Crustal Thinning Beneath the Cathaysia Block, South China: Evidence from SINOPROBE Reflection Profiling. Earth Planet. Sci. Lett. 544, 116360. doi:10.1016/j.epsl.2020.116360
Endrun, B., Ceranna, L., Meier, T., Bohnhoff, M., and Harjes, H.-P. (2005). Modeling the Influence of Moho Topography on Receiver Functions: A Case Study from the central Hellenic Subduction Zone. Geophys. Res. Lett. 32, L12311. doi:10.1029/2005GL023066
Fountain, D. M. (1989). Growth and Modification of Lower continental Crust in Extended Terrains: The Role of Extension and Magmatic Underplating. Properties and Processes of Earth' Lower Crust, Washington, DC: American Geophysical Union Geophysical Monograph Series 51, 287–299. doi:10.1029/gm051p0287
Goyal, A., and Hung, S. H. (2021). Lateral Variations of Moho Depth and Average Crustal Properties Across the Taiwan Orogen from H ‐ V Stacking of P and S Receiver Functions. Geochem. Geophys. Geosyst. 22, 1–26. doi:10.1029/2020GC009527
Guo, F., Fan, W., Li, C., Zhao, L., Li, H., and Yang, J. (2012). Multi-stage Crust-Mantle Interaction in SE China: Temporal, thermal and Compositional Constraints from the Mesozoic Felsic Volcanic Rocks in Eastern Guangdong-Fujian Provinces. Lithos 150, 62–84. doi:10.1016/j.lithos.2011.12.009
Guo, L., Gao, R., Shi, L., Huang, Z., and Ma, Y. (2019). Crustal Thickness and Poisson's Ratios of South China Revealed from Joint Inversion of Receiver Function and Gravity Data. Earth Planet. Sci. Lett. 510, 142–152. doi:10.1016/j.epsl.2018.12.039
He, R., Shang, X., Yu, C., Zhang, H., and Van der Hilst, R. D. (2014). A Unified Map of Moho Depth and Vp/Vs Ratio of Continental China by Receiver Function Analysis. Geophys. J. Int. 199, 1910–1918. doi:10.1093/gji/ggu365
Helffrich, G. (2006). Extended-time Multitaper Frequency Domain Cross-Correlation Receiver-Function Estimation. Bull. Seismological Soc. America. 96, 344–347. doi:10.1785/0120050098
Hsü, K. J., Li, J., Chen, H., Wang, Q., Sun, S., and Şengör, A. M. C. (1990). Tectonics of South China: Key to Understanding West Pacific Geology. Tectonophysics 183, 9–39. doi:10.1016/0040-1951(90)90186-C
Huang, H.-Q., Li, X.-H., Li, W.-X., and Li, Z.-X. (2011). Formation of High 18O Fayalite-Bearing A-type Granite by High-Temperature Melting of Granulitic Metasedimentary Rocks, Southern China. Geology 39, 903–906. doi:10.1130/G32080.1
Huang, H., Tosi, N., Chang, S. J., Xia, S., and Qiu, X. (2015). Receiver Function Imaging of the Mantle Transition Zone Beneath the S Outh C Hina B Lock. Geochem. Geophys. Geosyst. 16, 3666–3678. doi:10.1002/2015GC005978
Huang, Z., Wang, L., Zhao, D., Xu, M., Mi, N., Yu, D., et al. (2010). Upper Mantle Structure and Dynamics Beneath Southeast China. Phys. Earth Planet. Interiors. 182, 161–169. doi:10.1016/j.pepi.2010.07.010
Hung, S.-H., Dahlen, F. A., and Nolet, G. (2000). Fréchet Kernels for Finite-Frequency Traveltimes-II. Examples. Geophys. J. Int. 141, 175–203. doi:10.1046/j.1365-246X.2000.00072.x
Hung, S.-H., Dahlen, F. A., and Nolet, G. (2001). Wavefront Healing: A Banana-Doughnut Perspective. Geophys. J. Int. 146, 289–312. doi:10.1046/j.1365-246X.2001.01466.x
Hyndman, R. D. (1979). Poisson's Ratio in the Oceanic Crust - A Review. Tectonophysics 59, 321–333. doi:10.1016/B978-0-444-41851-7.50022-410.1016/0040-1951(79)90053-2
Jiang, Y.-H., Jiang, S.-Y., Dai, B.-Z., Liao, S.-Y., Zhao, K.-D., and Ling, H.-F. (2009). Middle to Late Jurassic Felsic and Mafic Magmatism in Southern Hunan Province, Southeast China: Implications for a Continental Arc to Rifting. Lithos 107, 185–204. doi:10.1016/j.lithos.2008.10.006
Kuo, Y.-W., Wang, C.-Y., Kuo-Chen, H., Jin, X., Cai, H.-T., Lin, J.-Y., et al. (2016). Crustal Structures from the Wuyi-Yunkai Orogen to the Taiwan Orogen: The Onshore-Offshore Wide-Angle Seismic Experiments of the TAIGER and ATSEE Projects. Tectonophysics 692, 164–180. doi:10.1016/j.tecto.2015.09.014
Li, Q., Gao, R., Wu, F. T., Guan, Y., Ye, Z., Liu, Q., et al. (2013). Seismic Structure in the Southeastern China Using Teleseismic Receiver Functions. Tectonophysics 606, 24–35. doi:10.1016/j.tecto.2013.06.033
Li, X.-h. (2000). Cretaceous Magmatism and Lithospheric Extension in Southeast China. J. Asian Earth Sci. 18, 293–305. doi:10.1016/S1367-9120(99)00060-7
Li, X. (2013). Subdivision and Characteristic of Tectonic Units in Fujian Province. Glob. Geol. 32 (3), 549–557. doi:10.1016/j.phymed.2013.01.001
Li, Z.-X., and Li, X.-H. (2007). Formation of the 1300-km-wide Intracontinental Orogen and Postorogenic Magmatic Province in Mesozoic South China: A Flat-Slab Subduction Model. Geol 35, 179. doi:10.1130/G23193A.1
Ligorría, J. P., and Ammon, C. J. (1999). Iterative Deconvolution and Receiver-Function Estimation. Bull. Seismol. Soc. Am. 89, 1395–1400. doi:10.1785/bssa0890051395
Lin, A. T., Watts, A. B., and Hesselbo, S. P. (2003). Cenozoic Stratigraphy and Subsidence History of the South China Sea Margin in the Taiwan Region. Basin Res. 15, 453–478. doi:10.1046/j.1365-2117.2003.00215.x
Lin, J., Xu, T., Cai, H., Lü, Q., Bai, Z., Deng, Y., et al. (2021). Crustal Velocity Structure of Cathaysia Block from an Active-Source Seismic Profile Between Wanzai and Hui'an in SE China. Tectonophysics 811, 228874. doi:10.1016/j.tecto.2021.228874
Liu, Q., Yu, J.-H., Wang, Q., Su, B., Zhou, M.-F., Xu, H., et al. (2012). Ages and Geochemistry of Granites in the Pingtan-Dongshan Metamorphic Belt, Coastal South China: New Constraints on Late Mesozoic Magmatic Evolution. Lithos 150, 268–286. doi:10.1016/j.lithos.2012.06.031
Lou, X., Van Der Lee, S., and Lloyd, S. (2013). AIMBAT: A python/matplotlib Tool for Measuring Teleseismic Arrival Times. Seismological Res. Lett. 84, 85–93. doi:10.1785/0220120033
Ma, Q., Zheng, J., Griffin, W. L., Zhang, M., Tang, H., Su, Y., et al. (2012). Triassic “Adakitic” Rocks in an Extensional Setting (North China): Melts from the Cratonic Lower Crust. Lithos 149, 159–173. doi:10.1016/j.lithos.2012.04.017
Niu, Y., Liu, Y., Xue, Q., Shao, F., Chen, S., Duan, M., et al. (2015). Exotic Origin of the Chinese continental Shelf: New Insights into the Tectonic Evolution of the Western Pacific and Eastern China Since the Mesozoic. Sci. Bull. 60, 1598–1616. doi:10.1007/s11434-015-0891-z
Qiu, X.-F., Zhao, X.-M., Yang, H.-M., Lu, S.-S., Jiang, T., and Wu, N.-W. (2018). Petrogenesis of the Early Palaeozoic Granitoids from the Yunkai Massif, South China Block: Implications for a Tectonic Transition from Compression to Extension During the Caledonian Orogenic Event. Geol. Mag. 155, 1776–1792. doi:10.1017/S0016756817000796
Rychert, C. A., and Harmon, N. (2016). Stacked P ‐to‐ S and S ‐to‐ P Receiver Functions Determination of Crustal Thickness, V P , and V S : The H‐V Stacking Method. Geophys. Res. Lett. 43, 1487–1494. doi:10.1002/2015GL067010
Saikia, U., Das, R., and Rai, S. S. (2017). Possible Magmatic Underplating Beneath the West Coast of India and Adjoining Dharwar Craton: Imprint from Archean Crustal Evolution to Breakup of India and Madagascar. Earth Planet. Sci. Lett. 462, 1–14. doi:10.1016/j.epsl.2017.01.004
Saikia, U., Rai, S. S., Meena, R., Prasad, B. N. V., and Borah, K. (2016). Moho Offsets Beneath the Western Ghat and the Contact of Archean Crusts of Dharwar Craton, India. Tectonophysics 672-673, 177–189. doi:10.1016/j.tecto.2016.02.007
Sambridge, M. (1999). Geophysical Inversion with a Neighbourhood Algorithm-I. Searching a Parameter Space. Geophys. J. Int. 138, 479–494. doi:10.1046/j.1365-246X.1999.00876.x
Schulte-Pelkum, V., and Mahan, K. H. (2014). A Method for Mapping Crustal Deformation and Anisotropy with Receiver Functions and First Results from USArray. Earth Planet. Sci. Lett. 402, 221–233. doi:10.1016/j.epsl.2014.01.050
Svenningsen, L., and Jacobsen, B. H. (2007). AbsoluteS-velocity Estimation from Receiver Functions. Geophys. J. Int. 170, 1089–1094. doi:10.1111/j.1365-246X.2006.03505.x
Tang, C.-C., Zhu, L., Chen, C.-H., and Teng, T.-L. (2011). Significant Crustal Structural Variation across the Chaochou Fault, Southern Taiwan: New Tectonic Implications for Convergent Plate Boundary. J. Asian Earth Sci. 41, 564–570. doi:10.1016/j.jseaes.2010.12.003
Thybo, H., and Artemieva, I. M. (2013). Moho and Magmatic Underplating in Continental Lithosphere. Tectonophysics 609, 605–619. doi:10.1016/j.tecto.2013.05.032
Wang, P. Z., Chen, Y. A., Cao, B. T., Pan, J. D., and Wang, C. Y. (1993). Crust–upper-mantle Structure and Deep Structural Setting of Fujian Province. Geol. Fujian. 12 (2), 79–158.
Wang, S., Zhang, D., Wu, G., Vatuva, A., Di, Y., Yan, P., et al. (2017). Late Paleozoic to Mesozoic Extension in Southwestern Fujian Province, South China: Geochemical, Geochronological and Hf Isotopic Constraints from Basic-Intermediate Dykes. Geosci. Front. 8, 529–540. doi:10.1016/j.gsf.2016.05.005
Wang, Y., Zhang, A., Fan, W., Zhang, Y., and Zhang, Y. (2013). Origin of Paleosubduction-Modified Mantle for Silurian Gabbro in the Cathaysia Block: Geochronological and Geochemical Evidence. Lithos 160-161, 37–54. doi:10.1016/j.lithos.2012.11.004
Wei, Y., Huang, X.-L., Yu, Y., Wang, X., He, P.-L., and Ma, W.-W. (2020). Phanerozoic Magma Underplating Associated with Remelting of the Lower Crust beneath the Cathaysia Block: Evidence from Zircon U Pb Ages and Hf O Isotopes of Granulite Xenoliths from Daoxian, South China. Lithos 368-369, 105596. doi:10.1016/j.lithos.2020.105596
Wessel, P., Smith, W. H. F., Scharroo, R., Luis, J., and Wobbe, F. (2013). Generic Mapping Tools: Improved Version Released. Eos Trans. AGU., 94, 409–410. doi:10.1002/2013EO450001
Wilson, D. C., Angus, D. A., Ni, J. F., and Grand, S. P. (2006). Constraints on the Interpretation ofS-To-Preceiver Functions. Geophys. J. Int. 165, 969–980. doi:10.1111/j.1365-246X.2006.02981.x
Xu, H. L., Ye, C. M., Qiu, X. L., Sun, J. L., and Xia, S. H. (2010). Studies on the Binhai Fault Zone in the Northern South China Sea by the Deep Geophysical Exploration and its Seismogenic Structure. South. China J. Seismol. 30 (S1), 10–18. doi:10.3969/j.issn.1001-8662.2010.z1.003
Ye, Z., Li, Q., Gao, R., Zhang, H., He, R., Wang, H., et al. (2014). A Thinned Lithosphere beneath Coastal Area of southeastern China as Evidenced by Seismic Receiver Functions. Sci. China Earth Sci. 57, 2835–2844. doi:10.1007/s11430-014-4863-y
Yu, Y., Song, J., Liu, K. H., and Gao, S. S. (2015). Determining Crustal Structure Beneath Seismic Stations Overlying a Low-Velocity Sedimentary Layer Using Receiver Functions. J. Geophys. Res. Solid Earth. 120, 3208–3218. doi:10.1002/2014JB011610
Yuan, X., Kind, R., Li, X., and Wang, R. (2006). TheSreceiver Functions: Synthetics and Data Example. Geophys. J. Int. 165, 555–564. doi:10.1111/j.1365-246X.2006.02885.x
Zhan, W. H., Sun, Z. X., Tang, C., Zhu, J. J., and Sun, L. T. (2004). Littoral Active Fault Belt of South China and its Control on Seismic Activity in Taiwan Strait. J. Trop. Oceanogr. 23 (4), 19–24.
Zhang, Y., Kuo-Chen, H., Alvarez-Marron, J., Brown, D., Lin, A. T.-S., Xie, Z., et al. (2020a). Imaging Active Faulting in the Western Taiwan Strait. Sci. Rep. 10, 1–9. doi:10.1038/s41598-020-60666-3
Zhang, Y., Yao, H., Xu, M., and Liu, B. (2020b). Upper Mantle Shear Wave Velocity Structure of Southeastern China: Seismic Evidence for Magma Activities in the Late Mesozoic to the Cenozoic. Geochem. Geophys. Geosyst. 21, 1–15. doi:10.1029/2020GC009103
Zhang, Y., Yao, H., Yang, H.-Y., Cai, H.-T., Fang, H., Xu, J., et al. (2018). 3-D Crustal Shear-Wave Velocity Structure of the Taiwan Strait and Fujian, SE China, Revealed by Ambient Noise Tomography. J. Geophys. Res. Solid Earth. 123, 8016–8031. doi:10.1029/2018JB015938
Zhou, P., Xia, S., Hetényi, G., Monteiller, V., Chevrot, S., and Sun, J. (2020). Seismic Imaging of a Mid-crustal Low-Velocity Layer Beneath the Northern Coast of the South China Sea and its Tectonic Implications. Phys. Earth Planet. Interiors. 308, 106573. doi:10.1016/j.pepi.2020.106573
Zhou, X. M., and Li, W. X. (2000). Origin of Late Mesozoic Igneous Rocks in Southeastern China: Implications for Lithosphere Subduction and Underplating of Mafic Magmas. Tectonophysics 326, 269–287. doi:10.1016/S0040-1951(00)00120-7
Zhou, X., Sun, T., Shen, W., Shu, L., and Niu, Y. (2006). Petrogenesis of Mesozoic Granitoids and Volcanic Rocks in South China: A Response to Tectonic Evolution. Episodes 29, 26–33. doi:10.18814/epiiugs/2006/v29i1/004
Keywords: Fujian, Southeast China, receiver function, H-V stacking, nonlinear inversion, Moho, intracrustal discontinuities, low-velocity mid-to-lower crust
Citation: Goyal A and Hung S-H (2021) Bulk Crustal Properties and Layered Velocity Structure in Fujian, SE China: Constraints From P and S Receiver Functions. Front. Earth Sci. 9:743163. doi: 10.3389/feart.2021.743163
Received: 17 July 2021; Accepted: 06 September 2021;
Published: 15 October 2021.
Edited by:
Mourad Bezzeghoud, Universidade de Évora, PortugalReviewed by:
João Fontiela, University of Evora, PortugalHakan Çinar, Karadeniz Technical University, Turkey
Copyright © 2021 Goyal and Hung. This is an open-access article distributed under the terms of the Creative Commons Attribution License (CC BY). The use, distribution or reproduction in other forums is permitted, provided the original author(s) and the copyright owner(s) are credited and that the original publication in this journal is cited, in accordance with accepted academic practice. No use, distribution or reproduction is permitted which does not comply with these terms.
*Correspondence: Shu-Huei Hung, c2h1bmdAbnR1LmVkdS50dw==