 He Chen
 Guo Li1,2
- 1Broadvision Engineering Consultants, Kunming, China
- 2National Engineering Laboratory for Surface Transportation Weather Impacts Prevention, Kunming, China
Real-time monitoring and early warning have great significance in reducing/avoiding the consequences caused by landslides. The deep displacement-based monitoring method has been proven to be a suitable solution for landslide risk management. However, the early warning indicators based on the deep displacement method need to be fully understood. This paper reports on an investigation into early warning indicators and deformation monitoring of several natural landslides. A series of indicators using the profiles of the accumulative displacement, kinetic energy, and their rates against time for early warning are developed and calibrated by monitoring and analyzing a natural landslide. The early warning indicators are then applied to monitor and identify the different deformation stages of the Jinping County North Landslide and the Wendong Town Landslide.
1 Introduction
Landslides are one of the most damaging and deadly geology hazards that pose a significant threat to human lives, properties, and infrastructures in mountainous terrains. They are responsible for at least 17% of all fatalities by natural hazards (Carla et al., 2017; Fu et al., 2020) and lead to on average hundreds of millions of dollars lost worldwide each year (Zhang C.-C. et al., 2018). Consequently, prediction and mitigation of landslide geohazards have attracted a lot of attention and remain hot issues within the fields of geotechnical engineering and engineering geology (Fu et al., 2017). A reliable early warning system, comprising monitoring indicators, data processing, communication, and dissemination of warnings and community evacuation, is a cost-effective means to alleviate or even avoid economic and fatal consequences by landslides (Intrieri et al., 2012). The early warning indicators (EWIs) aim at characterizing the evolution stages and are keys to determining the release of warnings to the public.
In general, displacement is considered as the most straightforward EWI to recognize instability and to characterize different failure stages (Booth et al., 2013; Kwan et al., 2015). The displacement based EWI can be categorized into two groups in practice: surficial displacement and deep displacement. Thus far, the surficial displacement based EWI is probably the most frequently used method which can be divided into various types (Satio and Uuzawa, 1961), such as strain rate (Satio, 1965; Satio, 1969; Crosta and Aagliardi, 2002), velocity (Hungr et al., 2014), tangential angle (Xu et al., 2011), acceleration (Xu et al., 2011), and work rate. A lot of derivatives (e.g., inverse velocity, normalized dimensionless cumulated displacement) were also developed by mathematical operation for identifying the displacement trends and early warning of movements of landslides (Rose and Hungr, 2007; Cascini et al., 2014; Segalini et al., 2018; Scoppettuolo et al., 2020). Though they have shown abilities in avoiding or minimizing landslide consequences, the surficial displacement based EWIs are unable to obtain the deep movement clearly, especially for the landslides where the ground movement exhibits strong nonlinearity along the depth.
In contrast, the deep displacement method (i.e., monitoring real-time cumulative displacement along depth) has been widely used, for example, to track deformation features of a sliding body (Yin et al., 2010; Bennett et al., 2015), improve understanding of the deformation mechanisms (Simeoni and Mogiovi, 2007), and reveal slip surfaces (Carla et al., 2017) over the last decade. Relevant studies have helped to assess stability of slopes (Tao and Zhou, 2014; Zhang et al., 2021) and provided guidelines for design and construction of supporting devices (Zhang Y. Q. et al., 2018). Thanks to the state-of-the-art techniques on microelectronics, high-performance computers and communication (Bennett et al., 2017; Ha et al., 2018), real-time monitoring of deep displacement has become rather applicable for landslide evaluations and mitigations. Particularly, MEMS (micro-electro-mechanical system) accelerometers are micron devices of high sensitivity used for measuring accelerations whatever they are attached to, and the MEMS-based in-placement inclinometers have been used for continuously acquiring and transmitting the deep displacement data of high precision (Dasenbrock et al., 2012). They can capture the complete pre-failure stages of a landslide from the deformation initiation to catastrophic failure at favorable required intervals (Dasenbrock, 2010; Danisch, 2015). In some landslide prone areas, for example, the Three Gorges Reservoir region, the deep displacement based EWIs has become an irreplaceable solution (Wang, 2009).
The main purpose of this study is to find reliable EWIs based on the deep displacement method through applications and investigations into several real cases. Several EWIs based on the deep displacement method will be developed and compared for distinguishing different stages of landslides. The characteristics of EWIs and the evolutions of the landslides will be reported in detail according to the deep displacement data collected from the established real-time monitoring systems for two natural landslides.
2 Early Warning Indicators
The evolution of a creep-type landslide usually can be divided into three stages, i.e., initial deformation, constant speed deformation, and accelerated deformation, mainly based on the surficial displacement and strain rate measured from laboratory or field tests (Satio, 1965; Xu et al., 2011; Tang et al., 2014; Macciotta et al., 2016; Chen and Jiang, 2020).
Initial deformation stage. A landslide deformation might be initiated due to changes in slope geometry, material properties, and hydrology features. It usually shows a sudden increase in displacement at the initial stage (Voight, 1988). The driving force has not exceeded the peak resistance everywhere along the slip surface at this stage, and therefore the movement may decelerate as the applied external factors become weaker or disappear.
Constant speed deformation stage. If the external triggering is critical and the driving force surpasses the resistance, the materials on the slip surface undergo failure with a dynamic equilibrium because of shear locking and slip strengthening of soils (Scoppettuolo et al., 2020). This leads to a steady increase in displacement until the most soils in the slip surface reach the residual state and a complete slip surface is formed.
Accelerated deformation stage. As the strength of most materials within the slip surface have reduced to the residual, the difference between the driving force and the anti-sliding force increases gradually. Consequently, the acceleration increases, the displacement increases rapidly, and the displacement–time curve can be described by a power function at this accelerated deformation stage. Once a landslide is monitored entering such a stage, an early warning should be released to the public and necessary evacuation or mitigation methods should be taken.
Furthermore, three sub-phases can be characterized in the accelerated deformation stage including the preliminary accelerated, the medium accelerated, and the critical deformation sub-phases (Wang, 2009; Xu et al., 2011). The critical deformation stage is often considered as an independent phase in practice as it is significant for early warning of landslides, as shown in Figure 1.
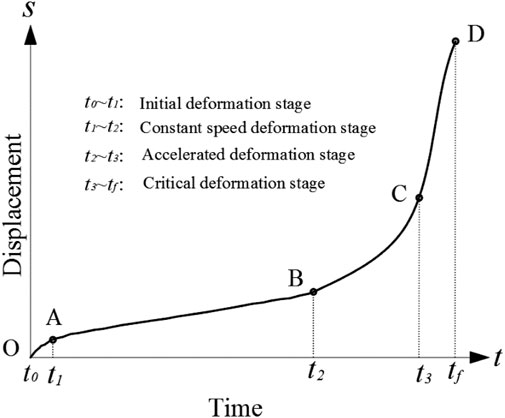
FIGURE 1. Idealized displacement against time characterized by the initial deformation stage, the constant speed deformation stage, the accelerated deformation stage, and the critical deformation stage.
To predict and avoid risks of a landslide, it is of great significance to recognize the above-mentioned deformation stages from the peculiar kinematic features accurately, particularly the critical deformation phase in the accelerated deformation stage (Satio, 1965; Xu et al., 2011). If the critical deformation stage is reached, catastrophic failure may take place with catastrophic consequences and any effective risk mitigation might be impossible.
The four stages can be distinguished through cumulative displacement-time data obtained from either field or experimental monitoring in theory, as conceptually shown in Figure 1. Nevertheless, the actual displacement-time relationship does not perfectly follow the four stages shown in Figure 1. Instead, a realistic case usually shows complex responses to different external factors, such as rainfall, human construction activities, and reservoir water level fluctuation. In the remainder of this section, different EWIs will be introduced with respect to the displacement, kinetic energy, and their rates along the depth for distinguishing the key deformation stages more accurately.
2.1 Cumulative Displacement-Depth Profiles
Accumulated displacement at different depths can be measured through MEMS-based and fiber Bragg grating-based inclinometers, and its profile is able to feature deformation stages and hence is regarded as an EWI based on the deep displacement method. Figure 2 presents typical profiles of accumulative displacement along depth at different times in five sites. These slopes were formed by artificial excavation and composed of soils and/or soft rocks. In order to ensure the safety of highway construction, the deep displacements shown in Figure 2 were monitored by in-placement inclinometers after cracks were observed on slopes. The profiles of accumulative displacement along depth can be classified into five types with respect to the shape, i.e., “D,” “V,” “B,” “r,” and pendulum. In Figures 2A, C, D, with the “D,” “B” and “r” shape, respectively, the profiles of accumulated displacement have significant discontinuity or inflection points, where slip surfaces might have been formed. Therefore, the landslides associated with these cumulative displacement profiles have been experiencing the constant speed or the accelerated deformation stage. In contrast, the profiles presented as “V” and pendulum shape (Figures 2B,E) indicate that the main slip surface has not been formed yet and the corresponding landslides should be at the initial or the constant speed deformation stage.
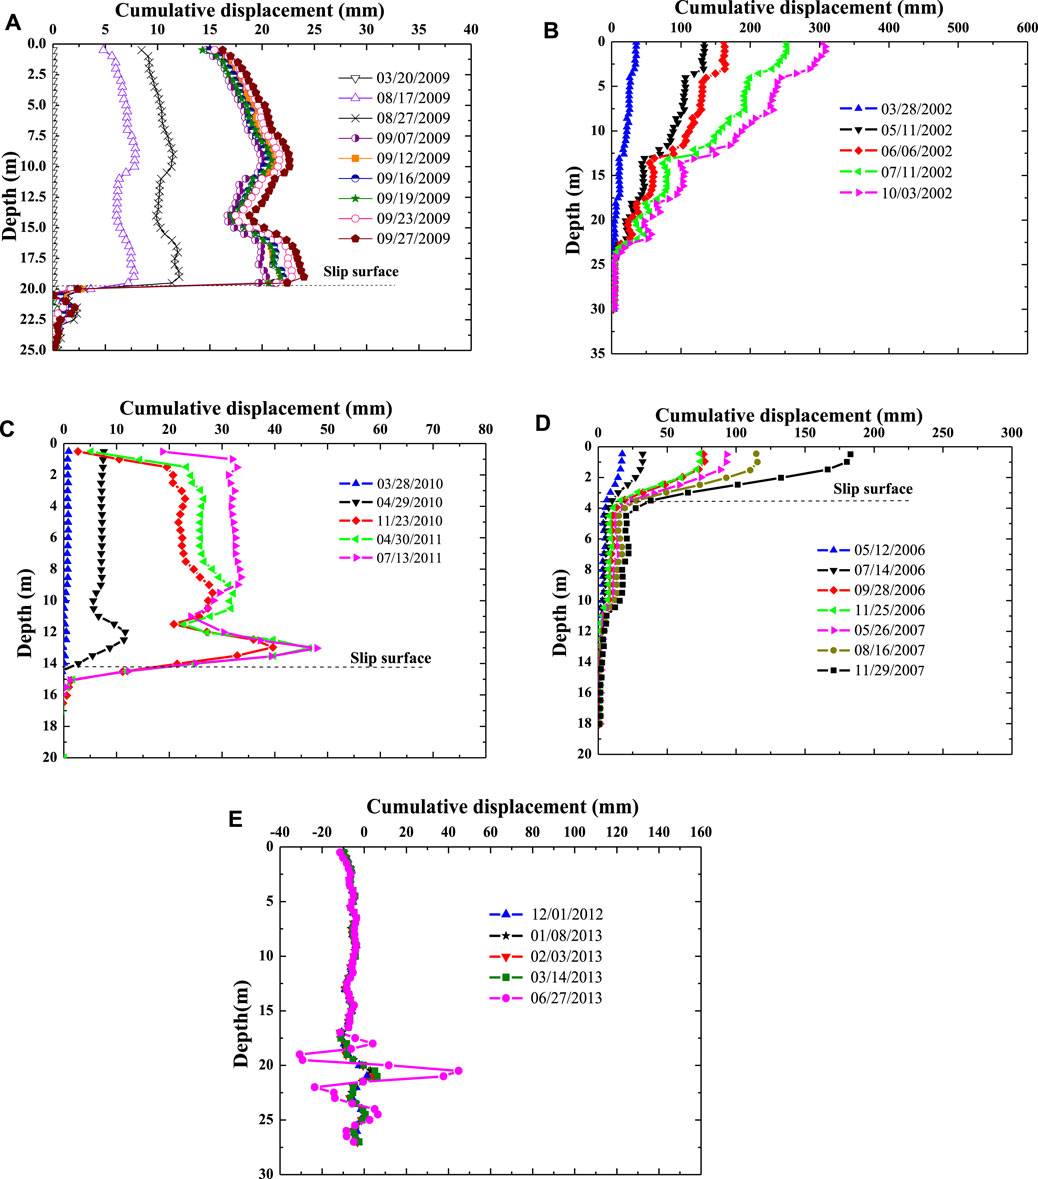
FIGURE 2. Cumulative displacement against depth profiles at different times characterized by. (A) “D” shape, (B) “V” shape, (C) “B” shape, (D) “r” shape, and (E) pendulum obtained from the landslides located in Guangdong-Wuzhou, Beijing-Zhuhai, Guangzhou-Heyuan, Beijing-Zhuhai, Manhao-Jinping Highway, China, respectively.
2.2 Velocities at Different Depths
One derivative EWI from the accumulated displacement profile is its rate profile along the depth, which can be calculated as derivation of the displacement with respect to time. A lot of attention has been paid on the surficial velocity which represents the transient surface movement of a landslide. However, the velocity profiles along the depth can give stakeholders an insight into kinematic feature of a landslide, for example, the slip surface and the sliding volume of a landslide. Theoretically, the velocity increases first and then decreases at the initial deformation stage. At the constant speed deformation stage, the velocity remains constant, and finally it increases gradually when a landslide is at the accelerated deformation stage on the basis of the accelerating creep theory.
2.3 Kinetic Energy and its Rate
A landslide from initiation to global failure in nature is a process of energy transfer, whereby the potential energy of sliding mass and external force work by external triggers (e.g., seismic energy, water level fluctuation energy) transferring into kinetic energy, frictional dissipation, and other types of energy dissipations (e.g., sound and heat). Similar to the accumulated displacement profile, the kinetic energy profile can be an efficient EWI for a landslide and is able to feature different deformation stages in this sense.
As monitoring boreholes within a landslide prone area is limited in practice, it is not able to obtain accurately the kinetic energy of the whole sliding body over a sliding surface. However, the velocity measured from a series of sensors buried in any monitoring borehole can be regarded as an approximate velocity of surrounding sliding mass to some extent. In addition, the kinetic energy of a representative sliding mass centered in a monitoring borehole can be calculated according to the deep displacement data collected by the advanced MEMS-based inclinometer (Figure 3) or other inclinometers.
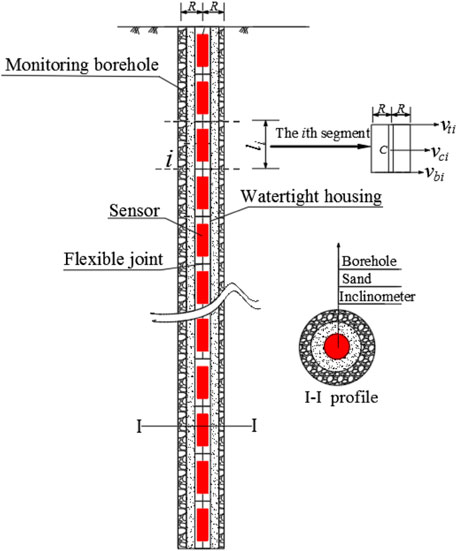
FIGURE 3. MEMS-based in-place inclinometer is composed of a series of MEMS accelerometer sensors separated variously by flexible joints and encased in a watertight housing. The main steps of installation are drilling, putting the MEMS-based in-place inclinometer into the monitoring borehole, backfilling with sand.
In Figure 3, the monitoring borehole is divided into n segments from the top to the bottom based on the monitoring interval of the used inclinometers, with the length of the ith segment denoted by li and the velocity of the ith segment at the top and the bottom by vti and vbi, respectively. Strictly, the kinetic energy Ei of the ith segment can be expressed by:
where mi is the mass, vci is the centroid velocity, and Jc is the moment of inertia of the ith segment. The moment of inertia is calculated by:
The total kinetic energy E of the whole representative sliding mass centered at the borehole is the sum of the kinetic energy of each segment and given by:
The rate of the kinetic energy can be derived from Eq. 3 and given by:
where R is the radius of monitoring the borehole.
3 Evolution of Early Warning Indicators
The Crookston East Landslide with complete deep displacement data collected from the real-time monitoring system based on large range MEMS-based inclinometers will be revisited to illustrate the process of landslides and compare EWIs discussed above.
The Crookston East Landslide is located in downtown Crookston between U.S. Route 2 and Red Lake River in Minnesota, with the sliding mass consisting of granular sediments, clays, and silts from the glacial Lake Agassiz. A deep displacement automatic monitoring system was established mainly using two 36.5-m long MEMS-based SAAs named 4# SAA and 5# SAA, which were installed in late May and early June 2008, respectively, as shown in Figure 4A. More details about the deformation features and the installation of SAAs can be found in Dasenbrock (2010).
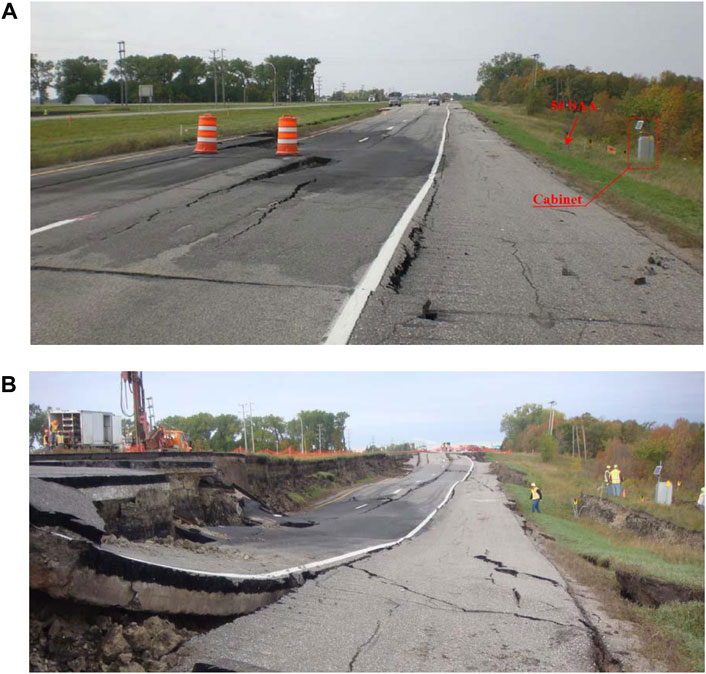
FIGURE 4. Macroscopic deformation (A) before sliding and (B) after sliding. The 5# SAA and 4# SAA are located about 4.57 m upward and downward from the cabinet, respectively (Modified from Dasenbrock, 2010.)
Figure 5 presents the profiles of the cumulative displacement against depth at different times collected from 4# SAA and 5# SAA. It can be determined that the landslide was at the accelerated or critical deformation stage as the accumulative displacement profiles became the “D” shape after September 25, 2008.
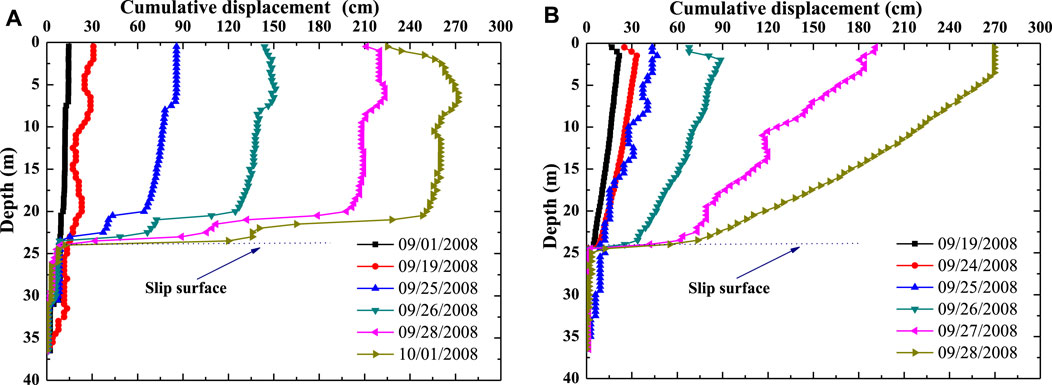
FIGURE 5. Relationships between cumulative displacement and depth at different times measured by (A) 4# SAA and (B) 5# SAA (Modified from Dasenbrock, 2010; Danisch, 2015.)
Figure 6 presents the velocity against the time at the depth of 4.8 and 3.7 m at 4# SAA and 5# SAA, respectively. Obviously, the landslide was at the constant speed deformation stage after the installation of the real-time monitoring system until the arrival of the accelerated deformation stage on September 19th and 18th, respectively, at 4# SAA and 5# SAA. The initial deformation stage, however, is not observed from both figures as the installation of the real-time monitoring system was delayed. Note that the velocity oscillates slightly, especially at the constant speed deformation stage which might be caused by external factors such as rainfall, and change of the river and groundwater levels. The velocity increases rapidly at the stage of accelerated deformation, at nearly 1 m per day, whereby the speed of the landslide changes from very slow to a moderate level according to the velocity classification by the Geological Society of UK (Cruden and Varnes, 1996).
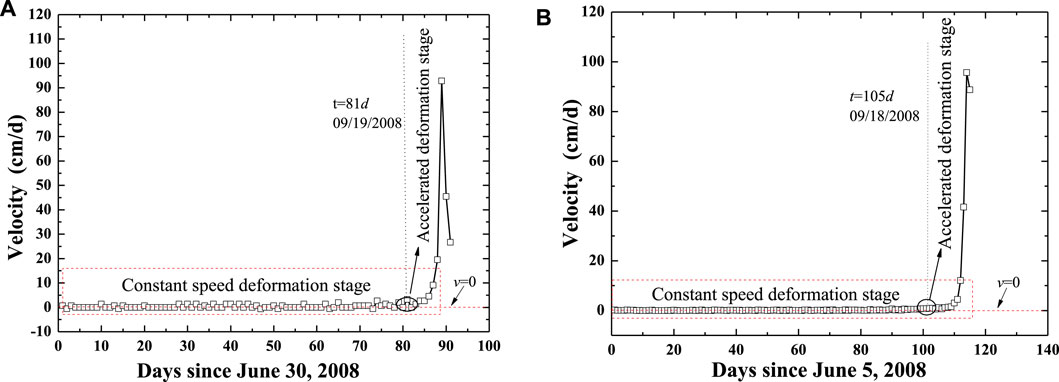
FIGURE 6. Relationships between velocity and time at the depth of 4.8 and 3.7 m based on the deep displacement data collected by (A) 4# SAA and (B) 5# SAA, respectively (Modified from Danisch, 2015).
Figures 7A,B present the evolutions of kinetic energy collected from the two sites and calculated by Eq. 3, while Figures 7C,D provide the kinetic energy rate calculated by Eq. 4. Figures 7A,B show that the kinetic energy increases slowly during the period from September 19th to 25th and then rises rapidly thereafter. Similarly, the rate of kinetic energy shown in Figures 7C,D is slightly greater than zero from September 19th to 25th but increases rapidly thereafter. The observations indicate that September 19th and 25th can be considered as the start date of the accelerated and critical deformation stages, respectively. This is consistent with what we observed from the displacement and velocity profiles.
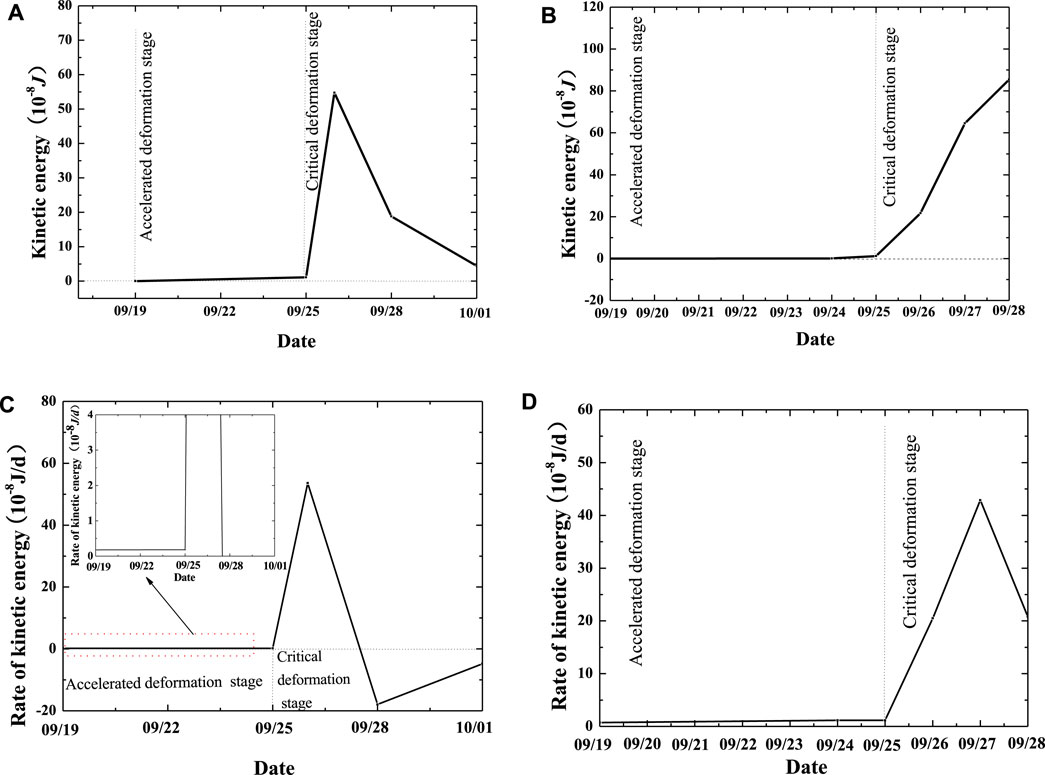
FIGURE 7. Kinetic energy motion during sliding based on the deep displacement: kinetic energy vs time obtained from (A) 4# SAA and (B) 5#SAA; rate of kinetic energy vs time obtained from (C) 4#SAA and (D) 5#SAA.
As a result, on September 25th, a progressive landslide occurred, ripping apart a 152.4-m section of the westbound lanes of U.S. Route 2 and moving them down about 3.048 m, as shown in Figure 4B. These key dates are in good agreement with the observations from the profiles of accumulated displacement, kinetic energy, and their rates collected at the two real-time monitoring sites, verifying the efficiency and applicability of EWIs on avoiding catastrophic consequences by landslides.
4 Application to Early Warning of Landslides
4.1 The Jinping County North Landslide
4.1.1 Site Description
The Jinping County North Landslide is located near the road from Manhao Town to Jinping County, about 45 km north from Jinping County, Yunnan Province, China. As presented in Figure 8, the upper layer of the sliding mass is comprised of quaternary residual silty clay, with an average thickness of 8.5 m. The underlying bedrock is consisted of the layering weathered granite. In between, some broken rocks and soft-plastic silty clays were found at depths of around 20 and 26 m, respectively. According to the cores at different depths obtained from boreholes, these two layers are supposed to be the locations of slip surfaces. A series of cracks at the crown of the landslide were noticed after a construction excavation, which posed a threat to the construction site and infrastructure. Therefore, a real-time monitoring system, mainly including two SAAs, was installed in October 2012 and the deep displacement data were reported at a satisfied interval ensuring the safety of the construction site and infrastructure, as shown in Figure 8.
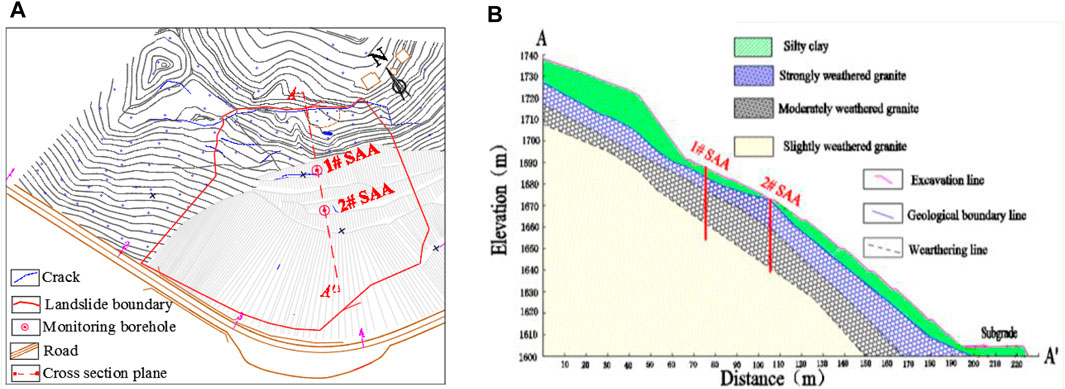
FIGURE 8. (A) Topographic map of the Jinping County North Landslide, the grey lines denote excavation. (B) A-A′ cross-section.
4.1.2 Motion of the Jinping Landslide and Early Warning
Figure 9 presents the profiles of accumulative displacement against depths at different times measured from 1# SAA and 2# SAA. The displacement was accumulated in the upper layer above the depth of approximately 20 and 25.5 m after July 11th, indicating the two major slip surfaces had already been formed. The displacement profiles eventually evolve into a “D” shape after July 2013 as shown in Figure 9, demonstrating that the landslide might be at the accelerated stage or the critical deformation stage.
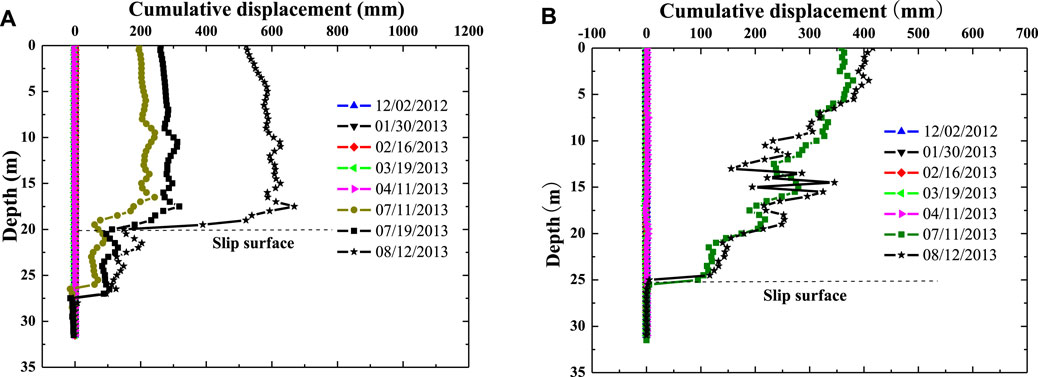
FIGURE 9. Relationships between cumulative displacement and depth at different times. measured by (A) 1# SAA and (B) 2# SAA.
In order to determine the deformation stages accurately, Figure 10 presents the velocity vs time at the depth of 17 m at both sites (1# SAA and 2# SAA). The velocity initially increases and then decreases to almost zero during the first 62 days after the installation of 2# SAA as shown in Figure 10B, which may indicate the landslide was at the initial deformation stage. At the site of 1# SAA, however, the landslide may be at the constant speed deformation stage after the installation of the monitoring system. The different stages revealed at different sites imply the Jinping Landslide was triggered in a progressive manner with the failure concentrated near the 1# SAA site first and propagated gradually to the 2# SAA site. This deformation mechanism is the same with the Zhonghaicun Landside case (Yi et al., 2021). Sliding masses at both sites experience a relatively long period of constant speed deformation–241 and 99 days at 1# SAA and 2# SAA, respectively. Though the deformation was initiated later at 2# SAA, the sliding mass was accelerated earlier than that at 1# SAA. Meanwhile, the average velocity at 2# SAA (with a magnitude over 100 mm/d) is much higher than that at 1# SAA (around 20 mm/d). In contrast, the starting dates for the critical deformation stage at both sites are almost the same. The deformation at 2# SAA came to the critical stage 256 days after the installation of the monitoring system while 5 days later the sliding mass at 1# SAA achieved the critical deformation stage as well. Note that a sudden decrease of velocity can be identified 256 days after the installation of the monitoring system in Figure 10A, indicating some anti-slide measures along the slip surface took effect a bit and stopped the development of deformation for a short time.
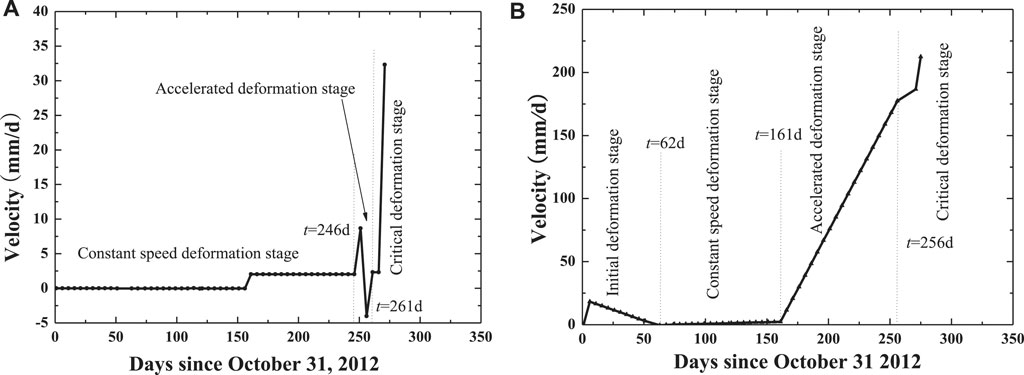
FIGURE 10. Relationships between velocity and time at the depth of 17 m based on the deep displacement data obtained from (A) 1# SAA and (B) 2# SAA.
Figure 11 presents kinetic energy and its rate at both sites based on the deep displacement data. The initial deformation stage is recognized at 2# SAA only, which echoes the finding from Figure 10. During the period of constant speed deformation stage, the kinetic energy is slightly above zero and its rate is almost zero. The accelerated deformation stage begins when the kinetic energy and its rate increase gradually, while the critical deformation stage was achieved when both the kinetic energy and its rate experience an extremely large increase. Note that the start date of the accelerated deformation stage at 1# SAA and 2# SAA are slightly different, but the critical deformation stage occurs at almost the same time, which is also consistent with the observations from Figure 10.
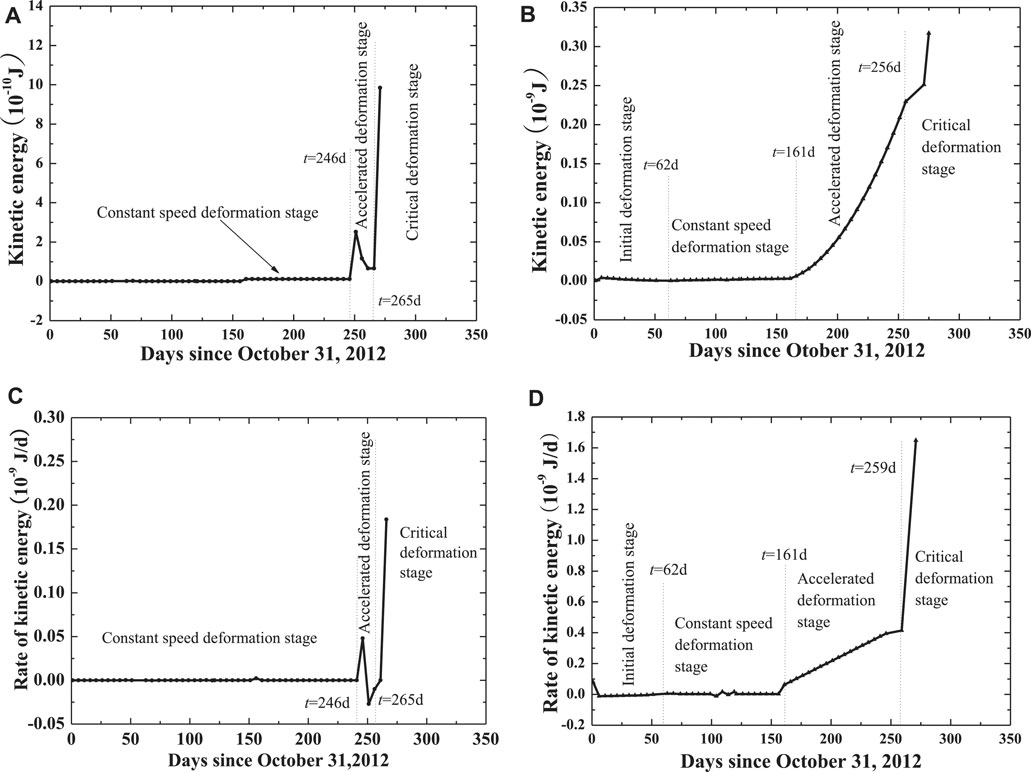
FIGURE 11. Kinetic energy motion based on the deep displacement data: kinetic energy vs time obtained from (A) 1# SAA and (B) 2#SAA; rate of kinetic energy vs time obtained from (C) 1#SAA and (D) 2#SAA.
As feedback from the real-time monitoring system, early warning messages were released to the public and evacuations were acted on before the critical deformation stage. Later, the catastrophic sliding arrived as excepted, but the loss was mitigated for construction sites and infrastructure.
4.2 The Wendong Town Landslide
4.2.1 Site Description
Deep displacement based EWIs have been applied to a recent landslide in Yunnan Province, China. The landslide is located on the right bank of the Chuan River, which comes across a plateau mountain in Wendong Town, Yunnan Province, China. As shown in Figure 12A, the landslide is arc-shaped, with a length of 150 m, a width of 110 m, and an average depth of 7 m. It covers an area of 1.3 × 10⁴ m2 and a volume of 1.3 × 10⁴ m3. The slope angle is 24° on average with respect to the horizontal direction, and the sliding direction is NW16°. The elevation above sea level of the crown edge and the toe of the landslide is 1,210 and 1,110 m, respectively.
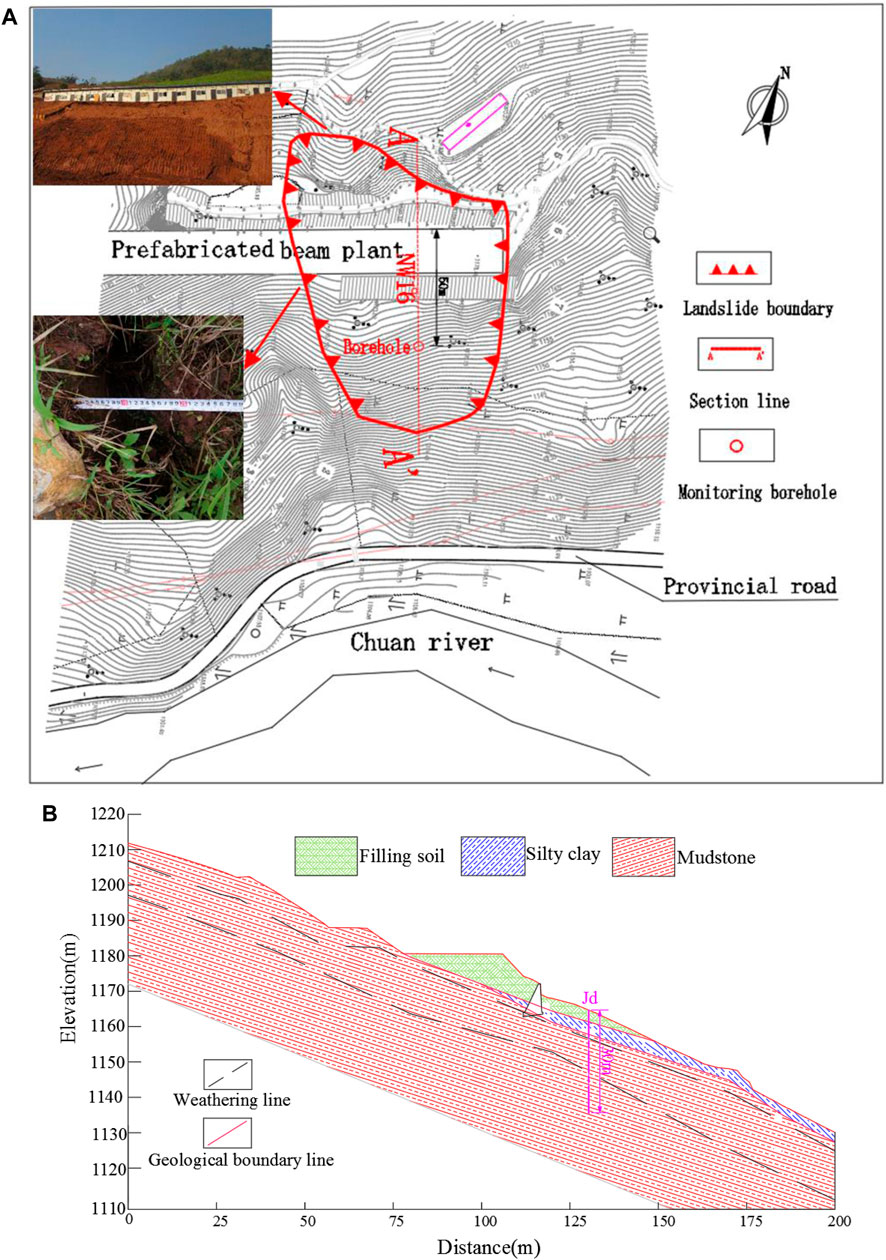
FIGURE 12. The Wendong Town Landslide: (A) topographic map showing landslide boundary, cracks, monitoring borehole, section line, and elements at risk; (B) cross-section along A-A′ showing the silty clay, filling soil, mudstone, and monitoring borehole.
Figure 12B presents a geological cross-section along A-A′. The upper layer is mainly comprised of artificial filling soil and quaternary residual silty clay, with a thickness of 3–9 m, which is underlain by strongly weathered mudstone. In March 2016, some cracks (Figure 12A) were observed especially at the place close to the crest caused mainly by rainfall and excavation and filling construction activities. The slide represents a significant threat to the prefabricated beam plant upslope and the provincial road downslope as shown in Figure 12A. Therefore, a real-time deep displacement monitoring system was installed in April 2016.
4.2.2 Motion of the Wendong Landslide and Early Warning
Figure 13A shows profiles of accumulative displacement against depth at different times obtained from the real-time monitoring system shown in Figure 12. The cumulative displacement decreases almost linearly with the depth before September 16, 2016, showing a “V” shape. After September 16th, however, the increase of displacement near the surface (above 6.5 m in depth) is more significant than that in deep ground, with the shape of profiles becoming “r” shape. Overall, observations on the accumulated displacement profiles indicate that the landslide is primary at the constant speed deformation stage by September 2017.
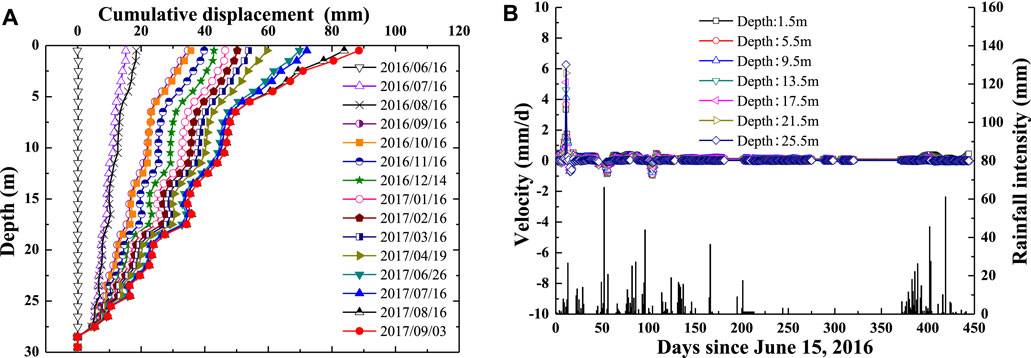
FIGURE 13. (A) Cumulative displacement and (B) velocities at different depths together with the precipitation data during the period obtained from the real-time monitoring system.
Figure 13B presents the velocities at different depths together with the precipitation data during the period. In Figure 13B, the velocities at different depths fluctuate around zero with small amplitudes affected by rainfall. In addition to the rainfall monitored in Figure 13B, the fluctuation of the velocity may be influenced by nearby construction of anti-slide piles and excavation. It should be noted that external factors were insignificant from 175 to 325 days after installation of the monitoring system, and the fluctuation of the velocities almost disappeared. The oscillation came back with the new rain season in 2017. The authors believe that if the temporary increase of displacement is triggered by external factors and can be restricted after triggering events, the landslide is at the constant speed deformation stage, which is the case for the reported Wendong Landslide. This corresponds to the definition of progressive failure where the slope can achieve stable configuration under existing forces (Puzrin and Germanovich, 2005; Zhang et al., 2017).
Figure 14 presents evolution of kinetic energy and its rate of the slide mass during the period after the installation of the monitoring system. It shows that the kinetic energy and its rate fluctuate during the first 120 days after the installation of the monitoring system, which is in good agreement with the findings from Figure 13B. Thereafter, the kinetic energy and its rate remain almost zero, which verifies the landslide is at the constant speed deformation stage. In addition, another important conclusion can be obtained with respect to the early warning indictors: kinetic energy and its rate are able to eliminate partially the interfering information caused by external factors and may prove to be a more reliable EWI.

FIGURE 14. (A) Kinetic energy and (B) its rate based on the deep displacement calculated by Eqs 3, 4, respectively.
Unfortunately, the monitoring equipment was accidently damaged by the construction activities in September 2017 and was unable to monitor the event any longer. Through later visual observations after September 2017, neither the crack width nor the displacement increased after completion of the construction.
5 Discussions
Note that the deep displacement based EWIs discussed in this study can be primarily applied to creeping landslides. The slide mass is often comprised of soils and soft rocks. In contrast, landslides with slide mass composed of stiff soils and hard rocks usually evolve rapidly from initiation to failure. The initial and constant speed deformation stages may be absent with a fast evolution into the ultimate failure. When the EWIs are used for this type of landslide, special measures should be taken to feature the deformation stages and predict failure events.
The deep displacement data obtained from a single borehole may help to understand the deformation stage of a local area, but does not usually represent the stage of the entire landslide. In most cases, slope failure is somewhat progressive and hence different locations may hold different deformation stages (Crosta et al., 2017). Consequently, if a warning system is formulated based on constant speed or accelerated deformation stage, information obtained at different boreholes may generate contradictory messages. However, a system in terms of the critical deformation stage can most likely produce universal assessment result of the slope status even at different monitoring locations, as in the cases of the Jinping County North Landslide and Xintan Landslide (Wang, 2009).
The EWIs are mainly based on accumulative displacement. However, the accumulative displacement might be various at different depths mainly because of the complex terrain and geological setting, as shown in Figure 15. Hence, the displacement or its rates against time obtained at a fixed depth, for example, at the surface, may not represent the actual slope status, especially when multiple slip surfaces are present. The total kinetic energy and its rate have an obvious advantage in describing status of a slope more accurately as they are integrated from the top to the bottom of the monitoring borehole.
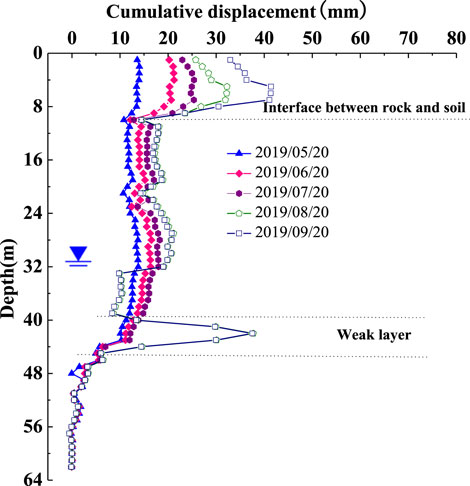
FIGURE 15. Relationships between cumulative displacement and time obtained from a landslide composed of multi-layer sliding zones. The data was measured by the MEMS-based in-placement inclinometer.
Though the profiles of the displacement and its rate can distinguish the first two deformation stages, they may fail to identify the accelerated and critical deformation stages, as in the Crookston East Landslide case. In contrast, the kinetic energy and its rate can identify the last two stages clearly.
Another difficulty that has often been encountered in landslide monitoring is the interference of the external factors such as rainfall, human construction activities, groundwater level change, and snowmelt. They may temporarily accelerate a landslide in local areas, for example, the deformation affected region by rainfall infiltration is usually 2–5 m in depth (Bittelli et al., 2012; Askarinejad et al., 2018). This local failure, which may not cause consequences to a construction site and nearby infrastructure, can be weakened or excluded by using the kinetic energy and its rate based EWIs, as in the Wendong Town Landslide case.
It must be mentioned that magnitudes of displacement and its rate might be significantly different at four deformation stages and among different cases ranging from several millimeters to hundreds of millimeters per year (Kwan et al., 2015; Scoppettuolo et al., 2020) so that it is difficult to define a universal threshold for indicating the critical state of a slope. Nevertheless, it is recognized that definition of thresholds for different alert levels is significant in an automatic monitoring and early warning system. For this purpose, it is evident from the study that a useful smoothing technique is required to filter displacement and velocity data beforehand because perturbations accompanied decisively delay the identification of onset of acceleration (Carla et al., 2017). Afterward, it is noteworthy that a universal threshold of EWIs cannot define, whereas the striking features of EWIs at different deformation stages have been distinguished in the study and can be characterized by mathematical parameters quantitatively in the future, for example, tangent angle and relative slope. The magnitudes of these parameters obtained in real time monitoring can be used to define thresholds. It is generally accepted that the normalized dimensionless method is a powerful tool for providing insight into trends without effects of magnitude. The EWI data can also be normalized with respect to the well-documented values of similar landslides and preset the thresholds of EWIs for early warning. Moreover, the kinetic energy of a sliding mass above the slip surface that has been revealed may be deduced according to the principle of the conservation of energy. The relationship between kinetic energy and displacement therefore can be established and an attempt to define the thresholds of the critical state can be made.
6 Conclusion
Landslide is a common geological disaster, which may pose a great threat to human lives and nearby infrastructures and livelihoods. Real-time monitoring and early warning are thus of great significance in reducing/avoiding the consequences caused by landslides. This study has presented an approach for early warning of landslides based on the deep displacement theory. A series of early warning indicators including profiles of the accumulative displacement, kinetic energy, and their rates against depth were developed to feature the deformation stages of landslides. In the light of the deep displacement data collected from the real-time monitoring system of one typical landslide, the characteristics of the early warning indicators during the whole sliding processes were analyzed and the evolutions of landslides at different deformation stages were described. The proposed method was then applied to analyze the Jinping County North Landslide and the Wendong Town Landslide located in Plateau Mountain, Yunnan Province, China. The following conclusions can be made from this study:
1) The proposed early warning indicators can distinguish the four deformation stages and recognize the critical state for issuing early warning information. As a new early warning indicator integrated from the surface to the deep ground, the profile of kinetic energy and its rate can identify the different deformation stages more accurately than other early warning indicators, which can especially be applied to the landslides whose deformation is inconsistent with depth.
2) When a landslide comes into the accelerated deformation stage from the constant speed deformation stage, the velocity of sliding mass increases suddenly, the kinetic energy and its rate increase gradually. The early warning indicators including velocity, kinetic energy, and rate of kinetic energy increase rapidly at the critical deformation stage.
3) The EWIs using the profile of kinetic energy and its rate proposed in this paper can distinguish the deformation stages of landslides and exclude insignificant local movement by the temporary external factors such as rainfall and human construction activities.
This study has presented an investigation into early warning indicators based on the deep displacement for identifying the evolution stages of landslides. It is indeed the first step for the design and the implementation of an early warning system operational at a slope scale. The features of profiles of the accumulative displacement, kinetic energy, and their rates against time will be discussed and compared when further monitoring data on the critical state of landslides with different geological configurations are available in the future. Additional work on the determination of thresholds will be conducted probably by the suitable mathematical approaches.
Data Availability Statement
The original contributions presented in the study are included in the article/Supplementary Material, further inquiries can be directed to the corresponding author.
Ethics Statement
Written informed consent was obtained from the (individual(s) AND/OR minor(s) legal guardian/next of kin) for the publication of any potentially identifiable images or data included in this article.
Author Contributions
HC, GL and RF conceived and designed the research plan. HC, GL, and MZ developed the MEMS-based in-placement inclinometer and performed the monitoring and early warning of landslides. HC wrote the paper.
Funding
The research was funded by National Key R&D Program of China with Grant NO. 2018YFC1504906, the Science and Technology Demonstration Project of Ministry of Transport, PRC with Grant No. 2017-09, Science and Technology Project of Yunnan Province Transportation Department with Grant No. (2017)33.
Conflict of Interest
Authors HC, GL, RF and MZ were employed by the company Broadvision Engineering Consultants.
Publisher’s Note
All claims expressed in this article are solely those of the authors and do not necessarily represent those of their affiliated organizations, or those of the publisher, the editors and the reviewers. Any product that may be evaluated in this article, or claim that may be made by its manufacturer, is not guaranteed or endorsed by the publisher.
Acknowledgments
We would like to acknowledge the reviewers and the editors for their comments and suggestions.
References
Askarinejad, A., Akca, D., and Springman, S. M. (2018). Precursors of Instability in a Natural Slope Due to Rainfall: A Full-Scale experiment. Landslides 15 (9), 1745–1759. doi:10.1007/s10346-018-0994-0
Bennett, V., Abdoun, T., and Barendse, M. (2015). Evaluation of Soft Clay Field Consolidation Using MEMS-Based In-Place Inclinometer-Accelerometer Array. Geotechnical Test. J. 38 (3), 290–302. doi:10.1520/gtj20140048
Bennett, V., Abdoun, T., O’Meara, K., Barendse, M., and Zimmie, T. (2017). “Wireless MEMS-Based In-Place Inclinometer-Accelerometer Array for Real-Time Geotechnical Instrumentation,” in Engineering Geology and Geological Engineering for Sustainable Use of the Earth’s Resources, Urbanization and Infrastructure Protection from Geohazards-Proceedings of the 1st GeoMEast International Congress and Exhibition, Egypt 2017 on Sustainable Civil Infrastructures. Editors J. Wasowski, D. Giordan, and P. Lollino (Cham: Springer), 90–100. doi:10.1007/978-3-319-61648-3_6
Bittelli, M., Valentino, R., Salvatorelli, F., and Rossi Pisa, P. (2012). Monitoring Soil-Water and Displacement Conditions Leading to Landslide Occurrence in Partially Saturated Clays. Geomorphology 173-174, 161–173. doi:10.1016/j.geomorph.2012.06.006
Booth, A. M., Lamb, M. P., Avouac, J.-P., and Delacourt, C. (2013). Landslide Velocity, Thickness, and Rheology from Remote Sensing: La Clapière Landslide, France. Geophys. Res. Lett. 40 (16), 4299–4304. doi:10.1002/grl.50828
Carlà, T., Intrieri, E., Di Traglia, F., Nolesini, T., Gigli, G., and Casagli, N. (2017). Guidelines on the Use of Inverse Velocity Method as a Tool for Setting Alarm Thresholds and Forecasting Landslides and Structure Collapses. Landslides 14 (2), 517–534. doi:10.1007/s10346-016-0731-5
Cascini, L., Calvello, M., and Grimaldi, G. M. (2014). Displacement Trends of Slow-Moving Landslides: Classification and Forecasting. J. Mt. Sci. 11 (3), 592–606. doi:10.1007/s11629-013-2961-5
Chen, M. X., and Jiang, Q. H. (2020). An Early Warning System Integrating Time-Of-Failure Analysis and Alert Procedure for Slope Failures. Eng. Geol. 272, 1–11. doi:10.1016/j.enggeo.2020.105629
Crosta, G. B., and Agliardi, F. (2002). How to Obtain Alert Velocity Thresholds for Large Rockslides. Phys. Chem. Earth, Parts A/B/C 27 (36), 1557–1565. doi:10.1016/s1474-7065(02)00177-8
Crosta, G. B., Agliardi, F., Rivolta, C., Alberti, S., and Dei Cas, L. (2017). Long-Term Evolution and Early Warning Strategies for Complex Rockslides by Real-Time Monitoring. Landslides 14 (5), 1615–1632. doi:10.1007/s10346-017-0817-8
Cruden, D. M., and Varnes, D. J. (1996). Landslide Types and Processes. Washington, DC: Transportation Research Board, U.S. National Academy of Sciences.
Danisch, L. (2015). ShapeAccelArray (SAA). Measurand. Available at: https://measurand.com (Accessed September 7, 2017).
Dasenbrock, D. (2010). “Automated Landslide Instrumentation Programs on US Route 2 in Crookston, MN,” in Proceedings of the Annual Conference of the Minnesota Geotechnical Society, Minnesota, February 26, 2010. Editors J. F. Labuz, and M. L. Nutzmann (Minnesota), 165–185.
Dasenbrock, D., Levesque, C. L., and Danisch, L. (2012). “Long-term Rate Behavior Monitoring Using Automated MEMS-Based Sensing Arrays in an Urban Landslide Environment,” in Proceedings of the 11th International Symposium on Landslides (ISL) and the 2nd North American Symposium on Landslides, Alberta, Canada, June 2–8.
Fu, X., Sheng, Q., Du, W., Mei, H., Chen, H., and Du, Y. (2020). Evaluation of Dynamic Stability and Analysis of Reinforcement Measures of a Landslide under Seismic Action: A Case Study on the Yanyangcun Landslide. Bull. Eng. Geol. Environ. 79, 2847–2862. doi:10.1007/s10064-020-01745-7
Fu, X., Sheng, Q., Zhang, Y., Chen, J., Zhang, S., and Zhang, Z. (2017). Computation of the Safety Factor for Slope Stability Using Discontinuous Deformation Analysis and the Vector Sum Method. Comput. Geotech. 92, 68–76. doi:10.1016/j.compgeo.2017.07.026
Ha, D. W., Kim, J. M., Kim, Y., and Park, H. S. (2018). Development and Application of a Wireless MEMS-Based Borehole Inclinometer for Automated Measurement of Ground Movement. Autom. Constr. 87, 49–59. doi:10.1016/j.autcon.2017.12.011
Hungr, O., Leroueil, S., and Picarelli, L. (2014). The Varnes Classification of Landslide Types, an Update. Landslides 11 (2), 167–194. doi:10.1007/s10346-013-0436-y
Intrieri, E., Gigli, G., Mugnai, F., Fanti, R., and Casagli, N. (2012). Design and Implementation of a Landslide Early Warning System. Eng. Geol. 147–148, 124–136. doi:10.1016/j.enggeo.2012.07.017
Kwan, J. S. H., Chan, M. H. C., and Shum, W. W. L. (2015). A Review of Slope-specific Early-Warning Systems for Rain-Induced Landslides. Geo report NO.316.
Macciotta, R., Martin, C. D., Morgenstern, N. R., and Cruden, D. M. (2016). Development and Application of a Quantitative Risk Assessment to a Very Slow Moving Rock Slope and Potential Sudden Acceleration. Landslides 13 (4), 765–785. doi:10.1007/s10346-015-0609-y
Puzrin, A. M., and Germanovich, L. N. (2005). The Growth of Shear Bands in the Catastrophic Failure of Soils. Proc. R. Soc. A. 461, 1199–1228. doi:10.1098/rspa.2004.1378
Rose, N. D., and Hungr, O. (2007). Forecasting Potential Rock Slope Failure in Open Pit Mines Using the Inverse-Velocity Method. Int. J. Rock Mech. Mining Sci. 44 (2), 308–320. doi:10.1016/j.ijrmms.2006.07.014
Satio, M. (1965). “Forecasting the Time of Occurrence of a Slope Failure,” in Proceedings of the 6th International Conference on Soil Mechanics and Foundation Engineering, Montrea, September 8–15.
Satio, M. (1969). “Forecasting Time of Slope Failure by Tertiary Creep,” in Proceedings of the 7th International Conference on Soil Mechanics and Foundation Engineering, Mexico, August 25–29, 1969 (Sociedad Mexicana de Mecanicade Suelos).
Satio, M., and Uuzawa, H. (1961). “Failure of Soil Due to Creep,” in Proceeding 5th International Conference on Soil Mechanics and Foundation Engineering, Paris, July.
Scoppettuolo, M. R., Cascini, L., and Babilio, E. (2020). Typical Displacement Behaviours of Slope Movements. Landslides 17 (5), 1105–1116. doi:10.1007/s10346-019-01327-z
Segalini, A., Valletta, A., and Carri, A. (2018). Landslide Time-Of-Failure Forecast and Alert Threshold Assessment: A Generalized Criterion. Eng. Geol. 245, 72–80. doi:10.1016/j.enggeo.2018.08.003
Simeoni, L., and Mongiovì, L. (2007). Inclinometer Monitoring of the Castelrotto Landslide in Italy. J. Geotech. Geoenviron. Eng. 133 (6), 653–666. doi:10.1061/(asce)1090-0241(2007)133:6(653)
Tang, H., Hu, X., Xu, C., Li, C., Yong, R., and Wang, L. (2014). A Novel Approach for Determining Landslide Pushing Force Based on Landslide-Pile Interactions. Eng. Geology. 182, 15–24. doi:10.1016/j.enggeo.2014.07.024
Tao, L. N., and Zhou, X. P. (2014). Slope Stability Analysis Method Based on Deep Displacement Monitoring. Electron. J. Geotechnical Eng. 19, 6645–6662.
Voight, B. (1988). A Method for Prediction of Volcanic Eruptions. Nature 332 (6160), 125–130. doi:10.1038/332125a0
Wang, S. (2009). “Time Prediction of the Xintan Landslide in Xiling Gorge, the Yangtze River,” in Landslide Disaster Mitigation in Three Gorges Reservoir China. Editors F. W. Wang, and T. L. Li (Berlin, Heidelberg: Springer), 411–431. doi:10.1007/978-3-642-00132-1_18
Xu, Q., Yuan, Y., Zeng, Y., and Hack, R. (2011). Some New Pre-Warning Criteria for Creep Slope Failure. Sci. China Technol. Sci. 54, 210–220. doi:10.1007/s11431-011-4640-5
Yi, X., Feng, W., Bai, H., Shen, H., and Li, H. (2021). Catastrophic Landslide Triggered by Persistent Rainfall in Sichuan, China: August 21, 2020, Zhonghaicun Landslide. Landslides 18 (8), 2907–2921. doi:10.1007/s10346-021-01701-w
Yin, Y., Wang, H., Gao, Y., and Li, X. (2010). Real-Time Monitoring and Early Warning of Landslides at Relocated Wushan Town, the Three Gorges Reservoir, China. Landslides 7 (3), 339–349. doi:10.1007/s10346-010-0220-1
Zhang, C.-C., Zhu, H.-H., Liu, S.-P., Shi, B., and Zhang, D. (2018). A Kinematic Method for Calculating Shear Displacements of Landslides Using Distributed Fiber Optic Strain Measurements. Eng. Geol. 234, 83–96. doi:10.1016/j.enggeo.2018.01.002
Zhang, L., Wang, X., Xia, T., Yang, B., and Yu, B. (2021). Deformation Characteristics of Tianjiaba Landslide Induced by Surcharge. Int. J. Geo Inform. 10 (4), 221. doi:10.3390/ijgi10040221
Zhang, W., Wang, D., Randolph, M. F., and Puzrin, A. M. (2017). From Progressive to Catastrophic Failure in Submarine Landslide with Curvilinear Geometries. Géotechnique 67 (12), 1104–1119. doi:10.1680/jgeot.16.P.249
Keywords: deep displacement, real-time monitoring, early warning indicator, landslide, kinetic energy
Citation: Chen H, Li G, Fang R and Zheng M (2021) Early Warning Indicators of Landslides Based on Deep Displacements: Applications on Jinping Landslide and Wendong Landslide, China. Front. Earth Sci. 9:747379. doi: 10.3389/feart.2021.747379
Received: 26 July 2021; Accepted: 25 August 2021;
Published: 01 November 2021.
Edited by:
Min Wang, Los Alamos National Laboratory (DOE), United StatesReviewed by:
Haijun Hu, Northwest A and F University, ChinaYi Rui, Tongji University, China
Gaetano Pecoraro, University of Salerno, Italy
Copyright © 2021 Chen, Li, Fang and Zheng. This is an open-access article distributed under the terms of the Creative Commons Attribution License (CC BY). The use, distribution or reproduction in other forums is permitted, provided the original author(s) and the copyright owner(s) are credited and that the original publication in this journal is cited, in accordance with accepted academic practice. No use, distribution or reproduction is permitted which does not comply with these terms.
*Correspondence: He Chen, Y2hlbmhlXzIwMDlAMTYzLmNvbQ==