 Pengju He1*
 Chunhui Song
 Yadong Wang
 Yihu Zhang
 Qingquan Meng
- 1School of Earth Sciences and Key Laboratory of Mineral Resources in Western China, Lanzhou University, Lanzhou, China
- 2Northwest Institute of Eco-Environment and Resources, Chinese Academy of Sciences and Key Laboratory of Petroleum Resources, Lanzhou, China
The Cenozoic tectonic evolution of the North Qaidam-Qilian Shan fold-thrust belt in the northern Tibetan Plateau is important to understanding the tectonic rejuvenation of orogeny and growth of the plateau. However, the deformation processes in this region remain controversial. This study presents new apatite fission track (AFT) data from Paleogene strata in the northern Qaidam Basin to investigate the time of deformation in this site. Thermal modeling of these partially annealed detrital AFT ages shows a thermal history with a noticeable transition from heating to cooling after ∼10 Ma. This transition is attributed to the intensified thrusting and folding of the northern Qaidam Basin since ∼10 Ma. Integrated with published tectonics and thermochronology results, we suggest the North Qaidam-Qilian Shan fold-thrust belt experienced prevailing tectonism since the late Miocene.
Introduction
Tibetan Plateau is an ideal region for studying the uplift of plateau and deformation of continents (Molnar et al., 1993; Yin and Harrison, 2000; Tapponnier et al., 2001; Royden et al., 2008; Wang et al., 2008; Fang et al., 2020). The North Qaidam-Qilian Shan fold-thrust belt (NQQB) comprises the northern Tibetan Plateau (Figure 1), intensely deformed during the Cenozoic as a result of the remote response to Indian-Asian plate collision (Fang et al., 2005, 2007; Yin et al., 2008; Zheng et al., 2010; Zhuang et al., 2011, 2018; He et al., 2020, 2021). The evolution of Cenozoic deformation in the NQQB is thus crucial for understanding the growth of the Tibetan Plateau and the re-activation of ancient orogenic belts. However, the starting time and the spatial-temporal migration of deformation in the NQQB in Cenozoic is still controversial. Many sedimentology and thermochronology records indicate the deformation in this region commenced at the middle-late Miocene (Zheng et al., 2010, 2017; Wang et al., 2017, 2020; An et al., 2018; Pang et al., 2019a; Yu et al., 2019a), while evidence for the Eocene deformation is well accepted (Yin et al., 2008; Zhuang et al., 2011, 2018; Jian et al., 2018; Lin et al., 2019; Cheng et al., 2019; He et al., 2020, 2021). The development of deformation in the NQQB is proposed to from the south to north (Zhuang et al., 2011; Qi et al., 2016), from the center to the south and north synchronous (Zheng et al., 2017; Pang et al., 2019a), or out-of-sequence deformation (Li et al., 2020; He et al., 2021). One of the main reasons for these controversies is the complicated structure of the NQQB but current age constraints for deformation limited to sparse sites. Therefore, more time records of tectonic deformation at crucial site in the NQQB is imperative.
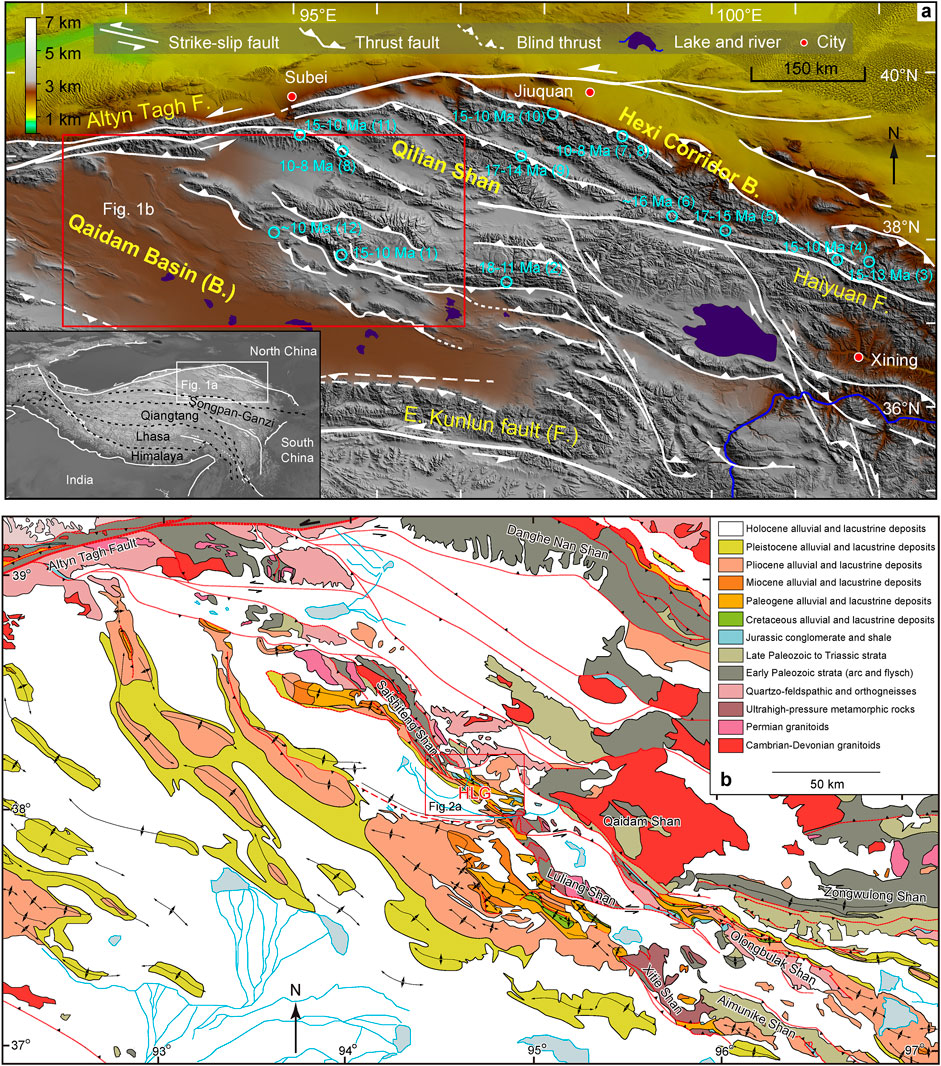
FIGURE 1. Geologic setting of the study area. (A) Digital elevation model of the North Qaidam-Qilian Shan fold-thrust belt, showing the location, geomorphology, and tectonic framework. The ages and sites of published Miocene rapid exhumation events that from thermochronological data are present. The sources of these data are as follows: (1) Meng et al. (2020); (2) Pang et al. (2019a); (3) Wang et al. (2020); (4) Li et al. (2019); (5) Yu et al. (2019b); (6) Li et al. (2020); (7) Zheng et al. (2010); (8) Zhuang et al. (2018); (9) Zheng et al. (2017); (10) Pang et al. (2019b); (11) Yu et al. (2019a); and (12) this study. (B) Geologic map of the northern Qaidam Basin (modified from Yin et al., 2008), showing locations of the sampled section (Hongliugou, HLG).
In this study, we present new apatite fission track (AFT) data from Paleogene strata in the northern Qaidam Basin. Thermal modeling of these partially annealed detrital AFT ages indicates the northern Qaidam Basin experienced intensified thrusting and folding since ∼10 Ma, which provide ages constraints for tectonism in the southernmost NQQB. Combined with published data, this result permits we discuss the evolution of deformation in the northern Tibetan Plateau in the Cenozoic.
Geological Setting
The NQQB is located in the northern Tibetan Plateau. It is an early Paleozoic collisional orogenic belt and experienced multi-phase tectonic rejuvenation along the ancient structure boundary during the Mesozoic-Cenozoic (Yin and Harrison, 2000). Rocks in the NQQB consist of Proterozoic-Paleozoic plutonic bodies and arc magmatic rocks, ultrahigh-pressure metamorphic and low- to high-grade metamorphic rocks, ophiolitic mélange, oceanic carbonate rocks and flysch sequences, and Mesozoic-Cenozoic nonmarine sedimentary rocks (Gansu Geologic Bureau, 1989; Gehrels et al., 2003). Many Cenozoic sedimentary basins (e.g., the Hexi corridor Basin bounded northeast and the Qaidam Basin bounded southwest) surrounding this fold-thrust belt have a modern altitude difference in 1,500–3,000 m between the source and sinks (Zhuang et al., 2011; Li et al., 2014). Two major faults of the Tibetan Plateau impact the NQQB, the Altyn Tagh Fault that bounded northwest and the Haiyuan Fault that through east of the NQQB (Taylor and Yin, 2009) (Figure 1).
The Qaidam Basin connects to the southwest of the NQQB and have Cenozoic sediments with thickness about 12,000 m in the depocenter (Meng and Fang, 2008). Cenozoic strata of the Qaidam Basin consist of nonmarine Lulehe Formation (Fm.), Xiaganchaigou Fm., Shangganchaigou Fm., Xiayoushashan Fm., Shangyoushashan Fm., Shizigou Fm., and Qigequan Fm., from the oldest to the youngest (Meng and Fang, 2008; Yin et al., 2008). The northern Qaidam Basin have Cenozoic sediments over 5,000 m, probably sourced from the Qilian Shan (Zhuang et al., 2011; Cheng et al., 2019). In the late Cenozoic, the northern Qaidam Basin deformed intensely and was involved in the Qilian Shan fold-thrust belt (Yin et al., 2008). The studied Hongliugou (HLG) section in the northern Qaidam Basin exposed strata from the Lulehe Fm. to the Shizigou Fm. successively (Figure 2). We focus on the older Lulehe Fm. and Xiaganchaigou Fm., which mainly consist of alluvial fan-fan deltaic conglomerate and sandstone in the Lulehe Fm. and fluvial-lacustrine sandstone and mudstone in the Xiaganchaigou Fm. (Fang et al., 2019; He et al., 2021). The sedimentary source of these two formations is traced to the NQQB (He et al., 2021).
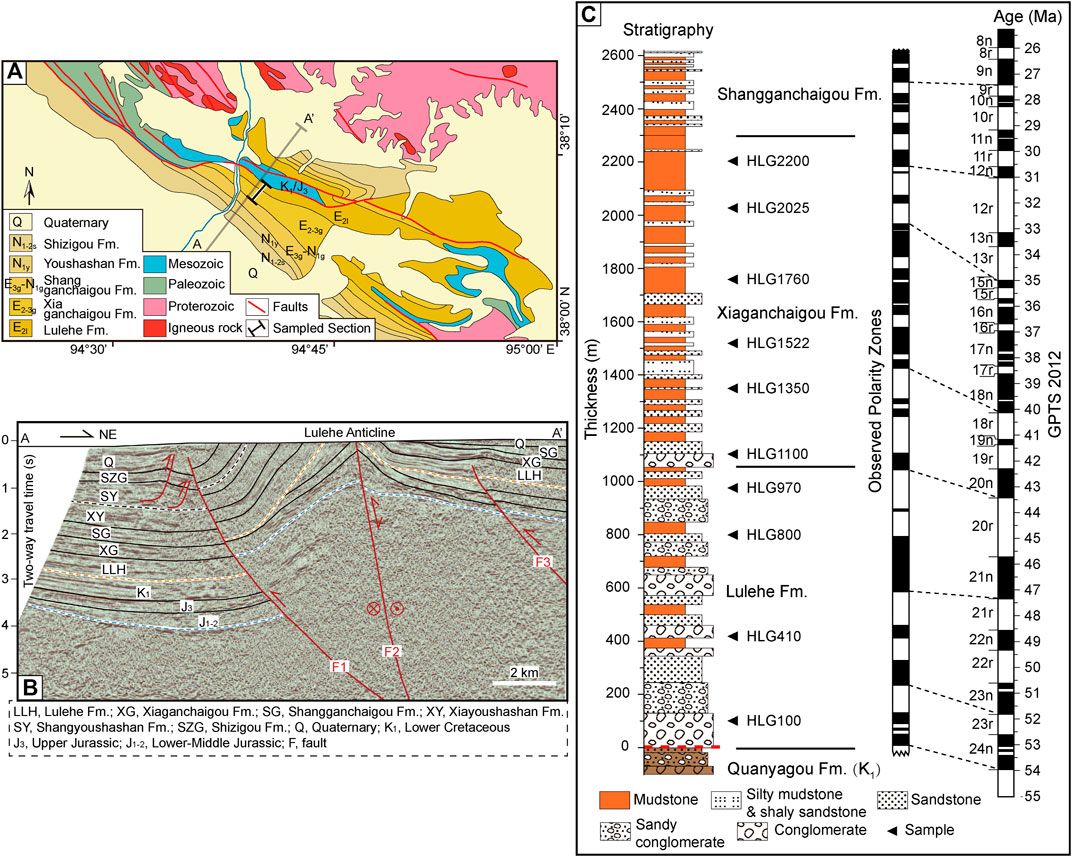
FIGURE 2. Stratigraphy, lithology, and geochronology of the sampled section. (A) Geologic map of the HLG section and its vicinity (modified from Zhang, 2006). Locations of the sampled section (Figure 2C) and the seismic profile (Figure 2B) are labelled. (B) Seismic profile with geological interpretations across the HLG area (Zhang et al., 2020). (C) Stratigraphic column and magnetostratigraphy (Fang et al., 2019) of the sampled strata with detailed AFT sample positions. GPTS: geomagnetic polarity time scale.
The precise Cenozoic stratigraphic chronology of the Qaidam Basin is controversial. There are two standpoints, one suggests an early Eocene age for the basal Lulehe Fm. (Sun et al., 2005; Meng and Fang, 2008; Yin et al., 2008; Ji et al., 2017), another suggests a late Oligocene or early Miocene age (Wang et al., 2017; Nie et al., 2019). The stratigraphic chronology of the Lulehe Fm. and Xiaganchaigou Fm. in the HLG section were precisely measured by magnetostratigraphy of Fang et al. (2019), given ages of 54–43.5 Ma for the Lulehe Fm. and 43.5–30 Ma for the Xiaganchaigou Fm. (see details in Fang et al., 2019). We accept this age assignment to constrain the depositional ages of our samples because Fang et al. (2019) was sampled in the same section with this study.
Methods and Sampling
The AFT thermochronometer records the age of rocks cooling through its susceptible temperature of about 60–120°C and thus sensitive to thermal variation in the shallow crust (Gallagher et al., 1998). A total of 10 AFT samples were collected from Paleogene strata of the Lulehe Fm. and Xiaganchaigou Fm. in the lower part of the HLG section. The detailed sampling positions are shown in Figure 2. The sandstone samples were crushed, washed, and sieved. Apatite grains were extracted using conventional magnetic and heavy-liquid separation techniques. The external detector method and zeta calibration approach were used for AFT dating (Hurford and Green, 1983). To reveal the spontaneous tracks, apatite aliquots were mounted in epoxy, ground, polished, and etched for 20 s in a 5 N HNO3 solution at 20°C (Barbarand et al., 2003). The experiment use U-poor micas as external detector and IRMM540R glasses as dosimeter. The Fish Canyon Tuff, Durango, and Mt. Dromedary apatites were used as age standards. After samples, age standards, and dosimeter glasses were packed with external detectors, they were irradiated at the Thermal Irradiation Center at Oregon State University. Mica detectors were then unpacked and etched in 40% HF solution for 40 min at 20°C to reveal the induced tracks.
Fission-track counting was performed at the Fission Track Laboratory of the Northwest Institute of Eco-Environment and Resources, Chinese Academy of Sciences, using a fully manual method on an Autoscan fission-track counting system that consists of a Zeiss AxioImager Z2m microscope, ES16 stage, and Fission-Track Studio software. Track density, track length, and Dpar value were measured on appropriate apatite in each sample. A personal ξ value of 342.60 ± 7.63 were obtained and used to determine sample ages. The χ2 test was performed on single grain ages of each sample to quantify AFT age homogeneity; a value of P(χ2) < 5% is indicative of a broad dispersion of single-grain ages that can be decomposed into different grain-age components (Green, 1981).
Results and Interpretation
AFT Ages
Results for AFT dating are presented in Table 1. Most samples yielded 60–90 single grain ages. Central ages ranged from 43.7 ± 1.9 Ma to 78.0 ± 2.8 Ma. The sample in the bottom of the section (HLG100) has an AFT age younger than its depositional age (53 Ma). All other upper samples have central ages older than corresponding depositional ages. AFT central ages do not show regular changes with depositional ages (Table 1). Most samples fail the χ2 test with P(χ2) <5%, indicating heterogeneous age components (Green, 1981). This can occur if grains in these samples were not totally reset during post-depositional burial and still record mixed cooling signals of a variety of source terranes. For samples with heterogeneous grain ages, the observed age distributions of each sample were decomposed into grain age components using RadialPlotter and DensityPlotter programs (Vermeesch, 2012). The dispersion of single-grain ages are shown in Figure 3 as radial plots. The single grain age-density distributions and mixture model peak ages for all samples are plotted in Figure 4. In total, 21 age components were obtained, which have peak ages ranging from 21.2 ± 2.9 Ma to 98 ± 10 Ma (1σ). These decomposed age components were divided into three age populations (P1, P2, and P3) based on correlation of their peak ages (Table 1). A lag-time plot shows the relationship between decomposed AFT component peak ages and depositional ages of corresponding samples is present in Figure 5. Notably some components have peak ages younger than corresponding depositional ages and show negative lag-time. Both indicate these samples may be partially annealed after deposition (Figure 5).
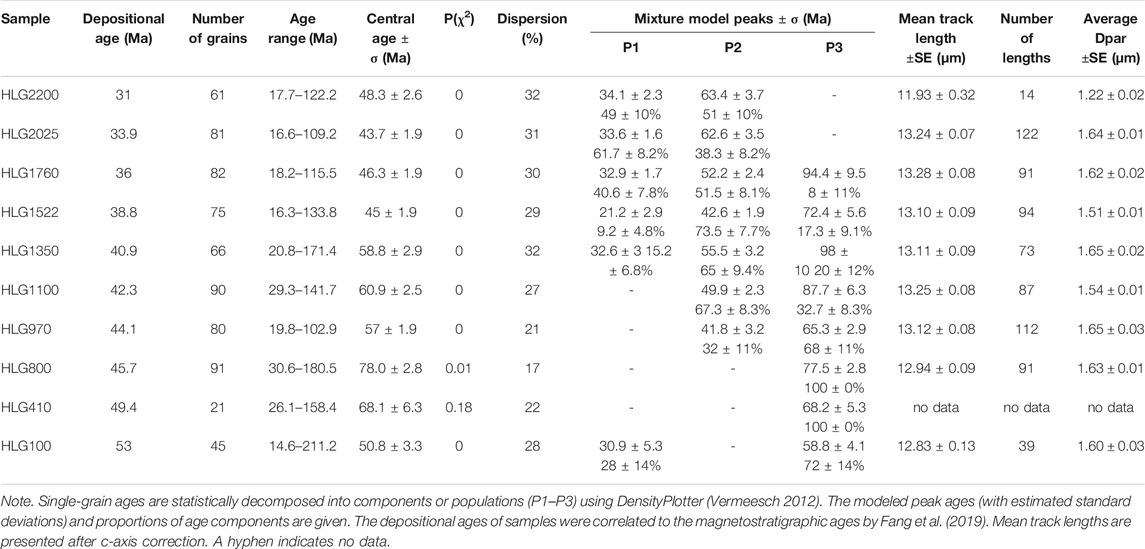
TABLE 1. AFT dating results.
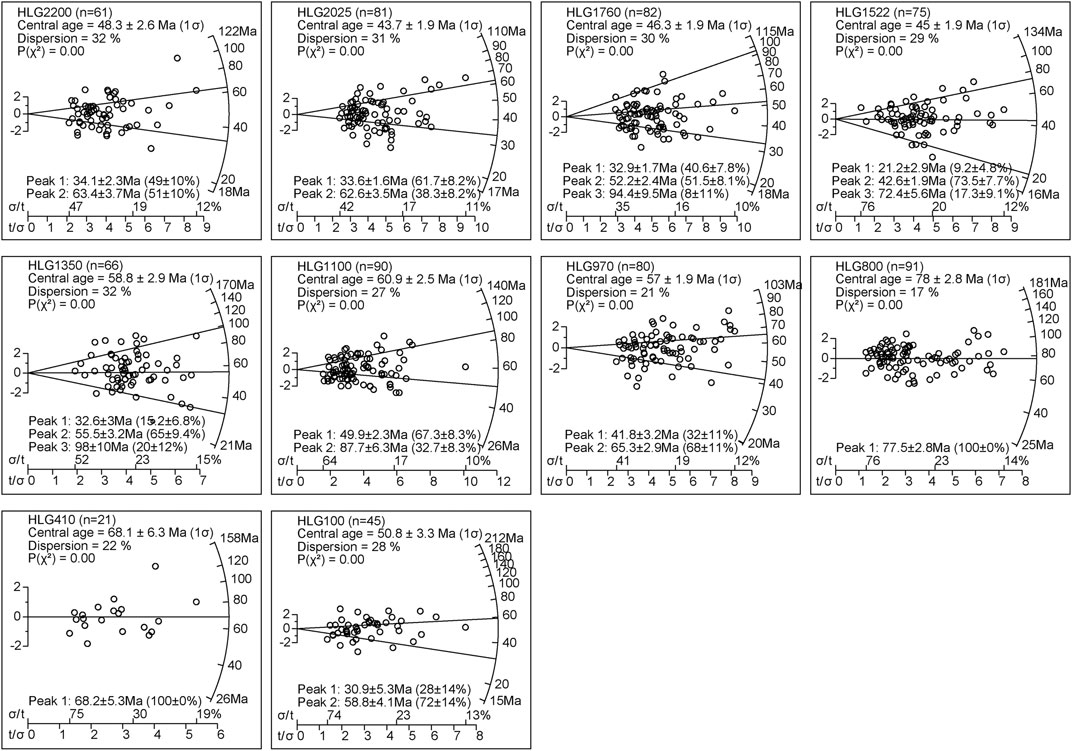
FIGURE 3. Radial plots of the analysed AFT samples constructed using the RadialPlotter programme (Vermeesch, 2012).
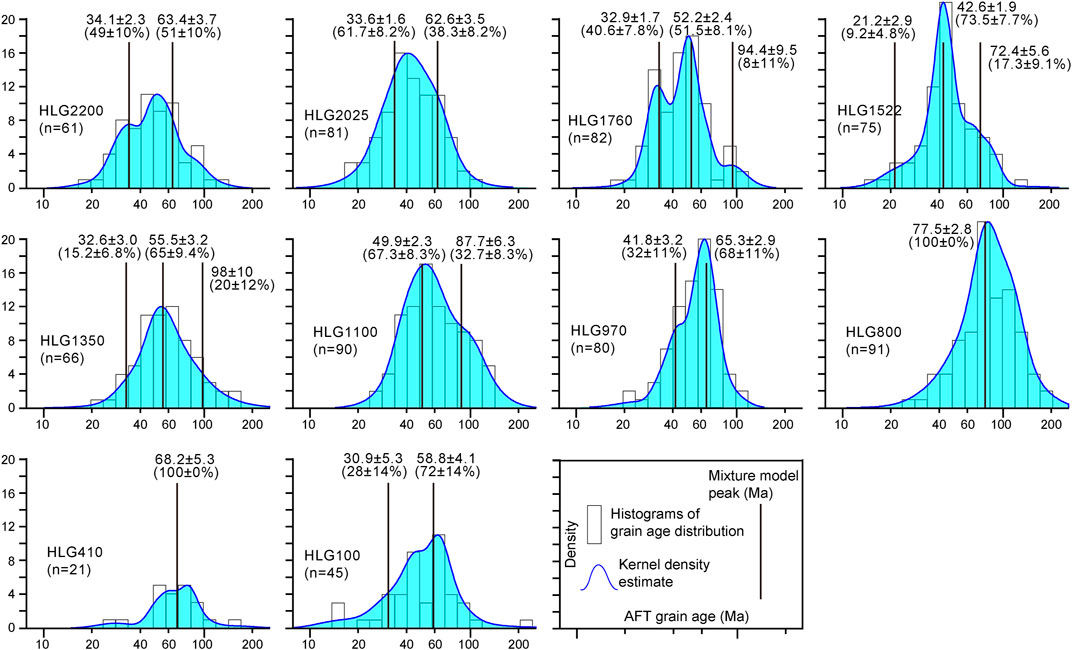
FIGURE 4. Grain-age distributions, kernel density estimates, and mixture model peaks (with modelled component ages and proportions) of detrital AFT samples. Single-grain ages are statistically decomposed into components using the routines in DensityPlotter (Vermeesch, 2012).
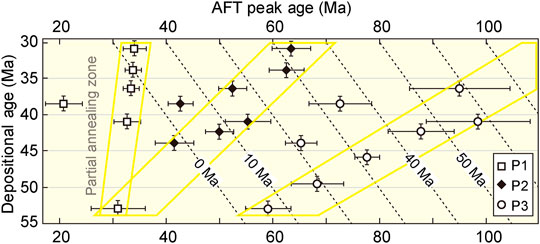
FIGURE 5. Lag time plot of detrital AFT age components. Error bars are ± 1σ for AFT ages and ±1 Ma for depositional ages. The dashed lines are lag time contours, and the corresponding lag times are labelled. Rectangles in yellow indicate the age variation of grouped populations, in which the AFT peak ages of P1, P2, and P3 all young with increasing depositional age.
AFT Lengths
Most of our samples yielded 80–120 confined track length measurements. The c-axis corrected mean track lengths range from 12.83–13.28 μm (with an exception of 14 measurements giving a length of 11.39 μm). Average Dpar values of these length-measured grains range between 1.22 and 1.65 μm. Histogram plots of the track length distribution of each sample are presented in Figure 6. Integrating the heterogeneity of grain ages and the relatively long track lengths of our samples, their post-depositional burial annealing may not intensity.
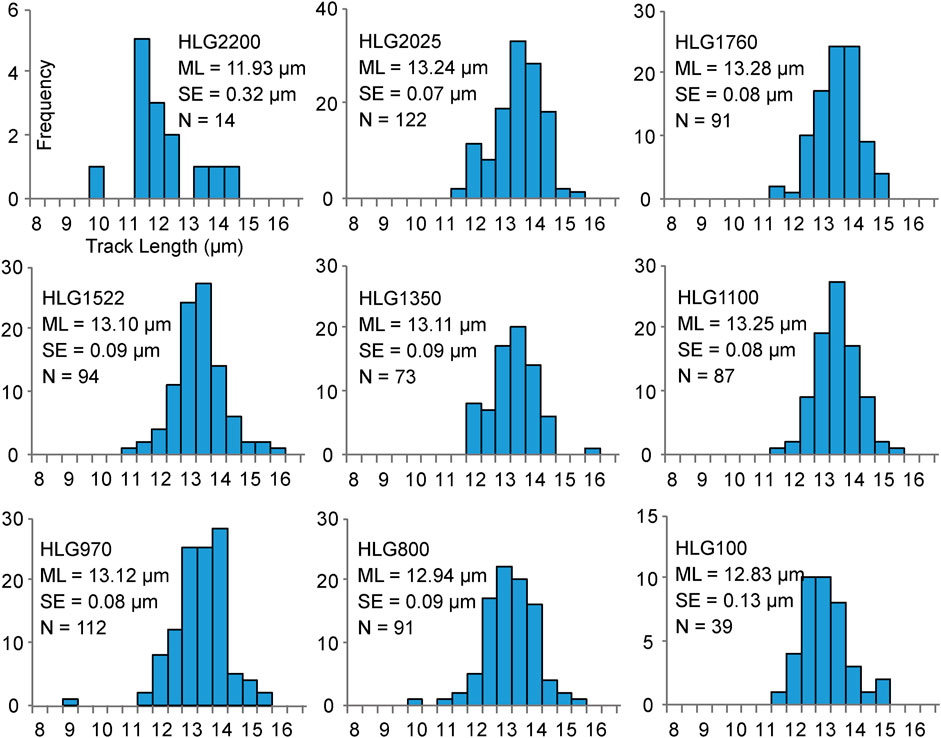
FIGURE 6. Track length (c-axis corrected) distribution histograms. M, Mean track length; SE, Standard error; N, Number of tracks.
The mean track lengths of our samples are gradually shortening with sampling position down in the section (Figure 7). It is more obvious when integrated with published track length data in strata overlying the sampled section (He et al., 2021). The mean track lengths were nearly constant in the upper half of the section, but become shortened in the lower half of the section (Figure 7). The lower sample has shorter length suggests the shortening of track length in the lower half of the section should be caused by burial annealing. Analogous to track length variation, the component ages show younger trend down-section in the lag-time plot (Figure 5), which conform to the law of burial annealing. Therefore, AFT ages and length data together illustrate that samples experienced post-depositional partial annealing.
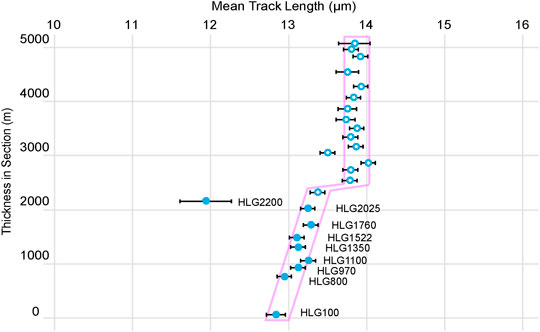
FIGURE 7. Variation in mean track length with stratigraphic thickness in the HLG section. The mean track length (with ± 1SE) shown by the solid circle (this study) and hollow circle (He et al., 2021).
Thermal History Modeling of AFT Data
Detrital rocks can be complex sedimentary mixtures derived from a variety of source terranes with variable cooling histories. During post-deposition burial, grains were reset by partial annealing. The apparent AFT ages and lengths in our data are the partially reset cooling signals of mixtures of different sedimentary sources. Broadly, grains in one detrital sample in this study experienced the same thermal history after deposition. This coherence permits the modeling of the post-depositional thermal history of our samples based on the AFT age and length data. Our samples experienced deposition, burial, and exhumation, we attempted to decipher the time constraints of these processes.
We used the HeFTy program (Ketcham, 2005) to model the thermal history. Our data of AFT ages, lengths, and Dpars are included in the annealing model of Ketcham et al. (2007). Eight of ten samples with numerous confined track lengths were modeled. We defined prior constraints for the thermal modeling as follows: each sample, using their corresponding depositional age with ±5 Ma error, was included in a 20 ± 20°C palaeo-surface temperature; each sample experienced the upper AFT partial annealing zone at 70 ± 10°C after deposition; each sample, an incipient condition of one to two times the AFT age, was included in a temperature of partial or full annealing (60–140°C). We give each constraint large ranges in time and temperature to model freely depend on the program. All models run with 500,000 iterations.
Because thermal evolutions of grains in a detrital sample are a mixture of pre-depositional conditions and a unity of post-depositional conditions, only the post-depositional thermal history is credible. The inversion results show thermal histories with two stages during post-deposition with a thermal transition in age ranges from 10–3 Ma (Figures 8, 9). After deposition, samples experienced a gradual heating phase in the early Cenozoic up to 10–3 Ma. By this time, samples reached the upper range of the AFT partial annealing zone (60–80°C). After 10–3 Ma, samples experienced a rapid cooling phase and were exhumed to the surface (Figures 8, 9). Modeled thermal histories are in accord with the inferred deposition-burial-exhumation process for the samples, as constrained by geological framework. The heated phase corresponding to the gradually buried, and the thermal condition converted to cooling at ∼10–3 Ma indicated the commenced exhumation. The exhumation since ∼10 Ma may be caused by intensified deformation of the sampled strata (Yin et al., 2008), which finally inclined and exposed the section at the surface by the present.
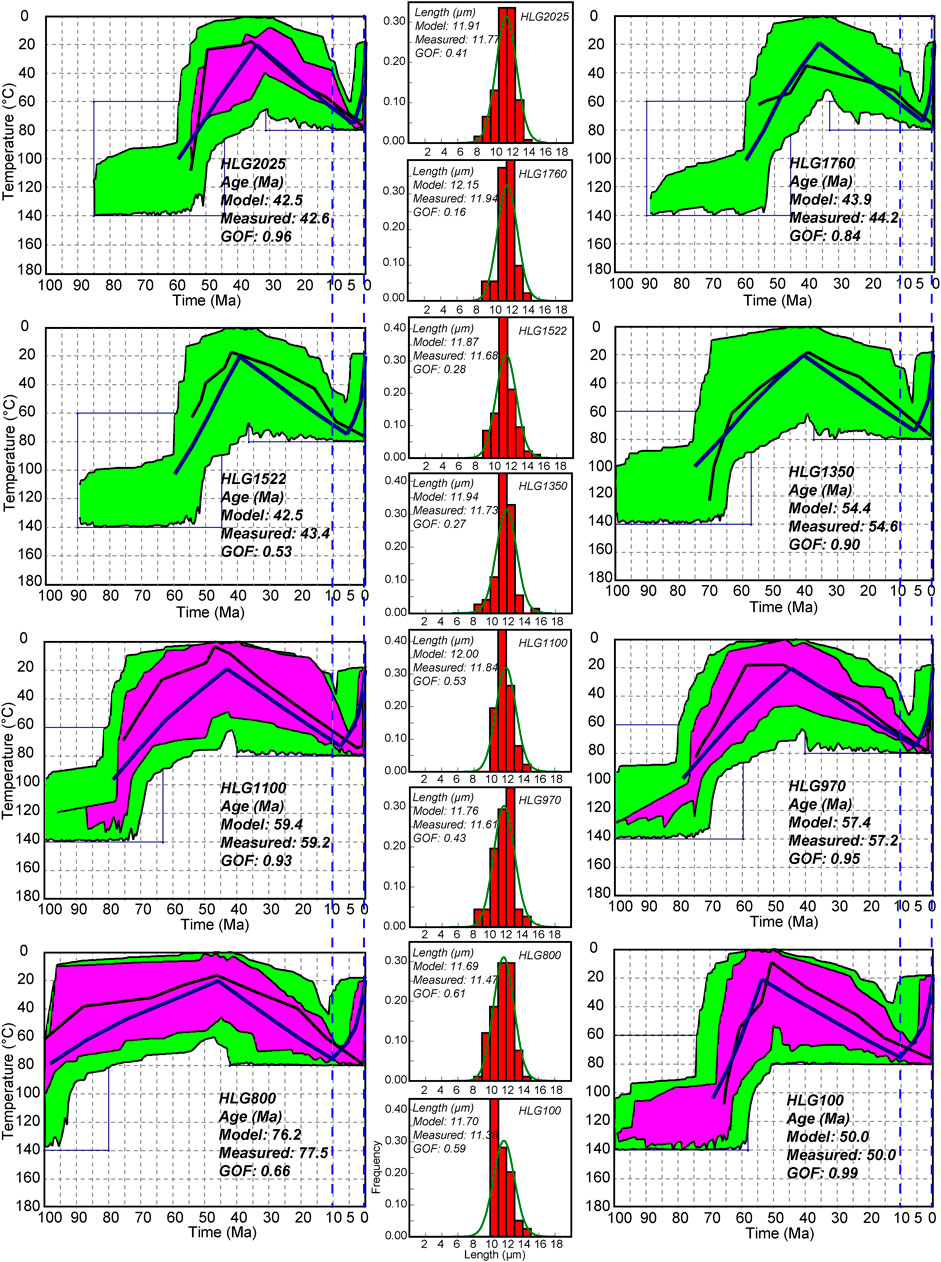
FIGURE 8. Inferred thermal histories for samples in the northern Qaidam Basin modeled by HeFTy program (Ketcham, 2005). Good paths (GOF >0.55) are shown as magenta envelopes and acceptable paths (GOF >0.05) as green envelopes. The dark blue lines represent the weighted mean thermal paths for all models, and black lines are the best fit thermal paths. GOF = goodness of fit.
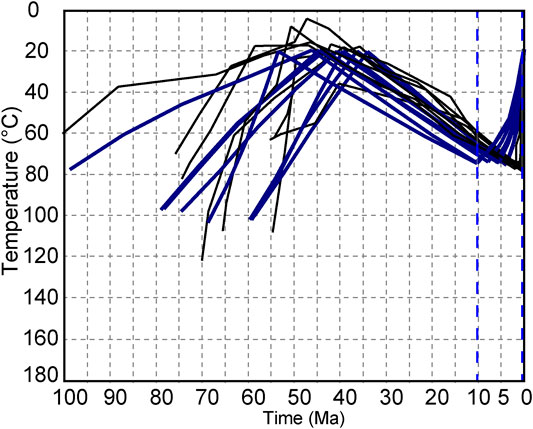
FIGURE 9. Modeled weighted mean and best fit thermal paths for all samples derive from Figure 8. The legends are the same with that in Figure 8.
Although we adopt the stratigraphic chronology of Fang et al. (2019) in the HLG section as depositional age constraints, another rather younger stratigraphic chronology assignment of Wang et al. (2017) in the Honggou section (see section Geological Setting for details) is tried for thermal modeling. We changed the prior constraints of depositional ages to Wang et al. (2017) for modeling the representative samples (Figure 10). The modeled post-depositional thermal histories show transition from heating to cooling after ∼10 Ma (Figure 10), which are nearly the same with that using constraints of Fang et al. (2019). This result suggests that the different depositional age constraints of the two schemes do not affect the post-depositional thermal histories of our samples significantly.
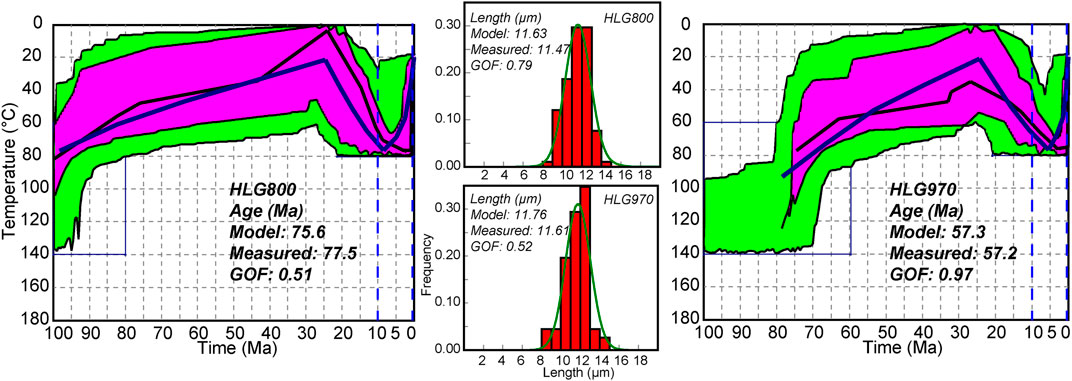
FIGURE 10. Inferred thermal histories for representative samples under the depositional age constraints of Wang et al. (2017). The legends are the same with that in Figure 8.
Discussion
Cenozoic Deformation of the NQQB
The early Cenozoic tectonic deformation of the northern Qaidam Basin is demonstrated by growth strata in many seismic profiles (Yin et al., 2008; Yu et al., 2017; Cheng et al., 2019). This syndepositional and post-depositional tectonic deformation, which inclined the sampled strata, resulted in the burial depth much shallower than the strata thickness. Thus, our AFT samples, even that in the ∼5,000 m thickness, experienced moderate annealing after deposition. The early Cenozoic deformation has been observed across the NQQB (Qi et al., 2016; Jian et al., 2018; Zhuang et al., 2018; Lin et al., 2019; Li et al., 2020; He et al., 2020, 2021). The AFT thermal modeling results indicate the northern Qaidam Basin experienced exhumation since ∼10 Ma. The exhumation should be caused by intensified thrusting and folding in this region (Yin et al., 2008; Cheng et al., 2019). Although the deposition continued through ∼10 Ma across the northern Qaidam Basin, the strata considered in this study was gradually exhumed. This exhumation-related tectonic deformation possibly resulted from the enhanced activity of thrust faults in the Lulehe anticline (Figure 2B) since ∼10 Ma. As the HLG section locates between the Saishiteng Shan and Luliang Shan, which is the outmost thrust belt of the NQQB, we suggest tectonism transmitted to this structure belt at ∼10 Ma and caused persistent deformation since then.
Published in situ thermochronology data revealed widespread middle-late Miocene rapid exhumation in the NQQB (Figure 1A). The intense tectonic deformation of the northern Qaidam Basin that commenced at ∼10 Ma is also supported by synchronous tectono-sedimentary records in surrounding basins. Several tectonic traces at ∼10–8 Ma both recorded in the northern Qaidam Basin and Jiuquan Basin that surrounding the NQQB, such as: the beginning accumulation of coarse clasts (Fang et al., 2005, 2007; Li et al., 2014); the syndepositional deformation shown in seismic or exposure profiles (Yin et al., 2008; Li et al., 2014); abruptly increased accumulation rates (Fang et al., 2005, 2007; Ji et al., 2017); initiation of sedimentary recycling in basins margin (Wang et al., 2017; Zheng et al., 2017; Pang et al., 2019a). In addition, the cease of rotation of the Jiuquan Basin suggests that the domination of shortening and uplift since then (Yan et al., 2012).
Thermochronology data together with the tectono-sedimentary data suggest the sedimentary source uplifted synchronous with the marginal basin. The southernmost Qilian Shan (Qaidam Shan), which locates close to the HLG section, have deformed at 15–10 Ma (Meng et al., 2020). The appearing of tectonic deformation in the northern Qaidam Basin since ∼10 Ma delayed the deformation of the southern Qilian Shan, indicating a southward extension of deformation in the southernmost Qilian Shan-northern Qaidam Basin. However, the spatial and temporal distribution of the Miocene tectonic events in the NQQB does not shows any regular migration (Figure 1A). We suggest the NQQB experienced intensified tectonic deformation since the late Miocene and the basin-ward migration of intense deformation is limited to the marginal basin.
Conclusion
In this study, we present new AFT thermochronology data from Paleogene strata in the northern Qaidam Basin to investigate the time of tectonic deformation of this site. All the AFT samples experienced partial annealing during sedimentary burial. Thermal history modeling of these samples show an early stage of heating before the middle Miocene and a later stage of cooling since ∼10 Ma. This transition at ∼10 Ma should be caused by the initiated exhumation of the sampled strata. Thus indicates intensified tectonic deformation since ∼10 Ma. We suggest the northern Qaidam Basin experienced intense tectonism since the late Miocene.
Data Availability Statement
The original contributions presented in the study are included in the article/Supplementary Material, further inquiries can be directed to the corresponding authors.
Author Contributions
CS and PH designed research; PH, YW, and QM performed research; YIZ, WC, YUZ, and PH analyzed data; PH and CS wrote the paper.
Funding
This work was financially supported by the National Natural Science Foundation of China (grants 41902223 and 41872098), the Strategic Priority Research Program of Chinese Academy of Sciences (grant XDA2007020102), the Second Tibetan Plateau Scientific Expedition and Research (STEP) (grant 2019QZKK0707), the Fundamental Research Funds for the Central Universities (grant lzujbky-2021-20), and the Natural Science Foundation of Gansu Province (grants 20JR10RA628).
Conflict of Interest
The authors declare that the research was conducted in the absence of any commercial or financial relationships that could be construed as a potential conflict of interest.
Publisher’s Note
All claims expressed in this article are solely those of the authors and do not necessarily represent those of their affiliated organizations, or those of the publisher, the editors and the reviewers. Any product that may be evaluated in this article, or claim that may be made by its manufacturer, is not guaranteed or endorsed by the publisher.
Acknowledgments
We thank Q. Wang, L. Chen, and X. Wang for their assistance in the field and laboratory. We are grateful to the editor and reviewers for their detailed and constructive comments.
References
An, K., Lin, X., Wu, L., Cheng, X., Chen, H., Ding, W., et al. (2018). Reorganization of Sediment Dispersal in the Jiuxi Basin at ∼17 Ma and its Implications for Uplift of the NE Tibetan Plateau. Palaeogeogr. Palaeoclimatol. Palaeoecol. 511, 558–576. doi:10.1016/j.palaeo.2018.09.022
Barbarand, J., Carter, A., Wood, I., and Hurford, T. (2003). Compositional and Structural Control of Fission-Track Annealing in Apatite. Chem. Geology. 198 (1-2), 107–137. doi:10.1016/s0009-2541(02)00424-2
Cheng, F., Garzione, C. N., Mitra, G., Jolivet, M., Guo, Z., Lu, H., et al. (2019). The Interplay between Climate and Tectonics during the Upward and Outward Growth of the Qilian Shan Orogenic Wedge, Northern Tibetan Plateau. Earth-Science Rev. 198, 102945. doi:10.1016/j.earscirev.2019.102945
Fang, X., Dupont-Nivet, G., Wang, C., Song, C., Meng, Q., Zhang, W., et al. (2020). Revised Chronology of central Tibet Uplift (Lunpola Basin). Sci. Adv. 6 (50), eaba7298. doi:10.1126/sciadv.aba7298
Fang, X., Galy, A., Yang, Y., Zhang, W., Ye, C., and Song, C. (2019). Paleogene Global Cooling-Induced Temperature Feedback on Chemical Weathering, as Recorded in the Northern Tibetan Plateau. Geology 47 (10), 992–996. doi:10.1130/g46422.1
Fang, X., Zhang, W., Meng, Q., Gao, J., Wang, X., King, J., et al. (2007). High-resolution Magnetostratigraphy of the Neogene Huaitoutala Section in the Eastern Qaidam Basin on the NE Tibetan Plateau, Qinghai Province, China and its Implication on Tectonic Uplift of the NE Tibetan Plateau. Earth Planet. Sci. Lett. 258 (1-2), 293–306. doi:10.1016/j.epsl.2007.03.042
Fang, X., Zhao, Z. J., Li, J. J., Yan, M. D., Pan, B. T., Song, C. H., et al. (2005). Magnetostratigraphy of the Late Cenozoic Laojunmiao Anticline in the Northern Qilian Mountains and its Implications for the Northern Tibetan Plateau Uplift. Sci. China Ser. D 48 (7), 1040–1051. doi:10.1360/03yd0188
Gallagher, K., Brown, R., and Johnson, C. (1998). Fission Track Analysis and its Applications to Geological Problems. Annu. Rev. Earth Planet. Sci. 26 (1), 519–572. doi:10.1146/annurev.earth.26.1.519
Gansu Geologic Bureau (1989). Regional Geology Evolution of Gansu Province. Lanzhou, China: Geological Publishing House. (in Chinese).
Gehrels, G. E., Yin, A., and Wang, X.-F. (2003). Magmatic History of the Northeastern Tibetan Plateau. J. Geophys. Res. 108 (B9), 2423. doi:10.1029/2002jb001876
Green, P. F. (1981). A New Look at Statistics in Fission-Track Dating. Nucl. Tracks 5, 77–86. doi:10.1016/0191-278x(81)90029-9
He, P., Song, C., Wang, Y., Meng, Q., Wang, D., Feng, Y., et al. (2020). Early Cenozoic Exhumation in the Qilian Shan, Northeastern Margin of the Tibetan Plateau: Insights from Detrital Apatite Fission Track Thermochronology. Terra Nova 32 (6), 415–424. doi:10.1111/ter.12478
He, P., Song, C., Wang, Y., Wang, D., Chen, L., Meng, Q., et al. (2021). Early Cenozoic Activated Deformation in the Qilian Shan, Northeastern Tibetan Plateau: Insights from Detrital Apatite Fission‐track Analysis. Basin Res. 33 (3), 1731–1748. doi:10.1111/bre.12533
Hurford, A. J., and Green, P. F. (1983). The Zeta Age Calibration of Fission-Track Dating. Chem. Geology. 41, 285–317. doi:10.1016/S0009-2541(83)80026-6
Ji, J., Zhang, K., Clift, P. D., Zhuang, G., Song, B., Ke, X., et al. (2017). High-resolution Magnetostratigraphic Study of the Paleogene-Neogene Strata in the Northern Qaidam Basin: Implications for the Growth of the Northeastern Tibetan Plateau. Gondwana Res. 46, 141–155. doi:10.1016/j.gr.2017.02.015
Jian, X., Guan, P., Zhang, W., Liang, H., Feng, F., and Fu, L. (2018). Late Cretaceous to Early Eocene Deformation in the Northern Tibetan Plateau: Detrital Apatite Fission Track Evidence from Northern Qaidam basin. Gondwana Res. 60, 94–104. doi:10.1016/j.gr.2018.04.007
Ketcham, R. A., Carter, A., Donelick, R. A., Barbarand, J., and Hurford, A. J. (2007). Improved Modeling of Fission-Track Annealing in Apatite. Am. Mineral. 92, 799–810. doi:10.2138/am.2007.2281
Ketcham, R. A. (2005). Forward and Inverse Modeling of Low-Temperature Thermochronometry Data. Rev. Mineralogy Geochem. 58 (1), 275–314. doi:10.2138/rmg.2005.58.11
Li, B., Chen, X., Zuza, A. V., Hu, D., Ding, W., Huang, P., et al. (2019). Cenozoic Cooling History of the North Qilian Shan, Northern Tibetan Plateau, and the Initiation of the Haiyuan Fault: Constraints from Apatite- and Zircon-Fission Track Thermochronology. Tectonophysics 751, 109–124. doi:10.1016/j.tecto.2018.12.005
Li, B., Zuza, A. V., Chen, X., Hu, D., Shao, Z., Qi, B., et al. (2020). Cenozoic Multi-phase Deformation in the Qilian Shan and Out-Of-Sequence Development of the Northern Tibetan Plateau. Tectonophysics 782-783, 228423. doi:10.1016/j.tecto.2020.228423
Li, J., Fang, X., Song, C., Pan, B., Ma, Y., and Yan, M. (2014). Late Miocene-Quaternary Rapid Stepwise Uplift of the NE Tibetan Plateau and its Effects on Climatic and Environmental Changes. Quat. Res. 81 (3), 400–423. doi:10.1016/j.yqres.2014.01.002
Lin, X., Tian, Y., Donelick, R. A., Liu-Zeng, J., Cleber, S. J., Li, C. a., et al. (2019). Mesozoic and Cenozoic Tectonics of the Northeastern Edge of the Tibetan Plateau: Evidence from Modern River Detrital Apatite Fission-Track Age Constraints. J. Asian Earth Sci. 170, 84–95. doi:10.1016/j.jseaes.2018.10.028
Meng, Q. R., and Fang, X. (2008). “Cenozoic Tectonic Development of the Qaidam Basin in the Northeastern Tibetan Plateau,” in Investigations into the Tectonics of the Tibetan Plateau. Editors B. C. Burchfiel, and E. Wang (Boulder, CO: Geological Society of America Special Paper), 444, 1–24. doi:10.1130/2008.2444(0110.1130/2008.2444(01)
Meng, Q., Song, C., Nie, J., Liu, C., He, P., Liu, F., et al. (2020). Middle-late Miocene Rapid Exhumation of the Southern Qilian Shan and Implications for Propagation of the Tibetan Plateau. Tectonophysics 774, 228279. doi:10.1016/j.tecto.2019.228279
Molnar, P., England, P., and Martinod, J. (1993). Mantle Dynamics, Uplift of the Tibetan Plateau, and the Indian Monsoon. Rev. Geophys. 31 (4), 357–396. doi:10.1029/93RG02030
Nie, J., Ren, X., Saylor, J. E., Su, Q., Horton, B. K., Bush, M. A., et al. (2019). Magnetic Polarity Stratigraphy, Provenance, and Paleoclimate Analysis of Cenozoic Strata in the Qaidam Basin, NE Tibetan Plateau. Geol. Soc. America Bull. 132 (1-2), 310–320. doi:10.1130/b35175.1
Pang, J., Yu, J., Zheng, D., Wang, W., Ma, Y., Wang, Y., et al. (2019a). Neogene Expansion of the Qilian Shan, North Tibet: Implications for the Dynamic Evolution of the Tibetan Plateau. Tectonics 38 (3), 1018–1032. doi:10.1029/2018tc005258
Pang, J., Yu, J., Zheng, D., Wang, Y., Zhang, H., Li, C., et al. (2019b). Constraints of New Apatite Fission-Track Ages on the Tectonic Pattern and Geomorphic Development of the Northern Margin of the Tibetan Plateau. J. Asian Earth Sci. 181, 103909. doi:10.1016/j.jseaes.2019.103909
Qi, B., Hu, D., Yang, X., Zhang, Y., Tan, C., Zhang, P., et al. (2016). Apatite Fission Track Evidence for the Cretaceous-Cenozoic Cooling History of the Qilian Shan (NW China) and for Stepwise Northeastward Growth of the Northeastern Tibetan Plateau since Early Eocene. J. Asian Earth Sci. 124, 28–41. doi:10.1016/j.jseaes.2016.04.009
Royden, L. H., Burchfiel, B. C., and van der Hilst, R. D. (2008). The Geological Evolution of the Tibetan Plateau. Science 321 (5892), 1054–1058. doi:10.1126/science.1155371
Sun, Z., Yang, Z., Pei, J., Ge, X., Wang, X., Yang, T., et al. (2005). Magnetostratigraphy of Paleogene Sediments from Northern Qaidam Basin, China: Implications for Tectonic Uplift and Block Rotation in Northern Tibetan Plateau. Earth Planet. Sci. Lett. 237 (3-4), 635–646. doi:10.1016/j.epsl.2005.07.007
Tapponnier, P., Zhiqin, X., Roger, F., Meyer, B., Arnaud, N., Wittlinger, G., et al. (2001). Oblique Stepwise Rise and Growth of the Tibet Plateau. Science 294 (5547), 1671–1677. doi:10.1126/science.105978
Taylor, M., and Yin, A. (2009). Active Structures of the Himalayan-Tibetan Orogen and Their Relationships to Earthquake Distribution, Contemporary Strain Field, and Cenozoic Volcanism. Geosphere 5 (3), 199–214. doi:10.1130/ges00217.1
Vermeesch, P. (2012). On the Visualisation of Detrital Age Distributions. Chem. Geology. 312-313, 190–194. doi:10.1016/j.chemgeo.2012.04.021
Wang, C., Zhao, X., Liu, Z., Lippert, P. C., Graham, S. A., Coe, R. S., et al. (2008). Constraints on the Early Uplift History of the Tibetan Plateau. Pnas 105 (13), 4987–4992. doi:10.1073/pnas.0703595105
Wang, W., Zheng, D., Li, C., Wang, Y., Zhang, Z., Pang, J., et al. (2020). Cenozoic Exhumation of the Qilian Shan in the Northeastern Tibetan Plateau: Evidence from Low‐Temperature Thermochronology. Tectonics 39 (4). doi:10.1029/2019tc005705
Wang, W., Zheng, W., Zhang, P., Li, Q., Kirby, E., Yuan, D., et al. (2017). Expansion of the Tibetan Plateau during the Neogene. Nat. Commun. 8, 15887. doi:10.1038/ncomms15887
Yan, M., Fang, X., Van Der Voo, R., Song, C., and Li, J. (2012). Neogene Rotations in the Jiuquan Basin, Hexi Corridor, China. Geol. Soc. Lond. Spec. Publications 373 (1), 173–189. doi:10.1144/sp373.6
Yin, A., Dang, Y.-Q., Wang, L.-C., Jiang, W.-M., Zhou, S.-P., Chen, X.-H., et al. (2008). Cenozoic Tectonic Evolution of Qaidam basin and its Surrounding Regions (Part 1): The Southern Qilian Shan-Nan Shan Thrust belt and Northern Qaidam basin. Geol. Soc. America Bull. 120 (7-8), 813–846. doi:10.1130/b26180.1
Yin, A., and Harrison, T. M. (2000). Geologic Evolution of the Himalayan-Tibetan Orogen. Annu. Rev. Earth Planet. Sci. 28 (1), 211–280. doi:10.1146/annurev.earth.28.1.211
Yu, J., Pang, J., Wang, Y., Zheng, D., Liu, C., Wang, W., et al. (2019b). Mid-Miocene Uplift of the Northern Qilian Shan as a Result of the Northward Growth of the Northern Tibetan Plateau. Geosphere 15 (2), 423–432. doi:10.1130/ges01520.1
Yu, J., Zheng, D., Pang, J., Wang, Y., Fox, M., Vermeesch, P., et al. (2019a). Miocene Range Growth along the Altyn Tagh Fault: Insights from Apatite Fission Track and (U‐Th)/He Thermochronometry in the Western Danghenan Shan, China. J. Geophys. Res. Solid Earth 124 (8), 9433–9453. doi:10.1029/2019jb017570
Yu, X., Guo, Z., Zhang, Q., Cheng, X., Du, W., Wang, Z., et al. (2017). Denan Depression Controlled by Northeast-Directed Olongbulak Thrust Zone in Northeastern Qaidam basin: Implications for Growth of Northern Tibetan Plateau. Tectonophysics 717, 116–126. doi:10.1016/j.tecto.2017.06.017
Zhang, C., Wu, L., Chen, W., Zhang, Y., Xiao, A., Zhang, J., et al. (2020). Early Cretaceous Foreland-like Northeastern Qaidam Basin, Tibetan Plateau and its Tectonic Implications: Insights from Sedimentary Investigations, Detrital Zircon U-Pb Analyses and Seismic Profiling. Palaeogeogr. Palaeoclimatol. Palaeoecol. 557, 109912. doi:10.1016/j.palaeo.2020.109912
Zhang, W. L. (2006). “Cenozoic Uplift of the Tibetan Plateau: Evidence from High Resolution Magnetostratigraphy of the Qaidam Basin,” (Lanzhou, China: Lanzhou University). PhD thesis. (in Chinese with English abstract).
Zheng, D., Clark, M. K., Zhang, P., Zheng, W., and Farley, K. A. (2010). Erosion, Fault Initiation and Topographic Growth of the North Qilian Shan (Northern Tibetan Plateau). Geosphere 6 (6), 937–941. doi:10.1130/ges00523.1
Zheng, D., Wang, W., Wan, J., Yuan, D., Liu, C., Zheng, W., et al. (2017). Progressive Northward Growth of the Northern Qilian Shan-Hexi Corridor (Northeastern Tibet) during the Cenozoic. Lithosphere 9 (3), 408–416. doi:10.1130/l587.1
Zhuang, G., Hourigan, J. K., Ritts, B. D., and Kent-Corson, M. L. (2011). Cenozoic Multiple-phase Tectonic Evolution of the Northern Tibetan Plateau: Constraints from Sedimentary Records from Qaidam basin, Hexi Corridor, and Subei basin, Northwest China. Am. J. Sci. 311 (2), 116–152. doi:10.2475/02.2011.02
Keywords: Cenozoic, northern Qaidam Basin, Tibetan plateau, fission track, tectonic deformation
Citation: He P, Song C, Wang Y, Zhang Y, Chen W, Meng Q and Zhao Y (2021) Intensified Late Miocene Deformation in the Northern Qaidam Basin, Northern Tibetan Plateau, Constrained by Apatite Fission-Track Thermochronology. Front. Earth Sci. 9:750993. doi: 10.3389/feart.2021.750993
Received: 31 July 2021; Accepted: 20 October 2021;
Published: 16 November 2021.
Edited by:
Tara N. Jonell, University of Glasgow, United KingdomReviewed by:
Renjie Zhou, The University of Queensland, AustraliaJingxing Yu, China Earthquake Administration, China
Xuanhua Chen, Chinese Academy of Geological Sciences (CAGS), China
Copyright © 2021 He, Song, Wang, Zhang, Chen, Meng and Zhao. This is an open-access article distributed under the terms of the Creative Commons Attribution License (CC BY). The use, distribution or reproduction in other forums is permitted, provided the original author(s) and the copyright owner(s) are credited and that the original publication in this journal is cited, in accordance with accepted academic practice. No use, distribution or reproduction is permitted which does not comply with these terms.
*Correspondence: Chunhui Song, c29uZ2NoaEBsenUuZWR1LmNu; Pengju He, aGVwakBsenUuZWR1LmNu