 Lin Wang1,2Jianyun Zhang1,2,3Zhangkang Shu1,2Yan Wang1,2,3Zhenxin Bao1,2,3Cuishan Liu1,2,3
 Xiong Zhou4
 Guoqing Wang1,2,3*
- 1State Key Laboratory of Hydrology-Water Resources and Hydraulic Engineering, Nanjing Hydraulic Research Institute, Nanjing, China
- 2Research Center for Climate Change, Nanjing, China
- 3Yangtze Institute for Conservation and Development, Nanjing, China
- 4China-Canada Center for Energy, Environment and Ecology Research, UofR-BNU, Beijing Normal University, Beijing, China
Choosing an appropriate GCM (Global Climate Model, GCM) is of great significance for the simulation of the hydrological cycle over a basin under future climate scenarios. In this study, the Rank Score Method (RS) with eight indicators were applied to comprehensively evaluate the suitability of 19 GCMs issued in the Sixth Global Atmosphere and Coupled Model Intercomparison Project (CMIP6) to the Yellow River Basin (YRB). The results indicated that: 1) The GCMs perform differently in simulating precipitation over the YRB with the top six GCMs ranking from MRI-ESM2-0, ACCESS-CM2, CNRM-CM6-1, CNRM-ESM2-1, FGOALS-f3-L, to MPI-ESM1-2-HR. 2) Most GCMs overestimated the precipitation, and poorly simulated the phase distribution of extremes mainly due to overstimulation of wet season span and precipitation amount in the season, although all GCMs could capture decadal feature of annual precipitation. Meanwhile, it is also found that most GCMs underestimated summer precipitation and overestimated spring precipitation. 3) The GCMs well simulated the spatial distribution of annual precipitation, with an overestimation in the source area, and an underestimation in the northern part of the middle reaches of YRB.
Introduction
With the further intensification of global climate change, the hydrological cycle processes have been significantly affected. The Sixth Intergovernmental Panel on Climate Change (IPCC) Assessment Report of group 1 showed that in 2015–2100, the global warming trend will be even more significant, climate change will intensify in all regions, and extremely high temperature and precipitation events will become more frequent (Masson-Delmotte et al., 2021). Therefore, analyzing the changes in the hydrological process of the basin, and simulating the change of hydrological elements under future climate scenarios are of great significance for the management and planning of water resources in the basin (Reboita et al., 2019). The Global Climate Models (GCMs) in a series of Global Atmosphere and Coupled Model Intercomparison Projects (CMIPs) developed by the World Climate Change Research Program (WCRP) are effective tools for predicting future climate change, and have been widely used to study the impact of climate change on the processes of the hydrological cycle (Stouffer et al., 2017; Zhang and Chen, 2021). Some studies have noted that the models in the CMIP could well simulate the variation of various climate elements on a large scale (Fu et al., 2021; Zhu et al., 2021). However, due to the differences in simulation mechanisms, initial condition setting, parameterization scheme setting, spatial resolution and so on of each model, the performance of GCMs in various regions is quite different (Song Y. H. et al., 2021; You et al., 2021). Therefore, assessing the regional applicability of GCMs is of great importance for further research on the impact of climate change on the regional hydrological cycle.
A growing body of research has evaluated the applicability of the GCMs in the CMIPs to various regions. Chen et al. (2020) compared the ability of CMIP6 and CMIP5 models to simulate the global extreme climates, and found that the simulated results of CMIP6 models were usually closer to the observations than that of the CMIP5 for most regions, especially for temperature simulations. Iqbal et al. (2021) evaluated the precipitation simulation capability of 35 GCMs in the CMIP6 in Southeast Asia, and the results indicated that most GCMs could well simulate the precipitation change in the region. Khan et al. (2021) used Bayesian models to averagely evaluate the applicability of the 13 GCMs in the CMIP5 over the Indus River Basin, and the results showed that the optimal models for simulating temperature and precipitation were not consistent. Therefore, due to the good applicability of the GCMs in the CMIP6 and the uncertainty of the models, it is necessary to conduct a regional climate model evaluation. Zhu et al. (2021) analyzed the extreme climate predictions of China when global warming was 1.5°C, 2°C, and 3°C higher than the industrialization (1861–1900) period based on the latest (CMIP6) simulations, and compared them with the simulation results of the CMIP5. The evaluation showed that the GCMs in the CMIP6 performed better than those in the CMIP5, especially in simulating extreme precipitation. Yang et al. (2021) assessed the performance of 20 coupled GCMs in the CMIP6 in simulating temperature and precipitation in China, and found that the GCMs in the CMIP6 could reproduce the spatial distributions of temperature and precipitation. Dabang et al. (2020) compared the simulation ability of GCMs in the CMIP5 and CMIP6 in terms of temperature and precipitation in China from 1961 to 2005, and the results indicated that the current GCMs in the CMIP6 simulated lower temperatures and higher precipitation across the country compared with the CMIP5 models, but with little improvement in interannual temperature and winter monsoon. Overall, the CMIP models could well simulate the regional precipitation in China, despite some overestimations.
The Yellow River is the mother river of China. The river basin suffers from frequent droughts, floods and has been severely affected by climate change. Exploring the changes in the hydrological processes of the Yellow River Basin under future climate scenarios could promote the sustainable development of the basin (Niu et al., 2021). At present, most studies evaluating the performance of GCMs have been conducted for large research areas, such as China or the world, but relatively few studies have been conducted over basin-scales, such as the Yellow River Basin, where the simulation capabilities of GCMs in spatial and temporal have not been comprehensively considered (Yang et al., 2018; Zhou and Han, 2018). The CMIP6 is the latest global atmospheric and coupled model intercomparison plan proposed by the WCRP and has the largest number of participating models, the most complete design of scientific experiments, and the largest simulated data in more than 20 years of the CMIP (Song Z. et al., 2021). The urgent problem is how to choose a suitable model for the study area from a large number of model data. The objective of this work is to evaluate the abilities of the 19 GCMs in the CMIP6 to simulate precipitation in the Yellow River Basin, and select suitable GCMs with better simulation abilities to provide a basis and reference for the hydrological cycle process in response to the future climate change, water resources planning and management in the basin.
Study Area and Data Description
Study Area
The Yellow River is the second-longest river in China, is located between 96°25′—118°75′E and 32°75′—41°75′N, has a drainage area of 79.5 × 10⁴ km2 and with a total river length of 5,464 km. The terrain of the Yellow River Basin is high in the west and low in the east, which is dominated by mountains in the middle and upper reaches of the Yellow River, and the middle and lower reaches are dominated by plains and hills, forming the three-level ladder from upper down to lower down (Figure 1). The annual precipitation in most parts of the basin is between 200 and 650 mm, with more than 650 mm in the southern and lower reaches of the middle and upper reaches. In particular, the northern slope of the southern Qinling Mountains generally has 700–1,000 mm in precipitation, while the inland areas of northwest Ningxia and Inner Mongolia have less than 150 mm. Those elements significantly affect the climate of different regions in the basin, with large annual and seasonal variations in the climatic elements, hence the frequent droughts and floods (Song S. et al., 2021; Xu et al., 2021).
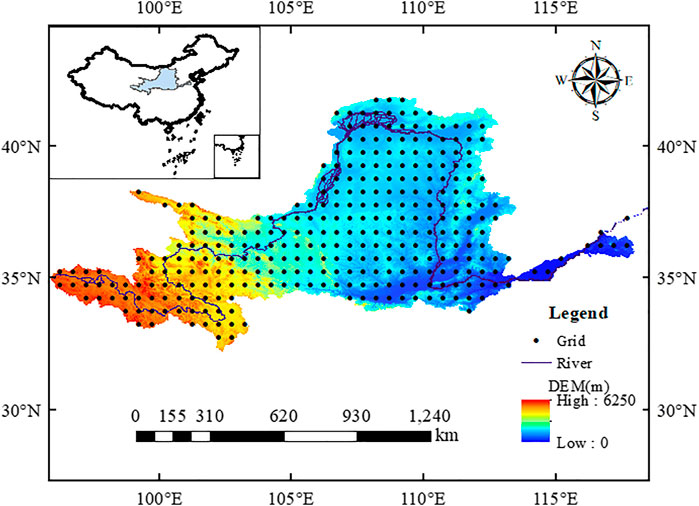
FIGURE 1. Meteorological grid and river system of the Yellow River Basin.
Data Description
The observed data of precipitation over the Yellow River Basin applied in this paper comes from the CN05.1 data set, which was provided by the National Meteorological Center in China. The data set covers the years 1961–2018 with a spatial resolution of 0.25° × 0.25°, with good consistency and applicability (Pang et al., 2021; Shu et al., 2021). Considering the integrity of stimulated data, we chose the data to form the 19 GCMs in the CMIP6, which were obtained from the official website of CMIP6 (https://esgfnode.llnl.gov/projects/cmip6). The specific model information is shown in Table 1, and all the models are at daily resolution. Because the resolution of each model and the observed data is different, the bilinear interpolation method was used to interpolate to the resolution of 0.5° × 0.5° to facilitate comparison. After the interception, there are 317 grids in the Yellow River Basin, as shown in Table 1. The data series from 1961 to 2014 were selected for evaluation and analysis.
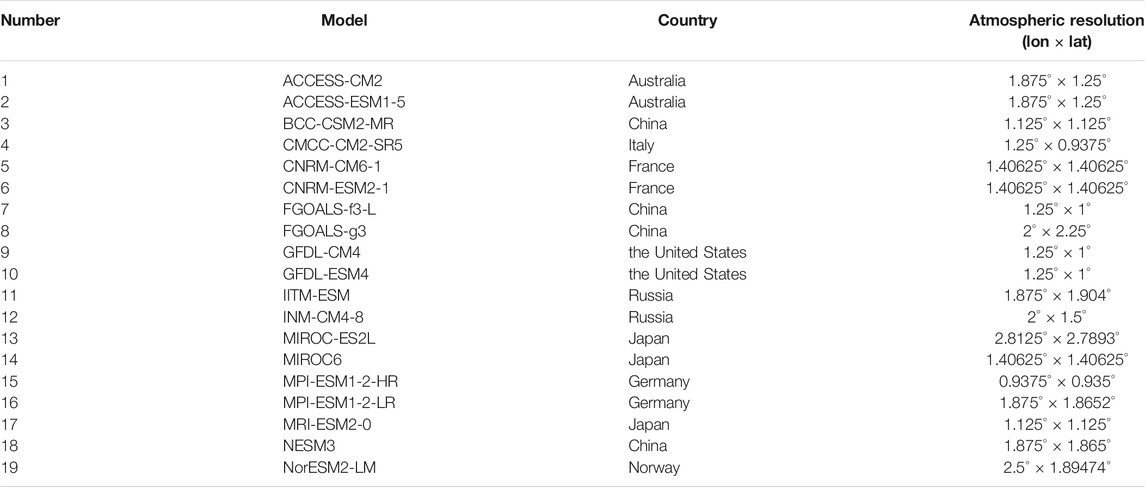
TABLE 1. Basic information of the GCMs of the CMIP6 used in this study. The “lon” means longitude, the “lat” means latitude, the “lon × lat” means the spatial resolution of each model.
Methodology
The ability of the different GCMs to reproduce the properties of those observed at the study area was assessed using eight statistical indices. The evaluated indices and methods were shown in Table 2.
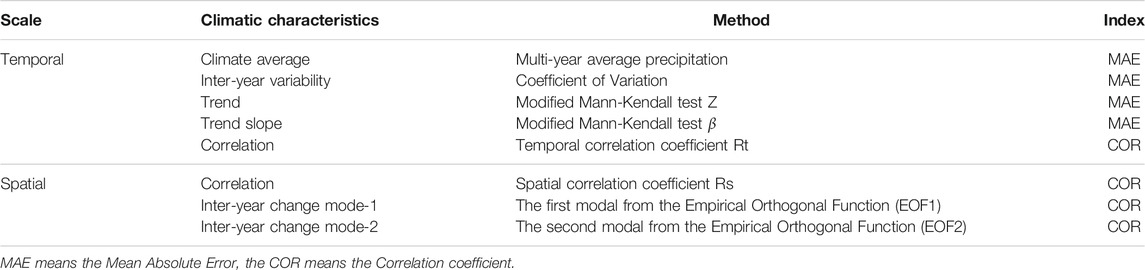
TABLE 2. Statistical indices and evaluation methods applied in this study.
For the simulation ability on the temporal scale, the average annual precipitation and the coefficient of variation were used to evaluate the mean state and the inter-annual variability. In addition, the Modified Mann-Kendall (MMK) method was used to test the long-term change trend of the series, then the correlation coefficient method was used to calculate the temporal correlation coefficient, and evaluate the correlation between the observations and the simulated series (Hamed and Rao, 1998). In addition to using the spatial correlation coefficient to judge the spatial correlation between the observations and the simulations, the Empirical Orthogonal Function modal decomposition (EOF) method was applied to comprehensively evaluate the spatial modal simulation ability of the GCMs (Sang et al., 2021). Finally, combining the above eight indicators, the Rank Scoring (RS) method was used to evaluate the ability of the 19 GCMs to simulate the precipitation in the Yellow River Basin.
1) The method for calculating the Mean Absolute Error (MAE) is:
Where
2) Correlation coefficient (COR) is calculated as:
When calculating the temporal correlation coefficient,
3) The advantage of the RS method is that it gives a unified evaluation result for different evaluation indicators, and can also analyze a single feature value, which makes the evaluation result more intuitive and objective, so it is more conducive to comprehensive evaluation. This method first calculates the degree of fitness between the simulated sequence and the observed sequence of various statistical feature values, then assigns a score of 0–10 to each model according to the degree of fitness, which can be effectively applied to different regions (Shiru and Chung, 2021). The calculation method is as follows:
Where
Results and Discussion
Comprehensive Evaluation for the Stimulated Ability of GCMs
The RS scores of each index and total scores of 19 GCMs were shown in Table 3.
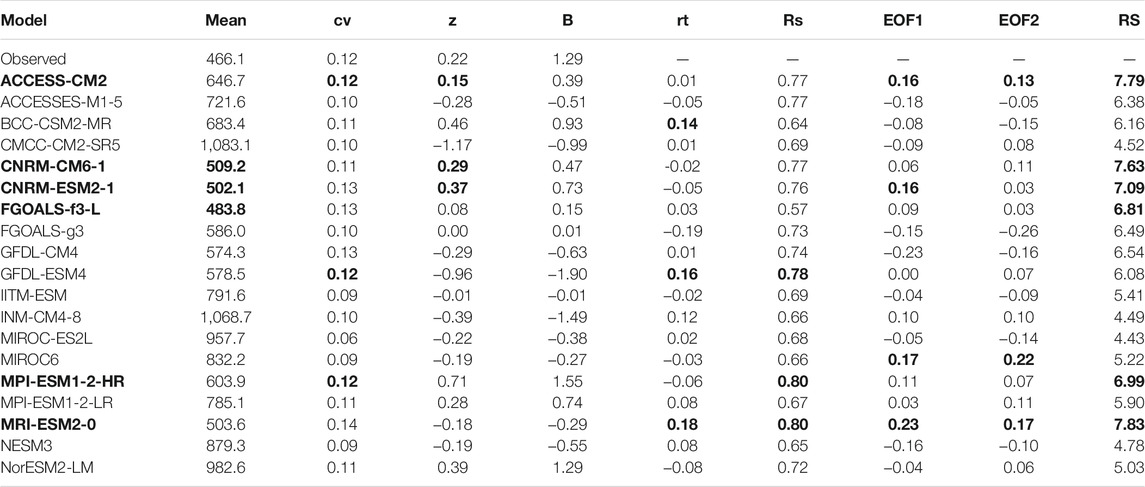
TABLE 3. Statistical indices values and RS total scores of precipitation simulated by 19 GCMs. The models and indicators in bold were the relatively better ones in the table, and the indicators in bold were performed best in each category.
It can be seen that the simulation capabilities of the 19 GCMs were quite different. The highest RS score was 7.83 (MRI-ESM2-0) and the lowest was 4.52 (CMCC-CMA-SR5). The models with relatively higher scores were MRI-ESM2-0 (7.83), ACCESS-CM2 (7.79), CNRM-CM6-1 (7.63), CNRM-ESM2-1 (7.09), MPI-ESM1-2-HR (6.99) and FGOALS-f3-L (6.81) (Figure 2). The results showed that no model performs well for each indicator. Each GCM had better or poorer performance indicators than others, which indicated the necessity of a comprehensive evaluation of indicators.
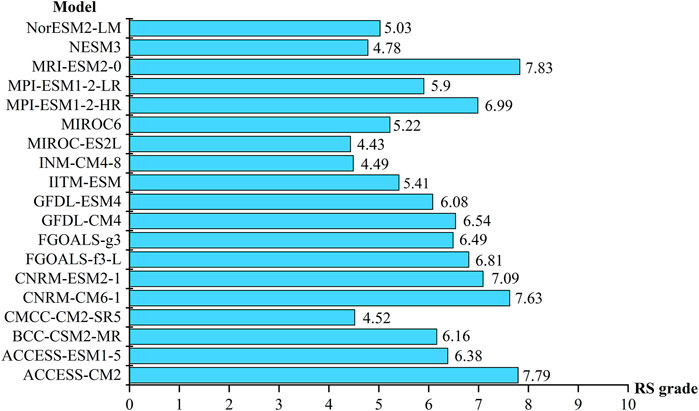
FIGURE 2. RS scores of the 19 GCMs in CMIP6.
The average annual precipitation of observation in the Yellow River Basin was 466.1 mm, while those of the 19 GCMs ranged from 483.8 to 1,083.1 mm. Therefore, all models overestimated the average annual precipitation. The closest simulated value was from FGOALS-f3-L (483.8 mm), while the greatest overestimation was from model CMCC-CM2-SR5 at 1,083.1 mm. Previous studies noted that most climate models overstimulated the precipitation in the basin, a factor related to that was the more convective precipitation simulated by the GCMs (Zhou and Han, 2018). For the inter-annual variability, there was little difference between the models. It showed that the spatial variation of the simulated annual precipitation in most GCMs was close to the observation in terms of the coefficient of variation. In addition, the precipitation of the basin from 1961 to 2014 showed an insignificant increase trend (Z<±1.96), and nine models that could simulate the increasing trend. However, the Z value of the best scored MRI-ESM2-0 was −0.18, which failed to simulate the increasing trend of the observation. But the better performance of other climatic characteristics made up for the lack of trend simulation, which showed that quantitative assessment of the sensitivity of climate characteristics is a problem that needs further research (Yazdandoost et al., 2020). Finally, in terms of spatial and temporal correlation, though almost all of the GCMs showed highly spatial correlation, they performed badly on temporal correlation, with 8 GCMs showing negative correlation, implying a large deviation between the simulated value and the observation (Figure 3). For example, the precipitation stimulated by MRI-ESM2 0 at 32.75°N 102.75°E was 1,418.1 mm, while the observed precipitation over this grid was 848.37 mm, so there is a significant deviation between the simulation and the observation.
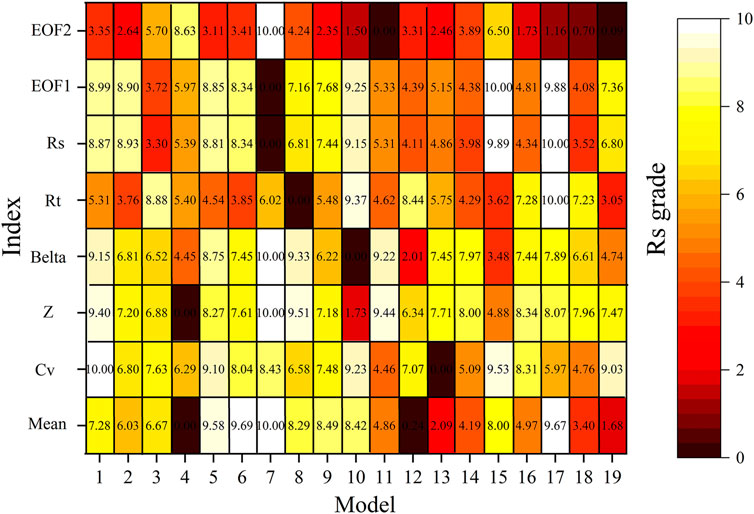
FIGURE 3. Comparison of the RS scores of the eight indicators over the 19 GCMs, 1–19 are the 19 CMIP6 models listed in Table 1: ACCESS-CM2, ACCESS-ESM1-5, BCC-CSM2-MR, CMCC-CM2-SR5, CNRM-CM6-1, CNRM-ESM2-1, FGOALS-f3-L, FGOALS-g3, GFDL-CM4, GFDL-ESM4, IITM-ESM, INM-CM4-8, MIROC-ES2L, MIROC6, MPI-ESM1-2-HR, MPI-ESM1-2-LR, MRI-ESM2 0, NESM3, NorESM2-LM.
Simulation of Temporal Characteristic
Simulation of Annual Precipitation
The ability of the different GCMs to reproduce the properties of those observed at the study area was assessed using eight statistical indices. The evaluated indices and methods were shown in Table.
Table indicated that the annual precipitation in the Yellow River Basin showed an insignificant increase from 1961 to 2014. The maximum precipitation occurred in 1964 (597.7 mm), and the minimum precipitation was in 1965 (342.2 mm). Figure 4 showed the annual precipitation change of the six models with higher scores. Almost all of the models could simulate the inter-annual change of precipitation in the basin. However, not only the annual precipitation in the Yellow River Basin was overestimated, but the simulation value of peak and valley also lagged. Moreover, the peak value was obviously overestimated, and the valley value was underestimated, which is related to the uncertainty of the climate model and the resolution of the data (Orlowsky and Seneviratne, 2013). For example, the highest scored MRI-ESM2-0’s simulated annual precipitation in 1964 was 669.3 mm, and the simulated annual precipitation in 1965 appeared to be 470.1 mm (Table 4), which was the closest to the observed data among the six optimal models. It also had the least hysteresis impact, so the GCMs ranked high by the RS method were seen to have better abilities in replicating the historical variation of inter-year precipitation in the Yellow River Basin.
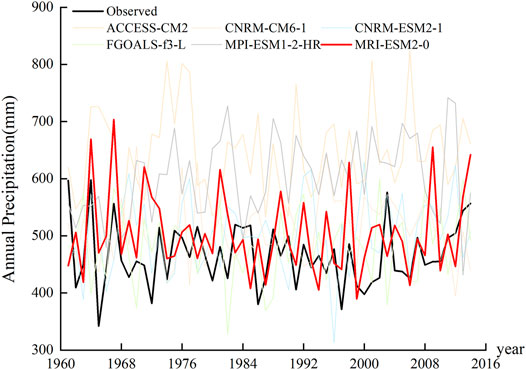
FIGURE 4. Annual precipitation of the six higher-scoring GCMs and the observed data. The red line denotes the GCM with the highest score in the comprehensive evaluation.
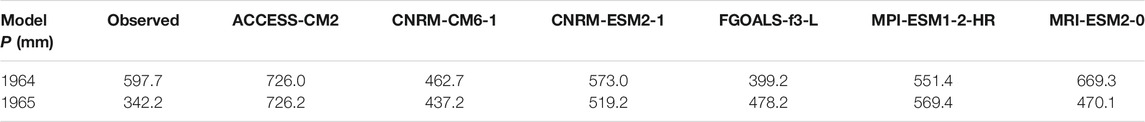
TABLE 4. Annual precipitation of six higher-scoring GCMs and observed precipitation from 1964 to 1965.
In order to compare the uncertainty of the simulated annual precipitation in the Yellow River Basin between the GCMs, the uncertainty interval of the annual precipitation stimulated by 19 GCMs and six higher-scoring models were calculated with absolute deviations (Figure 5). Among them, the range of the simulated annual precipitation of the 19 models was 313.2–1,391.5 mm, while that of the six higher-scoring models was 313.2–818.4 mm, which indicated that the higher-scoring GCMs significantly reduced the uncertainty of simulated precipitation in the Yellow River Basin.
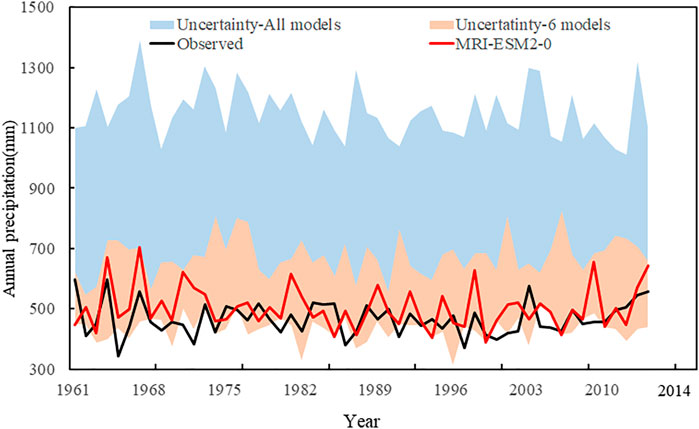
FIGURE 5. Uncertainty interval of stimulated annual precipitation from the 19 GCMs and the six higher-scoring models. The black line is the annual precipitation change of the observed precipitation, and the red line is the annual precipitation change simulated by the GCM with the highest score.
Simulation of the Seasonal Pattern
The maximum monthly precipitation of observed data in the basin from 1961 to 2014 occurred in July (102.2 mm), but it occurred in August in the six models. The maximum monthly precipitation in the basin was overestimated by 113.2 mm by ACCESS-CM2, 110.4 mm by CNRM-CM6-1, and 107.43 mm by CNRM-ESM2-1. However, the other three models underestimated it: FGOALS-f3-L by 91.3 mm, MPI-ESM1-2-HR by 91.4 mm, and MRI-ESM2-0 by 82.5 mm (Figure 6). On the other hand, the minimum monthly precipitation of observation occurred in December with 3.2 mm, but the six models all predicted it to occur in January with higher precipitation than observation. Therefore, the GCMs offer poor simulations of the phase distribution of the monthly extreme precipitation. Furthermore, the wet season in the Yellow River Basin is from May to September, and the dry season is from October to April, the monthly average precipitation was 38.8mm, which was consistent with previous research conclusions (Cui, 2008). Although most GCMs in the CMIP6 could simulate the intra-year variation of wet and dry seasons in the Yellow River Basin, the wet season simulated by the six models except FGOALS-f3-L was April to September, and the monthly average precipitation was higher than the observed data, so the wet season simulated by most GCMs was too long and the precipitation during the period was overestimated.
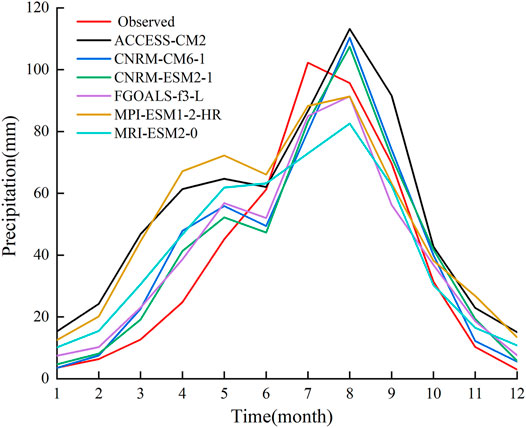
FIGURE 6. Distribution of the intra-year precipitation from the simulated data of six higher-scoring GCMs and observed data.
The observed precipitation indicated that the summer precipitation in the Yellow River Basin was the most abundant, which could reach 259.1 mm, accounting for 55% of the annual precipitation. The winter precipitation was insufficient, only 12.9 mm, accounting for 3% of the annual precipitation. In general, the six higher-scoring GCMs could simulate the seasonal characteristics of the basin with abundant summer precipitation and less precipitation in winter. However, except for the summer precipitation simulated by the ACCESS-CM2 l (261.9 mm), which was slightly higher than the observed data, that simulated by the other five models were lower than observed. Among them, the summer precipitation simulated by the MRI-ESM2-0 model was the lowest of 218.7 mm, indicating that most GCMs in the CMIP6 underestimated the summer precipitation in the basin (Figure 7).
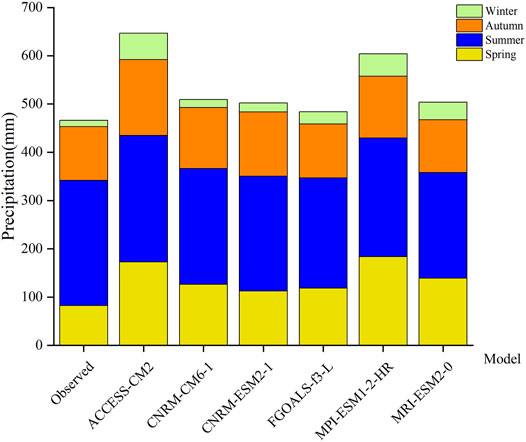
FIGURE 7. Seasonal precipitation of the observation and simulation from the six higher-scoring GCMs, spring is from March to May, summer is from June to August, autumn is from September to November, and winter is from December to February.
The observed autumn precipitation (111.42 mm) was also higher than the spring precipitation (82.6 mm) in the Yellow River Basin. While the CNRM-ESM2-1 model could simulate the changes of the spring and autumn precipitation, the precipitation in spring simulated by the other five models was higher than that in autumn. Some studies concluded that the wet season was from May to September in the Yellow River Basin, with the highest precipitation in summer, and the precipitation in autumn was significantly higher than that in spring (Li et al., 2016; Yuan et al., 2016). Therefore, the GCMs could not well simulate the changes of precipitation in the basin in spring and autumn, and obviously overestimated the precipitation in spring and underestimated it in summer.
Simulation of Spatial Characteristic
Spatial Distribution Characteristics of Precipitation
The average annual precipitation in the Yellow River Basin decreases from south to north, the maximum grid average annual precipitation is 831.4 mm while the minimum is 157.8 mm (Table 5). Figure 8 indicated that the GCMs could well simulate the spatial distribution characteristics of the annual precipitation in the Yellow River Basin. However, they all overestimated the maximum precipitation, and underestimated the minimum precipitation, especially overestimated the precipitation in the source area of the Yellow River.

TABLE 5. Maximum and minimum average annual precipitation of the grids simulated by the observed and the six higher-scoring GCMs over the Yellow River Basin.
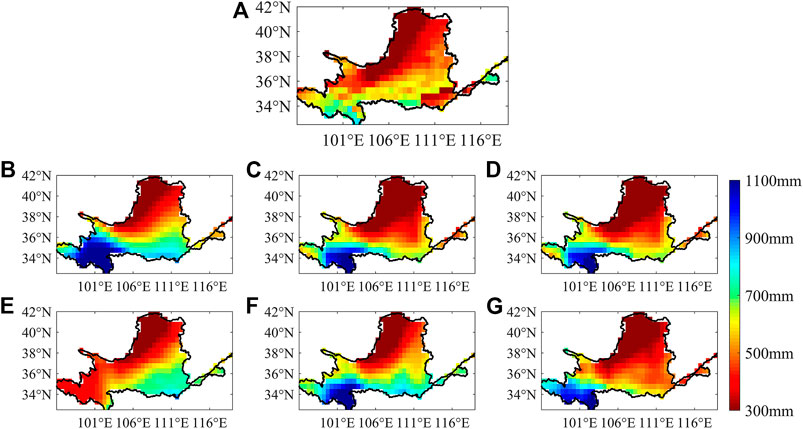
FIGURE 8. Spatial distribution of average annual precipitation from the observation and six higher-scoring GCMs. Panels (A–G) are the observed data, ACCESS-CM2, CNRM-CM6 -1, CNRM-ESM2-1, FGOALS-f3-L, MPI-ESM1-2-HR, MRI-ESM2-0, respectively.
In order to further analyze the ability of the 6 GCMs to replicate the spatial distribution of average annual precipitation in the Yellow River Basin, this paper calculated the relative deviation of the average annual precipitation from the six higher-scoring GCMs and observed data (Figure 9). The results indicated that except for the CNRM-ESM2-1, which underestimated the average annual precipitation in the source area of the Yellow River, the other five models significantly overestimated it. Besides that, the six models all underestimated the precipitation in the northern part of the middle reaches of the Yellow River Basin, and there was also a significant underestimation in the lower reaches of the basin. Therefore, the GCMs had large uncertainties in the simulation of the spatial distribution of the precipitation in the Yellow River Basin. Xu et al. (2010) assessed the uncertainty in the impacts of climate change on river discharge in the Yangtze and Yellow River Basins, and found that the precipitation in the Yellow River Basin simulated by the GCMs was obviously affected by regional climate characteristics. The climatic conditions of the basin from the source region to the lower reaches are very complex, which increases the uncertainty of climate model simulations (Bao and Feng, 2014).
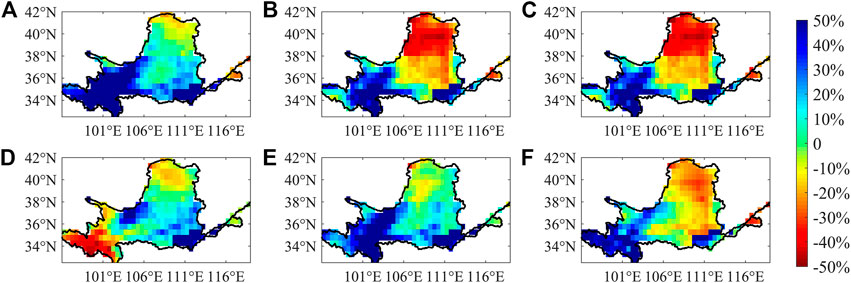
FIGURE 9. Deviation of the spatial distribution of the average annual precipitation in the Yellow River Basin simulated by six higher-scoring GCMs. Panels (A–F) are ACCESS-CM2, CNRM-CM6 -1, CNRM-ESM2-1, FGOALS-f3-L, MPI-ESM1-2-HR, MRI-ESM2-0.
Spatial Distribution Characteristics of Precipitation Modalities
The spatial distribution of the first mode and the second mode was obtained by the EOF decomposition of the observed average annual precipitation in the Yellow River Basin (Figures 10A, 11A). The cumulative explained variance of the first and second modes of the average annual precipitation in the Yellow River Basin was 98.48%, which could almost explain the spatial and temporal variability of the basin. On the one hand, the explained variance of the first mode was 97.89% and the mode over the whole basin showed a consistent trend. The EOF1 of the whole basin was a positive signal, the maximum variability was located in the northern part of the middle reaches, which decreases from the north to the south over the Yellow River Basin. The explained variance of the second mode of the average annual precipitation in the Yellow River Basin was 0.52%, which was represented by the characteristic of east-west antiphase bounded by the middle part of the Yellow River. Among them, the negative signal was from the source of the Yellow River to the middle reaches, and the positive signal was from the middle reaches to the lower reaches of the basin. Liu and Zheng (2002) and Hao et al. (2010) used the EOF method to study the spatial pattern of precipitation in the Yellow River Basin under the impact of climate change, and the results noted that the spatial structure of precipitation in the Yellow River Basin could be divided into four types: “total consistency”, “north-south”, “west-east” and “complex” due to the particularity of geographical location and climatic conditions. Therefore, the spatial modal distribution characteristics of the average annual precipitation in the Yellow River Basin obtained in this paper were reasonable. The GCMs could well simulate the spatial variation of the EOF mode of the average annual precipitation in the Yellow River Basin, and the explained variance was higher than the observed data, so there was an over-fitting phenomenon (Figure 10). In addition, the six higher-scoring GCMs could simulate the spatial characteristics of the first mode and the second mode in the basin (Figure 11). However, most GCMs overestimated the simulated variability of the first mode in the northern part of the basin and the second mode in the source region of the Yellow River. Of the GCMs, the CNRM-CM6-1 had the best simulation effect on the spatial characteristics of the first and second modes of the average annual precipitation in the basin. The explained variance, in this case, was closest to the observed data, and the phenomenon of overestimating the modal variability was not very significant.
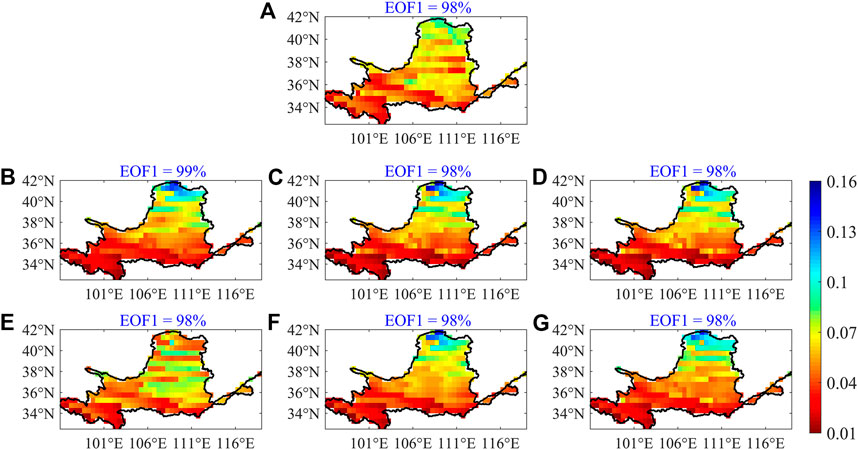
FIGURE 10. Spatial distribution of the first EOF mode (EOF1) of the average annual precipitation from observation and six higher-scoring GCMs. Panels (A–G) are the observed data, ACCESS-CM2, CNRM-CM6 -1, CNRM-ESM2-1, FGOALS-f3-L, MPI-ESM1-2-HR, MRI-ESM2-0.
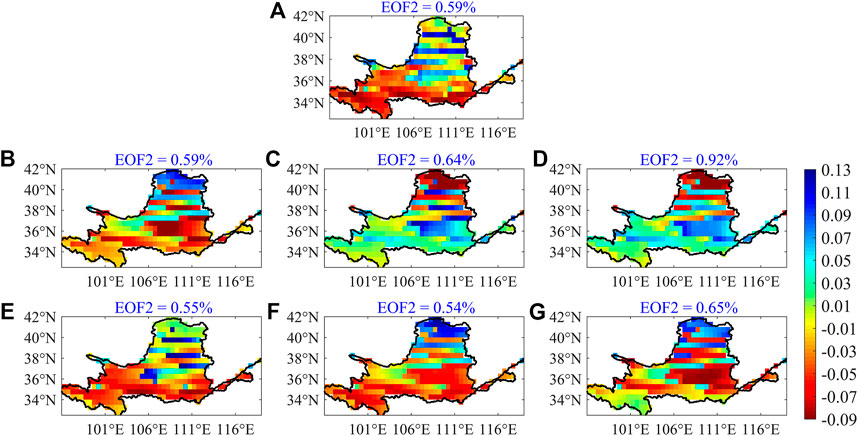
FIGURE 11. Spatial distribution of the second EOF mode (EOF2) of the average annual precipitation from observation and six higher-scoring GCMs. Panels (A–G) are the observed data, ACCESS-CM2, CNRM-CM6 -1, CNRM-ESM2-1, FGOALS-f3-L, MPI-ESM1-2-HR, MRI-ESM2-0.
Discussion and Conclusions
Discussion
This study comprehensively evaluated the ability of 19 GCMs from the CMIP6 to simulate the properties of precipitation in the Yellow River Basin, and provided a basis of model selection for research on the hydrological cycle under future climate scenarios in the Yellow River Basin. Woldemeskel et al. (2014) found that different models have great differences in the precipitation simulation capabilities over basin scales, and choosing the better model helps reduce the uncertainty of model simulation. Therefore, this research is of great significance to the prediction of future flood disasters and sustainable development of the Yellow River Basin. In this study, we found that the GCMs in the CMIP6 showed an obvious zoning phenomenon when simulating the spatial distribution of precipitation in the basin. The average annual precipitation in the source area of the Yellow River was overestimated, and underestimated in the middle reaches of the river. This is related to the sophisticated topographical characteristics of the Yellow River Basin. The basin spans the Qinghai-Tibet Plateau, the Loess Plateau, the Guanzhong Plain, the Hetao and the Yinchuan Plain, so the underlying surface and topography of the basin are complex. Such complicated topographical conditions significantly affect the climatic characteristics of the Yellow River Basin.
At present, it is difficult for GCMs to accurately simulate the climate characteristics of the Yellow River Basin, and the resolution of most GCMs in the CMIP6 is still relatively coarse (Hui et al., 2015). Therefore, one urgent problem is how to improve the simulation capabilities of GCMs. In order to better simulate and predict future climate changes in the Yellow River Basin, dynamic or statistical downscaling methods could be used for the GCMs selected in this paper. Besides that, the downscale data could be corrected by the bias correction technology, then it could drive the hydrological models, and explore the impact of future climate changes on the hydrological processes in the Yellow River Basin (Zhao et al., 2019). For hydrological models, it is necessary to use meteorological data with a high resolution, so the multiple models could be considered to drive the hydrological models separately and then aggregated to improve simulation accuracy. Hamlet et al. (2020) found that the multi-model ensemble average enables the simulation errors of different climate models (including the simulation errors of spatial distribution) to offset each other, with a better simulation effect. The simulation capacity will increase as the set of samples increases, but it will gradually stabilize after reaching a certain number of samples. And due to the frequent occurrence of droughts and floods in the Yellow River Basin, combining different climate and land-use scenarios to predict the changes of future extreme drought and flood disasters in the Yellow River Basin is a direction worth studying.
Conclusion
Based on the simulated precipitation data of 19 GCMs in the CMIP6 and the observed data of the Yellow River Basin from 1961 to 2014, this paper selected eight indicators and combined them with the RS method. The ability of the GCMs in the CMIP6 to simulate the temporal and spatial variations of precipitation in the Yellow River Basin was comprehensively evaluated, the conclusions are as follow:
1) The GCMs differed greatly in their ability to simulate precipitation in the Yellow River Basin. The top six GCMs ranking are: MRI-ESM2-0, ACCESS-CM2, CNRM-CM6-1, CNRM-ESM2-1, FGOALS- f3-L, MPI-ESM1-2-HR.
2) Most GCMs overestimated the annual precipitation and poorly simulate the phase distribution of the extremes, although they could simulate the variation of intra-year precipitation. Meanwhile, it also found that the wet season simulated by most GCMs was too long, the precipitation was also overestimated during this period. Most GCMs in the CMIP6 could simulate the variation of precipitation in summer and winter, but they underestimated the summer precipitation and overestimated the spring precipitation in the Yellow River Basin.
3) All GCMs could well simulate the spatial distribution of the annual precipitation over the basin, but there was a significant overestimation phenomenon in the source area, and an underestimation in the northern part of the middle reaches.
4) The GCMs in the CMIP6 performed well in simulating the spatial variation of modal in the Yellow River Basin, the simulation ability of CNRM-CM6-1 was the best. But most models overestimated the simulation variability of the first mode in the northern part of the basin and the second mode in the source area of the Yellow River.
Data Availability Statement
The datasets presented in this study can be found in online repositories. The names of the repository/repositories and accession number(s) can be found below: https://esgf-node.llnl.gov/search/cmip6/.
Author Contributions
LW: writing original draft. JZ and ZS: discussion and suggestions for data anaysis. YW: Grammar modification and polishing. ZB and CL: formal analysis and visualization. XZ: conceptualization and methodology. GW: data curation and software.
Funding
This research has been financially supported by National Key Research and Development Programs of China (Grants: 2016YFA0601500, 2017YFA0605002, 2017YFC0404602), and the National Natural Science Foundation of China (grant nos. 41830863, 51879162, 51609242, 51779146, 41601025), and the State Key Laboratory of Hydrology-Water Resources and Hydraulic Engineering (grant no. 2019nkzd02).
Conflict of Interest
The authors declare that the research was conducted in the absence of any commercial or financial relationships that could be construed as a potential conflict of interest.
Publisher’s Note
All claims expressed in this article are solely those of the authors and do not necessarily represent those of their affiliated organizations, or those of the publisher, the editors and the reviewers. Any product that may be evaluated in this article, or claim that may be made by its manufacturer, is not guaranteed or endorsed by the publisher.
Acknowledgments
Thanks for the CMIP6 model data provided by the CMIP6 official website, thanks for the CN05 grid point precipitation data provided by the China National Climate Center, thanks for all the co-authors for their efforts in this paper, and thanks for the editorial department and reviewers for their support and help in this paper.
References
Alves, J. M. B., Vasconcelos Junior, F. C., Chaves, R. R., Silva, E. M., Servain, J., Costa, A. A., et al. (2018). Evaluation of the AR4 CMIP3 and the AR5 CMIP5 Model and Projections for Precipitation in Northeast Brazil. Front. Earth Sci. 4, 44. doi:10.3389/feart.2016.00044
Bao, J., and Feng, J. (2014). “Evaluation of the Water Vapor Transport over the Yellow River Basin in CMIP5 Models,” in Egu General Assembly Conference.
Chen, H., Sun, J., Lin, W., and Xu, H. (2020). Comparison of CMIP6 and CMIP5 Models in Simulating Climate Extremes. Sci. Bull. 65 (17), 1415–1418. doi:10.1016/j.scib.2020.05.015
Fu, Y., Lin, Z., and Wang, T. (2021). Simulated Relationship between Wintertime ENSO and East Asian Summer Rainfall: From CMIP3 to CMIP6. Adv. Atmos. Sci. 38 (2), 221–236. doi:10.1007/s00376-020-0147-y
Hamed, K. H., and Rao, A. R. (1998). A. Modified Mann-kendall Trend Test for Autocorrelated Data. J. Hydrol. 204 (1-4), 182–196. doi:10.1016/S0022-1694(97)00125-X
Hamlet, A. F., Byun, K., Robeson, S. M., Widhalm, M., and Baldwin, M. (2020). Impacts of Climate Change on the State of Indiana: Ensemble Future Projections Based on Statistical Downscaling. Clim. Change 163 (4), 1881–1895. doi:10.1007/s10584-018-2309-9
Hao, X., Ouyang, X., Xie, S., Shi, S., Linli, L. I., and Luo, L. (2010). The Spatial and Temporal Structure of Precipitation in the Yellow River Basin. Prog. Geogr. 23 (2), 65–69. doi:10.1007/BF02873097
Hui, P., Tang, J., Wang, S., Wu, J., and Kang, Y. (2014). Future Climate Projection under IPCC A1B Scenario in the Source Region of Yellow River with Complex Topography Using RegCM3. J. Geophys. Res. Atmos. 119 (19), 11,205–11,222. doi:10.1002/2014JD021992
Iqbal, Z., Shahid, S., Ahmed, K., Ismail, T., Ziarh, G. F., Chung, E.-S., et al. (2021). Evaluation of CMIP6 GCM Rainfall in mainland Southeast Asia. Atmos. Res. 254 (1), 105525. doi:10.1016/j.atmosres.2021.105525
Jiang, D., Hu, D., Tian, Z., Lang, X., and Lang, (2020). Differences between CMIP6 and CMIP5 Models in Simulating Climate over China and the East Asian Monsoon. Adv. Atmos. Sci. 37 (10), 1102–1118. doi:10.1007/s00376-020-2034-y
Khan, F., Pilz, J., and Ali, S. (2021). Evaluation of CMIP5 Models and Ensemble Climate Projections Using a Bayesian Approach: A Case Study of the Upper Indus Basin, Pakistan. Environ. Ecol. Stat. 28, 383–404. doi:10.1007/s10651-021-00490-8
Li, Q., Yang, M., Wan, G., and Wang, X. (2016). Spatial and Temporal Precipitation Variability in the Source Region of the Yellow River. Environ. Earth Sci. 75 (7), 594. 591-594.514. doi:10.1007/s12665-016-5583-8
Liu, C., and Zheng, H. (2002). Distribution Pattern of Precipitation and its Evolution Characters in the Yellow River Basin, China.
Liu, Q., Yang, Z., and Cui, B. (2008). Spatial and Temporal Variability of Annual Precipitation during 1961-2006 in Yellow River Basin, China. J. Hydrol. 361 (3-4), 330–338. doi:10.1016/j.jhydrol.2008.08.002
Masson-Delmotte, V., Zhai, P., Pirani, A., Connors, S. L., Péan, C., Berger, S., et al. (Editors) (2021). “IPCC, 2021: Summary for Policymakers,” Climate Change 2021: The Physical Science Basis.Contribution of Working Group I to the Sixth Assessment Report of the Intergovernmental Panel on ClimateChange (Cambridge University Press).
Niu, Z., Feng, L., Chen, X., and Yi, X. (2021). Evaluation and Future Projection of Extreme Climate Events in the Yellow River Basin and Yangtze River Basin in China Using Ensembled CMIP5 Models Data. Ijerph 18 (11), 6029. doi:10.3390/ijerph18116029
Orlowsky, B., and Seneviratne, S. I. (2013). Elusive Drought: Uncertainty in Observed Trends and Short- and Long-Term CMIP5 Projections. Hydrol. Earth Syst. Sci. 17 (5), 1765–1781. doi:10.5194/hess-17-1765-2013
Pang, G., Wang, X., Chen, D., Yang, M., and Liu, L. (2021). Evaluation of a Climate Simulation over the Yellow River Basin Based on a Regional Climate Model (REMO) within the CORDEX. Atmos. Res. 254 (4), 105522. doi:10.1016/j.atmosres.2021.105522
Reboita, M. S., Ambrizzi, T., Silva, B. A., Pinheiro, R. F., and da Rocha, R. P. (2019). The South Atlantic Subtropical Anticyclone: Present and Future Climate. Front. Earth Sci. 7, 1–22. doi:10.3389/feart.2019.00008
Sang, Y., Ren, H.-L., Shi, X., Xu, X., and Chen, H. (2021). Improvement of Soil Moisture Simulation in Eurasia by the Beijing Climate Center Climate System Model from CMIP5 to CMIP6. Adv. Atmos. Sci. 38, 237–252. doi:10.1007/s00376-020-0167-7
Shiru, M. S., and Chung, E.-S. (2021). Performance Evaluation of CMIP6 Global Climate Models for Selecting Models for Climate Projection over Nigeria. Theor. Appl. Climatol. 146, 599–615. doi:10.1007/s00704-021-03746-2
Shu, Z., Zhang, J., Jin, J., Wang, L., Wang, G., Wang, J., et al. (2021). Evaluation and Application of Quantitative Precipitation Forecast Products for Mainland China Based on TIGGE Multimodel Data. J. Hydrometeorol. 22, 1199–1219. doi:10.1175/JHM-D-20-0004.1
Song, S., Singh, V. P., Song, X., and Kang, Y. (2021a). A Probability Distribution for Hydrological Drought Duration. J. Hydrol. 599, 12647. doi:10.1016/j.jhydrol.2021.126479
Song, Y. H., Chung, E. S., and Shahid, S. (2021b). Spatiotemporal Differences and Uncertainties in Projections of Precipitation and Temperature in South Korea from CMIP6 and CMIP5 General Circulation Model S. Int. J. Climatol. doi:10.1002/joc.7159
Song, Z., Xia, J., She, D., Li, L., Hu, C., and Hong, S. (2021c). Assessment of Meteorological Drought Change in the 21st Century Based on CMIP6 Multi-Model Ensemble Projections over Mainland China. J. Hydrol. 601, 126643. doi:10.1016/j.jhydrol.2021.126643
Stouffer, R. J., Eyring, V., Meehl, G. A., Bony, S., Senior, C., Stevens, B., et al. (2017). CMIP5 Scientific Gaps And Recommendations For CMIP6. Bull. Am. Meteorol. Soc. 98 (1), 95–105. doi:10.1175/BAMS-D-15-00013.1
Woldemeskel, F. M., Sharma, A., Sivakumar, B., and Mehrotra, R. (2014). A Framework to Quantify GCM Uncertainties for Use in Impact Assessment Studies. J. Hydrol. 519, 1453–1465. doi:10.1016/j.jhydrol.2014.09.025
Xu, H., Taylor, R. G., and Xu, Y. (2010). Quantifying Uncertainty in the Impacts of Climate Change on River Discharge in Sub-catchments of the Yangtze and Yellow River Basins, China. Hydrol. Earth Syst. Sci. 15 (1), 333–344. doi:10.5194/hess-15-333-2011
Xu, Z., Zhang, S., and Yang, X. (2021). Water and Sediment Yield Response to Extreme Rainfall Events in a Complex Large River basin: A Case Study of the Yellow River Basin, China. J. Hydrol. 597 (2), 126183. doi:10.1016/j.jhydrol.2021.126183
Yang, X., Zheng, W., Ren, L., Zhang, M., Wang, Y., Liu, Y., et al. (2018). Potential Impact of Climate Change to the Future Streamflow of Yellow River Basin Based on CMIP5 Data. Proc. IAHS 376, 97–104. doi:10.5194/piahs-376-97-2018
Yang, X., Zhou, B., Xu, Y., and Han, Z. (2021). CMIP6 Evaluation and Projection of Temperature and Precipitation over China. Adv. Atmos. Sci. 38 (5), 817–830. doi:10.1007/s00376-021-0351-4
Yazdandoost, F., Moradian, S., Izadi, A., and Aghakouchak, A. (2021). Evaluation of CMIP6 Precipitation Simulations across Different Climatic Zones: Uncertainty and Model Intercomparison. Atmos. Res. 250, 105369. doi:10.1016/j.atmosres.2020.105369
You, Q., Cai, Z., Wu, F., Jiang, Z., Pepin, N., and Shen, S. S. P. (2021). Temperature Dataset of CMIP6 Models over China: Evaluation, Trend and Uncertainty. Clim. Dyn. 57, 17–35. doi:10.1007/s00382-021-05691-2
Yuan, F., Berndtsson, R., Uvo, C. B., Zhang, L., and Jiang, P. (2016). Summer Precipitation Prediction in the Source Region of the Yellow River Using Climate Indices. Hydrol. Res. 47, 847–856. doi:10.2166/nh.2015.062
Zhang, S., and Chen, J. (2021). Uncertainty in Projection of Climate Extremes: A Comparison of CMIP5 and CMIP6. J. Meteorol. Res. 35 (4), 646–662. doi:10.1007/s13351-021-1012-3
Zhao, F., Shuo-Ben, B. I., Xing-Yu, L. I., Wei-Ting, W. U., and Jiang, T. T. (2019). Spatial Characteristics of Drought/flood Disasters Based on EOF and REOF in the Middle and Lower Reaches of the Yellow River from 1470 to 1911. Arid Land Geogr. 42 (4), 799–809.
Zheng, H., and Liu, C. (2004). On Evolution Modes of Water Resources in the Yellow River Basin[J]. Acta Geographica Sinica 59 (2), 267–273.
Zhou, W. C., and Han, Z. Y. (2018). Assessing CMIP5 Climate Simulations and Objective Selection of Models over the Yellow River Basin. J. Meteorol. Environ. 34 (06), 42–55.
Keywords: CMIP6, climate model, precipitation simulation, comprehensive assessment, the yellow river basin
Citation: Wang L, Zhang J, Shu Z, Wang Y, Bao Z, Liu C, Zhou X and Wang G (2021) Evaluation of the Ability of CMIP6 Global Climate Models to Simulate Precipitation in the Yellow River Basin, China. Front. Earth Sci. 9:751974. doi: 10.3389/feart.2021.751974
Received: 02 August 2021; Accepted: 12 October 2021;
Published: 29 October 2021.
Edited by:
Shan Zhao, Shandong University, ChinaReviewed by:
Brian Ayugi, Nanjing University of Information Science and Technology, ChinaChunhui Li, Beijing Normal University, China
Copyright © 2021 Wang, Zhang, Shu, Wang, Bao, Liu, Zhou and Wang. This is an open-access article distributed under the terms of the Creative Commons Attribution License (CC BY). The use, distribution or reproduction in other forums is permitted, provided the original author(s) and the copyright owner(s) are credited and that the original publication in this journal is cited, in accordance with accepted academic practice. No use, distribution or reproduction is permitted which does not comply with these terms.
*Correspondence: Guoqing Wang, Z3F3YW5nQG5ocmkuY24=