 Hongshan Gao
 Fenliang Liu
 Tianqi Yan1
- 1Key Laboratory of Western China’s Enviromental Systems (Ministry of Education), College of Earth and Environmental Sciences, Lanzhou University, Lanzhou, China
- 2Department of Geographic Information System Science, Hunan City University, Yiyang, China
- 3School of Geographic Sciences, Xinyang Normal University, Xinyang, China
The drainage density (Dd) is an important index to show fluvial geomorphology. The study on Dd is helpful to understand the evolution of the whole hydrological and geomorphic process. Based on the Shuttle Radar Topography Mission 90-m digital elevation model, the drainage network of basins along the eastern margin of the Qinghai–Tibet Plateau is extracted using a terrain morphology-based method in ArcGIS 10.3, and Dd is calculated. The spatial characteristics of Dd are analyzed, and the relationship between Dd and its influencing factors, e.g., the topography, precipitation, and vegetation coverage, is explored. Our results show that terrains with a plan curvature ≥3 can represent the channels in the study area. Dd ranges from 2.5 to 0.1 km/km2, increases first, and then decreases from north to south on the eastern margin of the Qinghai–Tibet Plateau. Dd decreases with increasing average slope and average local relief. On the low-relief planation surfaces, Dd increases with increasing altitude, while on the rugged mountainous above planation surfaces, Dd decreases rapidly with increasing altitude. Dd first increased and then decreased with increasing mean annual precipitation (MAP) and normalized difference vegetation index (NDVI), and Dd reaches a maximum in the West Qinling Mountains with a semi-arid environment, indicating that Dd in different climatic regions of the eastern margin of the Qinghai–Tibet Plateau was mainly controlled by precipitation and vegetation.
Introduction
The Qinghai–Tibet Plateau is the largest and highest plateau with strong tectonic activity and fast geomorphological evolution on Earth (Pan et al., 1995; Pan and Li, 1996; Li and Fang, 1999). In the central plateau, the average altitude is ∼5 km, and the topographic relief is ∼1 km or less (Fielding et al., 1994); many internally drained basins and lakes developed here. In its surrounding areas, the altitude rapidly decreased, and the terrain is seriously broken, characterized by parallel mountains, valleys, and basins. In the north of the plateau, it is still an inland drainage system, flowing to the Tarim Basin and Alxa Plateau. In the eastern part of the plateau, river systems externally flow to the Indian Ocean and Pacific Ocean. Huge topographic relief causes strong surface processes and frequent geological disasters in the margin of the plateau and makes this region the best natural laboratory to study the interaction of surface erosion, tectonic evolution, and climate change (Burbank et al., 2003).
In recent years, with the development of Remote Sensing and Geographic Information System (GIS), many digital elevation model (DEM)-derived geomorphic indexes have been developed, and they are now widely used for quantitatively describing the shape and dimension of the Earth’s landforms and analyzing the geomorphic evolution and the surface process (Mahmood and Gloaguen, 2012; Liu et al., 2019; Radaideh and Mosar, 2019; Ayaz and Dhali, 2020; Kumar and Singh, 2021). Among them, the drainage density (Dd), defined as the ratio between the cumulative length of channels and the area of the drained basin (Horton, 1932), is one of the many physiographic properties of basins considered as an index of surface processes and the basic parameter to control and influence the hydrological characteristics of any basin (Horton, 1945). It is still one of the most commonly used indices for the characterization of fluvially dissected landscapes (Spagnolo, 2002). In the last 60 years, different methodological approaches have been used to estimate Dd in different regions. For a long time, the network was extracted from topographic maps or satellite imagery. But now, drainage networks could be automatically and exactly identified by new technologies (GIS, etc.). In natural river networks, Dd is spatially variable (Tucker and Bras, 1998; Vogt et al., 2007). Many researchers have analyzed the controlling factors of Dd and achieved many research results (Melton, 1958; Gregory and Gardiner, 1975; Daniel, 1981; Howard, 1997; Oguchi, 1997; Tucker and Bras, 1998; Schumm, 1997; Luo and Stepinski, 2007; Giachetta et al., 2014; Sangireddy et al., 2016; Yan et al., 2018). These results show that Dd depends on a variety of factors, including climate and vegetation cover, soil and rock properties, topography, and its evolutionary stages. The scale at which the analysis is performed is also an important factor in understanding the spatial variation of Dd (Morgan, 1973). At the continental scale, the main control on Dd is exerted by climatic variations, while at larger scales, where the climatic conditions can be considered approximately uniform, the spatial variations of Dd are usually more related to lithology and topography (Abrahams, 1984). Especially at three scales—between catchments, within one network, and along specific channel sections—the basic influence of lithology should be considered (Day, 1980). Dd is closely linked to several hydrologic processes including infiltration, soil saturation, sheet erosion, overland flow, and their interactions that control the production of runoff and sediments (Moglen et al., 1998). So the Dd is a comprehensive index reflecting the topographic development stage, local relief, precipitation, soil permeability, and surface erosion resistance. However, only a few studies of Dd have been performed over the eastern margin of the Qinghai–Tibet Plateau.
The major goal of the study is to assess the spatial distribution of Dd in the eastern margin of the Qinghai–Tibet Plateau by using GIS tools and to analyze the possible influencing factors on Dd. In this paper, the Qilian Mountains, West Qinling Mountains, West Sichuan Mountains, and Yunnan Plateau along the eastern margin of the Qinghai–Tibet Plateau were selected as the research areas. Based on DEM data, drainage networks were first extracted, and then Dd was calculated; finally, the spatial distribution characteristics of Dd and its controlling factors were explored. This study can help us to deepen the understanding of drainage system development, geomorphologic evolution, and surface erosion process in this area.
Study Area
The eastern part of the Qinghai–Tibet Plateau is approximately from Dangjin Shankou at the western end of the Qilian Mountains to the Namcha Barwa Mountain at the eastern end of the Himalayas (Figure 1). The Qilian Mountains, West Qinling Mountains, and Hengduan Mountains are three large mountain ranges.
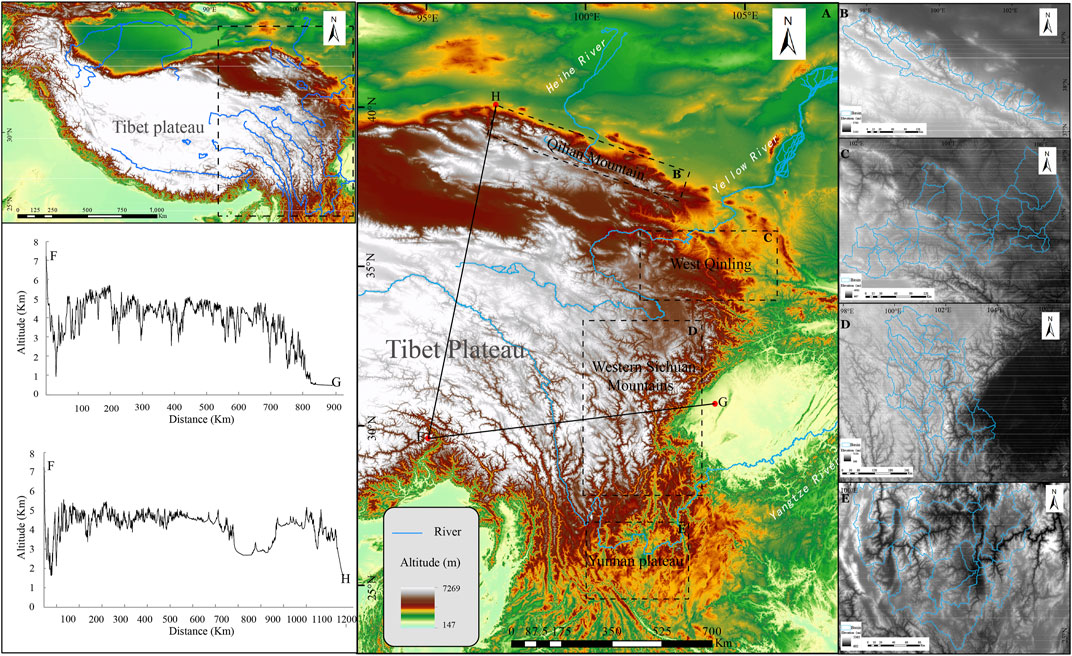
FIGURE 1. Location and topographic characteristics of the study area. (A) Northeast margin of the Qinghai–Tibet Plateau. (B) Qilian Mountains. (C) West Qinling Mountains. (D) Western Sichuan Mountains. (E) Yunnan Plateau.
The Qilian Mountains is a broad mountain system in the northeastern margin of the Qinghai–Tibet Plateau, with an average altitude of 4,000–5,000 m. The northern part of the Qilian Mountains transits to the Hexi Corridor and the Alxa Plateau with a huge topographical relief of 2000–3,000 m. The main part of the Qilian Mountains is a desert landscape with aridity and less rainfall, belonging to a typical temperate continental climate. The southern Qilian Mountains is the Qaidam Basin with an average altitude of ∼3,000 m, belonging to the plateau continental climate. Mean annual precipitation (MAP) decreases from 200 mm in the southeast to 15 mm in the northwest. In addition to some part of the southern flank of the Eastern Qilian Mountains drained by the tributaries of the externally drained Yellow River Basin, other areas are all drained by rivers flowing into endorheic basins. The biggest feature of the macroscopic landform of the Qilian Mountains is that there are a series of roughly parallel mountain ranges trending NW to NWW, with wide valleys or basins between them. The general distribution of precipitation in this area is more in the southeast, 300–600 mm, gradually decreasing to 200 mm in the northwest.
The Qinling Mountains is a huge mountain system across the central part of China, which is located between the North China Block and the Yangtze Block. The western part of the Qinling Mountains is connected to the Qilian Mountains and Kunlun Mountains. These three tectonic units are comprehensive products of long-term geological evolution, and there is no obvious tectonic geomorphologic boundary between them. The West Qinling Mountains and its adjacent areas mainly belong to the Yellow River Basin, and the terrain generally tilts from southwest to northeast. The intermountain basin and hilly belt are widely covered by Quaternary loess strata, where occasionally Tertiary red beds are exposed. MAP is 500–800 mm.
The southeastern Tibetan Plateau south of the West Qinling–Kunlun Mountains is collectively referred to as the Hengduan Mountains. In addition to a huge terrain steep change zone between the Qinghai–Tibet Plateau at an altitude of 4,000 m and the Sichuan Basin at an altitude of 500 m, the eastern boundary of the plateau in other sections is not clearly defined. The mountains in this area are large, the canyons are deep, and only on the watershed divides where headward erosion of modern rivers has not yet reached are planation surfaces preserved (Liu et al., 2019). The altitude of the mountain peak is often above 5,000 m, with most of the surface up to 3,000 m. The general trend of the area tilts from northwest to southeast under the control of north–south compressional deep faults. The natural landscape also changed significantly with the terrain. The forest distribution decreased from south to north and gradually transited from patchy and continuous distribution to patchy and banded distribution. Finally, it was replaced by low shrubs and even showed large bedrock bare land. Affected by the southwest monsoon, the annual precipitation in some snow mountains is more than 1,300 mm, while in some dry-hot valleys, the precipitation drops to 300 mm, and dry deciduous shrubs grow.
Data and Method
Terrain analysis of the eastern margin of the Qinghai–Tibet Plateau is carried out to extract the channel networks and related geomorphic indices (Table 1) based on the Shuttle Radar Topography Mission (SRTM) DEM. The SRTM collected elevation data over 80% of the Earth’s land area by means of radar interferometry. The data set is at present of the best quality, is freely available, and has DEM with three arc resolution. This study uses version 4, in which the holes or voids have been filled. The MAP was calculated based on Tropical Rainfall Measuring Mission (TRMM) satellite precipitation data from 2001 to 2010. The normalized difference vegetation index (NDVI) is a common indicator for detecting vegetation growth status and vegetation density, ranging from −1 to +1, where a negative value corresponds to an absence of vegetation, and the denser the vegetation, the higher its value (DeFries and Townshend, 1994; Kumar et al., 2018; Szabó et al., 2019). Based on the MODIS NDVI images from 2001 to 2010, the NDVI values of each basin were calculated.
TABLE 1. Definition and calculation method of drainage density and related geomorphic and climatic indices.
Extraction of Channel Network From Digital Elevation Model
Many methods exist to extract river networks from DEMs. They can be categorized into two broad groups. The first group mainly relies on flow calculations on DEM cells to simulate flow convergence and to determine drainage networks accordingly (Tarboton et al., 1991, 1992; Montgomery and Foufoula-Georgiou, 1993; Heine et al., 2004; Schneider et al., 2017; Wu et al., 2019). The second group mainly uses comprehensive terrain morphology to recognize river valleys (Yoeli, 1984; Band, 1986; Pelletier, 2013; Xiong et al., 2014; Sangireddy et al., 2016). The most widely used method at small and regional scales, by far, simply relies on flow direction and a critical drainage area (Acr) that represents the minimum upstream drainage area required to initiate a river (O’Callaghan and Mark, 1984). In this classical framework, a single Acr value is used to determine each channel’s origin over a whole river basin; extracted rivers are shorter if the Acr is larger, which results in a smaller drainage density. This method performs well when a river basin’s geomorphologic and erosional characteristics are homogeneous or when only lower-resolution DEMs are used. However, a single Acr value cannot reflect different source areas of real channel heads that caused by non-homogeneity in a river basin, and, consequently, this method is unable to utilize detailed information supplied from high-resolution DEM data to identify the real and non-uniformly distributed channel heads (Li et al., 2020).
To overcome the limitation of the flow direction and Acr-based method, this study uses a terrain morphology-based method to extract channel networks (Luo and Stepinski, 2006, 2007). This method does not rely on flow directions and channelization criteria; instead, it detects valleys directly from comprehensive topographic and geomorphologic features. The basic idea of this method is to map the valleys as parts of the raster having a concave upward (U-like shape) morphology. This method requires careful calculation of plan curvature (Cp). It also requires reconnecting multiple identified segments to a continuous channel network. The procedure involves the following steps.
Plan Curvature Calculation
Plan curvature (Cp, also called contour curvature) is a topographic curvature measured in the direction of the tangent to contour at a given point (x, y) (Mitášová and Hofierka, 1993). The ridgeline and valley line show a large degree of local bending on the contour line, the contour line at the valley is concave upward, and the contour line at the ridge is convex downward.
To compute Cp, the original DEM was simulated into a continuous surface H (x, y), and a second-order polynomial of surface fitting function was established by using the x, y coordinates of the DEM grid and altitude.
According to the altitude and x, y coordinates of known points in DEM, the correlation coefficient is calculated. Cp is
The positive values of Cp indicate concave upward (U-like shape) morphology corresponding to valleys. In order to minimize the noise, the values of Cp are calculated analytically for each cell in the raster using a polynomial approximation to the local patch of the surface defined on a 5 × 5 cell neighborhood centered on a focus cell.
Plan Curvature Threshold Setting
In order to identify valleys, a Cp threshold should be specified. In principle, this threshold should be equal to 0 (identification of all positive values); however, only when a terrain is sufficiently upward curved can it become a valley, so the threshold is generally larger than 0 (Howard, 1994; Luo and Stepinski, 2006; Luo and Stepinski, 2007; Tarolli and Dalla, 2009; Pirotti and Tarolli, 2010; Orlandini et al., 2011). The research results of high-precision LiDAR data and differential GPS field measurement analysis indicate that the average Cp of the channel source is roughly equal (Tarolli and Dalla, 2009; Pirotti and Tarolli, 2010; Orlandini et al., 2011), so valleys can be identified by setting the same threshold for Cp of different regions.
In order to set a suitable Cp threshold to obtain a more precise valley network, first, four small basins were selected as the experimental area, they are the Shagou River, Liulingou River, Zhongdashigou River, and Daqinggou River from the Qilian Mountains, West Qinling Mountains, Western Sichuan Plateau, and Yunnan Plateau, respectively. Google Earth was used to visually interpret and digitize the channel networks in these basins (Figure 2A). Then, eighty different Cp thresholds (0, 1, 2, 3, 4, 5, 6, 7, and 8) were applied to extract the channels in these basins (Figure 2B). The channel networks obtained manually by using the Google Earth digitization method were compared with the one obtained by using the terrain analysis method, and the distance error between the channel head locations obtained by these two methods was also calculated. It can be found that the distance error of the channel head location decreases first and then increases with the increase of Cp. When Cp value is 3, the distance error of the channel head location in the four watersheds reaches a minimum (Figure 2C).
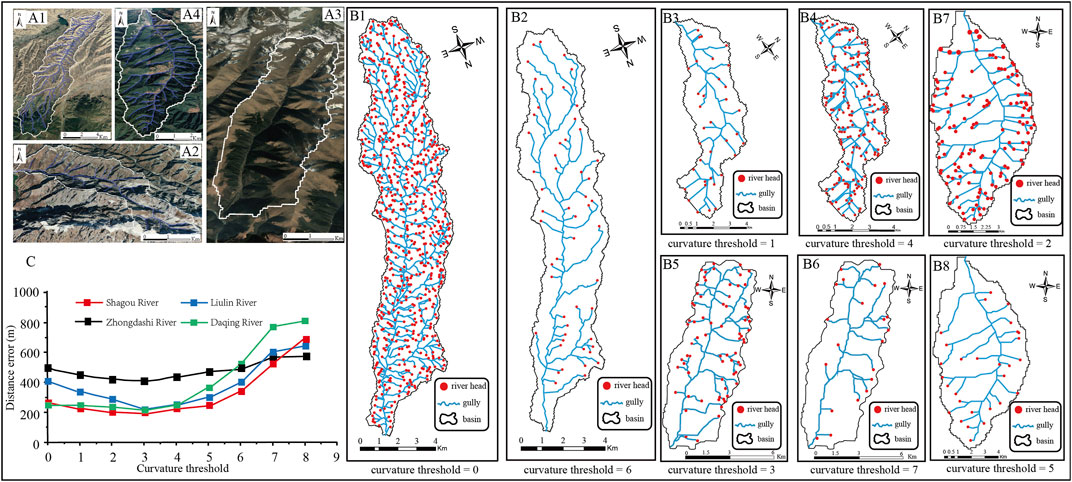
FIGURE 2. (A) Channel networks of four experimental areas extracted using Google Earth digitization method: (A1) (Shagou Basin; (A2) Liulingou Basin; (A3) Zhongdashigou Basin; and (A4) Daqinggou Basin. (B) Channel networks and channel heads of four experimental areas extracted using topography analysis method based on different plan curvature (Cp) thresholds: (B1) Shagou Basin, Cp thresholds = 0; (B2) Shagou Basin, Cp thresholds = 6; (B3) Liulingou Basin, Cp thresholds = 1; (B4) Liulingou Basin, Cp thresholds = 4; (B5) Zhongdashigou Basin, Cp thresholds = 3; (B6) Zhongdashigou Basin, Cp thresholds = 7; (B7) Daqinggou Basin, Cp thresholds = 2; (B8) Daqinggou Basin, Cp thresholds = 5. (C) The errors between channel heads obtained manually by using Google Earth digitization method and the one obtained by using topography analysis method based on different Cp thresholds.
In contrast, in the channels extracted by the flow direction and Acr-based method, although the overall distance error of the channel head location increases gradually with the increase of Acr, the Acr is different for these four experimental basins to reach minimum distance error of the channel head location. The Acr for the Shagou River is 0.4 km2, that of the Liulingou River is 0.2 km2, and that of Zhongdashigou River and Daqinggou River is 0.1 km2. It can be seen that for the flow direction and Acr-based method, different Acr values need to be set according to the actual situation in different regions to extract the reasonable valleys closest to the actual situation.
Therefore, a Cp value of 3 was chosen as the threshold to extract the channel networks in the study area. The results are a collection of disconnected terrain segments representing the channel’s fragments.
Channel Fragment Connection
In order to obtain a complete continuous channel network, these channel segments should be connected. The network of drainage directions is used as auxiliary information to aid the connection of various channel segments. First, the flow direction was assigned to the plan curvature grid, so that it gradually accumulates downward according to the flow direction, and then a continuous curvature accumulation grid is obtained. Then, the curvature accumulation is reclassified, and finally, the channel network grid is obtained. The grid network was converted into a vector file with a raster-to-vector GIS tool.
Dd Calculation
Dd is defined as the total length of channels per unit area. Given a drainage network, Dd is calculated by dividing the total length of the network in a given basin by the total area of that basin
where LT is the total length of channels within area A.
Mapping Dd Using Watershed as Area Unit
A drainage basin is the area unit most commonly used in Dd calculation. In order to obtain high-resolution Dd, the entire region was delineated into 102 sub-basins, and the Dd of each basin was calculated for detailed and sub-basin level morphometric analysis (Figure 3B).
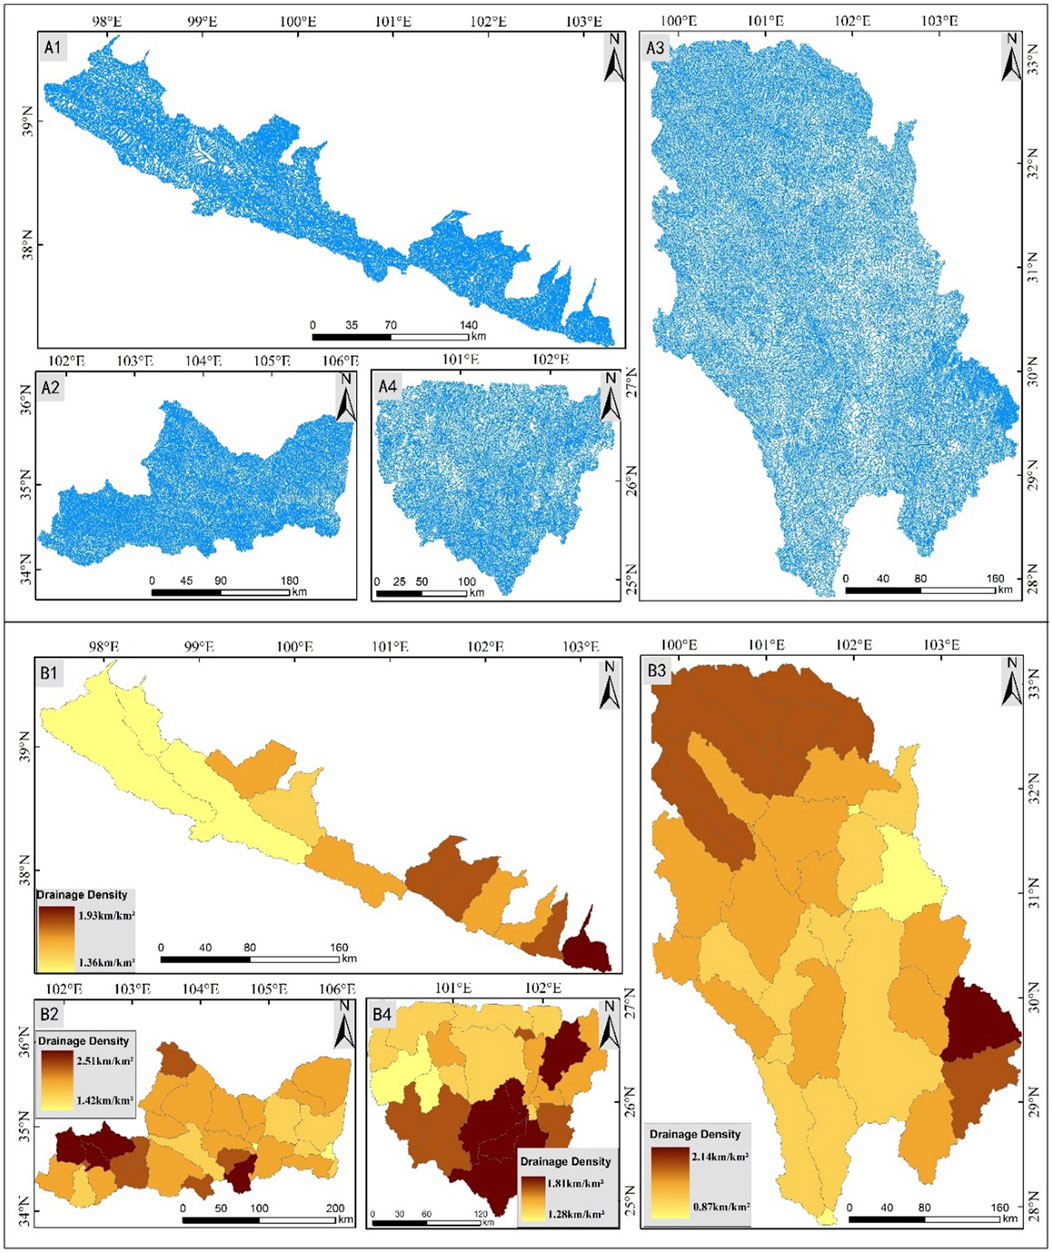
FIGURE 3. (A) Channel networks extracted using terrain analysis method: (A1) Qilian Mountains; (A2) West Qingling Mountain; (A3) West Sichuan Plateau; (A4) Yunnan Plateau. (B) Drainage density map based on watershed: (B1) Qilian Mountains; (B2) West Qingling Mountain; (B3) West Sichuan Plateau; (B4) Yunnan Plateau.
Mapping Dd Using Grid Window as Area Unit
Dd can also be calculated using a grid as an area unit. Dd of each cell is the cumulative length of the channel portions within the cell divided by the area of the cell itself. In order to obtain a suitable window size, the relationship between Dd and window size was evaluated (Figure 4A). It is found that when the window size is less than 5,000 × 5,000 m, Dd increases rapidly with an increase of window size. But when the window size is larger than 5,000 × 5,000 m, Dd change tends to be gentle with the increase of window size. Based on this, a grid with a cell size of 5,000 × 5,000 m was chosen to segment the study area and obtain Dd of each cell (Figure 4B).
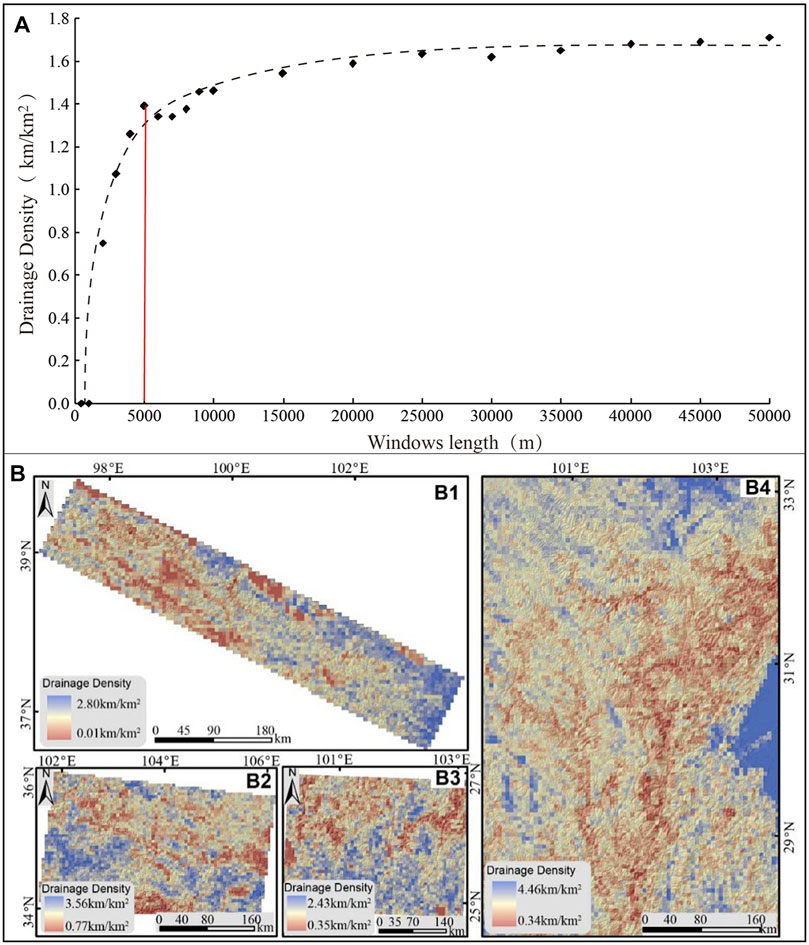
FIGURE 4. (A) Change of drainage density (Dd) with window size. (B) Dd map based on grid window of 5,000 m × 5,000 m: (B1) Qilian Mountains; (B2) West Qingling Mountain; (B3) West Sichuan Plateau; (B4) Yunnan Plateau.
Result and Analysis
Relationship Between Drainage Structure and Dd
The streams of the study area have been ranked according to Strahler’s classification (Strahler, 1957). In this classification, streams with no tributaries are defined as the first order; two first-order streams join to form a second-order stream, etc. In general, two streams of the same order join to form a stream with a stream order increased by one. According to Strahler’s method of ordering, the Shiyang River and Heihe River basins in the Qilian Mountains form the seventh order and eighth order, respectively. The Tao River and Weihe River basins in the West Qinling Mountains form the eighth order and ninth order, respectively. The Yalong River and Dadu River basins in the Western Sichuan Mountains form the eighth grades and ninth grades. Respectively. And the Jinsha River basin in the Yunnan Plateau forms the ninth grade (Figure 5A).
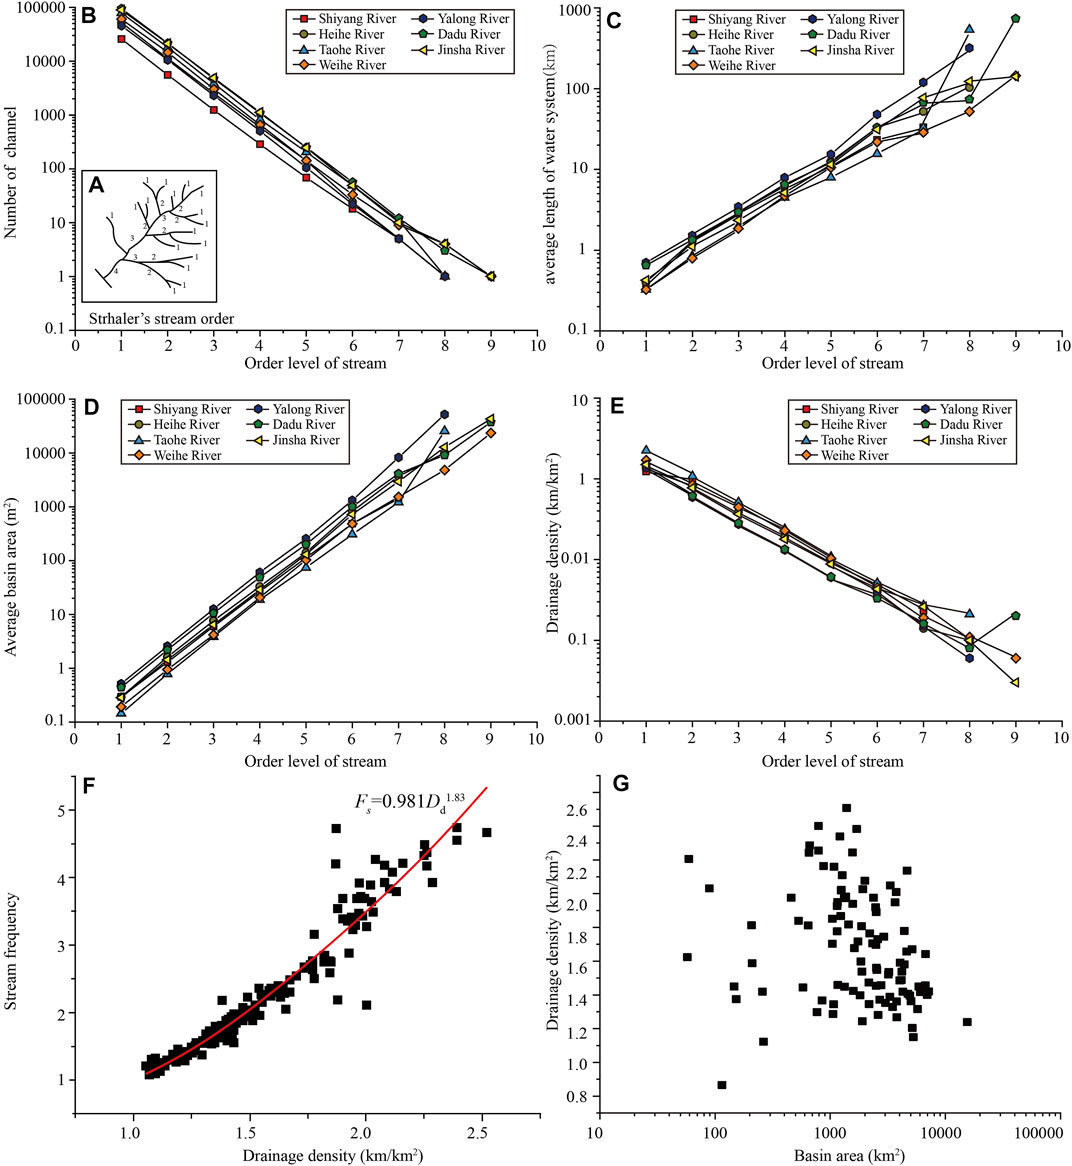
FIGURE 5. Correlation between Dd and drainage parameters in mountains along the eastern margin of the Qinghai–Tibet Plateau. (A) The Strahler approach to stream ordering. (B) Stream order against stream number. (C) Stream order against average stream length. (D) The relationship between stream order and average drainage area. (E) Dd against stream order. (F) Dd against stream frequency (Fs). (G) Dd against drainage area.
The numbers of streams of various orders in each basin are counted; the average drainage area, average stream length, and Dd of various orders are calculated with the help of GIS software (Table 2). It is observed that the total number of streams gradually decreases as stream order increases (Figure 5B). This observation is in accordance with Horton’s law of stream number, which states that the number of streams of each order forms an inverse geometric sequence plotted against order (Horton, 1945). Among them, the total number of streams in the Dadu River and Jinsha River basins is the largest, indicating that the drainage systems in the Western Sichuan Plateau and Yunnan Plateau are flourishing, and the basin scale is large. In addition, the Taohe River and Weihe River basins in the West Qinling Mountains have a relatively large number of streams, while the Shiyang River basin on the northern flank of the Eastern Qilian Mountains has the smallest number of streams and a small scale. This feature shows that the average drainage area of each order increases with increasing stream order (Table 2; Figure 5D). The average drainage area of the Yalong River and Dadu River basins is the largest, and the average drainage area of Tao River and Weihe River basins is the smallest. At the same time, the average stream length of each order also increases with the increase of stream order (Table 2; Figure 5B). The average stream length of the Yalong River basin is the largest, indicating that the average stream length of watersheds in semi-humid areas is the largest.
TABLE 2. Drainage density and related parameters in mountains along the eastern margin of the Qinghai–Tibet Plateau.
In addition, Dd in the basins of the same level generally decreases with the increase of stream order (Figure 5E). The relationship between stream frequency (Fs) and Dd is Fs = 0.981Dd1.83; that is to say, with the increase of stream number, Dd increases (Figure 5F). Among them, the stream frequency in the West Qinling Mountains is the largest, indicating that Dd in the semi-arid region is the largest. However, the correlation between Dd and drainage area is not strong (Figure 5G).
Correlation Between Dd and Local Landscape
Topography is a function of the structure, process, and time, and it is also the main factor controlling the development of valley topography and river process (Davis, 1899; Montgomery and Dietrich, 1989; Schumm, 1997). Here, the influence of topographic factors such as regional average altitude, average slope, Rr, and Rla on Dd is analyzed (Figure 6). The local slope and local relief reflect the regional topographic relief, while the average altitude and Rr represent the overall topography of the region. The results showed that Dd was negatively correlated with average local relief and average slope (Figures 6B,C), but not significantly correlated with average altitude and Rr (Figures 6A,D).
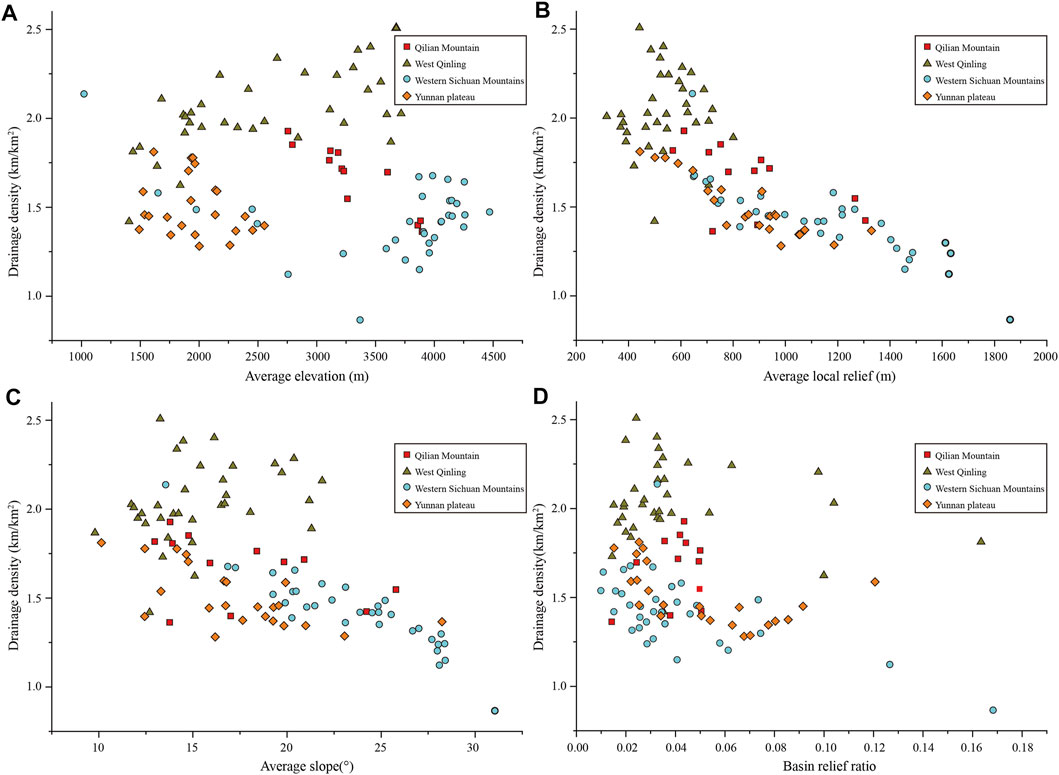
FIGURE 6. Relationship between Dd and terrain parameters. (A) Dd against average altitude. (B) Dd against mean local relief (Rla). (C) Dd against mean slope. (D) Dd against relief ratio (Rr).
Regionally, the average altitude, Rla, average slope, and Rf in the Western Sichuan Plateau are the largest (Figures 6, 7A), while Dd is the smallest, with an average value of about 1.5 km/km2, indicating that the Western Sichuan region, which is a steep terrain transition zone from the Tibetan Plateau to the Sichuan Basin, is mainly deeply incised by main streams with non-well-developed tributaries. Dd in the West Qinling Mountains is the largest, ranging from 1.75 to 2.5 km/km2, but its average altitude, average slope, and Rf are relatively dispersed, and the local relief is the smallest. The average altitude of the Yunnan Plateau is the lowest, between 1,500 and 2,700 m, and Dd is slightly larger than that of the Western Sichuan Plateau.
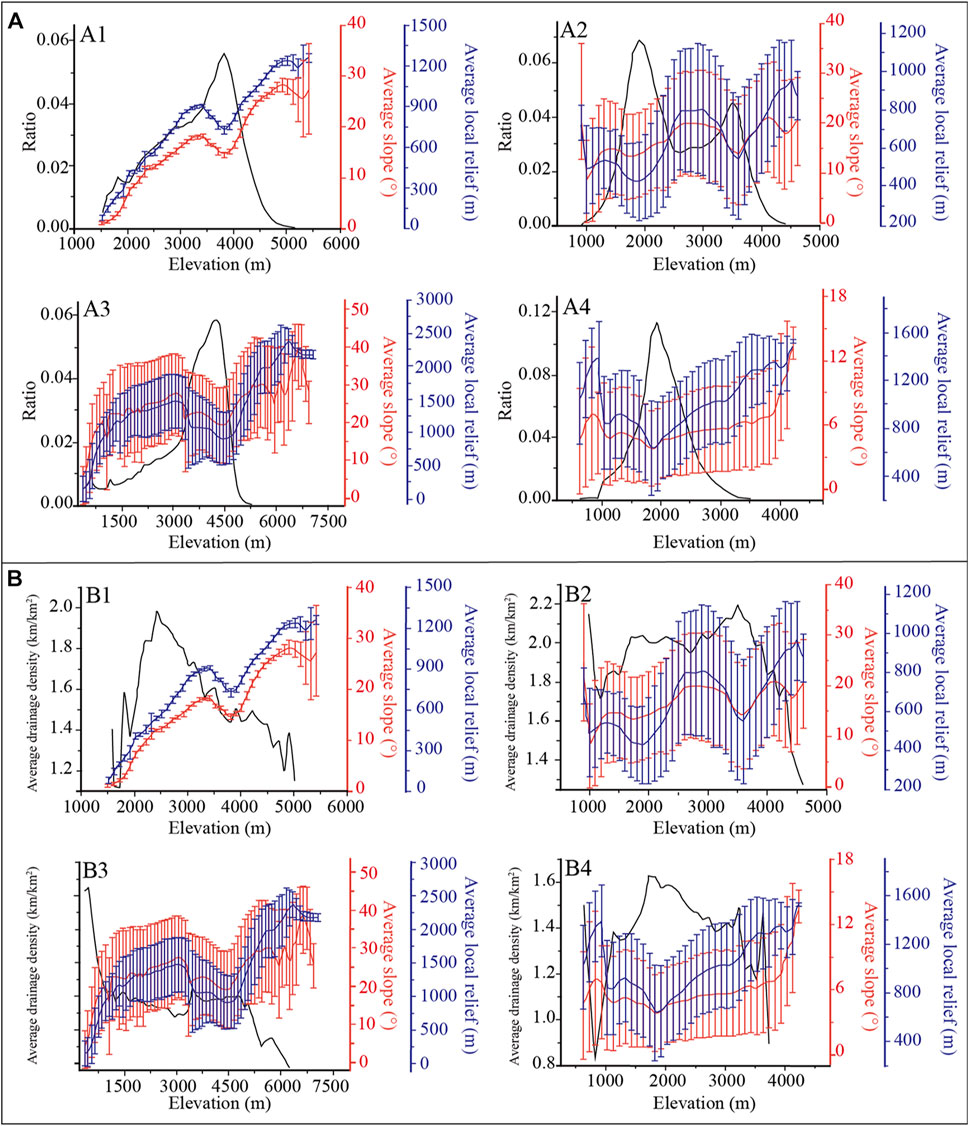
FIGURE 7. (A) Characteristics of terrain parameters of mountains in the eastern Qinghai–Tibet Plateau. Dark lines show histograms of elevation distribution in each region, red lines with error bars show average slope plotted as a function of elevation, and blue lines with error bars show average local relief plotted as a function of elevation: (A1) Qilian Mountains; (A2) West Qinling Mountains; (A3) West Sichuan Mountain; (A4) Yunnan Plateau. (B) Change of Dd with average slope and Rla: (B1) Qilian Mountains; (B2) West Qinling Mountains; (B3) West Sichuan Mountain; (B4) Yunnan Plateau.
Dd decreases most obviously with an increase of Rla (Figure 6B). When Rla < 800 m, Dd is relatively large, ranging from 2.5 to 1.5 km/km2, and with increasing Rla, Dd shows a decreasing trend, which is mainly distributed in the West Qinling Mountains and Yunnan Plateau (Figure 7A). When Rla is between 800 and 1,300 m, Dd is relatively stable at 1.4 km/km2. When Rla > 1,300 m, Dd decreases again from 1.4 km/km2 to 0.7 km/km2, mainly distributed in the Western Sichuan Plateau (Figure 7B). Dd also showed a decreasing trend with an increase of local average slope (Figures 6C, 7B).
The Qilian Mountains is located in the northeastern margin of the Qinghai–Tibet Plateau, and the topography here is steep at high altitude while gentle at low altitude. However, in some regions, with altitude increases, local relief becomes slow (Figure 7A1). At between 1,500 and 2,500 m a.s.l., with the altitude increase, Dd, Rla, and average slope all show an increasing trend (Figure 7B1). This feature is related to the regional geomorphologic pattern. The northern Qilian Mountains is the Hexi Corridor and Alxa Plateau characterized by a plain, and a valley is not developed here. After entering the Qilian Mountains, massive valleys begin to develop. With the increase of altitude, average slope, and Rla, Dd decreases rapidly (Figure 7B1). At 2,800–3,400 and 3,800–4,300 m a.s.l., there are two planation surfaces (the main planation and the summit surface) (Pan et al., 2007), showing a decrease in Dd, average slope, and Rla.
The altitude–frequency curve of the West Qinling Mountains has two peaks (Figure 7A2), corresponding to the loess hilly area in the north (2000 m) and the bedrock mountainous area in the south (3,500 m). They also correspond to the widely distributed erosion surface (partial planation surface) and the main planation surface. Below 3,500 m a.s.l., Dd reaches the highest with a range from 1.8 to 2.2 km/km2. Above 3,500 m a.s.l., with an increase of altitude, average slope, and Rla, Dd decreased (Figure 7B2).
The Western Sichuan Plateau is the most rugged and steep area on the eastern edge of the Qinghai–Tibet Plateau, with a maximum local relief of ∼2,000 m. At an altitude of 3,500–4,500 m, there is an intact main planation surface (Liu et al., 2019). In the mountainous area above the main planation surface, Dd decreases rapidly with an increase in altitude, average slope, and Rla (Figure 7B3).
The Yunnan Plateau is distributed with a relatively intact planation surface with an altitude of 2,000–2,500 m (Whipple et al., 2017; Liu et al., 2019). Different from other regions, Dd is highest on the plateau surface (Figure 7B4), indicating that valley erosion has become the main driving force of the surface process.
The relationship between Dd and Rla, and local average slope may be affected by slope erosion patterns. In regions with relatively small topographic relief, slope erosion is mainly affected by soil creep, sheet flow, and runoff erosion, and the Dd increases gradually with the increase of slope and Rla. When the slope and topographic relief reach a large value, the erosion process is dominated by landslides and collapses, and Dd decreases with the increase of slope and Rla (Howard, 1997; Tucker and Bras, 1998). The Qilian Mountains, West Qinling Mountains, West Sichuan Mountains, and Yunnan Plateau are located at the forefront of the outward expansion of the Qinghai–Tibet Plateau, and the neotectonic movement is very active. The rivers cut the terrain into deep canyons with strong tectonic uplift. The topographic relief in these areas is large, and the landslide process is very frequent, resulting in the decrease of Dd with the increase of topographic relief.
Relationship Between Dd and Regional Climate Factors
Surface runoff directly comes from atmospheric precipitation, which is the direct power source of valley development. Precipitation plays a very important role in Dd and valley development speed. At the same time, vegetation reduces surface runoff erosion by intercepting and absorbing rainfall and enhancing soil erosion resistance. Good vegetation coverage has a certain inhibitory effect on valley development. NDVI is a common index for detecting plant growth status and vegetation coverage (Gregory and Gardiner, 1975; DeFries and Townshend, 1994; Moglen et al., 1998). NDVI values range from −1 to 1. In general, its values are negative for water bodies; close to zero for rocks, sands, or concrete surfaces; and positive for vegetation (Jones and Vaughan, 2010). In other words, greater NDVI values mean stronger implications for vigorous vegetation greenness. Therefore, MAP and average NDVI are selected as climatic factors to analyze their influences on drainage density.
The results show that in the areas (the Qilian Mountains and West Qinling Mountains) where MAP is less than 600 mm, Dd increases with the increase of MAP, showing a strong positive correlation, and passing the significance test at 0.01, while in the areas (the Western Sichuan Plateau and Yunnan Plateau) where MAP exceeds 600 mm, Dd slightly decreases with the increase of MAP, showing a strong negative correlation with a significance level of 0.01. Dd is highest in the West Qinling region in a semi-arid environment (Figure 8A).
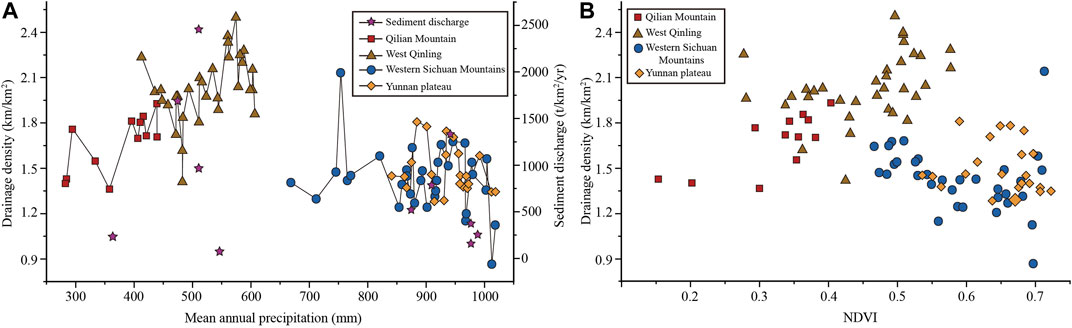
FIGURE 8. Relationship between Dd and regional climate factors. (A) Dd against mean annual precipitation (MAP). (B) Dd against normalized difference vegetation index (NDVI).
In the Qilian Mountains, the NDVI ranges from 0.15 to 0.42. In the West Qinling Mountains, the NDVI ranges from 0.28 to 0.57. In the Western Sichuan Plateau, the NDVI ranges from 0.46 to 0.72. In the Yunnan Plateau, the NDVI ranges from 0.53 to 0.73. These results indicate that from the Qilian Mountains, West Qinling Mountains, and Western Sichuan Plateau to the Yunnan Plateau, the vegetation coverage showed an increasing trend. The relationship between Dd and NDVI is similar to that between Dd and MAP: first increased (from the Qilian Mountains to the West Qinling Mountains), then decreased (from the West Qinling Mountains to the Western Sichuan Plateau), and finally increased slightly (from the West Sichuan Plateau to the Yunnan Plateau).
This may be related to the interaction between precipitation and vegetation on valley formation. In arid and semi-arid areas, vegetation is dominated by wasteland and grassland, and the erosion effect of precipitation on the land surface is greater than the protective effect of vegetation on the land surface. Therefore, drainage density increased with increasing precipitation and vegetation coverage. In humid areas, vegetation is dominated by forestland. Forestland intercepts precipitation and runoff through various vertical levels within it, which can effectively reduce the kinetic energy of precipitation erosion and runoff erosion. At this time, the role of vegetation on the valley development is greater than that of precipitation. Therefore, with the increase of precipitation, the vegetation coverage is getting better and better, and the drainage density is getting smaller and smaller (Gregory and Gardiner, 1975; Moglen et al., 1998). The Qilian Mountains and the West Qinling Mountains are located in arid and semi-arid areas. The vegetation is mainly desert grassland. The effect of precipitation on the density of the valley is greater than that of the vegetation, making the valley density and precipitation have a significant positive correlation. The Western Sichuan Plateau and the Yunnan Plateau are located in a humid area. The vegetation is dominated by forests. The effect of vegetation on the density of the valley is greater than that of precipitation. Therefore, there is a significant negative correlation between drainage density and precipitation. Dd is the largest in the West Qinling Mountains (Figure 8B). It indicates that the combination of precipitation and vegetation in different climatic regions controls the intensity of surface runoff erosion, thus affecting Dd.
Conclusion
Through extracting the channel networks and analyzing Dd in the Qilian Mountains, West Qinling Mountains, West Sichuan Plateau, and Yunnan Plateau along the eastern margin of the Qinghai–Tibet Plateau, some preliminary conclusions are drawn:
1) Dd in the northern flank of the Qilian Mountains gradually decreased from east to west, with an average value of 1.64 km/km2. In the West Qinling Mountains, Dd is smaller in the north loess hilly area (1.94 km/km2) and larger in the south bedrock mountainous area (2.05 km/km2), and the average value is 2.11 km/km2. In the Yunnan Plateau, Dd gradually decreased from southeast to northwest, with an average value of 1.59 km/km2.
2) Regionally, Dd decreases with the increase of average slope and average local relief. On the planation surfaces, Dd increases with the increase of altitude, while on the mountainous area above the planation surfaces, it decreases rapidly with increasing altitude.
3) From north to south along the eastern margin of the Qinghai–Tibet Plateau, Dd increases first and then decreases with increasing precipitation. It is the largest in the West Qinling Mountains with a semi-arid climate, indicating that precipitation and vegetation in different climatic regions are the main controlling factors of Dd.
Data Availability Statement
The original contributions presented in the study are included in the article/Supplementary Material, further inquiries can be directed to the corresponding author.
Author Contributions
HG: experimental design and manuscript writing. FL: data processing and analysis. TY: figure mapping. LQ: figure mapping. ZL: polishing and modification of manuscript.
Funding
This study was funded by the Second Tibetan Plateau Scientific Expedition and Research Program (STEP) (Grant No. 2019QZKK0205), the National Natural Science Foundation of China (Grant Nos. 41730637, 41471008, and 42101005), the Outstanding Youth Project of Hunan Department of Education (Grant No. 20B106), and the Hunan Provincial Natural Science Foundation of China (Grant No. 2021JJ40023).
Conflict of Interest
The authors declare that the research was conducted in the absence of any commercial or financial relationships that could be construed as a potential conflict of interest.
Publisher’s Note
All claims expressed in this article are solely those of the authors and do not necessarily represent those of their affiliated organizations, or those of the publisher, the editors, and the reviewers. Any product that may be evaluated in this article, or claim that may be made by its manufacturer, is not guaranteed or endorsed by the publisher.
References
Abrahams, A. D. (1984). Channel Networks: a Geomorphological Perspective. Water Resour. Res. 20 (2), 161–188. doi:10.1029/wr020i002p00161
Ayaz, S., and Dhali, M. K. (2020). Longitudinal Profiles and Geomorphic Indices Analysis on Tectonic Evidence of Fluvial Form, Process and Landform Deformation of Eastern Himalayan Rivers, India. Geology. Ecology, Landscapes 4 (1), 11–22. doi:10.1080/24749508.2019.1568130
Band, L. E. (1986). Topographic Partition of Watersheds with Digital Elevation Models. Water Resour. Res. 22 (1), 15–24. doi:10.1029/WR022i001p00015
Burbank, D. W., Blythe, A. E., Putkonen, J., Pratt-Sitaula, B., Gabet, E., Oskin, M., et al. (2003). Decoupling of Erosion and Precipitation in the Himalayas. Nature 426 (6967), 652–655. doi:10.1038/nature02187
Daniel, J. R. K. (1981). Drainage Density as an index of Climatic Geomorphology. J. Hydrol. 50, 147–154. doi:10.1016/0022-1694(81)90065-2
Day, D. G. (1980). Lithologic Controls of Drainage Density: A Study of Six Small Rural Catchments in New England, N.S.W. Catena 7 (4), 339–351. doi:10.1016/0341-8162(80)90018-1
DeFries, R. S., and Townshend, J. R. G. (1994). NDVI-derived Land Cover Classifications at a Global Scale. Int. J. Remote Sensing 15 (17), 3567–3586. doi:10.1080/01431169408954345
Dietrich, W., and Dunne, T. (1993). “The Channel Head,” in Channel Network Hydrology. Editors K. Beven, and M. J. Kirkby (Chichester: Wiley), 175e219.
Evans, I. S. (1980). An Integrated System of Terrain Analysis and Slope Mapping. Z. Geomorphologie, Suppl-Bd 36, 274–295. doi:10.3987/R-1985-01-003310.1016/0584-8539(80)80047-x
Fielding, E., Isacks, B., Barazangi, M., and Duncan, C. (1994). How Flat Is Tibet? Geol 22 (2), 163. doi:10.1130/0091-7613(1994)022<0163:hfit>2.3.co;2
Giachetta, E., Refice, A., Capolongo, D., Gasparini, N. M., and Pazzaglia, F. J. (2014). Orogen-scale Drainage Network Evolution and Response to Erodibility Changes: Insights from Numerical Experiments. Earth Surf. Process. Landforms 39 (9), 1259–1268. doi:10.1002/esp.3579
Gregory, K. J., and Gardiner, V. (1975). Drainage Density and Climate. Z. Geomorphologie 19 (3), 287–298.
Heine, R. A., Lant, C. L., and Sengupta, R. R. (2004). Development and Comparison of Approaches for Automated Mapping of Stream Channel Networks. Ann. Assoc. Am. Geogr. 94 (3), 477–490. doi:10.1111/j.1467-8306.2004.00409.x
Horton, R. E. (1932). Drainage-basin Characteristics. Trans. AGU 13, 350–361. doi:10.1029/tr013i001p00350
Horton, R. E. (1945). Erosional Development of Streams and Their Drainage Basins; Hydrophysical Approach to Quantitative Morphology. Geol. Soc. America Bull. 56 (3), 275–370. doi:10.1130/0016-7606(1945)56[275:edosat]2.0.co;2
Howard, A. D. (1994). A Detachment-Limited Model of Drainage basin Evolution. Water Resour. Res. 30 (7), 2261–2285. doi:10.1029/94WR00757
Howard, A. D. (1997). Badland Morphology and Evolution: Interpretation Using a Simulation Model. Earth Surf. Process. Landforms 22 (3), 211–227. doi:10.1002/(sici)1096-9837(199703)22:3<211:aid-esp749>3.0.co;2-e
Jones, H. G., and Vaughan, R. A. (2010). Remote Sensing of Vegetation: Principles, Techniques, and Applications. New York: Oxford University Press, 353.
Kumar, N., Singh, S. K., and Pandey, H. K. (2018). Drainage Morphometric Analysis Using Open Access Earth Observation Datasets in a Drought-Affected Part of Bundelkhand, India. Appl. Geomat 10 (3), 173–189. doi:10.1007/s12518-018-0218-2
Kumar, N., and Singh, S. K. (2021). Soil Erosion Assessment Using Earth Observation Data in a Trans-boundary River basin. Nat. Hazards 107 (1), 1–34. doi:10.1007/s11069-021-04571-6
Li, J., and Fang, X. (1999). Uplift of the Tibetan Plateau and Environmental Changes. Chin. Sci. Bull. 44 (23), 2117–2124. doi:10.1007/bf03182692
Li, J., Li, T., Zhang, L., Sivakumar, B., Fu, X., Huang, Y., et al. (2020). A D8-Compatible High-Efficient Channel Head Recognition Method. Environ. Model. Softw. 125, 104624. doi:10.1016/j.envsoft.2020.104624
Liu, F., Gao, H., Pan, B., Li, Z., and Su, H. (2019). Quantitative Analysis of Planation Surfaces of the Upper Yangtze River in the Sichuan-Yunnan Region, Southwest China. Front. Earth Sci. 13 (1), 55–74. doi:10.1007/s11707-018-0707-y
Luo, W., and Stepinski, T. F. (2006). Topographically Derived Maps of valley Networks and Drainage Density in the Mare Tyrrhenum Quadrangle on Mars. Geophys. Res. Lett. 33 (L18202), a–n. doi:10.1029/2006GL027346
Luo, W., and Stepinski, T. (2008). Identification of Geologic Contrasts from Landscape Dissection Pattern: An Application to the Cascade Range, Oregon, USA. Geomorphology 99 (1-4), 90–98. doi:10.1016/j.geomorph.2007.10.014
Mahmood, S. A., and Gloaguen, R. (2012). Appraisal of Active Tectonics in Hindu Kush: Insights from DEM Derived Geomorphic Indices and Drainage Analysis. Geosci. Front. 3 (4), 407–428. doi:10.1016/j.gsf.2011.12.002
Melton, M. A. (1958). Correlation Structure of Morphometric Properties of Drainage Systems and Their Controlling Agents. J. Geology. 66, 442–460. doi:10.1086/626527
Mitášová, H., and Hofierka, J. (1993). Interpolation by Regularized Spline with Tension: II. Application to Terrain Modeling and Surface Geometry Analysis. Math. Geol. 25 (6), 657–669. doi:10.1007/BF00893172
Moglen, G. E., Eltahir, E. A. B., and Bras, R. L. (1998). On the Sensitivity of Drainage Density to Climate Change. Water Resour. Res. 34 (4), 855–862. doi:10.1029/97wr02709
Montgomery, D. R., and Dietrich, W. E. (1989). Source Areas, Drainage Density, and Channel Initiation. Water Resour. Res. 25 (8), 1907–1918. doi:10.1029/WR025i008p01907
Montgomery, D. R., and Foufoula-Georgiou, E. (1993). Channel Network Source Representation Using Digital Elevation Models. Water Resour. Res. 29, 3925–3934. doi:10.1029/93wr02463
Morgan, R. P. C. (1973). The Influence of Scale in Climatic Geomorphology: a Case Study of Drainage Density in West Malaysia. Geografiska Annaler: Ser. A, Phys. Geogr. 55 (2), 107–115. doi:10.1080/04353676.1973.11879884
O’Callaghan, J. F., and Mark, D. M. (1984). The Extraction of Drainage Networks from Digital Elevation Data. Comput. Vis. Graph. Image Process. 28, 323–344. doi:10.1016/S0734-189X(84)80011-0
Oguchi, T. (1997). Drainage Density and Relative Relief in Humid Steep Mountains with Frequent Slope Failure. Earth Surf. Process. Landforms 22 (2), 107–120. doi:10.1002/(SICI)1096-9837(199702)22:2<107:AID-ESP680>3.0.CO;2-U
Orlandini, S., Tarolli, P., Moretti, G., and Dalla Fontana, G. (2011). On the Prediction of Channel Heads in a Complex alpine Terrain Using Gridded Elevation Data. Water Resour. Res. 47 (2). doi:10.1029/2010WR009648
Pan, B., Gao, H., Wu, G., Li, J., Li, B., and Ye, Y. (2007). Dating of Erosion Surface and Terraces in the Eastern Qilian Shan, Northwest China. Earth Surf. Process. Landforms 32 (1), 143–154. doi:10.1002/esp.1390
Pan, B. T., Li, J. J., and Chen, F. H. (1995). Qinghai-Tibetan Plateau: a Driver and Amplifier of Global Climatic Changes—Ⅰ. Basic Characteristics of Climatic Changes in Cenozoic Era. J. Lanzhou University (Natural Sciences) 31 (3), 120–128.
Pan, B. T., and Li, J. J. (1996). Qinghai-Tibetan Plateau: A Driver and Amplifier of the Global Climatic Change—Ⅲ. The Effects of the Uplift of Qinghai-Tibetan Plateau on Climatic Changes. J. Lanzhou University(Natural Sciences) 32 (1), 108–115. (In Chinese). doi:10.13885/j.issn.0455-2059.1996.01.024
Pelletier, J. D. (2013). A Robust, Two-Parameter Method for the Extraction of Drainage Networks from High-Resolution Digital Elevation Models (DEMs): Evaluation Using Synthetic and Real-World DEMs. Water Resour. Res. 49, 75–89. doi:10.1029/2012WR012452
Pirotti, F., and Tarolli, P. (2010). Suitability of LiDAR point Density and Derived Landform Curvature Maps for Channel Network Extraction. Hydrol. Process. 24 (9), 1187–1197. doi:10.1002/hyp.7582
Radaideh, O. M. A., and Mosar, J. (2019). Tectonics Controls on Fluvial Landscapes and Drainage Development in the Westernmost Part of Switzerland: Insights from DEM-Derived Geomorphic Indices. Tectonophysics 768, 228179. doi:10.1016/j.tecto.2019.228179
Sangireddy, H., Carothers, R. A., Stark, C. P., and Passalacqua, P. (2016). Controls of Climate, Topography, Vegetation, and Lithology on Drainage Density Extracted from High Resolution Topography Data. J. Hydrol. 537, 271–282. doi:10.1016/j.jhydrol.2016.02.051
Schneider, A., Jost, A., Coulon, C., Silvestre, M., Théry, S., and Ducharne, A. (2017). Global-scale River Network Extraction Based on High-Resolution Topography and Constrained by Lithology, Climate, Slope, and Observed Drainage Density. Geophys. Res. Lett. 44 (6), 2773–2781. doi:10.1002/2016gl071844
Schumm, S. A. (1997). Drainage Density. Problems of Prediction and Application. Process and Form in Geomorphology. London: Routledge, 15–45.
Schumm, S. A. (1956). Evolution of Drainage Systems and Slopes in Badlands at Perth Amboy, New Jersey. Geol. Soc. America Bull. 67 (5), 597–646. doi:10.1130/0016-7606(1956)67[597:eodsas]2.0.co;2
Spagnolo, M. (2002). GIS Analysis of Unit Drainage Density and its Influencing Factors in the South Fork Eel River (Northern California, USA). Geogr. Fis. Dinam. Quat. 25, 77–88.
Strahler, A. N. (1957). Quantitative Analysis of Watershed Geomorphology. Trans. AGU 38 (6), 913–920. doi:10.1029/TR038i006p00913
Szabó, S., Elemér, L., Kovács, Z., Püspöki, Z., Kertész, Á., Singh, S. K., et al. (2019). NDVI Dynamics as Reflected in Climatic Variables: Spatial and Temporal Trends - a Case Study of Hungary. gisci remote sens 56 (4), 624–644. doi:10.1080/15481603.2018.1560686
Tarboton, D. G., Bras, R. L., and Rodriguez-Iturbe, I. (1992). A Physical Basis for Drainage Density. Geomorphology 5, 59–76. doi:10.1016/0169-555x(92)90058-v
Tarboton, D. G., Bras, R. L., and Rodriguez-Iturbe, I. (1991). On the Extraction of Channel Networks from Digital Elevation Data. Hydrol. Process. 5 (1), 81–100. doi:10.1002/hyp.3360050107
Tarolli, P., and Dalla Fontana, G. (2009). Hillslope-to-valley Transition Morphology: New Opportunities from High Resolution DTMs. Geomorphology 113 (1-2), 47–56. doi:10.1016/j.geomorph.2009.02.006
Tucker, G. E., and Bras, R. L. (1998). Hillslope Processes, Drainage Density, and Landscape Morphology. Water Resour. Res. 34 (10), 2751–2764. doi:10.1029/98WR01474
Vogt, J. V., Soille, P., de Jager, A., Rimaviciute, E., Mehl, W., Haastrup, P., et al. (2007). "Developing a Pan-European Data Base of Drainage Networks and Catchment Boundaries From a 100 Metre DEM," in Proceedings AGILE International Conference.
Whipple, K. X., Dibiase, R. A., Ouimet, W. B., and Forte, A. M. (2017). Preservation or Piracy: Diagnosing Low-Relief, High-Elevation Surface Formation Mechanisms. Geology 45 (1), 91–94. doi:10.1130/G38490.1
Wilson, J. P., and Gallant, J. C. (2000). Digital Terrain Analysis. Terrain Anal. Principles Appl. 6 (12), 1–27.
Wood, J. (2009). Chapter 14 Geomorphometry in LandSerf. Dev. Soil Sci. 33, 333–349. doi:10.1016/s0166-2481(08)00014-7
Wu, T., Li, J., Li, T., Sivakumar, B., Zhang, G., and Wang, G. (2019). High-efficient Extraction of Drainage Networks from Digital Elevation Models Constrained by Enhanced Flow Enforcement from Known River Maps. Geomorphology 340, 184–201. doi:10.1016/j.geomorph.2019.04.022
Xiong, L., Tang, G., Yan, S., Zhu, S., and Sun, Y. (2014). Landform-oriented Flow-Routing Algorithm for the Dual-Structure Loess Terrain Based on Digital Elevation Models. Hydrol. Process. 28 (4), 1756–1766. doi:10.1002/hyp.9719
Yan, M., Xu, J. X., He, L., Wang, S. J., Zheng, M. G., Sun, L. Y., et al. (2018). Spatial Distribution and its Influencing Factors of Drainage Density in the Yellow River basin. Res. Soil Water Conservation 25 (2), 288–299. doi:10.13869/j.cnki.rswc.2018.02.041
Keywords: drainage density, terrain analysis, topographic factor, precipitation, eastern margin of the Qinghai–Tibet Plateau
Citation: Gao H, Liu F, Yan T, Qin L and Li Z (2022) Drainage Density and Its Controlling Factors on the Eastern Margin of the Qinghai–Tibet Plateau. Front. Earth Sci. 9:755197. doi: 10.3389/feart.2021.755197
Received: 08 August 2021; Accepted: 01 December 2021;
Published: 03 January 2022.
Edited by:
Dario Gioia, Consiglio Nazionale delle Ricerche (CNR), ItalyReviewed by:
Sudhir Singh, Allahabad University, IndiaDomenico Capolongo, University of Bari Aldo Moro, Italy
Copyright © 2022 Gao, Liu, Yan, Qin and Li. This is an open-access article distributed under the terms of the Creative Commons Attribution License (CC BY). The use, distribution or reproduction in other forums is permitted, provided the original author(s) and the copyright owner(s) are credited and that the original publication in this journal is cited, in accordance with accepted academic practice. No use, distribution or reproduction is permitted which does not comply with these terms.
*Correspondence: Fenliang Liu, ZmVubGlhbmdsaXVAMTI2LmNvbQ==