 Jens Strauss1*
 Sebastian Laboor1
 Lutz Schirrmeister1
 Alexander N. Fedorov2
 Daniel Fortier3
 Duane Froese4
 Matthias Fuchs1
 Frank Günther1,5
 Mikhail Grigoriev6Jennifer Harden7
 Gustaf Hugelius8,9
 Loeka L. Jongejans1,5
 Mikhail Kanevskiy10
 Alexander Kholodov11Viktor Kunitsky6Gleb Kraev12,13Anatoly Lozhkin14Elizaveta Rivkina15
 Yuri Shur10Christine Siegert1
 Valentin Spektor6
 Irina Streletskaya16
 Mathias Ulrich17Sergey Vartanyan14
 Alexandra Veremeeva15Katey Walter Anthony10
 Sebastian Wetterich1Nikita Zimov18
 Guido Grosse1,5
- 1Permafrost Research Section, Alfred Wegener Institute Helmholtz Centre for Polar and Marine Research, Potsdam, Germany
- 2Laboratory of Permafrost Landscapes, Melnikov Permafrost Institute, Yakutsk, Russia
- 3Geography Department, Université de Montréal, Montréal, QC, Canada
- 4Department of Earth and Atmospheric Sciences, University of Alberta, Edmonton, AB, Canada
- 5Institute of Geosciences, University of Potsdam, Potsdam, Germany
- 6Laboratory of General Geocryology, Melnikov Permafrost Institute, Yakutsk, Russia
- 7Scientist Emeritus, Formerly United States Geological Survey, Menlo Park, CA, United States
- 8Department of Physical Geography, Stockholm University, Stockholm, Sweden
- 9Bolin Centre for Climate Research, Stockholm University, Stockholm, Sweden
- 10Institute of Northern Engineering, University of Alaska Fairbanks, Fairbanks, AK, United States
- 11Geophysical Institute, University of Alaska Fairbanks, Fairbanks, AK, United States
- 12Yamal-Nenets Center of Arctic Research, Salekhard, Russia
- 13Institute of Geography of the Russian Academy of Sciences, Moscow, Russia
- 14North-East Interdisciplinary Scientific Research Institute, Magadan, Russia
- 15Institute of Physicochemical and Biological Problems in Soil Science, Russian Academy of Sciences, Pushchino, Russia
- 16Geographical Faculty, Lomonosov Moscow State University, Moscow, Russia
- 17Institute for Geography, Leipzig University, Leipzig, Germany
- 18North-East Science Station, Pacific Geographical Institute of the Russian Academy of Sciences, Cherskii, Russia
Ice-rich permafrost in the circum-Arctic and sub-Arctic (hereafter pan-Arctic), such as late Pleistocene Yedoma, are especially prone to degradation due to climate change or human activity. When Yedoma deposits thaw, large amounts of frozen organic matter and biogeochemically relevant elements return into current biogeochemical cycles. This mobilization of elements has local and global implications: increased thaw in thermokarst or thermal erosion settings enhances greenhouse gas fluxes from permafrost regions. In addition, this ice-rich ground is of special concern for infrastructure stability as the terrain surface settles along with thawing. Finally, understanding the distribution of the Yedoma domain area provides a window into the Pleistocene past and allows reconstruction of Ice Age environmental conditions and past mammoth-steppe landscapes. Therefore, a detailed assessment of the current pan-Arctic Yedoma coverage is of importance to estimate its potential contribution to permafrost-climate feedbacks, assess infrastructure vulnerabilities, and understand past environmental and permafrost dynamics. Building on previous mapping efforts, the objective of this paper is to compile the first digital pan-Arctic Yedoma map and spatial database of Yedoma coverage. Therefore, we 1) synthesized, analyzed, and digitized geological and stratigraphical maps allowing identification of Yedoma occurrence at all available scales, and 2) compiled field data and expert knowledge for creating Yedoma map confidence classes. We used GIS-techniques to vectorize maps and harmonize site information based on expert knowledge. We included a range of attributes for Yedoma areas based on lithological and stratigraphic information from the source maps and assigned three different confidence levels of the presence of Yedoma (confirmed, likely, or uncertain). Using a spatial buffer of 20 km around mapped Yedoma occurrences, we derived an extent of the Yedoma domain. Our result is a vector-based map of the current pan-Arctic Yedoma domain that covers approximately 2,587,000 km2, whereas Yedoma deposits are found within 480,000 km2 of this region. We estimate that 35% of the total Yedoma area today is located in the tundra zone, and 65% in the taiga zone. With this Yedoma mapping, we outlined the substantial spatial extent of late Pleistocene Yedoma deposits and created a unique pan-Arctic dataset including confidence estimates.
1 Introduction
Vast portions of the Arctic and sub-Arctic regions (hereafter pan-Arctic), predominantly in Siberia, the Far East of Russia, Alaska and Yukon, are covered by ice-rich fine-grained permafrost deposits that contain large late Pleistocene syngenetic ice wedges (Sher et al., 1971; Kanevskiy et al., 2011; Schirrmeister et al., 2013). Accompanied by wedge-ice growth in polygonal tundra-steppe landscapes, the sedimentation process was driven by cold continental climatic and environmental conditions in unglaciated regions during the late Pleistocene, inducing the accumulation of the unique Yedoma deposits up to 50 m thickness. Because of the fast incorporation of material into syngenetic permafrost and ice wedge growth during its formation, Yedoma deposits include a high volume of ground ice (including pore, segregated, and wedge ice) and preserved organic matter consisting of floral and faunal fossil remains that are perennially frozen and distinct from the recent organic matter cycles and have remained relict for tens of thousands to hundreds of thousands of years (Schirrmeister et al., 2011; Strauss et al., 2017). The first descriptions of Yedoma deposits date back to the early 19th century, when Arctic explorers described these deposits erroneously as buried glacial ice remnants based on the obvious high amount of “pure” ice that was observed in coastal exposures (von Kotzebue, 1821).
The permafrost region and the Yedoma domain in particular have been characterized as a very large and potentially vulnerable organic carbon pool (Schuur et al., 2015). Recently, the Yedoma domain has even been discussed as one of the potential climate tipping elements (Lenton et al., 2019). Scientific interest in Yedoma is rising as, besides the vulnerability of its frozen organic matter pool to degradation, melt of the high excess ground ice upon Yedoma thaw will cause substantial ground volume loss. Resulting surface subsidence will pose a serious threat to any infrastructure built on permafrost (de Grandpré et al., 2012; Hjort et al., 2018; Streletskiy et al., 2019; Chen et al., 2021; Schneider von Deimling et al., 2021). More broadly, Yedoma thaw implies substantial consequences for landscape reorganization by surface subsidence (Günther et al., 2015; Antonova et al., 2018), thermal erosion (Kanevskiy et al., 2016; Fuchs et al., 2020; Shur et al., 2021b; Morgenstern et al., 2021), thermokarst formation (Jones et al., 2011; Nitze et al., 2017; Ulrich et al., 2017; Veremeeva et al., 2021), and relief inversion as well as land loss by coastal erosion (Günther et al., 2013; Farquharson et al., 2018). Such changes of the periglacial landscape inventory certainly affect surface and sub-surface drainage patterns across scales, trigger ecosystem responses, and thus alter floral and faunal species composition and distribution (Pastick et al., 2019; Jones et al., 2020).
Previous studies estimated that Yedoma deposits cover about one million km2 of a large region in central and eastern Siberia (Romanovskii, 1993; Zimov et al., 2006), especially Yakutia (Grigoriev and Kunitsky, 2000; Konishchev, 2011), although these estimates are generally based on maps with scales smaller than 1:10,000,000. During the late Pleistocene, the extent of Yedoma and Yedoma-like deposits may have been up to three million km2 (Zimov et al., 2006; Walter et al., 2007; Strauss et al., 2017). Detailed compilations of current Yedoma distribution were started by using Quaternary geological maps at scales of 1:500,000 to 1:1,000,000 for Northeast Siberia (Grosse et al., 2013). Map analysis and field studies showed that significant areas of Yedoma deposits were reworked by thermokarst and thermal erosion due to the climate warming at the end of the Pleistocene and beginning of the Holocene with extensive thermokarst lake formation, expansion, and drainage (Kaplina, 2009; Morgenstern et al., 2013; Lenz et al., 2016). Estimations of Yedoma and drained lake basin coverage in the Yana-Indigirka and Kolyma Lowlands show that the modern area of drained lake basins could reach up to 80–100% in low-lying relief regions with Yedoma remnants covering now less than 20% while in elevated regions 40–55% of Yedoma uplands remained (Veremeeva, 2016; Veremeeva et al., 2021). Building on previous efforts, the objective of our present study is to compile the first detailed circum-Arctic digital map of the Yedoma domain coverage using high and medium resolution geological and stratigraphical maps from the regions of former Beringia, the unglaciated landmass consisting of today’s Siberian (Russia), Alaskan (United States) and Yukon (Canada) territories.
1.1 Terminology
1.1.1 Origin of the Term Yedoma
There is no clear agreement on the origin of the term “Yedoma” and its association with ice-rich fine-grained sediments. One version is that “Yedoma” was originally used by local people in Yakutia in a geomorphological sense to describe hills composed of Ice Complex deposits, which are “eaten” (Russian root yed from yest’ = to eat, to reduce, to erode) by thermokarst that is forming typical landforms of alternating hills with lake depressions. However, there is no absolute confidence regarding this meaning. The term Yedoma was also used in the north-European part of Russia, where its originality from “samoyed” (Finnish language “erämaa”) is hypothesized with the meaning of remote forests or pasture and something “far away” or “wilderness” (Chudinov, 1910).
1.1.2 Previous Scientific Use of the Term Yedoma
As summarized by Kanevskiy et al. (2011) and Schirrmeister et al. (2013), the terminology used in scientific publications for the ice-rich, syngenetically frozen deposits of late Pleistocene age varies across Beringia. These deposits are often referred to as “Ice Complex”, “Yedoma”, or “Edoma” in Siberia, while in North America other terms such as “muck” or “upland silt” are partially considered as equivalent terms (Péwé, 1975; Shur et al., 2004; Froese et al., 2009). The term “muck”, originating from gold mining operations, seems to have the broader meaning of an overburden material including ice-rich deposits of Holocene age (Péwé, 1975), but with remnants dating back to at least 700 ka in Yukon (Froese et al., 2008). Solov’ev (1959) defined “Ice Complex” as frozen deposits of various age, composition, genesis, and thickness, with syngenetic ice wedges. Ice Complexes formed in the Pleistocene and the oldest directly dated Ice Complexes are the mid-Pleistocene Yukagir Suite of Bol’shoy Lyakhovsky Island (New Siberian Islands) with an age of about 2,00,000 years (Tumskoy, 2012; Wetterich et al., 2019). The lower Ice Complex of the Batagay Megaslump was even dated to an age of about 650 000 years (Murton et al., 2021). Usually, the Yedoma Ice Complex formed in late Pleistocene during the period 60,000-12,500 years (Sher et al., 1971; Sher et al., 1987; Schirrmeister et al., 2002a; Kaplina, 2009; Strauss et al., 2017). It is considered a dominant relief-forming deposit in many regions of western Beringia. The term “Yedoma Suite”, describing the late Pleistocene Ice Complex, was first introduced into the regional stratigraphic scheme of northeastern Siberia (Sher et al., 1987). As there are many usages and viewpoints of “Yedoma” in literature, it is difficult to agree on one overall definition. Especially, uncertainties using this term in mining and scientific traditions complicate a circum-Arctic Yedoma study. Nevertheless, it is agreed that ice constitutes the largest portion of Yedoma deposits with 60–95 volume percent (vol%) including pore, segregated, and wedge ice (Kanevskiy et al., 2011; Schirrmeister et al., 2013; Strauss et al., 2013; Ulrich et al., 2014; Kanevskiy et al., 2016; Strauss et al., 2017; Wetterich et al., 2019; Schirrmeister et al., 2020; Wetterich et al., 2020; Kanevskiy et al., Forthcoming 2021). Further, clastic and organic Yedoma components (Schirrmeister et al., 2011; Schirrmeister et al., 2013) suggest aeolian, fluvial, or slope sedimentation with simultaneous freezing (i.e. syngenetic permafrost formation).
1.1.3 Yedoma Definition
Our summary definition considers that Yedoma deposits are perennially frozen (permafrost), fine-grained, organic-bearing, and ice-rich sediments of late Pleistocene age, that they can reach thickness of up to tens of meters and are framed by large syngenetic ice wedges, and that they are preserved in remnant Yedoma uplands. With this definition, we cover the Yedoma Suite and other types of the late Pleistocene Ice Complexes and late Pleistocene muck, being located in West, Central and East Siberia, in Chukotka and the Russian Far East as well as in Alaska and Yukon areas. Even though syngenetic Pleistocene permafrost sediments mostly have large ice wedges, this is not true for all cases (e.g. Fraser and Burn, 1997; Froese et al., 2009).
1.1.4 Yedoma Domain
Analogue to the permafrost region, where “just” a part of the sediments are perennial frozen (e.g. >90% coverage in the continuous permafrost region below the active layer), the “Yedoma domain” term refers to the region where Yedoma deposits are expected to occur but may also include drained lake basins, river valleys etc. Thus, this region is an outline of the maximum extent of Yedoma deposits during the late Pleistocene.
2 Materials and Methods
We continued the work of Grosse et al. (2013) to extend their digital database of Yedoma distribution in East and Central Siberia by updating and merging different sources such as maps, scientific descriptions and synthesizing scientific literature.
2.1 Digitization of Maps
Our study focused on extracting geologic units from existing maps that are labeled as Yedoma or that we interpreted as Yedoma, based on cryolithology, ground ice conditions, geochronology, geomorphologic, and spatial associations (Figure 1). For compiling this map, we used maps of the previous Yedoma coverage estimates, included the digitized areas from Grosse et al. (2013), and extracted areas of potential Yedoma distribution from additional surface geological and Quaternary geological maps:
• 1:500,000 Geological maps of Yakutia (Supplementary Table S2)
• 1:1,000,000 Quaternary formation maps of Russia (Supplementary Table S3)
• 1:2,500,000 Quaternary map of the territory of Russian Federation (Supplementary Table S4)
• Permafrost Characteristics of Alaska
• Late Quaternary Aeolian Deposits of Northern North America: Age and Extent, Geological Survey of Canada (Wolfe et al., 2009), used in version 1 of the map available at Strauss et al. (2016)
• Yukon Digital Surficial Geology Compilation as digital 1:50,000 (50k), 1:100,000–125,000 (100k–125k) and 1:250,000 (250k) datasets (replaced the “Late Quaternary Aeolian Deposits of Northern North America” in this dataset, Yukon Geological Survey, 2014)
• Dataset “The Lena River Delta - inventory of lakes and geomorphological terraces” by Morgenstern, et al. (2011)
• Digital Database and Maps of Quaternary Deposits in East and Central Siberia by Bryant et al. (2017).
• Quaternary deposits map of Yana-Indigirka and Kolyma lowlands tundra zone, R-55-57, based on Landsat imagery by Veremeeva (2021).
• Sedimentological, biogeochemical and geochronological data of Yedoma and thermokarst deposits in West-Alaska by Jongejans et al. (2018a) and Jongejans et al. (2018b).
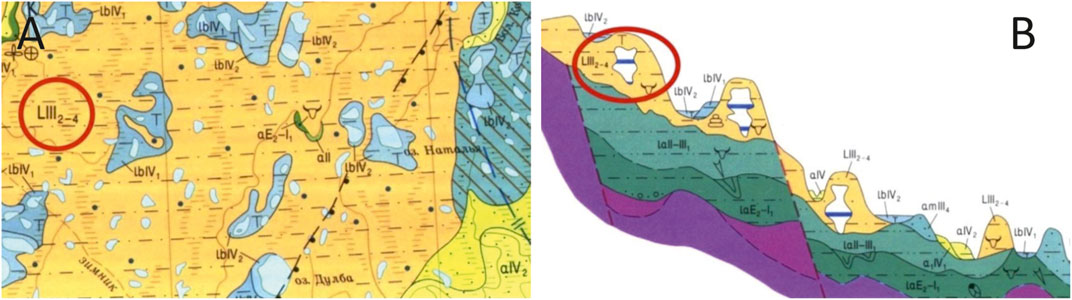
FIGURE 1. Example subsets of the maps with Yedoma units. This example from Grosse et al. (2013) was taken from map R-(55)-57. (A) Map view: Orange-colored unit LIII2-4 (label circled in red) is described in the legend as loess-like deposits (L) of late Pleistocene stratigraphy (III), specifically covering the periods Zyryan, Kargin, and Sartan (2–4). The lithologic signature (dash-dot-dash) illustrates that this unit consists of mostly silty to fine-sandy deposits, and the dark blue dots indicate very high ground ice contents. Abundance of lakes (light blue) and lacustrine deposits (medium and dark blue, lbIV1 and lbIV2) within the unit indicate degradation of at least the upper part of the Yedoma unit by Holocene thermokarst. (B) Cross-profile view: the same unit LIII2–4 (red circle) is shown to blanket terrace slopes. Bison skull symbol indicates the presence of fossil bones of the mammoth fauna. White features with blue stripes (e.g. in the red circle) indicate the presence of large syngenetic ice wedges typical for Yedoma.
Supplementary Figure S5 shows the approximate map frames of the used sources. The digitization was done using GIS techniques (ArcGIS) and semiautomated vectorization of raster images (Adobe Photoshop and Illustrator). Using digitized geologic maps does not violate the spatial resolution of the specific data. Even though the digital form of the map removes the constraints imposed by the scale of a paper map, the detail and accuracy represents various scale-specific generalization levels of each map. Similarly, where this database is used in combination with other data of higher resolution, the resolution of the combined output will be limited by the lower resolution of these data.
The original geological Quaternary maps of Russia were issued by the Department of Natural Resources of the Russian Federation or its predecessor the Department of Geology of the Soviet Union and have their foundation in decades of geological field and remote sensing work and mapping at scales 1:50,000 to 1:500,000 by Russian geologists and cartographers in the respective regions.
We eventually merged the Yedoma spatial units extracted from across these multiple maps into a single data layer for the pan-Arctic domain. We further synthesized data on the thickness of Yedoma for our database using deposit thickness information provided on the maps and from published datasets from drill cores and exposures.
2.1.1 Geological Maps of Yakutia, Scale 1:500,000
We used nine geological maps of Yakutia of scale 1:500,000 to refine the spatial distribution of Yedoma deposits. The data were digitized and edited at a scale of 1:500,000. The Yedoma identification criteria are shown in the supplement (Supplementary Table S2).
2.1.2 Russian Quaternary Formation Maps, Scale 1:1,000,000 Map
We used 23 Quaternary formation maps of scale 1:1,000,000 to refine the spatial distribution of Yedoma deposits. The data was edited at a scale of 1:1,000,000. On these maps, we also extracted point features, which contain information about boreholes in potential Yedoma deposits. Yedoma selection criteria are listed in Supplementary Table S3.
2.1.3 Quaternary Map of the Territory of Russian Federation, Scale 1:2,500,000
The 1:2,500,000 scaled map published in 2010 by the Ministry of Natural Resources and Ecology of the Russian Federation, Federal Agency of Mineral Resources was used to extract the areas declared as “Ice loess (Yedoma) deposits” (Supplementary Table S4).
2.1.4 Alaskan Permafrost Map, Scale 1:7,200,000
For Yedoma deposits in Alaska, we used the “Permafrost Characteristics of Alaska” map, scale 1:7,200,000 published by Jorgenson et al. (2008). Here, we extracted the areas declared as “loess” and “ice rich” (Supplementary Table S5, S6). To reduce the area of this highly generalized Yedoma polygon features and to improve the Yedoma domain estimate, we used the “Global Lakes and Wetlands Database” (GLWD) (Lehner and Döll, 2004) and clipped the Yedoma domain polygon with GLWD lake polygons. Moreover, we used Yedoma distribution maps for Alaska derived from extensive geomorophologic mapping in the field and literature synthesis by Kanevskiy et al. (2011; 2016; Forthcoming 2021) for a visual plausibility check.
2.1.5 Yukon Loess Map
For the western Yukon loess, we used the map “Loess of Northern North America” published by Wolfe et al. (2009) in the dataset version in Strauss et al. (2016). In this version, we refined it by using the Yukon Digital Surficial Geology Compilation (Yukon Geological Survey, 2014). We selected the Yukon 1:50,000, 1:100,000–125,000 and 1:250,000 maps. The selection criteria are shown in the supplement (Supplementary Table S8). We clipped this with late Pleistocene glacial areas to avoid overestimation.
2.1.6 Inclusion of Other Datasets
There are a few datasets with more detailed mapping. For example, Veremeeva (2021) used Landsat images that allow the area of the Yedoma uplands and alases (partially to fully drained depressions formed by thermokarst, i.e. ground-ice melt induced surface subsidence and lake formation) to be clearly identified. We included this detailed dataset in our circum-Arctic version. Moreover, we used the difference between our first estimate for this region compared to Veremeeva (2021) as an indicator for and potential overestimation of Yedoma coverage, also caused by ongoing degradation (thermokarst and other processes).
For the Baldwin Peninsula, one of the first (1826) sites where Yedoma was encountered scientifically (at Cape Blossom (Beechey, 1831, see; Shur et al., Forthcoming 2021a), we integrated the Yedoma areas defined in the land cover classification map published by Jongejans et al. (2018) (Supplementary Table S1). We used data from Morgenstern et al. (2011) for refining the Lena Delta and Bryant et al. (2017) as well as Grosse et al. (2013) for East and Central Siberia.
2.2 Dataset Merging and Harmonization
To harmonize the different datasets and to avoid merging artifacts, we applied map edge cleaning while merging data from different database layers. For the digitalization and spatial integration, we used Adobe Photoshop CS6 (Version: 13.0 x64), Adobe Illustrator CS6 (Version 16.0.3 x64), Avenza MAPublisher 9.5.4 (Illustrator Plug-In) and ESRI ArcGIS 10.2.2 for Desktop (Advanced License). The applied working steps were done as described in Figure 2 and the Supplementary Methods in detail.
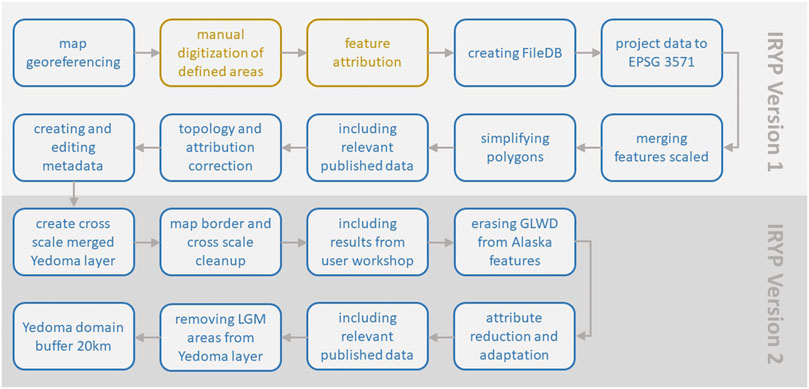
FIGURE 2. Workflow of the major steps of the Ice-Rich Yedoma Permafrost (IRYP) mapping from the scanned Russian maps or Alaskan and Canadian datasets to data interpretation, data harmonization to compiling the overall map. Software applied in these steps included ArcGIS (blue) and Avenza MAPublisher (yellow).
To improve working efficiency with many georeferenced maps in a map view, overlapping map parts, legends, and further information were clipped. For georeferencing, we used map corner coordinates as control points. For older maps, more (up to 50) control points had to be set at grid intersections. Then, to simplify further data processing, the geological maps were reprojected using WGS84 as datum to a common projection. In order to define the relevant map contents, we used different sources from different continents for our study. Even if having the same publisher, which is the case for the Russian geological maps, the maps were compiled with diverse geological foci and during different times. For every map, we defined the relevant categories, and for the Russian maps, the legend content had to be translated to English. After this, we used Avenza MAPublisher (Adobe Illustrator) for vectorization. From the Russian geological maps in 1:500,000 scale, we digitized 818 (multi-)polygon features. For the 1:1,000,000 maps, about 2,138 (multi-) polygon features and 75 point features of deposit thickness were digitized, and from geological maps of scale 1:2,500,000, we deduced about 771 (multi-)polygon features. We connected the digitized polygons to the specific relevant attributes. We provided information for stratigraphic units that were assigned to Yedoma in Supplementary Tables S5–S8, as well as in Grosse et al. (2013 table D1).
Subsequently, the Yedoma database was built by merging (projection: EPSG: 3571 WGS 1984 North Pole LAEA Bering_Sea) the different data extracts. We defined topology rules to identify and solve errors like gaps between bordering areas and areas overlapping within a layer. Some content errors have been resolved by checking the dataset manually. For the Alaskan dataset, we cut out lakes and used the “Global Lakes and Wetlands Database” to clip lake polygons. We removed overlaps of the generated Yedoma polygons with areas of LGM glaciation. This removed a large portion of the areas generated from the Yukon Digital Surficial Geology Compilation, and a few small areas in Western Siberia.
2.3 Field Sites and Photos
For Yedoma ground truthing, we synthesized available field sites from scientific literature data on Yedoma characteristics and occurrences. Our database includes more than 360 boreholes and exposures. These points were summarized by Schirrmeister et al. (2011), Kanevskiy et al. (2011) and updated with additional points by Strauss et al. (2013) and Strauss et al. (2017). For Chukotka we use a field guide compiled by Kotov and Brazhnik (1991).
As an additional visualization opportunity, we initiated the Yedoma photo database as a feature collection, having a point as spatial representation. (Supplementary Figure S2). This point feature class (collection/compilation of points in a geospatial layer) includes the spatial location of photos showing Yedoma, which were taken by several members of the International Permafrost Association (IPA) Yedoma Action Group. The picture’s credits and license information are given in the attribute table.
To get a general impression of Yedoma thickness, which is needed for volume estimation, we included the data synthesized by Strauss et al. (2013; 2017). We compiled field and literature data for available Yedoma depth estimates and updated this with newly available or newly recognized depth estimates (see Supplementary Table S9).
2.4 Inclusion of Expert Knowledge
During the International Conference on Permafrost (ICOP) held in Potsdam in 2016, a 2-day Yedoma workshop took place (Supplementary Figure S3). Preliminary maps were discussed and checked by a group of experts. For this reason, the IRYP map was split into four regions: Western and Central Siberia (supervised by I. Streletskaya), East Siberia/Yakutia (supervised by V. Kunitsky and C. Siegert), Far East Siberia and Chukotka (supervised by D. Shmelev and G. Kraev) and Alaska and Canada (supervised by Y. Shur and D. Froese). We used first-hand field knowledge from various Yedoma sites and scientific literature in order to decide if digitized areas should be attributed to Yedoma.
2.5 Confidence Estimation and Area Estimate Harmonization
Despite studies on Yedoma mystery and controversy for more than 150 years (Shur et al., Forthcoming 2021a), we had to agree on a technical way to compile Yedoma deposits on the broad scale, including local peculiarities. To account for this level of controversy and uncertainty, we implemented a Yedoma confidence classification system based on source details and additional information such as ancillary data on lithology and stratigraphy, which can be attributed to Yedoma. This data is often available in the original source maps and helped us to define our confidence level four our Yedoma classification of a specific area or region. We included a range of attributes for Yedoma area polygons based on lithological and stratigraphical information from the original source maps as well as a confidence level for our classification of an area as Yedoma (three levels: confirmed, likely, or uncertain, corresponding to high, medium, and low confidence). We based the confidence level on the amount of independent sources providing information about the sites. In case that just the stratigraphic context of the maps matched the Yedoma description, we classified the Yedoma as “uncertain” (Table 1). When one map explicitly defined a certain area as Yedoma, and this classified polygon intersected with polygons of other maps, or if lithologic and stratigraphic context were plausible for Yedoma, we used the classification “likely”. We reached the level “confirmed” when field data was available, or it was mentioned on the map explicitly as Yedoma, or the context of lithology and close field data fit, or experts agreed that this is Yedoma.
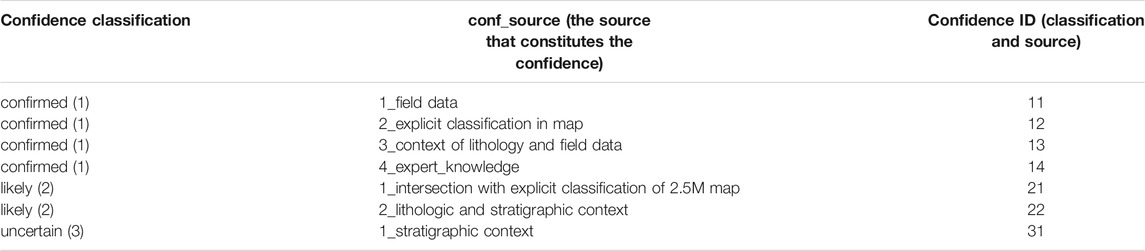
TABLE 1. Confidence classification scheme. In the column “confidence ID”, the first number is connected to the confidence classification’ and the second number to the confidence source.
As the Alaskan Yedoma domain is mapped in less detail when compared to the Siberian (see Figure 3) or the Canadian datasets, and thus including much more alas basins and other areas, we applied a correction factor of 0.5 for the Alaskan area estimation to avoid overestimation of the Yedoma area (Supplementary Table S10). This factor is a first guess based on findings from Veremeeva (2021) reducing our mapped areas by 50%, even though it is in Siberia with better spatial resolution (Supplementary Table S10).
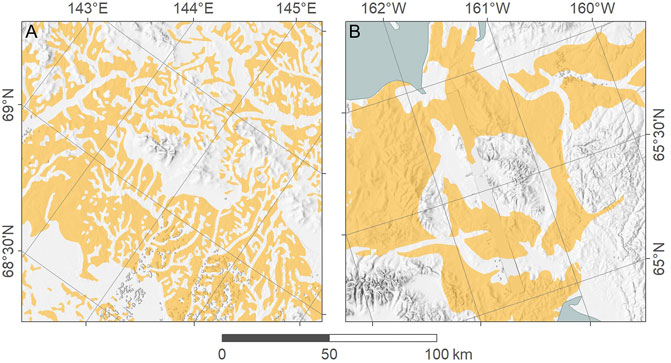
FIGURE 3. Different levels of detail/fragmentation of Siberian (A) and Alaskan (B) Yedoma dataset with the same scale. For improving the level of detail of the Alaskan dataset, we excluded lake areas (clipping lake areas) as well as using a correction factor of 0.5 for the area calculation.
2.6 Estimating the Yedoma Domain Outline
For getting the outline of the maximum Yedoma domain, and to be able to compare it to older regional estimates (Supplementary Figure S4), we decided to add a buffer of 20 km to each digitized Yedoma polygon and merge these areas. This buffer distance was chosen as the average to compensate for the lower resolution of older maps as well as a reasonable distance to account for the fact that natural borders are never as sharp as illustrated in the maps. The buffer was clipped with the coastline and the resulting area is shown in Figure 4.
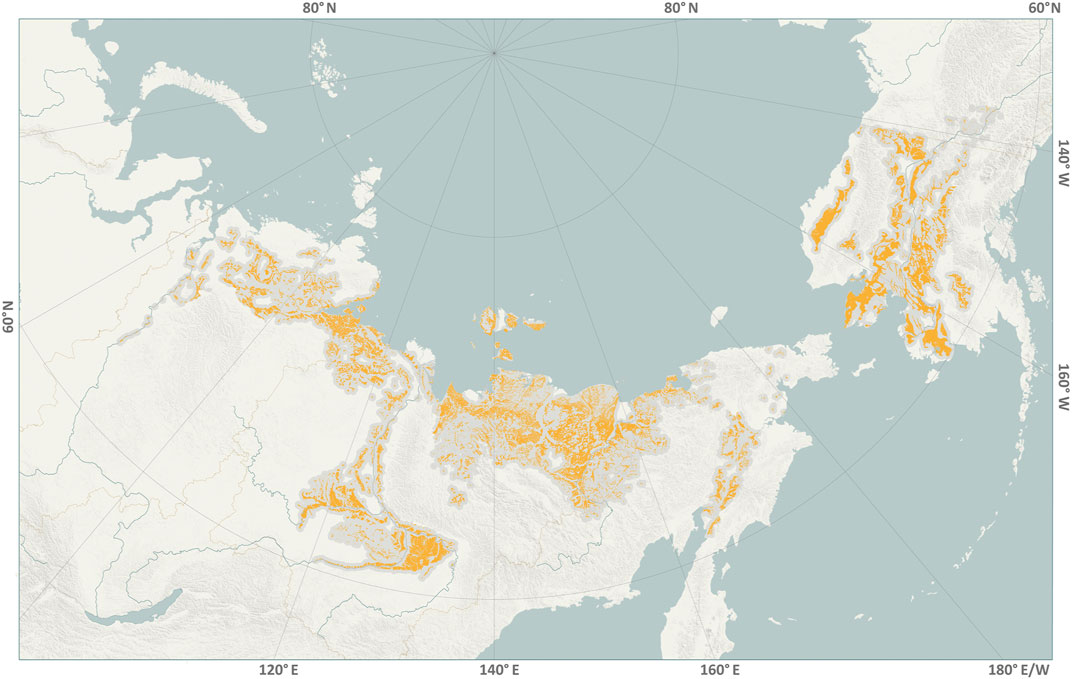
FIGURE 4. Yedoma Northern Hemisphere Distribution. The grey area illustrates the Yedoma domain outline visualized with a 20 km buffer around all digitized areas. An A0 map version of this map is available in the supplement, and a geospatial PDF on https://apgc.awi.de/. The blank area on the map is considered as an area where Yedoma does not exist.
3 Results
3.1 Coverage and Regional Classification
We estimated the Northern Hemisphere Yedoma domain to cover approximately 2,587,000 km2 located between the Yamal Peninsula in Russia all the way to the Yukon, Canada (Figure 4). In this domain, we estimate that 480,000 km2 to be underlain by Yedoma. 35% of the total Yedoma area today is located in the tundra zone, and 65% in the taiga and boreal ecozone (tree line from Walker et al., 2005).
Our database includes more than 360 boreholes and exposures and more than 13,600 digitized Yedoma areas. For the area calculations please note the above-mentioned Alaskan correction factor of 0.5. The globally northernmost Yedoma occurrence was found on 138.9°E, 76.19°N (Kotelny Island, confidence class: confirmed), the easternmost in 136.0°W, 62.88°N (close to the village of Pelly Crossing, Canada, confidence class: uncertain), the southernmost in Central Yakutia 127.3°, 61.0° (close to the village Sinsk, Yakutia, confidence class: confirmed), and the westernmost 83.0°E, 70.3°N (Yenisei River, confidence class: uncertain). If only including the confirmed areas, the latitudinal extent stretches from 76.19°N to 61.0°N and longitudinal extent from 141°W to 83.28°E. Separated from east to west (a bit misleading as we are crossing the international date line), 19% of the Yedoma area is found in North America (18.5% Alaska, 0.1% in Canada) and 81% in northern Asia.
3.2 Confidence
We found 83% (399,060 km2) of our digitized Yedoma areas to be confirmed, 5% (21,873 km2) to be likely and 12% (58,808 km2) to be uncertain. Looking at the Yedoma domain (Figure 4) and its confidence estimates (Figure 5), Yakutia proves to be the heartland of Yedoma.
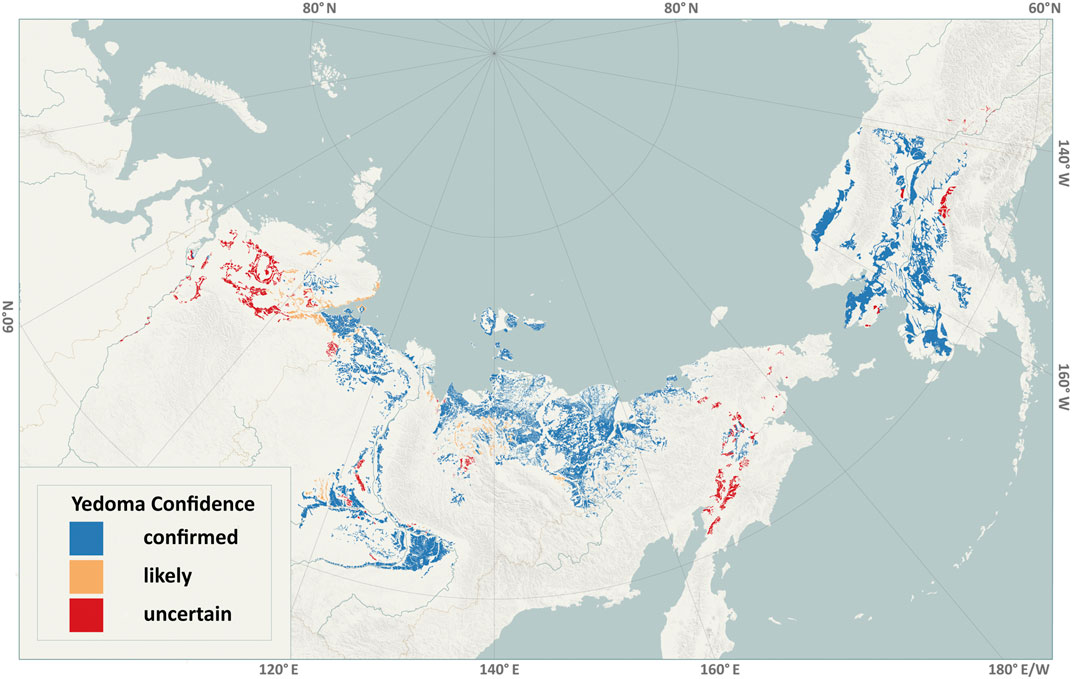
FIGURE 5. Spatial distribution of the confidence classes: confirmed (blue), likely (orange) and uncertain (red). An A0 map version of this map is available in the supplement, and a geospatial PDF on https://apgc.awi.de/.
3.3 Available Products
All products from the present Yedoma mapping attempt are based on the Ice-Rich Yedoma Permafrost (IRYP) database. A preliminary version was published by Strauss et al. (2016) and with this study, we enhanced and finalized the database. All reported results and products of this study are based on this second version (IRYPv2).
The main product of this study is the map (Figure 4 and map version in the supplement) and its confidence estimate (Figure 5 and map version in the supplement).
Moreover, we worked closely together with the geospatial visualization team of the Alfred Wegener Institute (Germany;bWFwc0Bhd2kuZGU=) and the Arctic Permafrost Geospatial Centre (APGC; https://apgc.awi.de/) to make a WebGIS available allowing for interaction with the spatial data sets (Supplementary Figure S1). We further published a visual tool called the Yedoma picture database (Supplementary Figure S2) that is hosted and visualized by the APGC and PANGAEA, whose pictures were used for the confidence assessment.
4 Discussion
4.1 Previous Large Scale Mapping of Yedoma Distribution
Various maps of Yedoma distribution exist in the literature. However, most of them are small-scale (1:10,000,000 or smaller) maps that tend to under or overestimate the spatial extent of Yedoma. The Yedoma map most widely referred to is that of Romanovskii (1993) (Supplementary Table S1 and Supplementary Figure S4), but the first Yedoma map, to our knowledge, was published by Tormidiaro (1980) (Supplementary Table S1 and Supplementary Figure S4). In another adaptation of the small-scale map of Yedoma distribution, Konishchev (2011) separated the Yedoma deposits into three categories of spatial distribution, ranging from widely distributed to fragmented to sporadic (Supplementary Table S1).
The area covered by Yedoma in Romanivskii’s (not including spatially not quantified “Yedoma in river valleys) map is 1,141,390 km2. This map has been subsequently adapted by Siegert and Romanovskii (1996) and was furthermore published by Schirrmeister et al. (2002b), showing Yedoma extent in central and northeastern Siberian lowlands and indicating additional Yedoma occurrences in formerly unglaciated valleys. Besides Romanovskii (1993), we digitized the maps by Tormidiaro (1980), Grigoriev and Kunitsky (2000) and Konishchev (2011) (Supplementary Figure S4 and Supplementary Table S11).
There are two other citable estimates for the extent of the Yedoma region in Siberia: 1,000,000 km2 assumed by Zimov et al. (2006), and 1,186,000 km2 estimated by Strauss et al. (2013). In our study, we estimated an extent of 1,957,885 km2 for the Siberian Yedoma domain, which is by about 49, 42 and 39% more than found in Zimov et al. (2006), Romanovskii (1993), and Strauss et al. (2013), respectively. The main reason for this is that we included a broader east-to-west extent, as well as that Romanovskii’s (1993) not quantifiable signatures on Yedoma distribution in river valleys (Supplementary Table S1).
4.2 Previous Regional Mapping of Yedoma Distribution
Several maps of regional Yedoma extent exist, for example, for the Yana-Indigirka and Kolyma lowlands (Tomirdiaro, 1980), or Yakutia (Grigoriev and Kunitsky, 2000) (Supplementary Table S1). The areas of all these maps are not comparable to our new numbers, as field studies and high-resolution satellite imagery clearly indicate that the Yedoma deposit cover in the Yedoma domain is not uniform, but can range from complete to heavily fragmented remnants (e.g. Figure 3). For example, Grosse et al. (2006) indicated that only about 22% of the Yedoma surface area in the Lena Anabar lowland near Cape Mamontov Klyk was preserved in its original state. Within the Yana-Indigirka lowland, the Yedoma area on Buor-Khaya Peninsula is 15% (Günther et al., 2013) and on Shirokostan Peninsula 42% (Tarasenko et al., 2013). In the State Geological Map from the year 2000, 31% is covered by alases and 27% by Yedoma in the Indigirka-Kolyma region (Shmelev et al., 2017). Following Lomachenkov (1966), 65–75% of the Yana-Indigirka region is covered by alases and 25% by Yedoma. For the Kolyma Lowland tundra zone, Veremeeva and Glushkova (2016) found a coverage of 72% for alases and 16% for Yedoma. Strauss et al. (2013) generalized the Yedoma domain for Northern Yakutia and found 56% covered by alas and 30% by Yedoma deposits.
This fragmentation in Yedoma extent varies by location and map source. In most cases it is captured in high-resolution scales of 1:1,000,000 and better. Examples for a much higher resolution mapping are Veremeeva (2021), who published an update for the Yana-Indigirka and Kolyma Lowlands (Supplementary Table S1) as well as Jongejans et al. (2018b) for the Baldwin Peninsula, and Morgenstern et al. (2011) for Lena Delta Yedoma.
4.3 Applicability
The spatial dataset of Yedoma distribution will have broad applications. A range of studies citing the first version of the IRYP dataset (Strauss et al., 2016) suggest that an accurate spatial Yedoma extent dataset is useful in the context of modelling, reconstructing paleo-environmental dynamics and past ecosystems such as the mammoth-steppe-tundra, or assessments of ground ice distribution and future thermokarst vulnerability (e.g. Wild et al., 2019; Nitzbon et al., 2020; Douglas et al., 2021).
Moreover, the map is a crucial improvement needed to refine the present-day Yedoma permafrost organic matter inventory as included in Hugelius et al. (2013) or Strauss et al. (2017).
4.4 Dataset Limitations
Our data set is a significant improvement to previous mapping attempts of the Yedoma region. However, when mapping such a large area in uninhabited terrain, several potential sources of errors need to be discussed such as the fragmentation of Yedoma, the resolution of the final product, the definition of Yedoma itself.
4.4.1 Map Resolution
The fragmentation of the Yedoma extent can be captured in high-resolution scales of 1:1,000,000 and higher. In the State Geological Map (2000) of the Indigirka-Kolyma region (R-55-57), 31% is occupied by alases and 27% by Yedoma, while the more detailed estimate on the same study region using Landsat images reveal an alas area of 50% and a Yedoma area of 13% (Shmelev et al., 2017; Veremeeva, 2021). Therefore, the coverage of Yedoma could be about two times overestimated on maps of 1,000,000 scale due to the high level of initial Yedoma relief dissection by thermokarst and thermal erosion, which could be mapped on a more detailed scale using remote sensing data. Taking our estimate (based on a map of the region which was also quantified by Veremeeva (2021)), our database included 50% more Yedoma area compared to the identical region like in Veremeeva (2021) (Supplementary Table S10). For our map, we included Veremeeva’s (2021) update for this specific region, but having this in mind, the rest of our circum-Arctic Yedoma mapping approach is potentially overestimating the Yedoma distribution. Moreover, since the year of the map’s data acquisition, the degradation of Yedoma deposits likely continued. Especially when considering that the Yedoma domain belongs to one of the hotspots of warming, with a temperature increase of more than ∼4°C (NASA Visualization Studio, 2021) since von Bunge’s (1883) first steps to the todays accepted interpretation of how the ground ice in Yedoma was formed.
4.4.2 Yedoma Existence Under Overlying Sediments
Another important point of discussion was mentioned by Grosse et al. (2013). They pointed to a need to carefully evaluate the Yedoma coverage from the fact that a two-dimensional surface source map, as true for nearly every classical map, cannot properly represent the total spatial extent of geologic horizons that potentially overlap in three dimensions. The Yedoma units represented in the maps (and thus the ones in our database) are likely those that crop out close to the land surface. Although thermokarst depressions and lakes indicate that the entire underlying Yedoma has thawed out in many cases, shallow lakes may not have fully degraded Yedoma below yet (Shmelev et al., 2017; Walter Anthony et al., 2021). Similarly, younger aeolian or alluvial deposits may cover late Pleistocene Yedoma surfaces. Therefore, it is still unclear whether there are any Yedoma remains beneath the lacustrine and alluvial sediments. Such geological situations would make the identified extent of Yedoma in our database a conservative estimate at the lower end.
4.4.3 General Map Accuracy
As also summarized by Grosse et al. (2013), the general accuracy of the Yedoma distribution shown in this database is tied to several potential general error sources: 1) uncertainties in the original geologic and cryostratigraphic mapping, 2) uncertainties in converting and scaling the original field and remote sensing data to a paper map product, 3) uncertainties in the technical conversion from a paper map to a digital geodatabase, and 4) uncertainties in interpretation of Quaternary geological units across multiple map tiles as a Yedoma unit.
Our study cannot influence the uncertainties mentioned in (1) and (2) and assumes that quality control of the original geologic, stratigraphic, and cartographic work was rigorous. For (3), geometric uncertainties are mostly included, such as the accuracy of georeferencing the maps, and the line thickness of geologic boundaries and their digitization accuracy. To estimate transparently and to minimize errors in (4), we relied on existing scientific literature, our field data and field knowledge of Yedoma and the involvement of expert assessment. Therefore, we introduced the confidence classes, making use of the fact that most of the maps provide evidence that a certain unit is ice-rich, syngenetic, late Pleistocene Yedoma by cryostratigraphic signatures. In a few cases, no signature for high ground-ice content or syngenetic ice wedges was included. However, it was possible to trace such units by comparing them with neighboring polygons in directly adjacent map tiles, connecting them to field or literature data, or intersecting this with other maps and inferring that they are the same units if spatially connected.
4.4.4 Yedoma and Yedoma-like Deposit Definitions
Another important topic to address here are the scientific differences and viewpoints on Yedoma, Ice Complex and muck definitions. This is quite clear for the Yedoma core region, but gets more difficult to the Yedoma domain borders, meaning the easternmost and westernmost sites (Figure 5). The key features of Canadian mucks (eastern edge of Beringia) are that they are primarily found in the extensive-discontinuous permafrost zone. In contrast to the East Siberian Yedoma core area, they are also strongly controlled by aspect (north-facing sites and narrow valleys with relict ice) and they also occur in high relief landscapes. Following our definition, the Holocene part like organics (sologenic) are not included here (Fraser and Burn, 1997; Froese et al., 2009). On the other side, the Western Taymyr to Yamal Peninsula coast is the westernmost area of distribution of Yedoma (Sopochnaya Karga, Marre-Sale, Dikson, Krestyanka River). In contrast to the Yakutian Yedoma, the Western Taymyr Yedoma is less thick (up to 12 m), and includes smaller syngenetic ice wedges (Streletskaya et al., 2007). Nevertheless, the grain-size fractions and cryogenic structure of the Yedoma deposits of Western Taymyr are similar to sections in Yakutia and Alaska (Tomirdiaro and Chernen’kiy, 1987). Here, we see these differences as regional expressions of Yedoma, marking differences in source areas, sedimentation rates, moisture availability and climate during aggradation of these fine-grained ice-rich sediments across Beringia. Secondly, we feel there is more to gain by considering these as regional variants of processes that were active across the region during the Late Pleistocene.
4.4.5 Yedoma Thickness
One important step forward in our dataset and map is for the first time the inclusion of Yedoma thickness, which is needed for volume estimation. However, published data on Yedoma thickness are rather scarce. Synthesized by Strauss et al. (2013; 2017), we compiled field and literature data for available Yedoma depth estimate and updated this with newly available or newly recognized depth estimates (see Supplementary Table S9). Moreover, as visualized in the example in Figure 6, it is difficult to quantify the depth of Yedoma deposits if the base is not reached by the cliff or drilling. Local heterogeneity and depths ranging from 5 to 50 m (mean 17 m, Supplementary Table S9) make it impossible at this current stage to visualize the thickness spatially explicit. There are first approaches to use the depth of thermokarst basins for Yedoma depth estimation such as the study by Veremeeva and Glushkova (2016). For the Kolyma Lowland tundra region, they showed that average depths of Yedoma-alas relief dissection by thermokarst and thermal erosion are 20–25 m between highest elevation of Yedoma uplands and alas levels. This is consistent with Yedoma thickness data of studied exposures and boreholes. Average heights of Yedoma upland and alas relief for low, moderate and high Yedoma fraction regions in Kolyma Lowland tundra correspond to different elevation levels but have similar relative elevation differences between average Yedoma and alas heights across all relief types, which are about 10 m (Veremeeva et al., 2021).
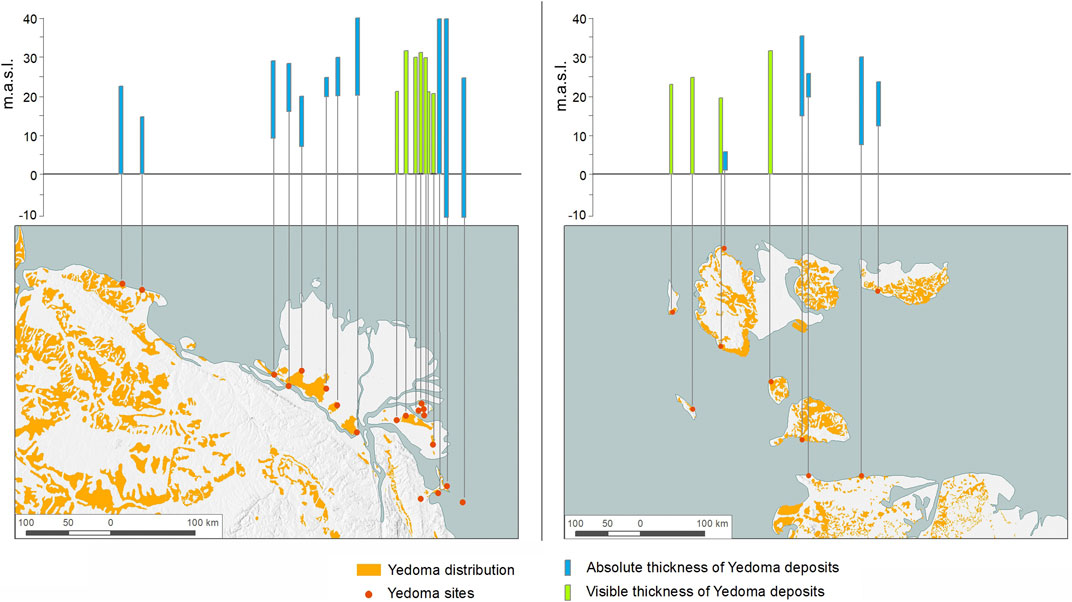
FIGURE 6. Yedoma thickness exemplarily visualized for (left) the Lena-Anabar coastal region, and (right) the New Siberian Islands region. The Yedoma distribution is according to Figure 4. Absolute thickness refers to sites where both upper and lower boundaries of the Yedoma are known, and visible thickness refers to sites with known thickness above sea level and an unknown lower Yedoma boundary below sea level. Please find available depth data in Supplementary Table S9.
4.4.6 Subsea Yedoma Deposits
Another unsolved question is the quantification of potentially preserved Yedoma under today’s sea coverage. The area of this potential subsea Yedoma is highly uncertain: there are only several maps estimating potential areas in the Laptev Sea (1:1,000,000 Quaternary geological map S-52 and S-53,54, and the 1:2,500,000 Quaternary map of the territory of Russian Federation), visualized in Astakhov et al. (2021) and the western part of the East Siberian Sea as indicated in Walter et al. (2007). Although we did not include the potential subsea regions in our map or any submarine Yedoma remnant area estimate in our calculations, we here show an example of potential regions with submarine Yedoma remnants (Figure 7). The outline of the areas shown here enclose 77,620 km2.
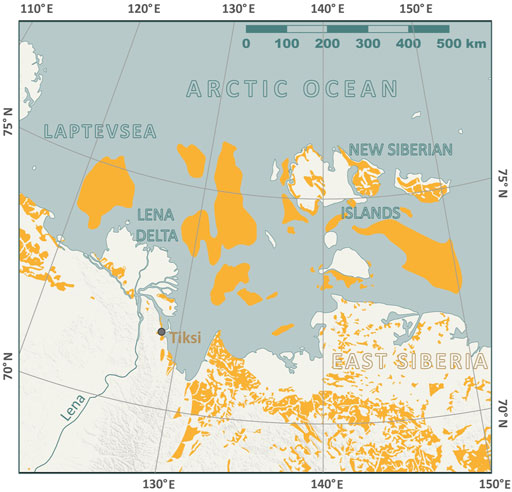
FIGURE 7. Potential areas with subsea remnants of the Yedoma domain in the Laptev and East Siberian seas based on the 1:2,500,000 Quaternary map of the territory of Russian Federation. The subsea areas are not included in our mapping and total area calculation approach due to the high uncertainties.
5 Outlook
Our Yedoma mapping includes a large and diverse amount of available geospatial data from which the Yedoma extent could be extracted. Additional datasets and maps are likely to become available in the future. In particular, Soviet and Russian geological mapping efforts over many decades have been included in geological maps of 1:200,000 scale, however, many of these are not yet published or available for the Northeast Siberian Yedoma regions. A substantial treasure of data on Yedoma distribution and thickness is likely buried in largely inaccessible data from prospecting drilling campaigns focused on engineering, infrastructure planning, exploration, or hydrogeological studies in Siberia as well as in North America. Making such datasets accessible and digitally available would provide a tremendous boost to understanding the distribution of ice-rich syngenetic permafrost at much higher levels of spatial detail. Additional scientific studies on Yedoma exposures and drill cores will further enhance knowledge on Yedoma distribution and thickness and can be integrated in future updates of this new pan-Arctic map and database. A highly promising approach will be the application of geomorphic mapping of Yedoma coverage based on terrain texture and thermokarst and thermal erosion features associated with Yedoma deposits using high-resolution satellite images and digital elevation models. Such remote sensing datasets also allow enhanced quantification of the spatial heterogeneity of remnant Yedoma uplands well below the resolution of currently used mapping scales in this study.
6 Conclusion
The Yedoma geospatial database and map strongly reduces uncertainties in Yedoma distribution. We quantified the Yedoma domain for a land area of 2,587,000 km2 in Central and East Siberia, Alaska and Yukon with areas of digitized Yedoma deposits of 480,000 km2. Today’s Yedoma areas are highly fragmented, which mainly resulted from permafrost degradation processes during the Lateglacial and Holocene such as thermokarst, thermal erosion, and fluvial and coastal erosion. This first complete, digital circum-Arctic Yedoma map is an important step forward to understand the past and present spatial heterogeneity of Yedoma deposits, which is of utmost importance for assessing vulnerabilities and risks in a rapidly warming Arctic.
Data Availability Statement
The datasets presented in this study can be found in online repositories. The names of the repository/repositories and accession number(s) can be found in the article/Supplementary Material.
Author Contributions
JS and GG designed this study. SL, GG and USGS volunteers conducted all digitizing, data archiving and visualizations. JS, GG, and LS drafted the first versions of the manuscript. All authors contributed data to this study and contributed to manuscript finalization.
Funding
This project is part of the Action Group “The Yedoma Region: A Synthesis of Circum-Arctic Distribution and Thickness” (funded by the International Permafrost Association (IPA) to JS) and is embedded in the Permafrost Carbon Network (working group Carbon Stocks). We acknowledge funding by the European Research Council (Starting Grant PETA-CARB #338335) and by the Helmholtz Impulse and Networking Fund (ERC_0013) to GG. IS research is embedded into the Development program of the Interdisciplinary Scientific and Educational School of M.V. Lomonosov Moscow State University “Future Planet and Global Environmental Change” and the program “The cryosphere evolution under climate change and anthropogenic impact” (#121051100164-0). GK was supported by the Russian Foundation For Basic Research (grant 18-05-60279) in the framework of the State Assignment of the Institute of Geography (0148-2019-0004).
Conflict of Interest
The authors declare that the research was conducted in the absence of any commercial or financial relationships that could be construed as a potential conflict of interest.
Publisher’s Note
All claims expressed in this article are solely those of the authors and do not necessarily represent those of their affiliated organizations, or those of the publisher, the editors and the reviewers. Any product that may be evaluated in this article, or claim that may be made by its manufacturer, is not guaranteed or endorsed by the publisher.
Acknowledgments
We thank the University of Alaska Fairbanks, U.S. Geological Survey and the Alfred Wegener Institute for Polar and Marine Research for their support since starting this digital data compilation in 2013. Moreover, we thank the Arctic Geospatial Centre (APGC) for the fruitful collaboration on developing and hosting the products connected to our study. For realizing the WebGIS, we want to thank Antonie Haas.
Supplementary Material
The Supplementary Material for this article can be found online at: https://www.frontiersin.org/articles/10.3389/feart.2021.758360/full#supplementary-material
References
Antonova, S., Sudhaus, H., Strozzi, T., Zwieback, S., Kääb, A., Heim, B., et al. (2018). Thaw Subsidence of a Yedoma Landscape in Northern Siberia, Measured In Situ and Estimated from TerraSAR-X Interferometry. Remote Sensing 10, 494. doi:10.3390/rs10040494
Astakhov, V., Pestova, L., and Shkatova, V. (2021). Loessoids of Russia: Varieties and Distribution. Quat. Int. doi:10.1016/j.quaint.2021.01.005
Beechey, F. W., Bentley, R., and Colburn, H. (1831). Narrative of a Voyage to the Pacific and Beering's Strait, to Co-operate with the Polar Expeditions : Performed in His Majesty's Ship Blossom, under the Command of Captain F.W. Beechey in the Years 1825, 26, 27, 28. London: Henry Colburn and Richard Bentley.
Bryant, R., Robinson, J. E., Demasi, A., Harper, W., Kyker-Snowman, E., Schirrmeister, L., et al. (2017). Digital Database and Maps of Quaternary Deposits in East and Central Siberia. Siberia: USGS.
Chen, L., Voss, C., Fortier, D., and Mckenzie, J. (2021). “Surface Energy Balance of Sub-arctic Roads with Varying Snow Regimes and Properties in Permafrost Regions,” in Permafrost Periglacial Process. John Wiley & Sons Ltd doi:10.1002/ppp.2129
Chudinov, A. N. (1910). Slovar' Inostrannykh Slov, Voshedshikh V Sostav Russkogo Yazyka (Dictionary of Foreign Words Introduced to Russian). Saint Petersburg: Gubinsky publishers, 676.
de Grandpré, I., Fortier, D., Stephani, E., and Burn, C. R. (2012). Degradation of Permafrost beneath a Road Embankment Enhanced by Heat Advected in Groundwater. Can. J. Earth Sci. 49, 953–962. doi:10.1139/e2012-018
Douglas, T. A., Hiemstra, C. A., Anderson, J. E., Barbato, R. A., Bjella, K. L., Deeb, E. J., et al. (2021). Recent Degradation of interior Alaska Permafrost Mapped with Ground Surveys, Geophysics, Deep Drilling, and Repeat Airborne Lidar. The Cryosphere 15, 3555–3575. doi:10.5194/tc-15-3555-2021
Farquharson, L. M., Mann, D. H., Swanson, D. K., Jones, B. M., Buzard, R. M., and Jordan, J. W. (2018). Temporal and Spatial Variability in Coastline Response to Declining Sea-Ice in Northwest Alaska. Mar. Geology. 404, 71–83. doi:10.1016/j.margeo.2018.07.007
Fraser, T. A., and Burn, C. R. (1997). On the Nature and Origin of "muck" Deposits in the Klondike Area, Yukon Territory. Can. J. Earth Sci. 34, 1333–1344. doi:10.1139/e17-106
Froese, D. G., Westgate, J. A., Reyes, A. V., Enkin, R. J., and Preece, S. J. (2008). Ancient Permafrost and a Future, Warmer Arctic. Science 321, 1648. doi:10.1126/science.1157525
Froese, D. G., Zazula, G. D., Westgate, J. A., Preece, S. J., Sanborn, P. T., Reyes, A. V., et al. (2009). The Klondike Goldfields and Pleistocene Environments of Beringia. GSA Today 19, 4–10. doi:10.1130/gsatg54a.1
Fuchs, M., Nitze, I., Strauss, J., Günther, F., Wetterich, S., Kizyakov, A., et al. (2020). Rapid Fluvio-Thermal Erosion of a Yedoma Permafrost Cliff in the Lena River Delta. Front. Earth Sci. 8. doi:10.3389/feart.2020.00336
Grigoriev, M. N., and Kunitsky, V. V. (2000). Ice Complex of the Arctic Coasts of Yakutia as a Sediment Source on the continental Shelf. Hydrometeorological and Biogeochemical Research in the Arctic Region. Vladivostok, Russia: Dalnauka Press, 109–116.
Grosse, G., Robinson, J. E., Bryant, R., Taylor, M. D., Harper, W., Demasi, A., et al. (2013). Distribution of Late Pleistocene Ice-Rich Syngenetic Permafrost of the Yedoma Suite in East and central Siberia, Russia. Reston, Virginia: U.S. Geological Survey. doi:10.3133/ofr20131078
Grosse, G., Schirrmeister, L., and Malthus, T. J. (2006). Application of Landsat-7 Satellite Data and a DEM for the Quantification of Thermokarst-Affected Terrain Types in the Periglacial Lena-Anabar Coastal lowland. Polar Res. 25, 51–67. doi:10.3402/polar.v25i1.6238
Günther, F., Overduin, P. P., Sandakov, A. V., Grosse, G., and Grigoriev, M. N. (2013). Short- and Long-Term Thermo-Erosion of Ice-Rich Permafrost Coasts in the Laptev Sea Region. Biogeosciences 10, 4297–4318. doi:10.5194/bg-10-4297-2013
Günther, F., Overduin, P. P., Yakshina, I. A., Opel, T., Baranskaya, A. V., and Grigoriev, M. N. (2015). Observing Muostakh Disappear: Permafrost Thaw Subsidence and Erosion of a Ground-Ice-Rich Island in Response to Arctic Summer Warming and Sea Ice Reduction. The Cryosphere 9, 151–178. doi:10.5194/tc-9-151-2015
Hjort, J., Karjalainen, O., Aalto, J., Westermann, S., Romanovsky, V. E., Nelson, F. E., et al. (2018). Degrading Permafrost Puts Arctic Infrastructure at Risk by Mid-century. Nat. Commun. 9, 5147. doi:10.1038/s41467-018-07557-4
Hugelius, G., Bockheim, J. G., Camill, P., Elberling, B., Grosse, G., Harden, J. W., et al. (2013). A New Data Set for Estimating Organic Carbon Storage to 3 M Depth in Soils of the Northern Circumpolar Permafrost Region. Earth Syst. Sci. Data 5, 393–402. doi:10.5194/essd-5-393-2013
Jones, B. M., Irrgang, A. M., Farquharson, L. M., Lantuit, H., Whalen, D., Ogorodov, S., et al. (2020). Arctic Report Card: Update for 2020 - the Sustained Transformation to a Warmer, Less Frozen and Biologically Changed Arctic Remains clear. [Online]. Available at: https://arctic.noaa.gov/Report-Card/Report-Card-2020/ArtMID/7975/ArticleID/904/Coastal-Permafrost-Erosion (Accessed 08 2021, 08).
Jones, B. M., Grosse, G., Arp, C. D., Jones, M. C., Walter Anthony, K. M., and Romanovsky, V. E. (2011). Modern Thermokarst lake Dynamics in the Continuous Permafrost Zone, Northern Seward Peninsula, Alaska. J. Geophys. Res. 116, G00M03. doi:10.1029/2011jg001666
Jongejans, L. L., Strauss, J., Lenz, J., Peterse, F., Mangelsdorf, K., Fuchs, M., et al. (2018a). Organic Matter Characteristics in Yedoma and Thermokarst Deposits on Baldwin Peninsula, West Alaska. Biogeosciences 15, 6033–6048. doi:10.5194/bg-15-6033-2018
Jongejans, L. L., Strauss, J., Lenz, J., Peterse, F., Mangelsdorf, K., Fuchs, M., et al. (2018b). Sedimentological, Biogeochemical and Geochronological Data of Yedoma and Thermokarst Deposits in West-Alaska. PANGAEA. doi:10.1594/PANGAEA.892310
Jorgenson, M. T., Yoshikawa, K., Kanevskiy, M., Shur, Y., Romanovsky, V., Marchenko, S., et al. (2008). “Permafrost Characteristics of Alaska,” in Proceedings of the 9th International Conference on Permafrost, Fairbanks, Alaska, June 29 - July 3, 121–122.
Kanevskiy, M., Shur, Y., Bigelow, N. H., Bjella, K. L., Douglas, T. A., Jones, B. M., et al. (Forthcoming 2021). Yedoma Cryostratigraphy of Recently Excavated Sections of the CRREL Permafrost Tunnel Near Fairbanks, Alaska. Front. Earth Sci. submitted.
Kanevskiy, M., Shur, Y., Fortier, D., Jorgenson, M. T., and Stephani, E. (2011). Cryostratigraphy of Late Pleistocene Syngenetic Permafrost (Yedoma) in Northern Alaska, Itkillik River Exposure. Quat. Res. 75, 584–596. doi:10.1016/j.yqres.2010.12.003
Kanevskiy, M., Shur, Y., Strauss, J., Jorgenson, T., Fortier, D., Stephani, E., et al. (2016). Patterns and Rates of riverbank Erosion Involving Ice-Rich Permafrost (Yedoma) in Northern Alaska. Geomorphology 253, 370–384. doi:10.1016/j.geomorph.2015.10.023
Kaplina, T. (2009). Alas Complex of Northern Yakutia. Kriosfera Zemli (Earth Cryosphere) 13 (4), 3–17.
Konishchev, V. N. (2011). Permafrost Response to Climate Warming. Kriosfera Zemli (Earth Cryosphere) 15 (4), 13–16.
Kotov, A. N., and Brazhnik, S. N. (1991). “Underground Ice and Cryomorphogenesis, Scientific Excursion Guide in the Onemen Bay (Outcrop of Cape Rogozhny),” in Scientific Seminar "Cryolitogenesis", Interdepartmental Lithological Committee of the USSR Academy of Sciences. Magadan: Anadyr, 1–31.
Lehner, B., and Döll, P. (2004). Development and Validation of a Global Database of Lakes, Reservoirs and Wetlands. J. Hydrol. 296, 1–22. doi:10.1016/j.jhydrol.2004.03.028
Lenton, T. M., Rockström, J., Gaffney, O., Rahmstorf, S., Richardson, K., Steffen, W., et al. (2019). Climate Tipping Points - Too Risky to Bet against. Nature 575, 592–595. doi:10.1038/d41586-019-03595-0
Lenz, J., Wetterich, S., Jones, B. M., Meyer, H., Bobrov, A., and Grosse, G. (2016). Evidence of Multiple Thermokarst lake Generations from an 11 800‐year‐old Permafrost Core on the Northern S Eward P Eninsula, A Laska. Boreas 45, 584–603. doi:10.1111/bor.12186
Lomachenkov, V. S. (1966). “On the Main Stages of Geologic Development of the Lena-Kolyma Coastal lowland during the Late Quaternary and Recent Epochs,” in The Quaternary Period in Siberia. Editor V. N. Saks (Moscow: Nauka), 283–288.
Morgenstern, A., Overduin, P. P., Günther, F., Stettner, S., Ramage, J., Schirrmeister, L., et al. (2021). Thermo‐erosional Valleys in Siberian Ice‐rich Permafrost. Permafrost and Periglac Process 32, 59–75. doi:10.1002/ppp.2087
Morgenstern, A., Röhr, C., Grosse, G., and Grigoriev, M. N. (2011). The Lena River Delta - Inventory of Lakes and Geomorphological Terraces. PANGAEA. doi:10.1594/PANGAEA.758728
Morgenstern, A., Ulrich, M., Günther, F., Roessler, S., Fedorova, I. V., Rudaya, N. A., et al. (2013). Evolution of Thermokarst in East Siberian Ice-Rich Permafrost: A Case Study. Geomorphology 201, 363–379. doi:10.1016/j.geomorph.2013.07.011
Murton, J. B., Opel, T., Toms, P., Blinov, A., Fuchs, M., Wood, J., et al. (2021). A Multimethod Dating Study of Ancient Permafrost, Batagay Megaslump, East Siberia. Quat. Res., 1–22.(in press) doi:10.1017/qua.2021.27
NASA Visualization Studio (2021). Global Temperature Anomalies from 1880 to 2020. [Online]. NASA. Available at: https://svs.gsfc.nasa.gov/4882 (Accessed 08 2021, 08).
Nitzbon, J., Westermann, S., Langer, M., Martin, L. C. P., Strauss, J., Laboor, S., et al. (2020). Fast Response of Cold Ice-Rich Permafrost in Northeast Siberia to a Warming Climate. Nat. Commun. 11, 2201. doi:10.1038/s41467-020-15725-8
Nitze, I., Grosse, G., Jones, B., Arp, C., Ulrich, M., Fedorov, A., et al. (2017). Landsat-Based Trend Analysis of Lake Dynamics across Northern Permafrost Regions. Remote Sensing 9, 640. doi:10.3390/rs9070640
Pastick, N. J., Jorgenson, M. T., Goetz, S. J., Jones, B. M., Wylie, B. K., Minsley, B. J., et al. (2019). Spatiotemporal Remote Sensing of Ecosystem Change and Causation across Alaska. Glob. Change Biol. 25, 1171–1189. doi:10.1111/gcb.14279
Romanovskii, N. N. (1993). Fundamentals of Cryogenesis of Lithosphere. Moscow: Moscow University Press.
Schirrmeister, L., Dietze, E., Matthes, H., Grosse, G., Strauss, J., Laboor, S., et al. (2020). The Genesis of Yedoma Ice Complex Permafrost - Grain-Size Endmember Modeling Analysis from Siberia and Alaska. E&g Quat. Sci. J. 69, 33–53. doi:10.5194/egqsj-69-33-2020
Schirrmeister, L., Froese, D., Tumskoy, V., Grosse, G., and Wetterich, S. (2013). “Permafrost and Periglacial Features | Yedoma: Late Pleistocene Ice-Rich Syngenetic Permafrost of Beringia,” in Encyclopedia of Quaternary Sciences. Editor S. A. Elias. 2 ed (Amsterdam: Elsevier), 542–552. doi:10.1016/B978-0-444-53643-3.00106-0
Schirrmeister, L., Grosse, G., Wetterich, S., Overduin, P. P., Strauss, J., Schuur, E. A. G., et al. (2011a). Fossil Organic Matter Characteristics in Permafrost Deposits of the Northeast Siberian Arctic. J. Geophys. Res. 116, G00M02. doi:10.1029/2011jg001647
Schirrmeister, L., Kunitsky, V., Grosse, G., Wetterich, S., Meyer, H., Schwamborn, G., et al. (2011b). Sedimentary Characteristics and Origin of the Late Pleistocene Ice Complex on north-east Siberian Arctic Coastal Lowlands and Islands - A Review. Quat. Int. 241, 3–25. doi:10.1016/j.quaint.2010.04.004
Schirrmeister, L., Siegert, C., Kunitzky, V. V., Grootes, P. M., and Erlenkeuser, H. (2002a). Late Quaternary Ice-Rich Permafrost Sequences as a Paleoenvironmental Archive for the Laptev Sea Region in Northern Siberia. Int. J. Earth Sci. 91, 154–167. doi:10.1007/s005310100205
Schirrmeister, L., Siegert, C., Kuznetsova, T., Kuzmina, S., Andreev, A., Kienast, F., et al. (2002b). Paleoenvironmental and Paleoclimatic Records from Permafrost Deposits in the Arctic Region of Northern Siberia. Quat. Int. 89, 97–118. doi:10.1016/S1040-6182(01)00083-0
Schneider von Deimling, T., Lee, H., Ingeman-Nielsen, T., Westermann, S., Romanovsky, V., Lamoureux, S., et al. (2021). Consequences of Permafrost Degradation for Arctic Infrastructure - Bridging the Model gap between Regional and Engineering Scales. The Cryosphere 15, 2451–2471. doi:10.5194/tc-15-2451-2021
Schuur, E. A. G., Mcguire, A. D., Schädel, C., Grosse, G., Harden, J. W., Hayes, D. J., et al. (2015). Climate Change and the Permafrost Carbon Feedback. Nature 520, 171–179. doi:10.1038/nature14338
Sher, A. V., Kaplina, T. N., and Ovander, M. G. (1987). Decisions of Interdepartmental Stratigraphic Conference on the Quaternary of the East USSR. Magadan: USSR Academy of Sciences, Far Eastern Branch, North-Eastern Complex Research Institute, 29–62.
Sher, A. V. (1971). “Unified Regional Stratigraphic Chart for the Quaternary Deposits in the Yana-Kolyma lowland and its Mountainous Surroundings - Explanatory Note,” in Mammals and Stratigraphy of the Pleistocene of the Extreme Northeast of the USSR and North America. Moscow: Nauka.
Shmelev, D., Veremeeva, A., Kraev, G., Kholodov, A., Spencer, R. G. M., Walker, W. S., et al. (2017). Estimation and Sensitivity of Carbon Storage in Permafrost of North-Eastern Yakutia. Permafrost Periglac. Process. 28, 379–390. doi:10.1002/ppp.1933
Shur, Y., Fortier, D., Jorgenson, T., Kanevskiy, M., Schirrmeister, L., Strauss, J., et al. (Forthcoming 2021a). Yedoma Permafrost Genesis: More Than 150 Years of Mystery and Controversy. Front. Earth Sci.
Shur, Y., Jones, B. M., Kanevskiy, M., Jorgenson, T., Jones, M. K. W., Fortier, D., et al. (2021b). Fluvio‐thermal Erosion and thermal Denudation in the Yedoma Region of Northern Alaska: Revisiting the Itkillik River Exposure. Permafrost and Periglac Process 32, 277–298. doi:10.1002/ppp.2105
Shur, Y., French, H. M., Bray, M. T., and Anderson, D. A. (2004). Syngenetic Permafrost Growth: Cryostratigraphic Observations from the CRREL Tunnel Near Fairbanks, Alaska. Permafrost Periglac. Process. 15, 339–347. doi:10.1002/ppp.486
Siegert, C., and Romanovskii, N. N. (1996). “The Late Pleistocene ‘Ice Complex’ a Phenomenon of the Non Glaciated Areas of Northern Eurasia,” in First Annual Workshop of the EST Scientific Program: Quaternary Environment of the Eurasian North, QUEEN, Strasbourg, France, November 29–December 2, 1996. Kiel: Christian-Albrechts-Universität, 122–123.
Solov'ev, P. (1959). Kriolitozona Severnoy Chasti Leno-Amginskogo Mezhdurech’ya (The Permafrost of the Northern Part of the Lena-Amga Interfluve). Moscow: Academy of Science Press.
Strauss, J., Laboor, S., Fedorov, A. N., Fortier, D., Froese, D. G., Fuchs, M., et al. (2016). Database of Ice-Rich Yedoma Permafrost (IRYP). PANGAEA. doi:10.1594/PANGAEA.861733
Strauss, J., Schirrmeister, L., Grosse, G., Fortier, D., Hugelius, G., Knoblauch, C., et al. (2017). Deep Yedoma Permafrost: A Synthesis of Depositional Characteristics and Carbon Vulnerability. Earth-Science Rev. 172, 75–86. doi:10.1016/j.earscirev.2017.07.007
Strauss, J., Schirrmeister, L., Grosse, G., Wetterich, S., Ulrich, M., Herzschuh, U., et al. (2013). The Deep Permafrost Carbon Pool of the Yedoma Region in Siberia and Alaska. Geophys. Res. Lett. 40, 6165–6170. doi:10.1002/2013GL058088
Streletskaya, I., Gusev, E., Vasiliev, A., Kanevskiy, M., Anikina, N. Y., and Derevyanko, L. (2007). New Results of Quaternary Sediment Studies of Western Taymyr. Kriosfera Zemli (Earth Cryosphere) 11 (3), 14–28.
Streletskiy, D. A., Suter, L. J., Shiklomanov, N. I., Porfiriev, B. N., and Eliseev, D. O. (2019). Assessment of Climate Change Impacts on Buildings, Structures and Infrastructure in the Russian Regions on Permafrost. Environ. Res. Lett. 14, 025003. doi:10.1088/1748-9326/aaf5e6
Tarasenko, T. V., Kravtsova, V. I., and Pizhankova, E. I. (2013). "Study of Thermokarst Lakes Dynamics in the Coastal Part of the Yana-Indigirka lowland Using Remote Data", in: Proceedings of the Conference Geocryological mapping: Problems and prospects, Moscow, Russia, June 5–6, 2013, 135–138.
Tomirdiaro, S. V., and Chernen'kiy, B. I. (1987). Cryogenic-eolian Deposits of East Arctic and Sub-arctic. Moscow: Nauka.
Tomirdiaro, S. V. (1980). Loess-ice Formations in East Siberia during the Late Pleistocene and Holocene. Moscow: Nauka Press.
Tumskoy, V. (2012). Peculiarities of Cryolithogenesis in Northern Yakutia (Middle Neopleistocene to Holocene). Kriosfera Zemli (Earth Cryosphere) 16 (1), 12–21.
Ulrich, M., Grosse, G., Strauss, J., and Schirrmeister, L. (2014). Quantifying Wedge-Ice Volumes in Yedoma and Thermokarst basin Deposits. Permafrost Periglac. Process. 25, 151–161. doi:10.1002/ppp.1810
Ulrich, M., Matthes, H., Schirrmeister, L., Schütze, J., Park, H., Iijima, Y., et al. (2017). Differences in Behavior and Distribution of Permafrost‐related Lakes in C Entral Y Akutia and Their Response to Climatic Drivers. Water Resour. Res. 53, 1167–1188. doi:10.1002/2016WR019267
Veremeeva, A., and Glushkova, N. (2016). Formation of Relief in the Regions of Ice Complex Deposits Distribution: Remote Sensing and GIS Studies in the Kolyma lowland Tundra. Kriosfera Zemli (Earth Cryosphere) 20 (1), 14–24.
Veremeeva, A., Nitze, I., Günther, F., Grosse, G., and Rivkina, E. (2021). Geomorphological and Climatic Drivers of Thermokarst Lake Area Increase Trend (1999-2018) in the Kolyma Lowland Yedoma Region, North-Eastern Siberia. Remote Sensing 13, 178. doi:10.3390/rs13020178
Veremeeva, A. (2021). Quaternary Deposits Map of Yana-Indigirka and Kolyma Lowlands Tundra Zone, R-55-57, Based on Landsat Imagery. PANGAEA. doi:10.1594/PANGAEA.927292
von Bunge, A. (1883). “Natural History News from the Polar Station at the Mouth of the Lena River. From a Letter to the Academician Leopold von Schrenck,” in Bull. Imp. Acad. Sci. 11, 581–622.
von Kotzebue, O. (1821). Entdeckungs-Reise in die Süd-See und nach der Berings-Straße zur Erforschung einer nordöstlichen Durchfahrt: unternommen in den Jahren 1815, 1816, 1817 und 1818, auf Kosten des Herrn Reichs-Kanzlers Grafen Rumanzoff auf dem Schiffe Rurick unter dem Befehle des Lieutenants der Russisch Kaiserlichen Marine Otto von Kotzebue. Weimar: Gebrüder Hoffmann.
Walker, D. A., Raynolds, M. K., Daniëls, F. J. A., Einarsson, E., Elvebakk, A., Gould, W. A., et al. (2005). The Circumpolar Arctic Vegetation Map. J. Vegetation Sci. 16, 267–282. doi:10.1111/j.1654-1103.2005.tb02365.x
Walter Anthony, K. M., Lindgren, P., Hanke, P., Engram, M., Anthony, P., Daanen, R. P., et al. (2021). Decadal-scale Hotspot Methane Ebullition within Lakes Following Abrupt Permafrost Thaw. Environ. Res. Lett. 16, 035010. doi:10.1088/1748-9326/abc848
Walter, K. M., Edwards, M. E., Grosse, G., Zimov, S. A., and Chapin, F. S. (2007). Thermokarst Lakes as a Source of Atmospheric CH4 during the Last Deglaciation. Science 318, 633–636. doi:10.1126/science.1142924
Wetterich, S., Kizyakov, A., Fritz, M., Wolter, J., Mollenhauer, G., Meyer, H., et al. (2020). The Cryostratigraphy of the Yedoma Cliff of Sobo-Sise Island (Lena delta) Reveals Permafrost Dynamics in the central Laptev Sea Coastal Region during the Last 52 Kyr. The Cryosphere 14, 4525–4551. doi:10.5194/tc-14-4525-2020
Wetterich, S., Rudaya, N., Kuznetsov, V., Maksimov, F., Opel, T., Meyer, H., et al. (2019). Ice Complex Formation on Bol'shoy Lyakhovsky Island (New Siberian Archipelago, East Siberian Arctic) since about 200 Ka. Quat. Res. 92, 530–548. doi:10.1017/qua.2019.6
Wild, B., Andersson, A., Bröder, L., Vonk, J., Hugelius, G., Mcclelland, J. W., et al. (2019). Rivers across the Siberian Arctic Unearth the Patterns of Carbon Release from Thawing Permafrost. Proc. Natl. Acad. Sci. USA 116, 10280–10285. doi:10.1073/pnas.1811797116
Wolfe, S. A., Gillis, A., and Robertson, L. (2009). Late Quaternary Aeolian Deposits of Northern North America: Age and Extent. Geol. Surv. Can. Open File 6006. doi:10.4095/226434
Yukon geological survey (2014). in Yukon Digital Surficial Geology Compilation. Editors P. S. Lipovsky, and J. D. Bond.
Keywords: late Pleistocene, syngenetic permafrost, Beringia, Siberia, Alaska, Yukon
Citation: Strauss J, Laboor S, Schirrmeister L, Fedorov AN, Fortier D, Froese D, Fuchs M, Günther F, Grigoriev M, Harden J, Hugelius G, Jongejans LL, Kanevskiy M, Kholodov A, Kunitsky V, Kraev G, Lozhkin A, Rivkina E, Shur Y, Siegert C, Spektor V, Streletskaya I, Ulrich M, Vartanyan S, Veremeeva A, Anthony KW, Wetterich S, Zimov N and Grosse G (2021) Circum-Arctic Map of the Yedoma Permafrost Domain. Front. Earth Sci. 9:758360. doi: 10.3389/feart.2021.758360
Received: 13 August 2021; Accepted: 11 October 2021;
Published: 28 October 2021.
Edited by:
Nozomu Takeuchi, Chiba University, JapanReviewed by:
Yoshihiro Iijima, Mie University, JapanKazuyuki Saito, Japan Agency for Marine-Earth Science and Technology (JAMSTEC), Japan
Copyright © 2021 Strauss, Laboor, Schirrmeister, Fedorov, Fortier, Froese, Fuchs, Günther, Grigoriev, Harden, Hugelius, Jongejans, Kanevskiy, Kholodov, Kunitsky, Kraev, Lozhkin, Rivkina, Shur, Siegert, Spektor, Streletskaya, Ulrich, Vartanyan, Veremeeva, Anthony, Wetterich, Zimov and Grosse. This is an open-access article distributed under the terms of the Creative Commons Attribution License (CC BY). The use, distribution or reproduction in other forums is permitted, provided the original author(s) and the copyright owner(s) are credited and that the original publication in this journal is cited, in accordance with accepted academic practice. No use, distribution or reproduction is permitted which does not comply with these terms.
*Correspondence: Jens Strauss, amVucy5zdHJhdXNzQGF3aS5kZQ==