- 1State Key Laboratory of Severe Weather, Chinese Academy of Meteorological Sciences, Beijing, China
- 2University of Chinese Academy of Sciences, Beijing, China
Strong earthquakes are a major cause of natural disasters and may also be related to heavy rainfall events. Both phenomena have received considerable attention in seismology and meteorology, two relatively independent disciplines, but we do not yet know whether there is a connection between them. We investigated the characteristics of daily rainfall over seismic areas in China. Our statistical analyses showed that there is a strong correlation between strong earthquakes (Ms ≥ 6.0) and rainfall over the seismic area, with 74.9% of earthquakes in China accompanied by seismic epicenter rainfall and 86.6% by seismic area rainfall. The statistics also showed that the daily precipitation over the seismic area, including the epicenter, was mainly light rain, with only a few instances of torrential or storm rain, with 80% of the rainfall events lasting two or more days. The maximum cumulative precipitation corresponded well with the strong earthquakes occurring over steep terrain, such as the Taiwan central mountains and the eastern Tibetan Plateau. The earthquake area rainfall had a higher frequency than the 30-years climatological average and was dominated by earthquake events in the wet season. The WRF-ARW numerical simulation of seismic local rainfall during the devastating Ms 8.0 Wenchuan earthquake in May 2008 showed that the geothermal heat from the earthquake strengthened the local convergence of moisture and vertical motion near the epicenter and the upward transport of the sensible heat flux, which favored seismic rainfall. The results of this study show that rainfall in the seismic area is closely related to strong earthquakes and can be triggered and enhanced by geothermal heat.
Introduction
Earthquakes and rainfall are two different natural phenomena, but there are some linkages between their mechanisms. Many climate and weather phenomena, including violent cyclonic storms, arise from air–sea interactions. Earthquakes are caused by collisions between the Earth’s tectonic plates. Large amounts of heat energy are produced by these collisions and warm the Earth’s crust around the epicenter. Land surface temperature anomalies have been observed before earthquakes and have been used in earthquake prediction studies (Bhardwaj et al., 2017). Tectonics is also affected by weather phenomenon. Storms and typhoons may lead to microseismic events (Wang et al., 2018), which can also be triggered by rainfall (Hainzl et al., 2006). The atmospheric anomalies observed in earthquake events include high air temperatures (Alvan et al., 2014), low pressures associated with blocking (Mansouri Daneshvar et al., 2015), cloud and aerosol anomalies (Guo and Wang, 2008), and an increase in carbon-bearing gases (Cui et al., 2016). Although most of these studies are based on single case studies in individual regions, they provide clues to the relationship between the Earth’s atmosphere and earthquakes.
Studies using long time series of data have shown some evidence of local thermal and precipitation abnormalities before earthquakes. For example, the concept of a thermal vortex, referring to a zone of anomalously high soil temperatures, has been used to predict earthquakes in mainland China (Tang and Gao, 1995). Similarly, most strong earthquakes in southern California are preceded by a drought–flood pattern consisting of a few years of drought (below-normal precipitation) terminated by one or more consecutive seasons of heavy (above-normal) rainfall (Huang, et al., 1979). Kraft et al. (2006) found that seismicity had a significant correlation with rainfall and groundwater levels. The highest seismic activity in the summer months always corresponded with the highest annual precipitation. Statistical studies have also shown that the accumulated rainfall (surface latent heat flux) was >10 mm (>50 W m−2) over 3–23 days prior to the main shock of major earthquakes in the Middle East (Mansouri Daneshvar et al., 2014). Many episodes of heavy rainfall have occurred during strong earthquakes in Taiwan Island and mainland China, including the Ms 7.6 Chi-Chi earthquake on September 21, 1999, the Ms 7.2 Xingtai earthquake on March 22, 1966, the Ms 7.8 Tangshan earthquake on July 28, 1976 and the Ms 8.0 Wenchuan earthquake on May 12, 2008. A strong earthquake plus torrential rain leads to an increase risk of disaster.
There is much evidence to suggest a close relationship between earthquakes and local rainfall, but the physical mechanisms require further exploration. We statistically analyzed the frequency of rainfall, the rainfall start time, rainfall duration and seismic daily precipitation for strong earthquakes in mainland China and Taiwan. We then carried out a diagnostic analysis and numerical simulation for the catastrophic Ms 8.0 Wenchuan earthquake on May 12, 2008 to try to explain the influence of strong earthquakes on local rainfall. This topic is a crossover between the atmospheric sciences and tectonics. Our preliminary results suggest that the release of tectonic heat may have a major role in seismic rainfall.
Data and Methods
Data
We used the China Unified Earthquake Catalog Network dataset (1970–2018) from the China Earthquake Data Center (CEDC) of China Earthquake Administration (https://data.earthquake.cn/gcywfl/index.html), the China Ground-Based Daily Meteorological Elements dataset (V3.0) (1970–2018) from the National Meteorological Information Center, China Meteorological Administration and daily precipitation data from 21 rain gauges over Taiwan island from the National Central Weather Bureau in the same time period. We also used the National Centers for Environmental Prediction (NCEP) final operational global analysis (FNL) dataset, which is available every 6 h with a (1 ° × 1 °) horizontal resolution and 26 vertical pressure levels from 1,000 to 10 hPa (http://rda.ucar.edu/datasets/ds083.2/). This product is generated by the Global Data Assimilation System, which continuously collects real-time observational data from the Global Telecommunications System.
Methods
We analyzed daily precipitation data over the seismic area during the earthquake period. The earthquake time range was defined by the adjacent five days—that is, the outbreak day and the 2 days before and 2 days after the outbreak day. We called this 5-day range the influential period. Earthquakes with a magnitude ≥6.0 on the Richter scale were defined as strong earthquakes. There were a total of 262 strong earthquake events in China in the time period 1970–2018 based on the CEDC/CEA datasets. Aftershocks and seaquakes were removed from the data.
Two categories of precipitation in the influential period were used in statistical and diagnostic analysis: the epicenter rainfall and the seismic area rainfall. The rainfall at the station nearest to the epicenter was used to represent the epicenter rainfall. Some of the seismic events occurred in the central and western Tibetan Plateau, where there is only a sparse distribution of meteorological stations. In these cases, the nearest station was defined as a station <100 km from the epicenter for an Ms ≥ 6.0 earthquake, <200 km for an Ms ≥ 7.0 earthquake and <400 km for an Ms ≥ 8.0 earthquake. Considering the different impact radius of earthquakes with different magnitudes, for the definition of seismic area rainfall, the epicenter was taken as the center of a circle and the meteorological observational station with the maximum rainfall within a radius of 100 km for an Ms ≥ 6.0 earthquake, 200 km for an Ms ≥ 7.0 earthquake and 400 km for an Ms ≥ 8.0 earthquake was used to represent the seismic area rainfall. Figure 1 shows a schematic diagram of the seismic epicenter and area rainfall for Ms ≥ 7.0 earthquakes. According to the above definition, the epicenter rainfall is included in the seismic area rainfall.
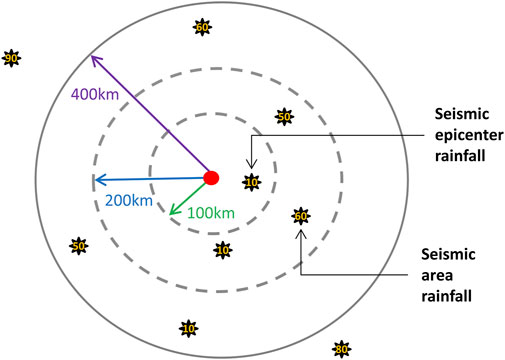
FIGURE 1. Schematic diagram of the seismic epicenter rainfall and seismic area rainfall for an Ms ≥ 7.0 earthquake. The red dot represents the epicenter and the three gray dashed circles denote the influence area for Ms ≥ 6.0, Ms ≥ 7.0 and Ms ≥ 8.0 earthquakes, respectively. The black stars show the locations of the meteorological stations and the daily precipitation (units: mm) is overlaid in gold numbers.
The 24 h accumulated precipitation on the day of the earthquake and 2 days before and after the earthquake was recorded and denoted as Pr (−2d), Pr (−1d), Pr (0d), Pr (+1d) and Pr (+2d), respectively. The daily rainfall categories were defined by the China National Standard GB/T 28592-2012 as light rain (0.1–9.9 mm), moderate rain (10.0–24.9 mm), heavy rain (25.0–49.9 mm), torrential rain (50.0–99.9 mm), heavy torrential rain (100.0–249.9 mm) and extraordinary storm rain (≥250.0 mm). Each year was divided into dry (October–April) and wet (May–September) seasons based on the seasonal characteristics of the East Asian monsoon and associated rain belt.
A numerical simulation was also carried out on the devastating Ms 8.0 Wenchuan earthquake on May 12, 2008 using the Advanced Research Weather Research and Forecasting model version 4.0 (WRF-ARW V4.0) to determine the relation between the earthquake and local rainfall. WRF-ARW is a fully compressible Euler non-hydrostatic model with a hybrid terrain-following vertical coordinate scheme. We used the third-order Runge–Kutta scheme for integration with a smaller time step for the gravity wave mode (Skamarock et al., 2019). Triple two-way interactive nested domain grids centered on (31°N, 103°E) are designed. All three domains were integrated from 00:00 UTC on May 12, 2008 to 00:00 UTC on May 14, 2008. The initial and boundary conditions were interpolated from the NCEP FNL datasets with a spatial resolution 1° and 6 h temporal resolution. The resolutions of the static terrain data were 10′, 5′ and 2′ for the three nested mesh domains and the grid resolutions were 18.5, 9.3 and 3.7 km, respectively. The model top was set at 50 hPa and the vertical resolution was 35 sigma levels. Besides, the WRF single moment 6-class (WSM6) microphysics parameterization scheme (Hong and Lim, 2006), Kain-Fritsch cumulus parameterization (Kain, 2004), and Yonsei university (YSU) planetary boundary layer scheme (Hong et al., 2006) are used.
Daily Rainfall Properties Over the Seismic Area
There were 262 strong earthquakes (Ms ≥ 6.0) in the study area between 1970 and 2018. Figure 2 shows the spatial distribution of the earthquakes and the corresponding weather stations. A total of 105 (40.1%) earthquakes occurred on Taiwan island and 157 (59.9%) in mainland China. A total of 119 (45.4%) earthquakes occurred in the wet season (May–September) and 143 (54.5%) in the dry season (October–April).
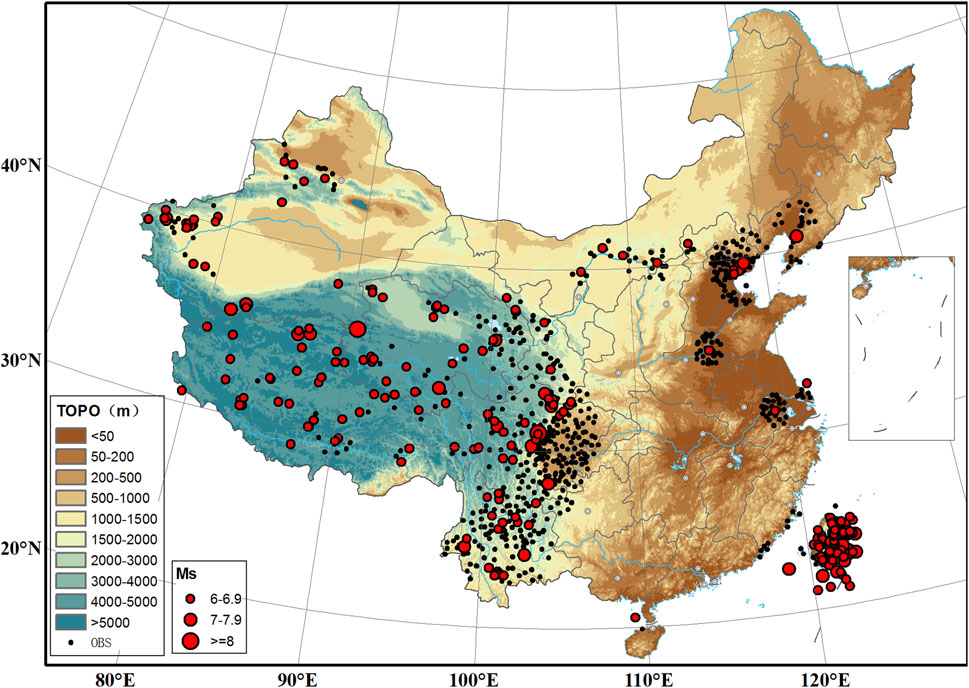
FIGURE 2. Spatial distribution of strong earthquakes (Ms ≥ 6.0; red dots) and the corresponding meteorological stations (black dots) in China.
Figure 2 shows that the meteorological stations were densely distributed in the seismic area or near the epicenter, except in some sparsely inhabited parts of the Tibetan Plateau. Statistical results show that the average distance are 37.2, 42.1 and 59.5 km between the meteorological stations and the epicenter of 6.0 ≤ Ms ≤ 6.9, 7.0 ≤ Ms ≤ 7.9 and Ms ≥ 8.0 earthquakes, respectively.
Figure 3 shows the distribution of rainfall over the seismic area (including the epicenter) during the influential period for the Ms 7.8 Tangshan earthquake on July 28, 1976. The daily precipitation was mainly light rain at the epicenter, but was much heavier over the seismic area.
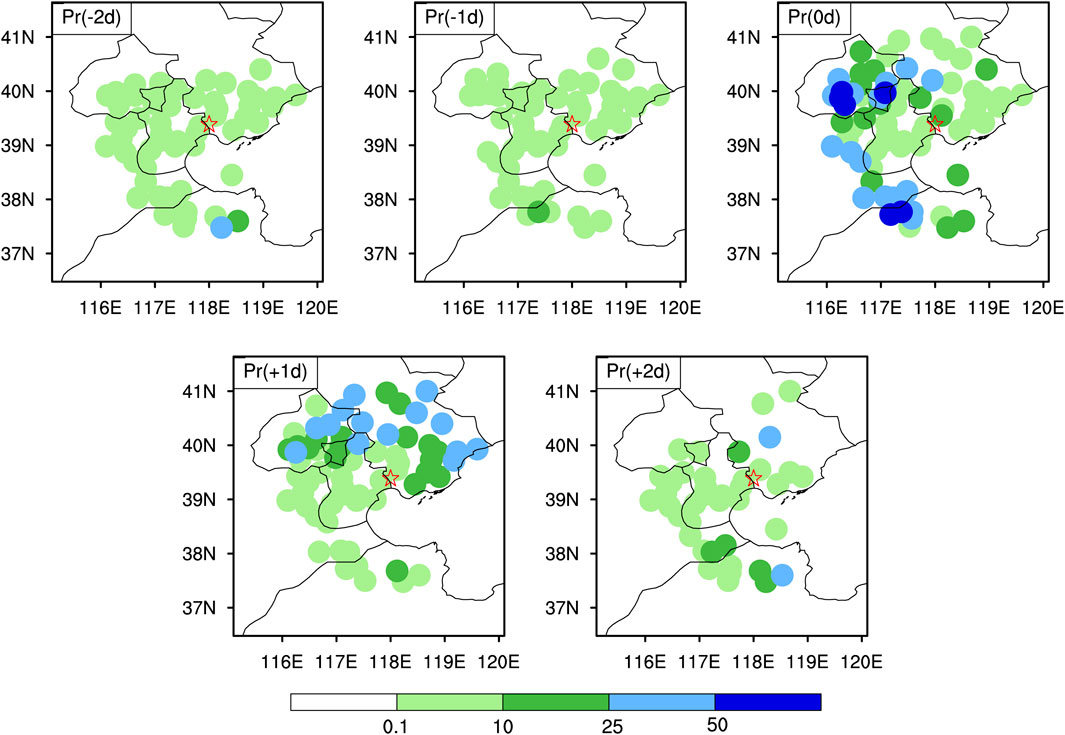
FIGURE 3. Rainfall in the influential period of the Tangshan Ms 7.8 earthquake. The red star represents the epicenter and the colored dots denote different grades of precipitation (units: mm).
Rainfall Frequency
A total of 223 earthquakes among the sample of 262 earthquakes met the criterion defined in Data and Methods and the remaining 39 earthquakes were excluded because there was no weather station within the seismic area. Seismic area rainfall was recorded on at least 1 day of the influential period for 193 earthquakes (86.6%) and seismic epicenter rainfall was recorded in the influential period for 167 earthquakes (74.9%). This suggests a strong connection between strong earthquakes and precipitation over the seismic area, including the epicenter.
Rainfall Occurrence Time and Duration
For the beginning day of rainfall relative to the earthquake occurrence during the influential period, statistics show that there were 89 Pr (−2d), 31 Pr (−1d), 23 Pr (0d), 9 Pr (+1d) and 15 Pr (+2d) epicenter rainfall samples, respectively. And there were 895 Pr (−2d), 270 Pr (−1d), 275 Pr (0d), 206 Pr (+1d) and 97 Pr (+2d) seismic area rainfall samples, respectively. It can be concluded that 71.8% (53.3% + 18.5%) of the epicenter rainfall and 66.8% (51.3% + 15.5%) of seismic area rainfall occurred before strong earthquakes, which suggests that rainfall over the seismic area is indicative of the occurrence of strong earthquakes and it may be related to the geothermal releasing.
In terms of the rainfall duration, that is the number of rainy days for a specific strong earthquake event, 26, 42, 30, 31 and 38 cases had five rainy days, four rainy days, three rainy days, two rainy days and one rainy day over the seismic epicenter, respectively. For the seismic area rainfall, the case numbers for five rainy days, four rainy days, three rainy days, two rainy days and one rainy day are 308, 342, 366, 404 and 323, respectively. Thus, 77.2% of the epicenter rainfall and 81.5% of the seismic area rainfall lasted for two or more days during the 5-days influential period that we defined.
Temporal Distribution of Precipitation
Most of the epicenter precipitation in the influential period fell as light rain (Figure 4). Heavy rainfall in the region of the epicenter and beyond tended to occur during or after earthquakes. The proportion of heavy torrential rain was highest 2 days after the earthquakes, whereas the highest proportion of extraordinary storms occurred 1 day after the earthquakes. Heavy torrential rain and extraordinary storms never occurred before the earthquakes during the study period.
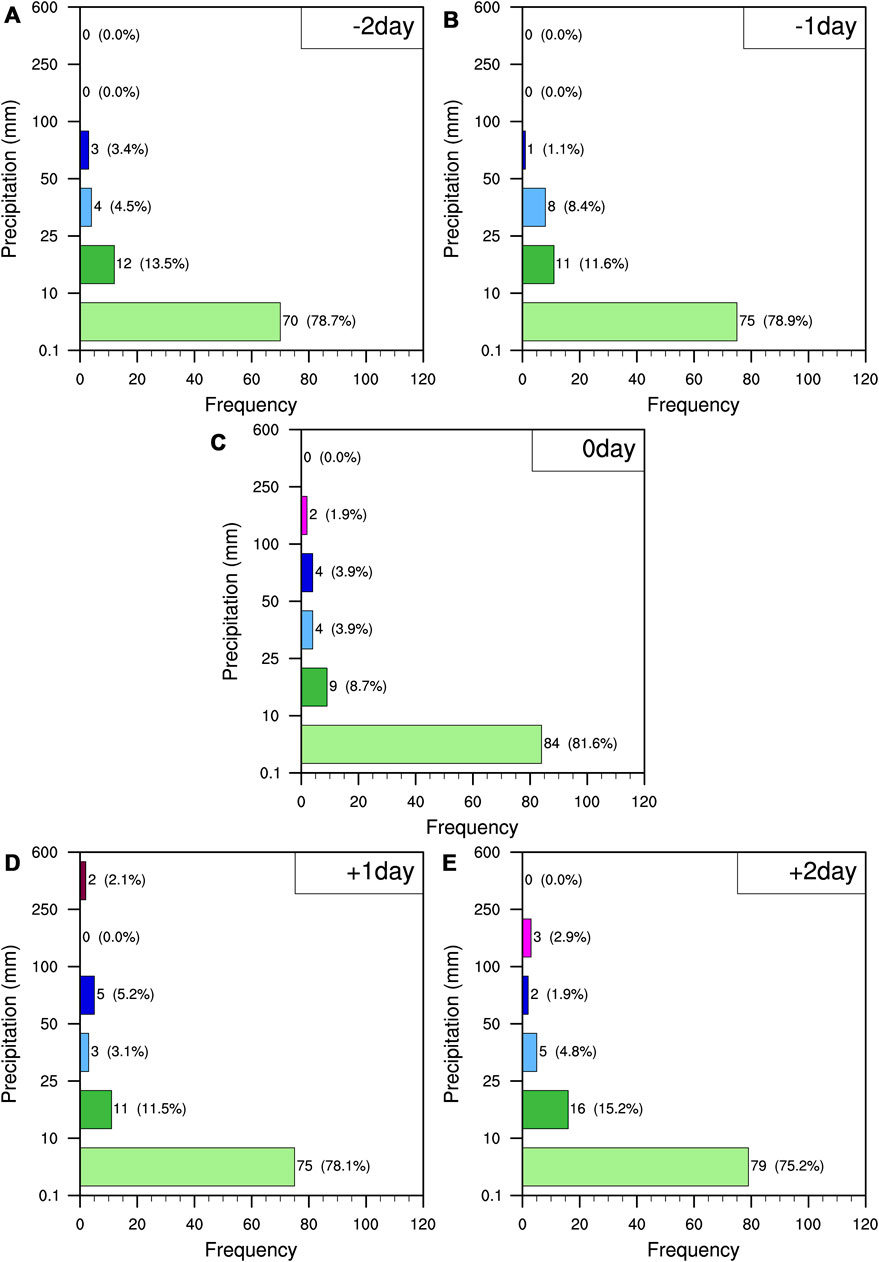
FIGURE 4. Grade of daily precipitation (units: mm) for epicenter rainfall in the influential period.
The trend of daily precipitation in the seismic area during the influential period (Figure 5) was similar to that of epicenter rainfall. The rainfall over the seismic area was mainly light or moderate, with average proportions of 74.6 and 14.3% in the influential period, respectively. Higher grades of precipitation in seismic area rainfall tended to occur 1 day after an earthquake and the proportion of heavy torrential rain reached a maximum of 1.3% 2 days after an earthquake.
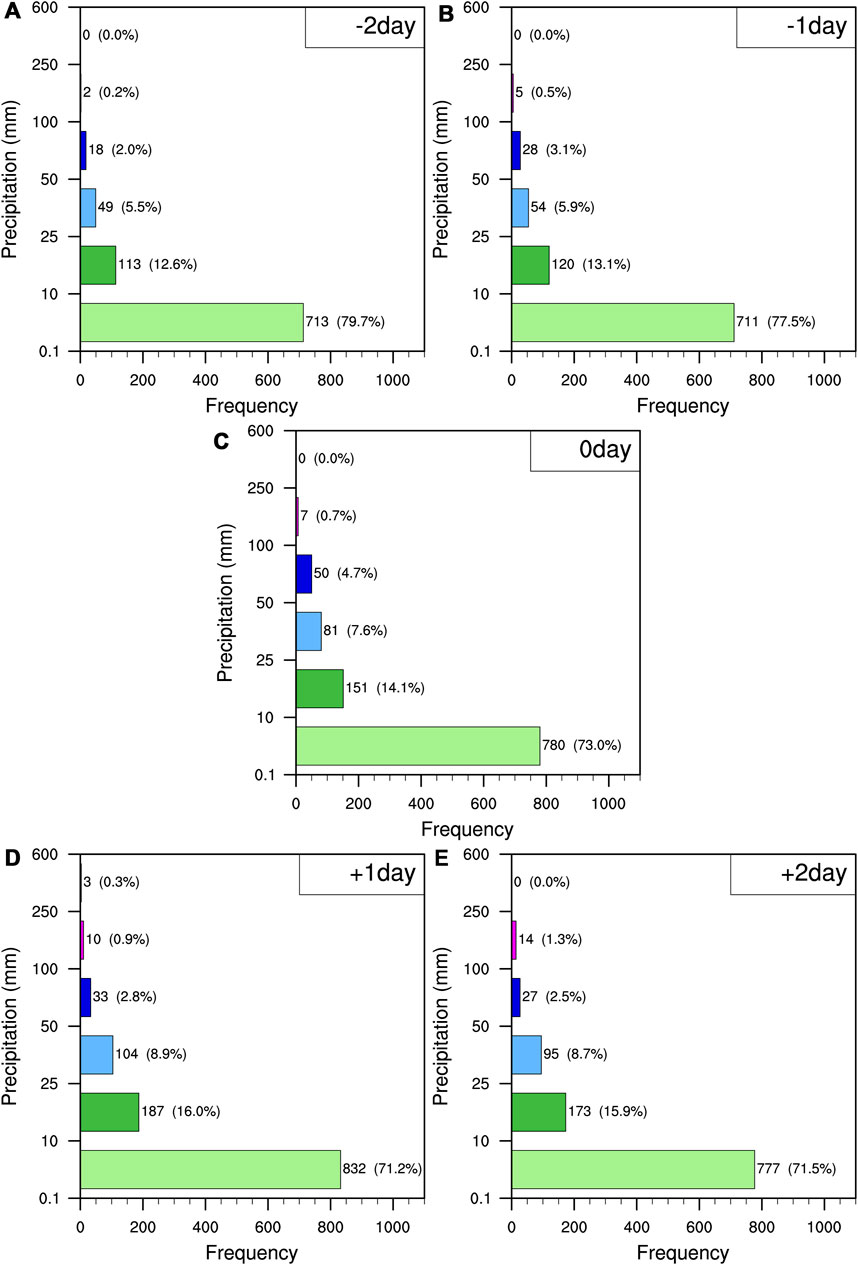
FIGURE 5. Grade of daily precipitation (units: mm) for seismic area rainfall in the influential period.
Spatial Distribution of Precipitation
The spatial distribution of the 5-day accumulated precipitation near the epicenter (Figure 6A) shows that the earthquakes in Taiwan island were accompanied by the heaviest precipitation, with some earthquake events accompanied by daily precipitation ≥250 mm. The highest precipitation in mainland China occurred on the eastern side of the Tibetan Plateau, which is a north–south zone in terms of seismology, and the precipitation had similar features to that over Taiwan Island. Precipitation was highest on the northeast side of the Sichuan basin. The highest cumulative precipitation corresponds well to the steepest terrain along the seismic belt. The steep terrain may strengthen the rainfall associated with earthquakes.
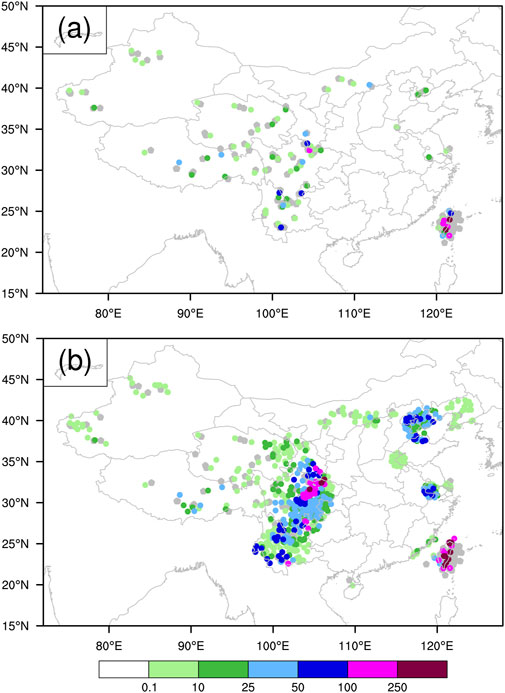
FIGURE 6. Spatial distribution of strong earthquakes (gray dots) in China and the corresponding 5-day accumulated precipitation (colored dots, units: mm) in the influential period (A) near the epicenter and (B) in the seismic area.
Climatological Anomalies in Precipitation Over the Seismic Areas
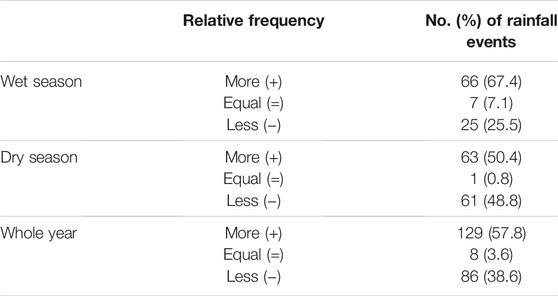
We analyzed the climatological anomalies in precipitation over the seismic area from 1971 to 2000. The climatological state of precipitation was calculated over the seismic area for each strong earthquake and therefore the average precipitation frequency was dependent on the proportion of weather stations within the radius of influence. We then calculated the anomalies in the frequency of precipitation in the year of the earthquake relative to the 30-years average (Table 1).
We compared the rainfall frequency for each of the 223 strong earthquakes in the 49-years study period with the 30-years climatological average. A total of 129 (57.8%) earthquake events had more frequent rainfall and 86 (38.6%) had less frequent rainfall. This means that rainfall was more likely to occur during strong earthquake events (Ms ≥ 6.0) from the perspective of climatological anomalies (Table 1). Furthermore, implied by the wet season and dry season comparison analysis results in Table 1, strong earthquakes in the wet season are more likely to trigger rainfall events than that in the dry season.
Numerical Simulation of Rainfall Associated With the Wenchuan Earthquake
The devastating Ms 8.0 Wenchuan earthquake of May 12, 2008 occurred in a region where the steep terrain of the eastern edge of the Tibetan Plateau is in Sichuan province. The catastrophic earthquake caused enormous economic losses and claimed many human lives (Chen, 2009). The dataset for the seismic area rainfall is based on weather observations. Using the NCEP reanalysis datasets, Shi et al. (2010) confirmed that temperature and precipitation anomalies were present before the earthquake and that the daily anomaly centers were around the epicenter. Based on the observational dataset from 142 automatic rain gauge stations in Sichuan province, Min and Xu (2008) showed that the mean daily air temperature in the most severely affected counties in the seismic area were higher than the 30-years climatological average, except on rainy days.
The land surface temperature is a crucial factor in demonstrating the impact of earthquakes on the Earth’s atmosphere (Zhao et al., 2019). Figure 7 clearly shows a diurnal variation in the surface and 850 hPa temperatures over the seismic area (31–34°N, 103–106°E), with the highest at 06:00 h UTC and the lowest at 00:00 h UTC. The 850 hPa temperature shows a similar variation trend with the surface temperature and both are generally warmer than the 30-years mean. This suggests that the surface of the epicenter and the lower region of the air column are warmer around the time of the earthquake, consistent with previous studies (Min and Xu, 2008; Shi et al., 2010).
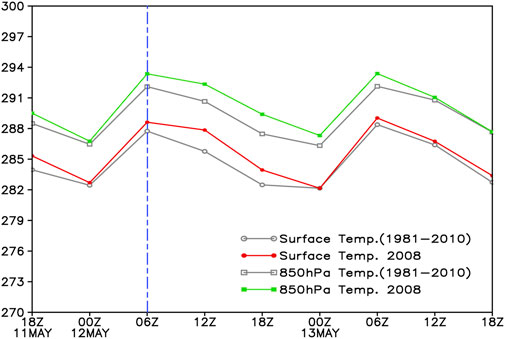
FIGURE 7. Mean distribution of temperature (units: K) in the seismic area around the earthquake. The blue dashed line denotes the occurrence time of the earthquake.
An analysis of the atmospheric circulation field before the earthquake (Figure 8) shows that there is a clear zone of convergence of the water vapor flux over the seismic area 24 h before the earthquake and that this is coordinated with vertical upward motion, which is strongest near the epicenter (Figure 8A). The convergence zone of the water vapor flux and vertical upward motion is maintained and enhanced at the time of the outbreak of the earthquake (Figure 8B). Warming of the ground and lower atmosphere near the epicenter of the earthquake (Figure 7) favors this vertical motion, and convergence of the water vapor enhances the water supply (Figure 8). This leads to rainfall over the epicenter and seismic area. As a result of the lack of real-time observational data over the seismic area and the coarse resolution of the NCEP FNL datasets, this hypothesis needs further verification with a high-resolution numerical simulation.
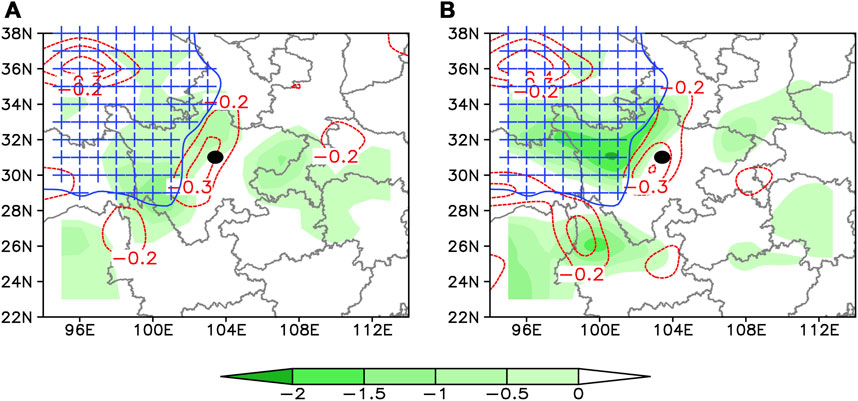
FIGURE 8. Divergence of the water vapor flux (shading, units: 10–8 g hPa−1 cm−2 s−1) and vertical velocity (red dashed lines, units: Pa s−1) at 700 hPa derived from the NCEP FNL datasets for (A) 06:00 UTC on May 11, 2008 and (B) 06:00 UTC on May 12, 2008. The blue plus signs and blue lines indicate the Tibetan Plateau and the black dot is the epicenter of the earthquake.
A comparison of the 48-h accumulated precipitation of the control simulation with the observations (Figure 9) showed that the spatial distribution of the simulated precipitation was consistent with the observations. The model reproduced the area of heavy rainfall with precipitation ≥50 mm near the epicenter, although the modeled range of the strongest precipitation was larger and more dispersed than the observations (Figure 9). This main be caused by the different resolutions of the numerical model and the weather stations besides the initial conditions and model bias. Considering the sparse distribution of weather stations and the errors in the interpolation process, we selected the equitable threat score (ETS), which is commonly used in both operational and research verifications of precipitation, to quantitatively evaluate the simulation results. The definition and calculation formula are as follows (Gandin and Murphy, 1992).
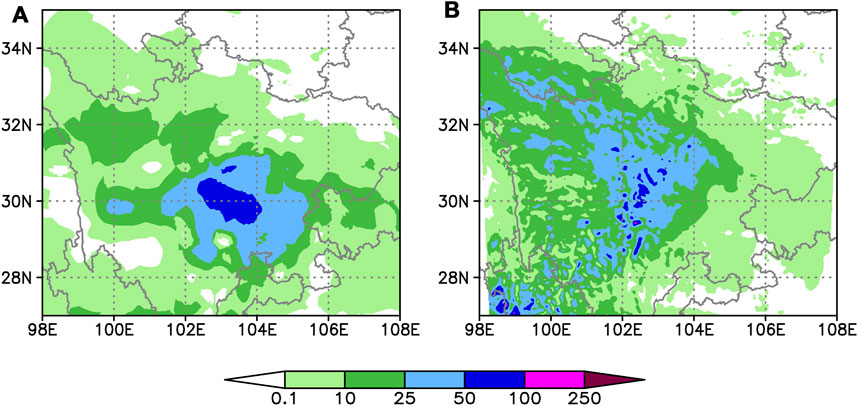
FIGURE 9. The 48-h accumulated precipitation (units: mm) from 00:00 UTC on May 12 to 00:00 UTC on May 14, 2008 for (A) the observations and (B) the control simulation.
The ETS score can eliminate the number impact of statistical stations as threat scores, with its score ranging from −1/3 to one; an ideal ETS score is 1. We used the 1,043 grid within D03 in the calculation and the precipitation was divided into four magnitude groups of 0.1, 10, 25 and 50 mm. The corresponding ETS scores were 0.62, 0.42, 0.25 and 0.17 for precipitation over 0.1, 10, 25 and 50 mm, respectively. This indicates that the model can reasonably simulate precipitation over the seismic region.
We conducted three groups of six sensitive experiments to simulate the impact of abnormal heating arising from earthquakes on rainfall over the seismic area. We changed the surrounding temperature, including the surface skin temperature (TSK), the soil temperature (TSLB; in four layers 10, 30, 60 and 100 cm below the ground surface) and the soil temperature of the lower boundary (TMN; 2 m below the ground surface). The spatial distribution of TSK, TLSB and TMN in the influential period of the earthquake showed that the epicenter corresponded to higher temperatures.
Shi et al. (2010) reported that the climatological anomaly of the daily average air temperature was about 3–5 K around the Wenchuan area on May 12, 2008. The values of TSK, TSLB and TMN in our simulation domain were in the range 259.4–303.6 K, 260.2–306.8 K and 253.6–303.6 K, respectively. To better characterize the heterogeneous impact of the release of geothermal energy on the variation in land surface temperature, we multiplied the original values of TSK, TSLB and TMN in each domain by 0.5, 1.0 and 1.5% as perturbations and then added or subtracted these values from the initial TSK, TSLB and TMN field to generate a new initial field. If the temperature increased or decreased by 1.5%, then the maximum change in temperature was about 4.6 K, which was close to the observational results (Shi et al., 2010). Table 2 gives detailed descriptions of these six experiments.
Figure 10 shows the 48-h accumulated precipitation for the TMP+1.5 and TMP−1.5 sensitivity experiments and their difference between the CTL experiments. Compared with the control simulation (Figure 9B), the range of the torrential rain clearly increased near the epicenter in the TMP+1.5 simulation, whereas it decreased in the TMP−1.5 simulation. There was a similar variation trend in the other four sensitivity experiments (figure omitted). Specifically, after increasing the temperature of TSK, TSLB and TMN, the scope of the torrential rain increased, and vice versa. The higher the temperature, the larger the precipitation range is. The following analyses of the mechanism focus on the TMP+1.5 and TMP−1.5 sensitivity experiments. Not all of the grid points in the whole simulated domain showed the same trend of accumulated precipitation because this is also related to the topography and properties of the land surface (Figures 10A,B), but their influence is negligible (Figures 10C,D).
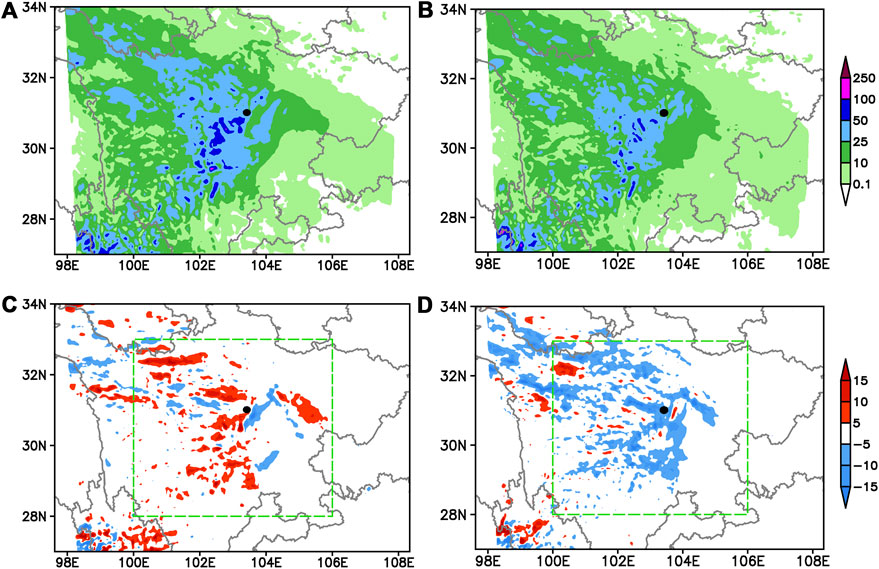
FIGURE 10. The 48-h accumulated precipitation (units: mm) from 00:00 UTC on May 12 to 00:00 UTC on May 14, 2008 for (A) the TMP+1.5 experiment, (B) the TMP−1.5 experiment, (C) the difference between the CTL and TMP+1.5 experiments and (D) the difference between the CTL and TMP−1.5 experiments. The black dots represent the epicenter of the earthquake and the green dashed rectangle represents the area near the epicenter.
The simulated results show that the range of larger sensible heat flux area (>150 W m−2) in TMP+1.5 experiment was significantly increased compared with the control simulation (Figures 11A,B,D), whereas it was significantly decreased in the TMP−1.5 experiment (Figures 11A,C,E). The latent heat flux showed similar variation characteristics (figure omitted). The outbreak of an earthquake can release geothermal energy, which increases the upward transport of the sensible heat and latent heat fluxes from the land surface to the lower troposphere. The simulated wind circulation showed that ascending motion was widely distributed around the epicenter (Figure 12A). Simulations with an increase in temperature from a geothermal heat source could favor ascent around the epicenter of the earthquake (Figure 12B), whereas decreasing temperatures could restrain upward motion and even result in descent over the epicenter (Figure 12C).
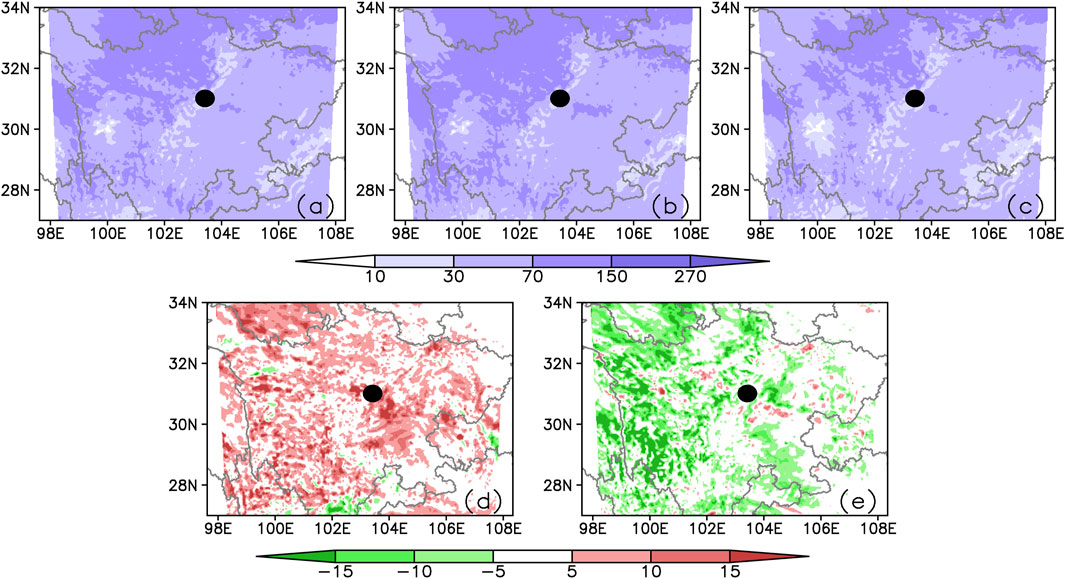
FIGURE 11. The 48-h average surface sensible heat flux (units: W m−2) from 00:00 UTC on May 12 to 00:00 UTC on May 14, 2008 for (A) the CTL experiment, (B) the TMP+1.5 experiment, (C) the TMP−1.5 experiment, (D) the difference between the CTL and TMP+1.5 experiments and (E) the difference between the CTL and TMP−1.5 experiments. The black dot represents the epicenter of the earthquake.
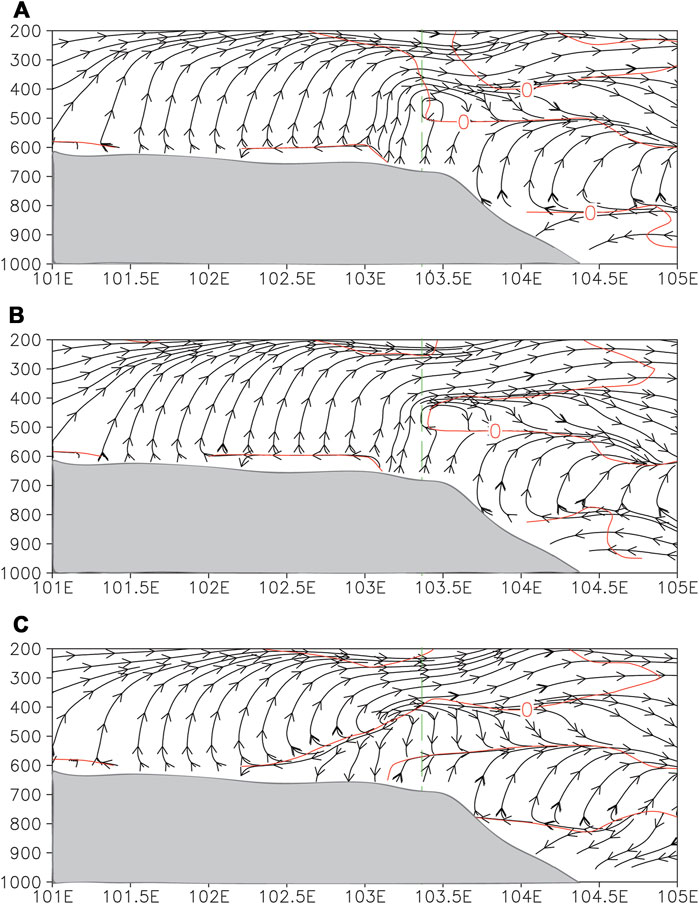
FIGURE 12. West–east-oriented vertical cross-section of the simulated wind circulation (stream, units: m s−1) along the epicenter at latitude 31.01° N for 18:00 UTC on May 12, 2008 for (A) the CTL experiment, (B) the TMP+1.5 experiment and (C) the TMP−1.5 experiment. The green dashed line denotes the epicenter of the earthquake at longitude 103.42° E; the gray shaded area represents the topography and the red solid lines are the contours of zero vertical velocity (units: m s−1).
The water vapor flux divergence field and the vertical velocity at 500 hPa show the area of convergence of the water vapor flux and upward motion (Figures 13A–C) and correspond to the simulated area of heavy precipitation (Figure 10). The warmer temperatures of the ground and lower troposphere favored vertical motion and a stronger moisture flux convergence, increasing rainfall over the seismic area (Figure 10D) and vice versa (Figure 10E).
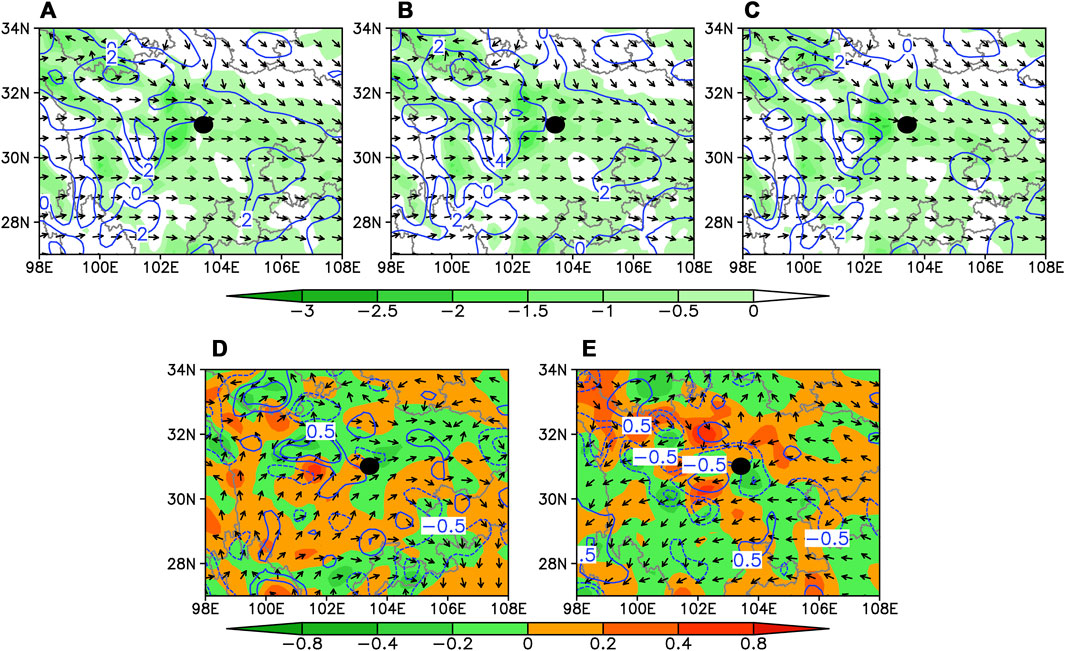
FIGURE 13. The 48-h average water vapor flux (vectors, units: 10–3 g hPa−1 cm−1 s−1), divergence of water vapor flux (shading, units: 10–8 g hPa−1 cm−2 s−1), vertical velocity (blue lines, units: 10–2 m s−1) at 500 hPa from 00:00 UTC on May 12 to 00:00 UTC on May 14, 2008 for (A) the CTL experiment, (B) the TMP+1.5 experiment, (C) the TMP−1.5 experiment, (D) the difference between the CTL and TMP+1.5 experiments and (E) the difference between the CTL and TMP−1.5 experiments. The black dots denote the epicenter of the earthquake.
Conclusions and Future Work
We found that earthquakes may lead to both epicenter and seismic area rainfall. We investigated the daily precipitation during the influential period over the epicenter and seismic area of strong earthquakes (Ms ≥ 6.0). We found that the rainfall over the seismic area within 5 days of an earthquake was closely related to strong earthquake events. A total of 74.9% the earthquake events in China were accompanied by epicenter rainfall and 86.6% by seismic area rainfall. The rainfall had a long duration, with 77.2% the epicenter rainfall and 81.5% of the seismic area rainfall lasting at least 2 days. The precipitation near the epicenter of strong earthquakes and over the seismic area was mainly light rain, although torrential or storm force rain was also seen. Higher cumulative precipitation corresponded well with strong earthquakes occurring in areas with steep terrain or on Taiwan Island. The seismic area rainfall had a higher frequency than the climatological rainfall, especially which associated with earthquakes in the wet season.
Our case study shows that the release of geothermal energy can strengthen the upward transport of the sensible and latent heat fluxes and that ascending motion near the epicenter of earthquakes increases the convergence of the water vapor flux, favoring rainfall over the seismic area. We determined preliminary statistics for the frequency of rainfall in Taiwan and mainland China. It showed that 82.8% of seismic epicenter rainfall and 91.5% of seismic area local rainfall occurs in Taiwan while 67.0% of seismic epicenter rainfall and 81.7% of seismic area local rainfall occurs in mainland China. This could be studied further by considering more sub-regions.
This is an interesting crossover topic between the solid Earth and atmosphere sciences. Further work should be carried out to explore the mechanism for the impact of geothermal outbreaks on local rainfall.
Data Availability Statement
The original contributions presented in the study are included in the article/Supplementary Material, further inquiries can be directed to the corresponding author.
Author Contributions
LC designed the study. DZ analyzed the datasets and generated figures. DZ and LC wrote the paper with contributions from YY.
Funding
This study was supported by the National Science Foundation of China (42175008, 41775048), National Basic Research Program of China (2015CB452804), Huafeng Meteorological Media Group Essential Research Project (CY-J2020002) and the Open Grants of the State Key Laboratory of Severe Weather (2020LASW-B06).
Conflict of Interest
The authors declare that the research was conducted in the absence of any commercial or financial relationships that could be construed as a potential conflict of interest.
Publisher’s Note
All claims expressed in this article are solely those of the authors and do not necessarily represent those of their affiliated organizations, or those of the publisher, the editors and the reviewers. Any product that may be evaluated in this article, or claim that may be made by its manufacturer, is not guaranteed or endorsed by the publisher.
Acknowledgments
The authors thank Researcher Fumin Ren of Chinese Academy of Meteorological Sciences for providing the precipitation data of Taiwan Island.
References
Alvan, H. V., Mansor, S., Omar, H., and Azad, F. H. (2014). Precursory Signals Associated with the 2010 M8.8 Bio-Bio Earthquake (Chile) and the 2010 M7.2 Baja California Earthquake (Mexico). Arab J. Geosci. 7 (11), 4889–4897. doi:10.1007/s12517-013-1117-9
Bhardwaj, A., Singh, S., Sam, L., Joshi, P. K., Bhardwaj, A., Martín-Torres, F. J., et al. (2017). A Review on Remotely Sensed Land Surface Temperature Anomaly as an Earthquake Precursor. Int. J. Appl. Earth Observation Geoinformation 63, 158–166. doi:10.1016/j.jag.2017.08.002
Chen, X. (2009). Preface to the Special Issue on the 2008 Great Wenchuan Earthquake. Earthq Sci. 22, 107–108. doi:10.1007/s11589-009-0107-1
Cui, Yueju., Du, Jianguo., Jing, Feng., and Li, Xinyan. (2016). Mapping Emission of Carbon Bearing Gases from the Satellite Hyperspectral Data in Western Sichuan before and after the 2008 Wenchuan MS 8.0 Earthquake. Acta Seismologica Sinica (in Chinese) 38 (3), 448–457. doi:10.11939/jass.2016.03.012
Gandin, L. S., and Murphy, A. H. (1992). Equitable Skill Scores for Categorical Forecasts. Mon. Wea. Rev. 120, 361–370. doi:10.1175/1520-0493(1992)120<0361:ESSFCF>2.0
Guo, G., and Wang, B. (2008). Cloud Anomaly before Iran Earthquake. Int. J. Remote Sensing 29 (7), 1921–1928. doi:10.1080/01431160701373762
Hainzl, S., Kraft, T., Wassermann, J., Igel, H., and Schmedes, E. (2006). Evidence for Rainfall-Triggered Earthquake Activity. Geophys. Res. Lett. 33, L19303. doi:10.1029/2006GL027642
Hong, S.-Y., Noh, Y., and Dudhia, J. (2006). A New Vertical Diffusion Package with an Explicit Treatment of Entrainment Processes. Mon. Wea. Rev. 134 (9), 2318–2341. doi:10.1175/MWR3199.1
Hong, S. Y., and Lim, J. O. J. (2006). The WRF Single-Moment 6-class Microphysics Scheme (WSM6). J. Korean Meteorol. Soc. 42, 129–151.
Huang, L.-S., McRaney, J., Teng, T.-L., and Prebish, M. (1979). A Preliminary Study on the Relationship between Precipitation and Large Earthquakes in Southern California. PAGEOPH 117, 1286–1300. doi:10.1007/BF00876220
Kain, J. S. (2004). The Kain-Fritsch Convective Parameterization: An Update. J. Appl. Meteorol. 43 (1), 170–181. doi:10.1175/1520-0450(2004)043<0170:TKCPAU>2.0
Kraft, T., Wassermann, J., Schmedes, E., and Igel, H. (2006). Meteorological Triggering of Earthquake Swarms at Mt. Hochstaufen, SE-Germany. Tectonophysics 424, 245–258. doi:10.1016/j.tecto.2006.03.044
Mansouri Daneshvar, M. R., Khosravi, M., and Tavousi, T. (2014). Seismic Triggering of Atmospheric Variables Prior to the Major Earthquakes in the Middle East within a 12-year Time-Period of 2002-2013. Nat. Hazards 74, 1539–1553. doi:10.1007/s11069-014-1266-5
Mansouri Daneshvar, M. R., Tavousi, T., and Khosravi, M. (2015). Atmospheric Blocking Anomalies as the Synoptic Precursors Prior to the Induced Earthquakes: a New Climatic Conceptual Model. Int. J. Environ. Sci. Technol. 12 (5), 1705–1718. doi:10.1007/s13762-014-0731-8
Min, Wenbin., and Xu, Xiaoli. (2008). Primary Analysis of the Variation of Surface Air Temperature before and after Wenchuan Earthquake. Plateau Mountain Meteorology Res. 2, 42–46.
Shi, Jun., Wang, Weixia., and Wen, Jingxia. (2010). The Meteorological Anomalies before and after the Wenchuan Earthquake. Astronomical Res. Tech. 1, 78–84. (in Chinese).
Skamarock, W. C., Klemp, J. B., Dudhia, J., Gill, D. O., Liu, Z., Berner, J., and Huang, X.-Y. (2019). A Description of the Advanced Research WRF Model Version 4.1 (No. NCAR/TN-556+STR). doi:10.5065/1dfh-6p97
Tang, M. C., and Gao, X. Q. (1995). Some Statistic Characters of the thermal Vortex in China from 369 1980 to 1993. II. The Statistic Correlation of the ―thermal Vortex‖ and the Earthquake. Sci. in370 China (Series B) 25 (12), 1313–1319. (in Chinese). doi:10.1360/zb1995-25-12-1313
Wang, Mei., Wang, Qinglin., Yin, Cai., Xu, Changpeng., Zhang, Zhengshuai., and Meng, Jianguo. (2018). Analysis of Microseisms Caused by Storm and Typhoon. Acta Seismologica Sinica 40, 89–97. doi:10.11939/jass.20170112
Keywords: seismic rainfall, epicenter rainfall, geothermal heating, strong earthquake, numerical simulation
Citation: Zhao D, Chen L and Yu Y (2021) Associations Between Strong Earthquakes and Local Rainfall in China. Front. Earth Sci. 9:760497. doi: 10.3389/feart.2021.760497
Received: 18 August 2021; Accepted: 17 September 2021;
Published: 06 October 2021.
Edited by:
Anning Huang, Nanjing University, ChinaReviewed by:
Chujie Gao, Hohai University, ChinaLijuan Wen, Northwest Institute of Eco-Environment and Resources (CAS), China
Shanlei Sun, Nanjing University of Information Science and Technology, China
Copyright © 2021 Zhao, Chen and Yu. This is an open-access article distributed under the terms of the Creative Commons Attribution License (CC BY). The use, distribution or reproduction in other forums is permitted, provided the original author(s) and the copyright owner(s) are credited and that the original publication in this journal is cited, in accordance with accepted academic practice. No use, distribution or reproduction is permitted which does not comply with these terms.
*Correspondence: Lianshou Chen, Y2hlbmxzQGNtYS5nb3YuY24=
 Dajun Zhao
 Lianshou Chen1*