 Dingxue Zhang
 Yunfei Liu2
- 1Petroleum Engineering College, Yangtze University, Wuhan, China
- 2Petrochina Changqing Oilfield Company Oil Production Plant No.5, Xi’an, China
- 3No.4 Drilling Engineering Branch Company,CNPC Bohai Drilling Engineering Company Limited, Renqiu, China
Continental tight sandstone oil reservoirs have strong heterogeneity, and staged fracturing technology of horizontal well is a crucial measure for successful development of oil and gas. In this study, the fracturing effect of horizontal wells in tight oil reservoirs of Yanchang Formation in the western Ordos Basin was systematically studied using the rock mechanics, array acoustic and microseismic testing data and the staged fracturing technology. The hydraulic fracturing method was used to calculate the horizontal principal stress difference (σH-σh). It showed that as the buried depth increases, σH-σh tends to decrease first and then increase. Small-scale fracturing should be used for areas with smaller σH-σh values. Fracturing construction parameters have an impact on oil production capacity, which is mainly manifested in that the usage of prepad fluid, sand-carrying fluid and proppant is proportional to productivity. Excessive displacement and construction scale should not be used in the fracturing process, and the fracture height of the target layer should be strictly controlled within the range of 26 m. The analysis of the “rupture points” in the fracturing curves shows that wells with relatively obvious rupture points usually have a higher oil production capacity. These wells have a good fracturing effect and an effective fracture network was formed in the tight oil reservoir. The optimization simulation results of the horizontal well pattern form show that the seven-point combined well pattern is the best well pattern, which is suitable for the development of tight oil sandstone in the Yanchang Formation.
Introduction
Continental tight sandstone reservoir is a “hot spot” field for increasing oil and gas reserves and production capacity in the future (Chitrala et al., 2013; Bhatti et al., 2020; Hong et al., 2020; Abouzar and Ghanbarian., 2021). Strongly heterogeneous continental tight sandstones have a complex geological structure with frequently interbeded sandstones and mudstones (Eyal et al., 2001; Hong et al., 2020; Abouzar and Ghanbarian., 2021). The change of stress during fracturing and the evolution of fracturing fractures are the most important research content for the staged fracturing of horizontal wells in tight sandstone oil reservoirs (Du and Aydin., 1993; Gurocak et al., 2012; Dong et al., 2020).
Generally, compared with vertical wells, horizontal wells can expose the reservoir to a greater extent and can ultimately increase the oil recovery rate of the entire reservoir significantly (Jaeger and Cook., 1976; Kang et al., 2010; Huang et al., 2019; Jiang et al., 2019; He et al., 2020). Staged horizontal well fracturing was first proposed in 1985, and subsequently achieved great success in Danish and Valhall oil fields (Fan, 2010; He et al., 2015; Li et al., 2020). Fractured horizontal wells will produce a series of fracture networks including transverse fractures, axial fractures and horizontal fractures. The effect of hydraulic fracturing of horizontal wells is controlled by the geostress state in the tight oil reservoir and the fracturing construction measures (Li and Zhang, 1997; Liu et al., 2015; Lommatzsch et al., 2015; Li et al., 2018; Luo et al., 2018).
The sedimentary evolution of the Yanchang Formation in the Ordos Basin was a complete sedimentary cycle record from the formation, development, and extinction of the continental lake basin (Zhang et al., 2017; Zhao et al., 2017; Luo et al., 2019). According to the sedimentary characteristics, the Yanchang Formation oil layers were divided into 10 oil sub-layers (or Members), and the target layers in this study are the Chang 6, Chang 7 and Chang 8 oil layer groups. In this paper, the fracturing effect of horizontal wells in tight oil reservoirs of the Yanchang Formation was systematically studied using the rock mechanics, array acoustic and microseismic testing data, and the staged fracturing technology. This study can provide a reference for improving the volume fracturing effect of tight sandstone oil reservoirs.
Databases and Methods
Geological Background
The study area is located in Block L in the west of the Ordos Basin. The overall structural morphology of this area is a western-leaning monoclinic which belongs to the western Ordos Basin, and the structural fluctuation per kilometer is less than 20 m. Some low-amplitude structures (or nose-like uplifts) are mainly locally developed with ranges between 1 and 10 km2. The target layer is a typical continental river sediment, and its sedimentary microfacies include distributary channels and bays between channels. The lithology of the target sandstone is mainly feldspar sandstone, and the percentage of feldspar is generally greater than 50%.
Intergranular pore is the pore type with the largest proportion in the target layer (Figure 1). For other types of pores, such as feldspar dissolution pores, intergranular dissolution pores, cement dissolution pores and microfractures, they also account for a certain proportion in the target layers (Figure 1). The intergranular pores in the target layer are absolutely dominant, and most of them have irregular triangular, quadrilateral or polygonal pore structures (Figures 1A,D). Porous cementation can occur inside the intergranular pores of the rock.
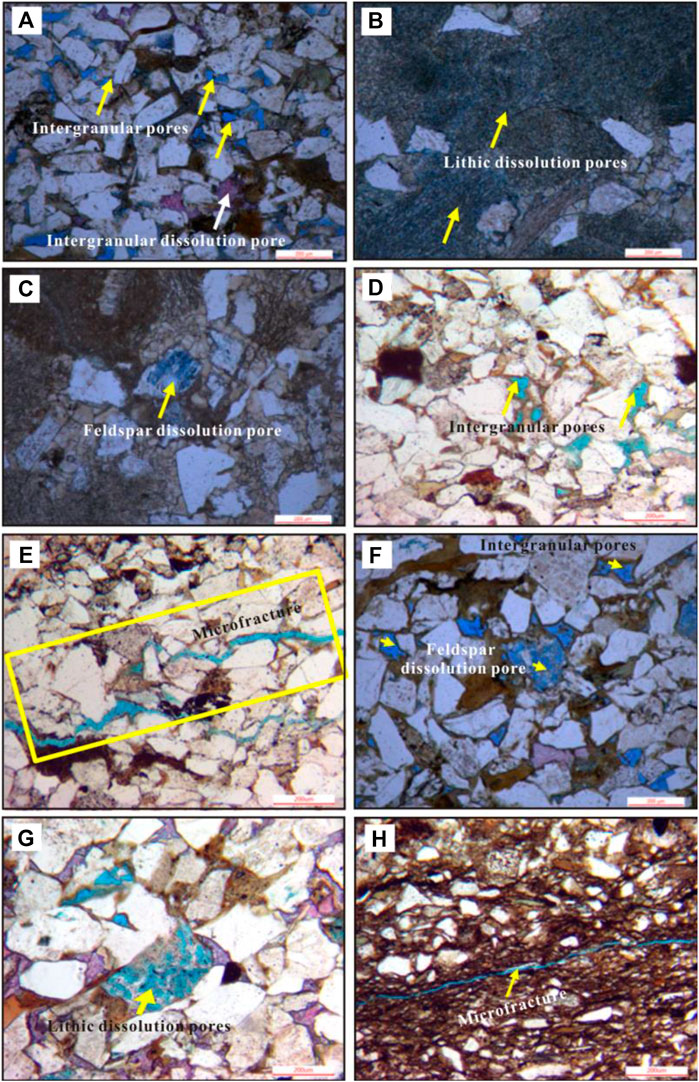
FIGURE 1. Microscopic images of tight sandstone samples collected from the target layer. Notes: (A) Well Y4, 1 731.46 m, intergranular pores, Chang 6 Member; (B) Well Y6, 1 839.71 m, lithic dissolution pores, Chang 6 Member; (C) Well Y6, 1 839.71 m, feldspar dissolution pores, Chang 6 Member; (D) Well F6, 1 857.87 m, intergranular pores, Chang 7 Member; (E) Well F6, 1 857.87 m, microfractures, Chang 7 Member; (F) Well DT4, 2 212.99 m, intergranular pores and feldspar dissolution pores, Chang 8 Member; (G) Well DT4, 2 213.00 m, lithic dissolution pores, Chang 8 Member; (H) Well DT4, 2 244.80 m, microfractures, Chang 8 Member.
The dissolution pores in the target layer in this area are mainly distributed in feldspar, cement and rock debris components (Figures 1B,C,F,G). Observations under the microscope showed that, the diameter of dissolution pores in the target layer is generally less than 10 μm. The size of dissolution pores is related to mineral and fluids components. In addition, the microfractures in the target layer (Figures 1E,H) improved the connectivity between the pores. The ranges of porosity and permeability of the target layer are distributed between 5 and 12% and 0.01–1.5 mD, respectively.
Rock Mechanics and Acoustics Experiments
The rock mechanics and acoustics experiments were completed by the rock physics testing system of the Beijing SGS Experimental Testing Center. There are 10 groups of rock mechanics test samples, and each group contains four samples. The samples are small cylinders with a diameter of 2.5 cm and a height of 5 cm. The applied confining pressures were 0, 10, 20 and 35 MPa respectively. Moreover, the acoustic experiment results include longitudinal and transverse wave velocities obtained under the confining pressure of 35 MPa. All samples were saturated with formation brine. The stress error of the rock physics testing system was less than 1%, and the systematic error of the displacement was less than 0.000 1 mm.
Full Wave Array Acoustic Wave Tests
The full wave array acoustic wave test was completed by the North China Branch of PetroChina Logging Co., Ltd. The full wave array acoustic logging can measure the full wave array information of the strata. In particular, it can obtain high-quality transverse wave data. Acoustic test results are calibrated on the LEAD Software Platform with the completion natural gamma curve as the reference curve.
Staged Fracturing Technology
In this paper, the hydraulic fracturing data was used to conduct geostress calculation of the Chang 6 to Chang 8 Members (McBride, 1989; Nelson et al., 2005; Mahmoodi et al., 2019). Generally, only the in-situ stresses determined by the differential strain experiments or the hydraulic fracturing tests are the most reliable (Nelson et al., 2005). The fracturing construction of horizontal wells of the target layers adopts the staged fracturing technology of hydraulic sandblasting perforation + annulus sand addition. This technology can increase the scale and volume of sand body reconstruction, and improve the supporting capacity and flow conductivity of hydraulic fractures. In addition, slippery water and GUAR gum fracturing fluid were used to complete the fracturing of the reservoir. This fracturing method uses slippery water to make artificial fractures fully communicate with natural fractures. Moreover, the subsequent sand-carrying method ensures the maintenance of the flow conductivity of fractures.
The proppant type was selected according to the closure pressure of the individual wells. Closure pressure refers to the effective stress acting on the proppant. The bottom-hole production pressure of the oil wells is generally very low in the later stages of production. Therefore, the absolute value of the closure pressure is adopted as the criterion for proppant preference. The closure pressure of the target layer is mainly distributed in 15–20 MPa. Therefore, we use low-density, low-strength ceramsite (or quartz sand) as the proppant to ensure that the fractures have sufficient supporting capacity and fluid conductivity.
Fracturing Monitoring Technology
In this paper, a microseismic detection system was adopted to monitor artificial fractures. Microseismic observation stations are distributed around the fractured wells centered on the fractured zone. The microseismic observation station can monitor and map the shape, orientation, height and occurrence of artificial fractures on site. In addition, continuous real-time monitoring was used to map the fracture network formed in the sand body.
Coupling Simulation of Well Pattern and Fracturing
The development of horizontal wells in the study area includes combined well patterns and pure horizontal well patterns. Through numerical simulation, the coupling effect of horizontal well patterns and fracturing has been optimized. The mechanism model was established with a 10 m × 10 m grid. The combined pattern of horizontal and vertical wells and the pattern of pure horizontal wells were constructed separately. The three-dimensional two-phase black oil model in Eclipse was used to analyze the productivity changes of different types of well patterns. Eclipse reservoir simulation software is an integrated simulation software that integrates the main simulation calculation model with its pre- and post-processing functions. In addition, it was used to build a grid model that meets the characteristics of actual reservoir development by matching the production history of actual wells.
Results
Logging Interpretation of Rock Mechanics Parameters
The full-wave array acoustic wave tests were conducted in wells Y4 and D4 in the study area, and reliable longitudinal and transverse wave velocity data were obtained for the Chang 6 to Chang 8 Members. The fitting results show that there was a linear positive correlation between the longitudinal and transverse wave time differences (Figure 2). Therefore, the shear wave time difference of rocks in wells that have not been subjected to full-wave array sonic logging can be predicted using the fitting formula in Figure 2.
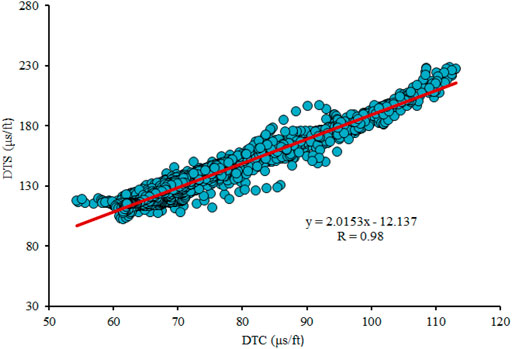
FIGURE 2. Relationship between longitudinal and transverse wave time differences obtained by the full-wave array acoustic wave tests. DTC- longitudinal wave time difference; DTS- transverse wave time difference.
Based on the calculation formula extraction results of shear wave time difference and the following physical equations (Eqs 1–2), the dynamic Young’s modulus and Poisson’s ratio of formation rock can be obtained.
Where Ed is the dynamic Young’s modulus calculated based on acoustic data, GPa; Δtp and Δts are the longitudinal and transverse wave time differences, μs·ft−1; ρb is the rock bulk density, g•cm−3.
The dynamic and static elastic parameters of different kinds of rocks are different. The dynamic parameters are calculated through acoustic wave parameters, while the static parameters are directly obtained through mechanical tests (Salamon, 1984; Peng et al., 2018). Therefore, the static elastic parameters are more in line with engineering construction requirements. The difference between dynamic and static elastic parameters is related to factors such as microfractures, pore fluids, mineral components and microfabric differences in the rock. The dynamic elastic parameter value are generally greater than the static elastic parameter value. Figure 3 shows the quantitative conversion relationship between the static and dynamic mechanical parameters based on the triaxial rock mechanics tests. The fitting formulas in Figure 3 were used for logging interpretation of Young’s modulus and Poisson’s ratio of all single wells.
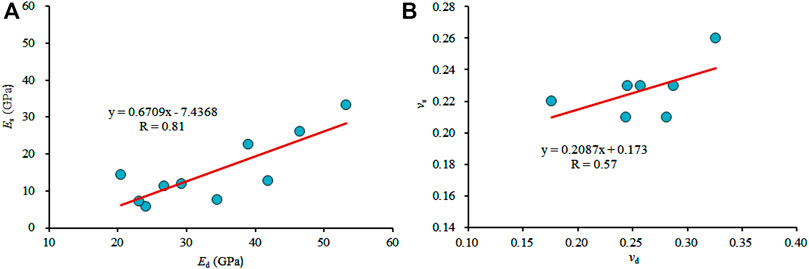
FIGURE 3. Correlation between dynamic and static rock mechanics parameters of the target layer. Ed, Es, νd and νs are dynamic and static Young’s modulus, and dynamic and static Poisson’s ratios, respectively.
In-situ Stress Calculation Using Hydraulic Fracturing Data
High pressure fluid is injected into the underground rock during the fracturing process. Then, the fracture pressure (Pf) of the rock can be obtained directly from the pressure curve in the first fracturing stage. According to the basic principle of hydraulic fracturing, the closure pressure (Pc) equals to the minimum horizontal stress (σh) (Fan, 2010; Kang et al., 2010; Jiang et al., 2019). Before the fracture is closed, the fracturing fluid will spontaneously percolate into the surrounding formation. According to the pressure drop curve data, the fracture closure pressure (Pc) can be obtained using FracproPT Software.
For the calculation of maximum horizontal principal stress (σH), the following formula was adopted: σH = 3σh-Pf-Pp+σt. Where Pf is the fracture pressure; Pp is the formation pressure. From top to bottom, the formation pressure coefficients of the Chang 6, Chang 7 and Chang 8 Members in the study area are 0.73, 0.74 and 0.75, respectively. σt represents the tensile strength, which is 10% of the compressive strength of the formation rock.
Figure 4 shows the variation characteristics of the three principal stresses with buried depth. As the buried depth increases, the stress values of all stresses show an increasing trend. Meanwhile, the principal stresses satisfy: σv>σH>σh (where σH, σh and σv are maximum, minimum, and vertical stresses respectively). This shows that the present-day in-situ geostresses of the Chang 6 to Chang 8 Members basically present a relatively relaxed normal stress environment.
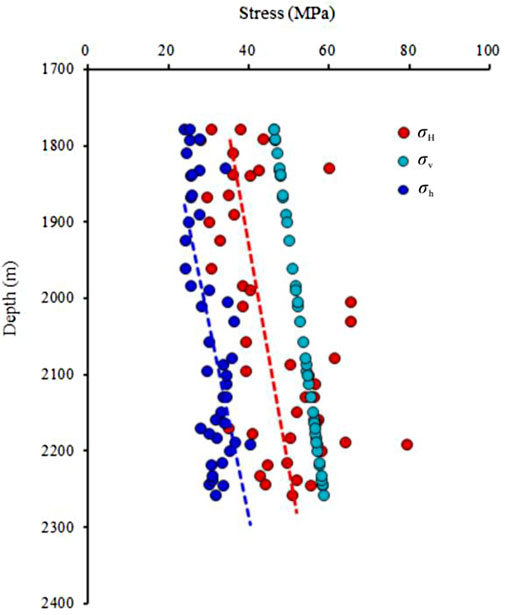
FIGURE 4. The vertical distribution characteristics of each principal in-situ stress in the target layer of the study area.
Hydraulic Fracturing Construction Parameters and Productivity
Volume fracturing is the main form of reservoir reconstruction and obtaining commercial production capacity. It requires water of sand proppant and chemicals to be poured into the reservoir to crush the formation and form a complex fracture network. After fracturing, a new fluid channel can be produced between the oil layer and the wellbore, and the oil production capacity will increase substantially.
The fracturing measures of the target layers adopts multi-cluster, staged sand fracturing. Figure 5 shows the corrections among the amount of prepad fluid, sand-carrying fluid, proppant and oil production capacity.
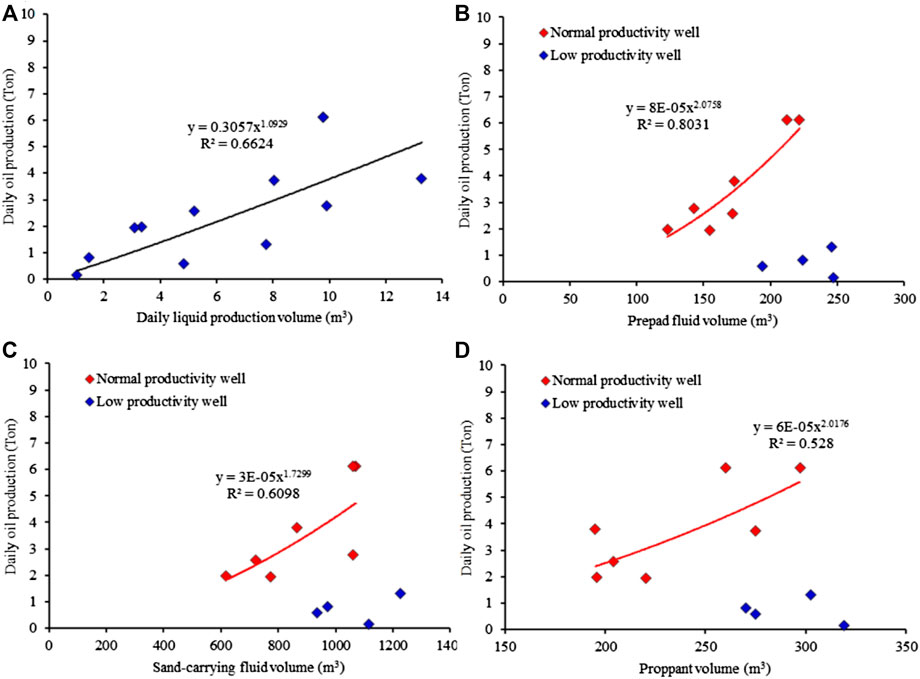
FIGURE 5. Relationship between fracturing parameters and productivity.
A well positive correlation is presented between the daily oil production capacity and the daily fluid production capacity of all single wells in Figure 5A. It could be found that the greater the liquid production capacity, the better the oil production capacity. The production wells were divided into two categories according to their oil production capacities. Wells with a single well daily productivity greater than 2 tons were “normal productivity wells,” and wells with a single well daily productivity less than 2 tons were “low-productivity wells.” Low-yield wells cannot reach a commercial oil production capacity.
According to Figure 5B, the amount of prepad fluid is positively correlated with oil production capacity. That is, as the amount of prepad fluid used increases, the production capacity increases. For low-yield wells, the use of prepad fluid has a poor correlation with productivity (Figure 5B). That is, as the amount of prepad fluid used changes, its production capacity is basically unchanged.
Similarly, a well positive correlation is presented between the amount of sand-carrying fluid and the productivity of wells with relatively high productivity (Figure 5C). That is, with the increase in the amount of sand-carrying liquid, the production capacity gradually increases. However, as the amount of sand-carrying fluid used in low-yield wells changes, the productivity is basically unchanged (Figure 5C).
As shown in Figure 5D, the proppant usage amount is positively correlated with the oil production capacity. However, for low-yield wells, there is no obvious correlation between them (Figure 5D).
It can be seen from the above analysis that the fracturing construction parameters have an apparent influence on the oil production capacity. The usage of prepad fluid, sand-carrying fluid and proppant is proportional to oil production capacity. However, the correlation between the total liquid volume entering the formation and the daily oil production is not obvious, indicating that it is not a higher fracturing scale will bring a higher production capacity. In the fracturing process, the scale of fracturing construction should be controlled reasonably by controlling the usage of prepad fluid, sand-carrying fluid and proppant.
Discussion
Horizontal Principal Stress Difference (σH-σh)
σH-σh is considered to be one of the key parameters affecting the fracturing effect of tight reservoirs (Fan, 2010). The varition characteristics of σH-σh of the target layer with depth are shown in Figure 6. It could be found that, as the buried depth increases, σH-σh first decreases and then increases. Therefore, there is a “turning point” for the stress difference, and the turning point of the stress difference is about 2,000 m (Figure 6). When the rock is at a shallow depth, the larger stress difference is related to the strong crustal activity. Furthermore, as the buried depth increases, the degree of rock compaction gradually increases, and the stress difference gradually decreases as well. When the depth exceeds 2,000 m, the compaction effect is not so significant. At this time, the brittle rock gradually transforms into a rock with strong plasticity. Thus the stress anisotropy will increase significantly, and the stress difference continue to increase (Figure 6).
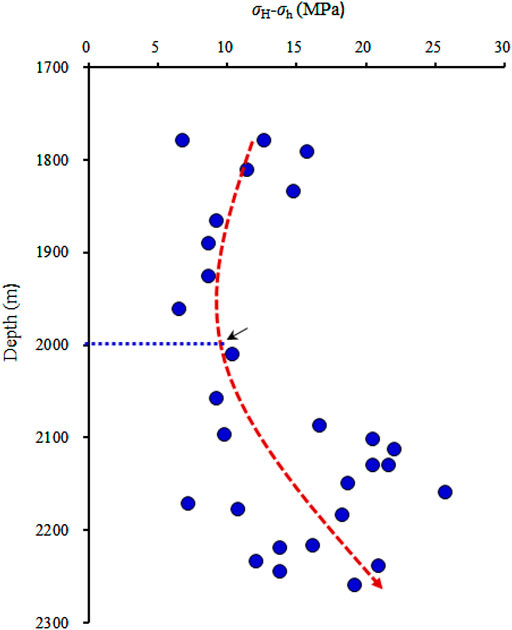
FIGURE 6. Variation characteristics of horizontal principal stress difference with depth in the target layer.
Tight reservoir fracturing measures can be divided into two types, namely small-scale fracturing and large-scale reservoir reconstruction fracturing. Small-scale fracturing generally selects small fluid volume, small displacement and low sanding strength; while large-scale fracturing usually uses large fluid volume, large displacement and high sanding strength. Generally, for areas with high σH-σh values, artificial fractures may easily penetrate the sand layer, thereby affecting the effect of oil and gas development. Therefore, small-scale fracturing should be used in such areas. An appropriate fracturing scale is more conducive to the reconstruction of thin sand body reservoirs with strong heterogeneity.
Microseismic Monitoring Analysis
The microseismic monitoring system was adopted to monitor the fracturing process of Well X4-1. Figure 7 shows the distribution characteristics of fracturing detection points and artificial fractures. The bullseye positions are calculated based on the well coordinates. Then, with the bullseye as the center, 6 monitoring sub-stations are arranged around, and GPS is used for positioning measurement (Figure 7A).
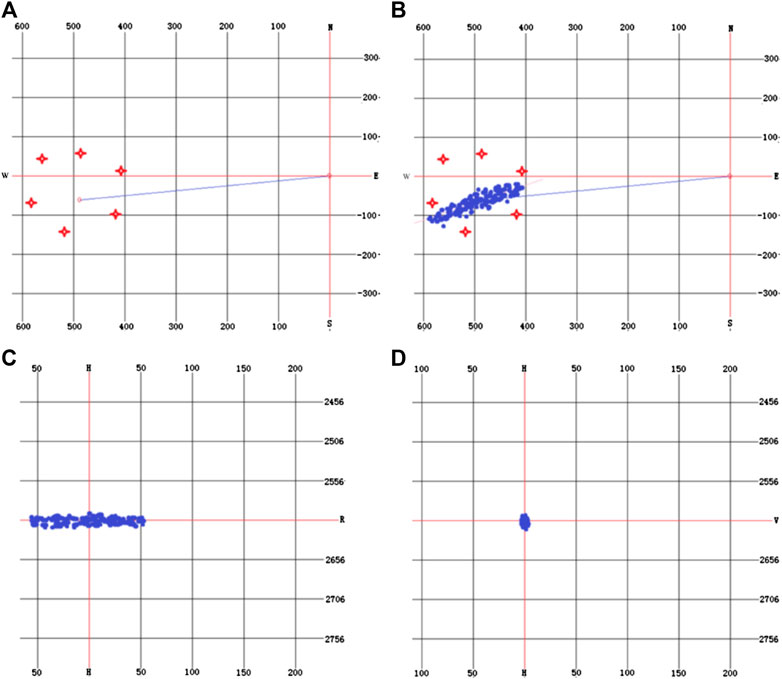
FIGURE 7. Microseismic fracture detection in Well X4-1. Notes: (A) Distribution of monitoring stations around the well; (B) Fracture orientation; (C) Fracture length; (D) Fracture occurrence.
From the fracture detection results, the hydraulic fracture in Well X4-1 is an approximately straight main vertical fracture, and the fracture orientation is NE65° (Figure 7B). The hydraulic fracture is a vertical fracture with two basically symmetrical wings, and its long axis is 114 m long (Figure 7C). The east wing is 54 m long, the west wing is 60 m long, and the fracture height is 15 m (Figure 7D).
Since the two wings of the main hydraulic fracture are relatively balanced, it shows that the target layer is relatively homogeneous, and the development of natural fractures in the target layer is not high. This is consistent with the observation results of core fractures. According to the observation results of fractures in the 196 m cores from 10 wells in the study area, high-angle near-vertical shear fractures (Figure 8A) and tensile fractures (Figure 8B) were mainly developed in cores. Shear fractures have the highest degree of development, and the fracture surface is straight and scratches are common. The density of core fractures in the target layers is generally distributed whthin the range of 0.2 strips/m. When artificial fractures encounter natural fractures, the extension direction of the main artificial factures may be deflected, thereby inducing secondary fractures and finally forming a complex fracture network (Salamon, 1984).
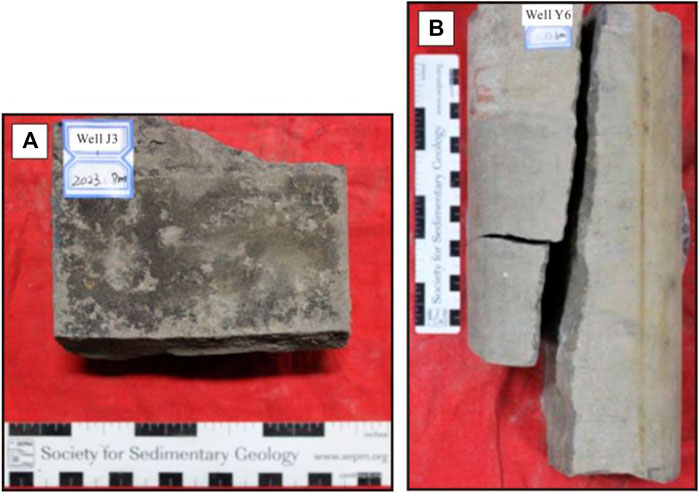
FIGURE 8. Developmental characteristics of core fractures in the target layers. Notes: (A) High-angle shear fracture (Well J3, Chang 8 Member); (B) High-angle tensile fracture (Well Y6, Chang 6 Member).
Analysis of Hydraulic Fracture Parameters
In this paper, FracproPT Software was used for fracturing simulation. We completed the fracturing analysis in the “Fracture Analysis” module. First, we take X1 horizontal well as an example to illustrate the setting of fracturing parameters. The target layer of the X1 well was reconstructed by hydraulic sandblasting tubing with sand adding staged single cluster fracturing. The horizontal fracturing interval was divided into 7 segments, each of which contains 2 clusters. Based on the log interpretation results of rock mechanic parameters, it can be obtained that the Young’s modulus of the target sandstone layer in X1 well was 25 GPa, and the Poisson’s ratio was 0.23; while the Young’s modulus of the roof and floor mudstone layers in X1 well was 15 GPa, and the Poisson’s ratio was 0.28. The total amount of liquid injected into the ground in the first interval of the target layer was 150 m3, the total sand addition was 20 m3, the average sand ratio was 24%, the tubing injection displacement was 1.8 m3/min, and the annulus injection displacement was 0.5 m3/min. Finally, the simulated artificial fracture morphology of the first interval in the target zone of Well X1 is obtained, which is shown in Figure 9.
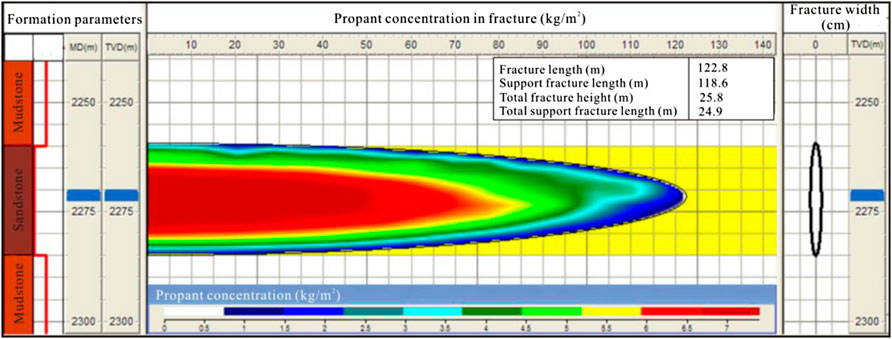
FIGURE 9. Fracture morphology of the first fracturing segment in the target zone of Well X1.
The artificial fracture parameters obtained by the fracturing simulation are shown in Table 1. The half-lengths of the supporting fractures of the wells are mainly distributed from 108.5 to 141.6 m, with an average value of 119.5 m; the fracture heights are mainly distributed from 20.2 to 38.2 m, with an average value of 25.5 m; the hydraulic fracture widths are mainly distributed from 0.48 to 1.09 cm, with an average value of 0.60 cm. The microseismic artificial fracture detection results of Well X1 show that the fracture half-fracture length is 115 m, and the fracture height is 26 m. Therefore, the artificial fracture simulation results are consistent with the measured results.
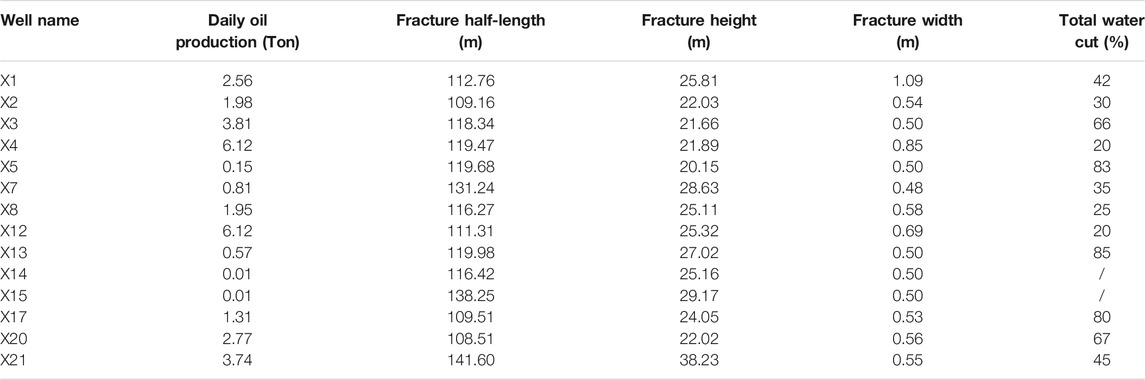
TABLE 1. Numerical simulation results of various fracture parameters in fractured horizontal wells.
Comparing the artificial fracture parameters and the productivity of a single well, it can be seen that there is no significant correlation between fracture half-length, fracture width and productivity (Figures 10A,B). However, it can be seen that when the artificial fracture height of a fractured well is greater than 26 m, it corresponds to a low-productivity well (Figure 10C). This shows that excessive displacement and construction scale should not be used in the fracturing process, and the fracture height should be strictly controlled. Although the increase in fracture height can increase the volume of reservoir reconstruction to a certain extent, an excessively high fracture height will also lead to the opening of migration channels between the reservoir and the overlying strata. When the reservoir is connected to the overburden caps or the adjacent water layers, it may cause the escape of oil and gas or the occurrence of flooding of the reservoir. From Figure 10C, it can be seen that the fracture heights of normal productivity wells are all distributed between 20 and 26 m.
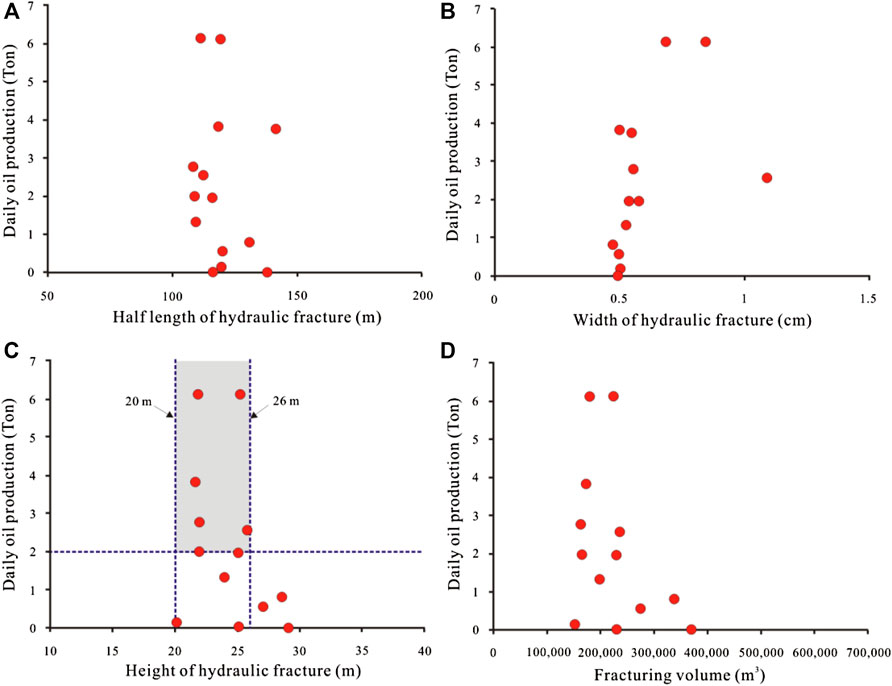
FIGURE 10. Relationship between fracture parameters and productivity of fractured wells.
The relationship between the reformed reservoir volume of fractured horizontal wells and the daily oil production capacity is shown in Figure 10D. It can be seen that there is no significant correlation between them. This also shows that the productivity or fracturing effect of tight oil reservoirs is not only controlled by the scale of fracturing volume. An excessively large fracturing scale does not necessarily help increase production capacity. The formulation of reasonable fracturing measures is crucial to improve the development effect of tight sandstone oil reservoirs.
Rupture Point
The fracturing construction curves are used to identify the significance of the “rupture point” in the fracturing segments (Shuai et al., 2013; Wu et al., 2017; Santosh, and Feng., 2020; Yoshida and Santosh., 2020). The “rupture point” corresponds to the point where the oil pressure rises and drops sharply during the first fracturing process (Zou et al., 2013; Zhao et al., 2020). Therefore, it could be seen that the rupture point in Figure 11A is obvious, but there is no rupture point in the fracturing curve of Figure 11B. In addition, for the situation where the oil pressure curve rises sharply and then slowly drops, we believe that its “rupture point” is “not obvious” or “relatively obvious.” From the identification results (Table 2), there are a total of 7 wells without obvious rupture points, of which 42.9% of the wells have reached an ideal productivity, and 57.1% of the wells are low-yield wells. For wells without obvious rupture points, the formation may not be pressed open or there may be natural fractures in the formation. If natural fractures are developed in the formation rocks, fractured horizontal wells can also obtain a higher oil production capacity.
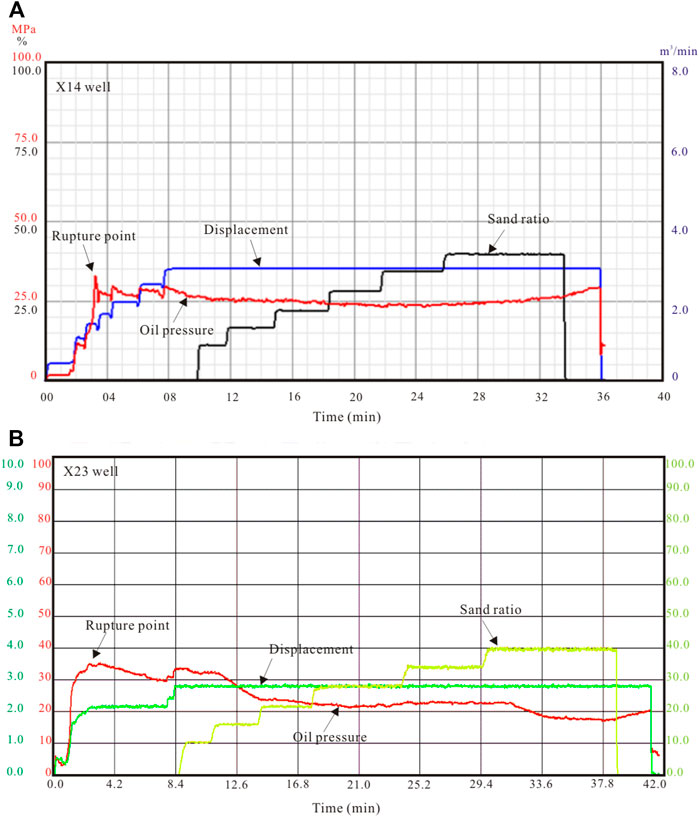
FIGURE 11. Fracturing construction curves of X14 and X23 wells.
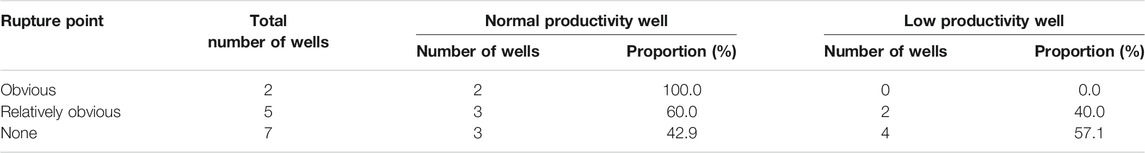
TABLE 2. Statistical results of the obviousness of rupture points in fractured horizontal wells.
There are a total of two wells with the most obvious rupture points, both of which have reached high productivity (Table 2). The fracturing effect of this type of well is good. The reservoir has been well reformed to form a good and complex fracture network. So this type of well is easy to form a higher productivity. For the wells with relatively obvious rupture points, there are a total of five wells. Among them, 60% of the wells have reached the ideal productivity, while 40% of the wells are low-productivity wells (Table 2). These wells have a relatively poor fracturing effect, but high productivity can still be obtained under better oil-bearing conditions.
Coupling Simulation of Well Pattern and Fracturing
Horizontal well pattern and fracturing simulation needs to first construct a production dynamic model in Ecilpse Software, that is, dynamic parameters (fracturing operation history and production history) are input into Ecilpse software system. The system will automatically generate a “stream file” associated with time, which is the production dynamic model. In this study, when performing reservoir numerical simulation productivity fitting, the fitting error is controlled within 2%. The basic parameters of the Yanchang Formation oil layer in the study area are: the original formation pressure is 11 MPa, and the crude oil viscosity is 1.682 mPa s, the comprehensive compressibility is 15.7 × 10⁻⁴ MPa−1, and the formation crude oil density is 1.213 g/cm3.
At present, the development pattern of horizontal wells in the study area is mainly composed of pure horizontal well patterns and combined vertical and horizontal well patterns. Horizontal well patterns seldom consider water injection. Pure horizontal well patterns mainly include five-point well pattern and parallel well pattern; combined well patterns mainly include joint five-point well pattern and joint seven-point well pattern.
The azimuth of the horizontal section is perpendicular to the principal stress direction. Therefore, well pattern research mainly considers the following methods, parallel well patterns and five-point well patterns of pure horizontal wells; joint five-point well patterns and joint seven-point well patterns of combined well patterns (Figure 12).
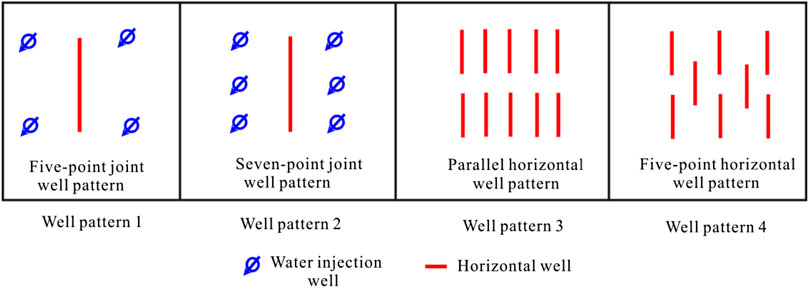
FIGURE 12. Design of different injection and production well patterns.
The simulation results of the cumulative oil production capacity of different types of well patterns are shown in Figure 13. It can be seen from the simulation results that after 30 years of cumulative production, the cumulative oil production of horizontal wells in well pattern two is higher than other well patterns, reaching 33,000 t, followed by well pattern 1, with a cumulative oil production of 22,000 t. Pure horizontal well patterns (pattern three and pattern 4) have high initial production and a rapid increase in cumulative oil production, but in the later stage, due to serious formation energy deficits, daily oil production declines greatly. The cumulative oil production of well pattern three and well pattern four is close, both are about 20,000 t.
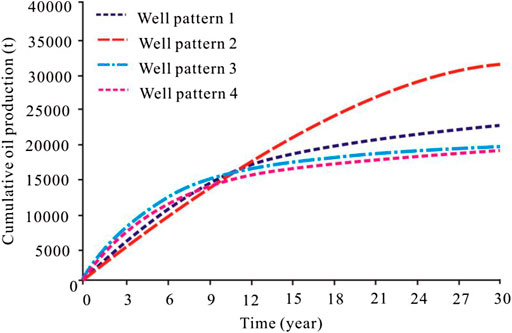
FIGURE 13. Changes in cumulative oil production of different injection-production well patterns.
Comprehensive comparison shows that the seven-point joint well pattern (well pattern 2) is the best well pattern. The other three types of well patterns have high initial productivity, but the decline in productivity is significantly faster than well pattern 2. This means that well pattern 2 has a longer stable production period and higher cumulative oil production. On the whole, the simulation results are consistent with the actual production conditions of the oilfield, and the seven-point joint well pattern is more suitable for the development of tight oil sandstones in the Yanchang Formation.
Conclusion
1) In this paper, the fracturing effect of horizontal wells in tight sandstone oil reservoirs of the Yanchang Formation was systematically studied using the rock mechanics, array acoustic and microseismic testing data, and the staged fracturing technology.
2) The hydraulic fracturing method is used to calculate the horizontal principal stress difference (σH-σh). It shows that as the buried depth increases, σH-σh tends to decrease first and then increase. Small-scale fracturing should be used for areas with smaller σH-σh.
3) Fracturing construction parameters have a certain impact on productivity, which is mainly manifested in that the usage of prepad fluid, sand-carrying fluid and proppant is proportional to productivity. Microseismic testing showed that a main fracture was produced by fracturing, and two wings were evenly distributed on both sides of the main fracture. This shows that the target layer is relatively homogeneous and the overall development of natural fractures is not high.
4) There is no significant correlation between the modified fracture half-length, fracture width and productivity. But for the fracture height, when it is greater than 26 m, the fractured well is generally a low-production well. This shows that excessive displacement and construction scale should not be used in the fracturing process, and the fracture height of the target layer should be strictly controlled within the range of 26 m. The analysis of the “rupture points” in the fracturing curves shows that wells with relatively obvious rupture points usually have higher productivity. These wells have a good fracturing effect and an effective fracture network is formed in the reservoir.
5) The optimization simulation results of the horizontal well pattern form show that the seven-point combined well pattern is the best well pattern, which is more suitable for the development of tight oil sandstone in the Yanchang Formation.
Data Availability Statement
The raw data supporting the conclusions of this article will be made available by the authors, without undue reservation.
Author Contributions
The first author DZ is responsible for the idea and writing of this article, and the co-authors YL, HL, SC, JC, XL are responsible for the experimental part.
Conflict of Interest
Authors YL, HL and SC were employed by the company Petrochina Changqing Oilfield Company Oil Production Plant No.5. Authors JC and XL were employed by the company No.4 Drilling Engineering Branch Company, CNPC Bohai Drilling Engineering Company Limited. They are all petroleum geological engineers now.
The remaining author declares that the research was conducted in the absence of any commercial or financial relationships that could be construed as a potential conflict of interest.
Publisher’s Note
All claims expressed in this article are solely those of the authors and do not necessarily represent those of their affiliated organizations, or those of the publisher, the editors, and the reviewers. Any product that may be evaluated in this article, or claim that may be made by its manufacturer, is not guaranteed or endorsed by the publisher.
References
Abouzar, M., and Ghanbarian, B. (2021). A New Methodology for Grouping and Averaging Capillary Pressure Curves for Reservoir Models. Energ. Geosci. 2, 52–62. doi:10.1016/j.engeos.2020.09.001
Bhatti, A. A., Ismail, A., Raza, A., Gholami, R., Rezaee, R., Nagarajan, R., et al. (2020). Permeability Prediction Using Hydraulic Flow Units and Electrofacies Analysis. Energ. Geosci. 1, 81–91. doi:10.1016/j.engeos.2020.04.003
Chitrala, Y., Moreno, C., Sondergeld, C., and Rai, C. (2013). An Experimental Investigation into Hydraulic Fracture Propagation under Different Applied Stresses in Tight Sands Using Acoustic Emissions. J. Pet. Sci. Eng. 108, 151–161. doi:10.1016/j.petrol.2013.01.002
Dong, S., Zeng, L., Lyu, W., Xia, D., Liu, G., Wu, Y., et al. (2020). Fracture Identification and Evaluation Using Conventional Logs in Tight Sandstones: A Case Study in the Ordos Basin, China. Energ. Geosci. 1, 115–123. doi:10.1016/j.engeos.2020.06.003
Du, Y., and Aydin, A. (1993). The Maximum Distortional Strain Energy Density Criterion for Shear Fracture Propagation with Applications to the Growth Paths ofEn Échelonfaults. Geophys. Res. Lett. 20, 1091–1094. doi:10.1029/93gl01238
Eyal, Y., Gross, M. R., Engelder, T., and Becker, A. (2001). Joint Development during Fluctuation of the Regional Stress Field in Southern Israel. J. Struct. Geol. 23, 279–296. doi:10.1016/s0191-8141(00)00096-1
Fan, X. Y. (2010). The Geology of Oil and Gas Drilling. Chongqing: Chongqing University Press, 148–180.
Gurocak, Z., Solanki, P., Alemdag, S., and Zaman, M. M. (2012). New Considerations for Empirical Estimation of Tensile Strength of Rocks. Eng. Geol. 145-146, 1–8. doi:10.1016/j.enggeo.2012.06.005
He, S., Wang, W., Shen, H., Tang, M., Liang, H., and Lu, J. a. (2015). Factors Influencing Wellbore Stability during Underbalanced Drilling of Horizontal wells - when Fluid Seepage Is Considered. J. Nat. Gas Sci. Eng. 23, 80–89. doi:10.1016/j.jngse.2015.01.029
He, X., Zhang, P., He, G., Gao, Y., Liu, M., Zhang, Y., et al. (2020). Evaluation of Sweet Spots and Horizontal-Well-Design Technology for Shale Gas in the basin-margin Transition Zone of southeastern Chongqing, SW China. Energ. Geosci. 1, 134–146. doi:10.1016/j.engeos.2020.06.004
Hong, D., Cao, J., Wu, T., Dang, S., Hu, W., and Yao, S. (2020). Authigenic clay Minerals and Calcite Dissolution Influence Reservoir Quality in Tight Sandstones: Insights from the central Junggar Basin, NW China. Energ. Geosci. 1, 8–19. doi:10.1016/j.engeos.2020.03.001
Huang, Y. G., Chen, Z. Q., Wignall, P. B., Grasby, S. E., Zhao, L. S., Wang, X. D., et al. (2019). Biotic Responses to Volatile Volcanism and Environmental Stresses over the Guadalupian-Lopingian (Permian) Transition. Geology 47, 175–178.
Jaeger, J. C., and Cook, N. G. W. (1976). Fundamentals of Rock Mechanics. London: Chapman & Hall, 128–130.
Jiang, R., Zhang, F., Cui, Y., Qiao, X., and Zhang, C. (2019). Production Performance Analysis of Fractured Vertical wells with SRV in Triple media Gas Reservoirs Using Elliptical Flow. J. Nat. Gas Sci. Eng. 68, 1–15. doi:10.1016/j.jngse.2019.102925
Kang, H., Zhang, X., Si, L., Wu, Y., and Gao, F. (2010). In-situ Stress Measurements and Stress Distribution Characteristics in Underground Coal Mines in China. Eng. Geol. 116, 333–345. doi:10.1016/j.enggeo.2010.09.015
Li, L., Huang, B., Li, Y., Hu, R., and Li, X. (2018). Multi-scale Modeling of Shale Laminas and Fracture Networks in the Yanchang Formation, Southern Ordos Basin, China. Eng. Geol. 243, 231–240. doi:10.1016/j.enggeo.2018.07.010
Li, Y., Zhou, D.-H., Wang, W.-H., Jiang, T.-X., and Xue, Z.-J. (2020). Development of Unconventional Gas and Technologies Adopted in China. Energ. Geosci. 1, 55–68. doi:10.1016/j.engeos.2020.04.004
Li, Z. M., and Zhang, J. C. (1997). Crustal Stress and Hydrocarbon Exploration and Development. Beijing: Petroleum Industry Press, 138–140.
Liu, Z. L., Fan, A. P., Li, Y. J., Du, Z. W., Zhao, Z. J., and Zhang, T. (2015). Constraints of Clastic Component Difference on Diagenesis: A Case Study of sandstone Reservoirs in Dong-2 Block of the Sulige Gasfield, Ordos Basin. Nat. Gas Industry 35, 30–38. doi:10.3787/j.issn.1000-0976.2015.08.004
Lommatzsch, M., Exner, U., Gier, S., and Grasemann, B. (2015). Dilatant Shear Band Formation and Diagenesis in Calcareous, Arkosic Sandstones, Vienna Basin (Austria). Mar. Pet. Geol. 62, 144–160. doi:10.1016/j.marpetgeo.2015.02.002
Luo, Y., Huang, H., Jakobsen, M., Yang, Y., Zhang, J., and Cai, Y. (2019). Prediction of Porosity and Gas Saturation for Deep-Buried sandstone Reservoirs from Seismic Data Using an Improved Rock-Physics Model. Acta Geophys. 67, 557–575. doi:10.1007/s11600-019-00274-6
Luo, Y., Huang, H., Yang, Y., Hao, Y., Zhang, S., and Li, Q. (2018). Integrated Prediction of deepwater Gas Reservoirs Using Bayesian Seismic Inversion and Fluid Mobility Attribute in the South China Sea. J. Nat. Gas Sci. Eng. 59, 56–66. doi:10.1016/j.jngse.2018.08.019
Mahmoodi, S., Abbasi, M., and Sharifi, M. (2019). New Fluid Flow Model for Hydraulic Fractured wells with Non-uniform Fracture Geometry and Permeability. J. Nat. Gas Sci. Eng. 68, 1–14. doi:10.1016/j.jngse.2019.102914
McBride, E. F. (1989). Quartz Cement in Sandstones: A Review. Earth Sci. Rev. 26, 69–112. doi:10.1016/0012-8252(89)90019-6
Nelson, E. J., Meyer, J. J., Hillis, R. R., and Mildren, S. D. (2005). Transverse Drilling-Induced Tensile Fractures in the West Tuna Area, Gippsland basin, Australia: Implications for the In Situ Stress Regime. Int. J. Rock Mech. Mining Sci. 42, 361–371. doi:10.1016/j.ijrmms.2004.12.001
Peng, J., Wong, L. N. Y., and Teh, C. I. (2018). A Re-examination of Slenderness Ratio Effect on Rock Strength: Insights from DEM Grain-Based Modelling. Eng. Geol. 246, 245–254. doi:10.1016/j.enggeo.2018.10.003
Salamon, M. D. G. (1984). Energy Considerations in Rock Mechanics: Fundamental Results. J. South. Afr. Inst. Min. Metall. 84, 233–246.
Santosh, M., and Feng, Z. Q. (2020). New Horizons in Energy Geoscience. Energ. Geosci. 1, 1–4. doi:10.1016/j.engeos.2020.05.005
Shuai, Y., Zhang, S., Mi, J., Gong, S., Yuan, X., Yang, Z., et al. (2013). Charging Time of Tight Gas in the Upper Paleozoic of the Ordos Basin, central China. Org. Geochem. 64, 38–46. doi:10.1016/j.orggeochem.2013.09.001
Wu, S., Chen, Z.-Q., Fang, Y., Pei, Y., Yang, H., and Ogg, J. (2017). A Permian-Triassic Boundary Microbialite deposit from the Eastern Yangtze Platform (Jiangxi Province, South China): Geobiologic Features, Ecosystem Composition and Redox Conditions. Palaeogeogr. Palaeoclimatol. Palaeoecol. 486, 58–73. doi:10.1016/j.palaeo.2017.05.015
Yoshida, M., and Santosh, M. (2020). Energetics of the Solid Earth: An Integrated Perspective. Energ. Geosci. 1, 28–35. doi:10.1016/j.engeos.2020.04.001
Zhang, S., Huang, H., Dong, Y., Yang, X., Wang, C., and Luo, Y. (2017). Direct Estimation of the Fluid Properties and Brittleness via Elastic Impedance Inversion for Predicting Sweet Spots and the Fracturing Area in the Unconventional Reservoir. J. Nat. Gas Sci. Eng. 45, 415–427. doi:10.1016/j.jngse.2017.04.028
Zhao, J., Tang, D., Qin, Y., Xu, H., Lv, Y., Tao, S., et al. (2017). Evaluation of Fracture System for Coal Marcolithotypes in the Hancheng Block, Eastern Margin of the Ordos Basin, China. J. Pet. Sci. Eng. 159, 799–809. doi:10.1016/j.petrol.2017.09.031
Zhao, Z., Wu, K., Fan, Y., Guo, J., Zeng, B., and Yue, W. (2020). An Optimization Model for Conductivity of Hydraulic Fracture Networks in the Longmaxi Shale, Sichuan basin, Southwest China. Energ. Geosci. 1, 47–54. doi:10.1016/j.engeos.2020.05.001
Zou, C. N., Yang, Z., Tao, S. Z., Yuan, X. J., Zhu, R. K., Hou, L. H., et al. (2013). Continuous Hydrocarbon Accumulation over a Large Area as a Distinguishing Characteristic of Unconventional Petroleum: The Ordos Basin, North-Central China. Earth Sci. Rev. 126, 358–369. doi:10.1016/j.earscirev.2013.08.006
Keywords: Ordos Basin, Yanchang formation, tight oil, staged fracturing technology, hydraulic fracture, numerical analysis
Citation: Zhang D, Liu Y, Luo H, Cao S, Cao J and Li X (2021) Staged Fracturing of Horizontal Wells in Continental Tight Sandstone Oil Reservoirs: A Case Study of Yanchang Formation in Western Ordos Basin, China. Front. Earth Sci. 9:760976. doi: 10.3389/feart.2021.760976
Received: 19 August 2021; Accepted: 02 September 2021;
Published: 14 September 2021.
Edited by:
Kouqi Liu, Central Michigan University, United StatesReviewed by:
Shuai Yin, Xi’an Shiyou University, ChinaShuai Gao, Northeast Petroleum University, China
Copyright © 2021 Zhang, Liu, Luo, Cao, Cao and Li. This is an open-access article distributed under the terms of the Creative Commons Attribution License (CC BY). The use, distribution or reproduction in other forums is permitted, provided the original author(s) and the copyright owner(s) are credited and that the original publication in this journal is cited, in accordance with accepted academic practice. No use, distribution or reproduction is permitted which does not comply with these terms.
*Correspondence: Dingxue Zhang, emhhbmdkaW5neHVlMTM0QDE2My5jb20=