 Jilong Chen1,2
 Chi-Yung Tam2,3*
 Kevin Cheung4
 Ziqian Wang5,6
 Hiroyuki Murakami7,8,9Ngar-Cheung Lau10,11Stephen T. Garner8,9
 Ziniu Xiao12Chun-Wing Choy13Peng Wang2,14
- 1Guangdong-Hong Kong-Macao Greater Bay Area Weather Research Center for Monitoring Warning and Forecasting (Shenzhen Institute of Meteorological Innovation), Shenzhen, China
- 2Earth System Science Programme, The Chinese University of Hong Kong, Hong Kong, China
- 3Shenzhen Research Institute, The Chinese University of Hong Kong, Shenzhen, China
- 4Climate Research, Climate and Atmospheric Science, Science Economy Insights Division, NSW Department of Planning Industry and Environment, Parramatta, NSW, Australia
- 5School of Atmospheric Sciences, and Guangdong Province Key Laboratory for Climate Change and Natural Disaster Studies, Sun Yat-sen University, Zhuhai, China
- 6Southern Marine Science and Engineering Guangdong Laboratory (Zhuhai), Zhuhai, China
- 7Meteorological Research Institute, Tsukuba, Japan
- 8Geophysical Fluid Dynamics Laboratory, National Oceanic and Atmospheric Administration, Princeton, NJ, United States
- 9Atmospheric and Oceanic Sciences Program, Princeton University, Princeton, NJ, United States
- 10Institute of Environment, Energy and Sustainability, The Chinese University of Hong Kong, Hong Kong, China
- 11Department of Geography and Resource Management, The Chinese University of Hong Kong, Hong Kong, China
- 12State Key Laboratory of Numerical Modeling for Atmospheric Sciences and Geophysical Fluid Dynamics, Institute of Atmospheric Physics, Chinese Academy of Sciences, Beijing, China
- 13Hong Kong Observatory, Hong Kong, China
- 14Policy Research Center for Environment and Economy, Ministry of Ecology and Environment of the People’s Republic of China, Beijing, China
The impacts of the western North Pacific (WNP) tropical cyclone (TC) on East and Southeast Asian inland regions are analyzed. Here, based on a stringent TC selecting criterion, robust increase of TC-related inland impacts between 1979 and 2016 over East and Southeast Asian regions have been detected. The storms sustained for 2–9 h longer and penetrated 30–190 km further inland, as revealed from different best track datasets. The most significant increase of the TC inland impacts occurred over Hanoi and South China. The physical mechanism that affects TC-related inland impacts is shortly discussed. First, the increasing TC inland impacts just occur in the WNP region, but it is not a global effect. Second, besides the significant WNP warming effects on the enhanced TC landfall intensity and TC inland impacts, it is suggested that the weakening of the upper-level Asian Pacific teleconnection pattern since 1970s may also play an important role, which may reduce the climatic 200 hPa anti-cyclonic wind flows over the Asian region, weakening the wind shear near the Philippine Sea, and may eventually intensify the TC intensity when the TCs across the basin. Moreover, the TC inland impacts in the warming future are projected based on a high-resolution (20 km) global model according to the Representative Concentration Pathway 8.5 scenario. By the end of the 21st century, TC mean landfall intensity will increase by 2 m/s (6%). The stronger storms will sustain 4.9 h (56%) longer and penetrate 92.4 km (50%) farther inland, thereby almost doubling the destructive power delivered to Asian inland regions. More inland locations will therefore be exposed to severe storm–related hazards in the future due to warmer climate. Long-term planning to enhance disaster preparedness and resilience in these regions is called for.
1 Introduction
Accompanied by high winds, heavy rainfall, and storm surges, tropical cyclones (TCs) are one of the most devastating types of natural disasters to coastal regions and can inflict huge economic and societal losses (Lee and Wong, 2007; Needham et al., 2015; Cerveny et al., 2017; Khouakhi et al., 2017). The past five decades have seen detectable anthropogenic warming of the climate system, and many modeling studies have suggested that the anthropogenic warming could exert remarkable influences on TCs (Knutson et al., 2010; Murakami et al., 2012a; Patricola and Wehner, 2018; Knutson et al., 2020). Observations also show an increase of intensification rates of strong TCs across the globe (Webster et al., 2005; Elsner et al., 2008; Bhatia et al., 2019). Specifically, the East Asian countries, which suffered most from TC-related disasters, have been exposed to more intense landfalling storms (Park et al., 2011; Mei and Xie, 2016; Li et al., 2017). For example, TC intensity at landfall over China has been increasing in recent decades (Chan, 2008; Mei and Xie, 2016; Li et al., 2017; Liu et al., 2020), which can be an important factor for the lengthening of TC lifetime, extending the distance travelled after landfall, and amplifying storm destructiveness over land (Liu et al., 2020). However, owing to the limited length of reliable historical TC records and substantial interannual to interdecadal climate variability, whether and how the increase in landfall intensity is attributable to human influence or to the substantial level of natural variability is still an area of intense research (Pielke Jr et al., 2005; Lee et al., 2020). Moreover, the aforementioned studies just focused on the China region; changes of landfalling TCs in the entire western North Pacific (WNP) region and their impacts on East to Southeast Asian coastal regions are still not clear.
Apart from historical impacts, future TC influences over land also remain uncertain, and such information is crucial for mitigating storm risks. Numerous studies have shown that TC intensity can be intensified under the global warming condition (Knutson et al., 2010; Murakami et al., 2012a; Mei et al., 2015; Patricola and Wehner, 2018; Knutson et al., 2020), especially from ocean warming, which can provide more enthalpy flux resulting in a stronger potential intensity (Emanuel, 1988). When TCs become more intense in the future, stronger landfall intensity may lead to longer sustaining time and farther distance travelled into inland regions, bringing extreme precipitation and winds to extensive areas. Note that coarse resolution global models with spatial resolution ∼102 km are not able to simulate very intense TCs and reasonable TC structures (Strachan et al., 2013; Roberts et al., 2020). On the other hand, high resolution models, which are able to simulate reasonable TC intensity and the decay process after landfall, provide a way to project changes in TC-related inland hazards under global warming (Chen et al., 2020).
In this study, we will focus on WNP TCs to investigate historical changes of TC-related inland impacts over both East and Southeast Asia regions in the past four decades (1979–2016) based on multiple -best track datasets and discuss the physical process behind. Future changes of TC-related impacts on Asian inland regions under a warmer climate will also be projected through high-resolution numerical simulations. Moreover, the impacts of global warming on the global historical landfalling TCs will be shortly discussed.
2 Data and Methods
2.1 TC Observations and Reanalysis Data
Best track data from four agencies, the Joint Typhoon Warning Center (JTWC), Hong Kong Observatory (HKO), China Meteorological Administration/Shanghai Typhoon Institute (CMA/STI), and the Regional Specialized Meteorological Center (RSMC) Tokyo are used in this study. TC data in the eastern North Pacific (EP), North Atlantic (NA), North Indian Ocean (NIO), South Indian Ocean (SIO), and South Pacific (SP) are provided by HURDAT, HURDAT, JTWC, Bureau of Meteorology (BOM), and JTWC, respectively, which are used for discussing the global change in TCs. All these data are obtained from International Best Track Archive for Climate Stewardship (IBTrACS) version 3 (Knapp et al., 2010). The Japanese 55-year Reanalysis (JRA-55; Kobayashi et al., 2015) is also used when considering atmospheric circulation changes.
2.2 High Resolution Model
Future characteristics of WNP landfalling TCs are projected using the Meteorological Research Institute’s atmospheric general circulation model (MRI-AGCM3.2s), with ∼20-km (T959) resolution in horizontal and 64 unevenly distributed layers in vertical up to 0.01 hPa. The detailed dynamical and physical schemes settings used in the MRI-AGCM3.2s have been elaborated by Murakami et al. (2012b).
In order to evaluate the impacts of global warming on tropical cyclones and their inland influences, the so-called time slice experiments are applied (Bengtsson et al., 1996). In detail, the present-day experiments are forced by monthly-mean SST and sea ice concentration in the period between 1979 and 2003, which are taken from the Met Office Hadley Centre Sea Ice and Sea Surface Temperature version 1 (HadISST1) (Rayner et al., 2003). When forcing the 20 km MRI-AGCM, the monthly-mean SST and sea ice concentration from 1979 to 2003 are interpolated to daily values and prescribed. Two-member ensembles in the present-day experiments are generated by initiating from different initial time. In order to generate SST and sea ice under the global warming conditions from 2075 to 2099, the averaged SST and sea ice departures between 2075 and 2099 and 1979 and 2003 are calculated based on the 28 Coupled Model Intercomparison Project Phase 5 (CMIP5) models according to the Representative Concentration Pathway 8.5 (RCP8.5) scenario. Superimposing such perturbations onto the present-day SST and sea ice, the future prescribed SST and sea ice are built (Mizuta et al., 2014). Thus, the interannual variation of SST and sea ice at the present day is assumed to retain the same in the future. The global warming experiments consist of four ensemble members, each integrated based on different SST warming spatial patterns, with one from the averaged warming pattern of the whole CMIP5 model SST products and the other three different warming types (i.e., stronger warming signals in SP, Central Pacific (CP), and WNP, respectively) from the cluster analysis using 28 CMIP5 models, which were performed by Mizuta et al. (2014). The CP warming cluster will also be used to investigate the projections of TC inland impacts during the future “CP El Niño” like climate.
The TC tracking algorithm follows that of Murakami et al. (2012b), which has been successfully used in the 20-km MRI-AGCMs model. Using this algorithm, the detected global TC number in the present-day (1979–2003) was found and matched with that observed (Murakami et al., 2012b). In the TC tracking algorithm, a storm-like vortex is detected whenever 1) the maximum relative vorticity at 850 hPa exceeds 2.0 × 10⁻⁴ s−1; 2) the maximum wind speed at 850 hPa exceeds 17.0 m/s; 3) an evident warm core aloft should be found, that is, the sum of the temperature deviations at 300, 500, and 700 hPa exceeds 2.0 K, which are calculated by subtracting the maximum temperature from the mean temperature over the 10° × 10° grid box at each level centered nearest to the location of maximum vorticity at 850 hPa; 4) the maximum wind speed at 850 hPa is stronger than that at 300 hPa; and 5) the time duration of each detected storm must exceed 36 h.
2.3 Methods
HKO and RSMC use 10-min (V10) average, and CMA/STI the 2-min (V2) mean, while JTWC uses a 1-min average wind speed at 10-m height above ground (V1) (Knapp et al., 2010). This discrepancy can cause significant difference in categorizing TCs. In order to maintain inter-agency consistency, all surface wind measurements are converted to 1-min-based data using the relationships V10 = 0.88 × V1 (Knapp et al., 2010) and V2 = 0.9V1. The latter is based on the relation VCMA/VJTWC ≈ 0.9 at a stronger intensity level (Kruk et al., 2010). Using these converting algorithms, results for all metrics, that is, landfall TC number (Figure 1A), the annual landfall latitude change (Figure 1B), and the translation speed (Figure 1C), are shown to be consistent among all datasets.
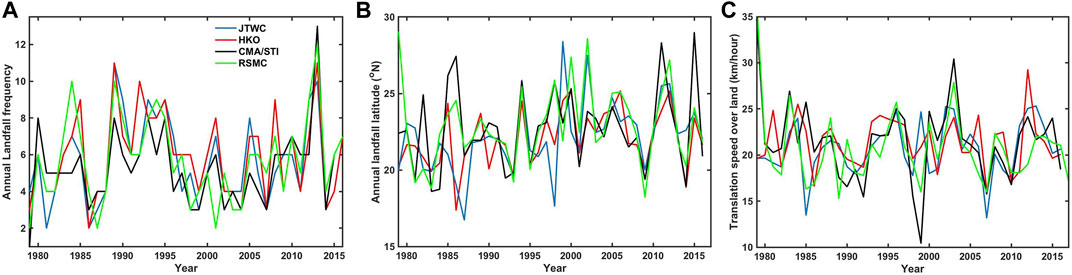
FIGURE 1. Historical TC characters of (A) TC landfall frequency, (B) latitude of typhoon landfall, and (C) TC translation speed, from the converted JTWC, HKO, CMA/STI, and RSMC best track data, respectively.
In order to obtain robust TC-related inland impacts on the Asian region, five criteria are adopted in selecting landfalling TCs for both observations and model simulations. 1) Only TCs after 1979 are considered, when reliable satellite imageries were available (for observations only); 2) only TCs with peak intensities reaching the tropical storm class or above (i.e., lifetime peak intensity > 17 m/s) are considered, to exclude very weak depressions; 3) once a TC made landfall, the decay process is only considered when its intensity is greater than 17 m/s, to remove uncertainties related to weak intensity; 4) all TCs should make landfall in mainland East and Southeast Asia (TCs crossing Taiwan or the Philippines are not considered as landfall as they will go back to the ocean and may make second landfall); 5) only landfalling TCs that did not return to oceanic sites again are selected, to make sure the whole decay process occurred over land. Tracks of the selected TCs are shown in Figure 2A (from the JTWC best track data).
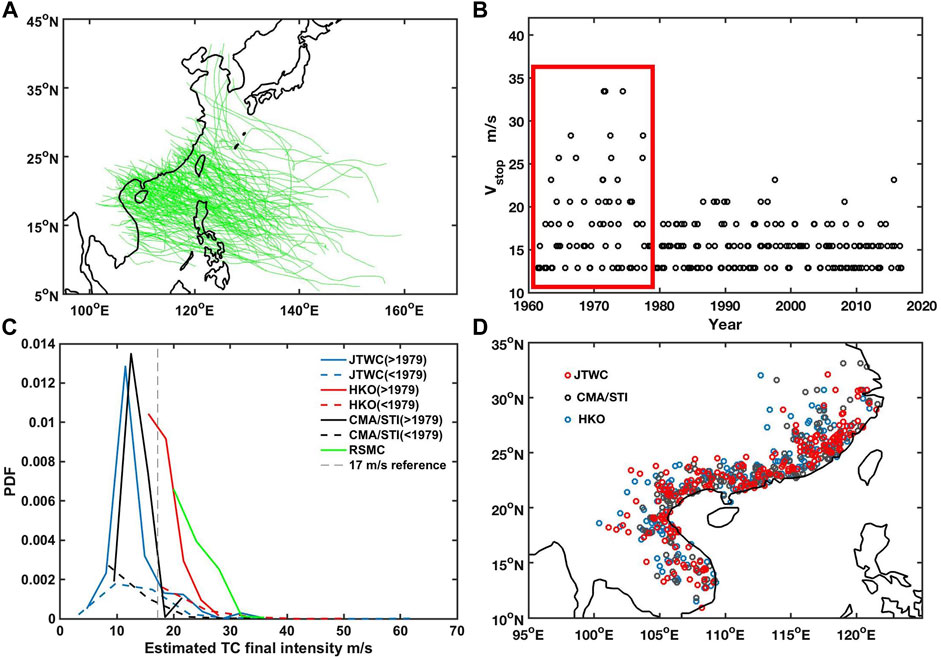
FIGURE 2. (A) Tracks of the selected WNP TCs from 1979 to 2016 in the JTWC best track dataset. (B) TCs’ final intensity issued by the HKO. Circles in the red rectangle are the TCs’ terminal intensities announced before 1978. (C) Changes of PDFs of the TC final intensity issued by JTWC, HKO, CMA/STI, and RSMC before and after 1979. (D) Comparisons of Terminal locations typhoons can reach when maintaining maximum wind speed of 17 m/s across different best track datasets.
Note that criterion (1) is necessary as there are significant interagency discrepancies among various WNP best track datasets due to different practices among agencies and changes in assessment methods over time, especially in assessing weaker systems (below tropical storm strength) before the availability of reliable satellite imageries and related intensity assessment methods in 1980s (e.g., Dvorak analysis) and 1990s (e.g., the advanced objective Dvorak technique) (Knapp and Kruk, 2010; Kruk et al., 2010). Figure 2B shows a clear change of the “final intensity” when HKO issued the last TC warning for each individual storm; there was a discernable difference for the terminal intensity between before and after 1979, suggesting that the observed TC decay process may have larger uncertainty in the early years (before 1979). In fact, all the best track data, except RSMC (which roughly starts from 1975), showed stronger TC final intensity before 1979, as inferred from the probability density function (PDF) changes of issued TC final intensity before and after 1979 (see Figure 2C).
After 1979, final intensities for most TCs are around or below 17 m/s (Figures 2B,C). However, the TC terminal intensity distribution still has a spread in the range in 0–17 m/s. In order to reduce such uncertainty, the storm decay process is truncated when the surface wind speed is less than 17 m/s, hence criterion (3). This approach has been adopted in assessing long-term TC trends (see Lee et al., 2020). Note that RSMC estimated most of the TC final intensities greater than 17 m/s, so this dataset will not be used in the following analyses. After shortening of the TC decay process to <17 m/s, TC final stops issued by different best track datasets are consistent (Figure 2D).
The sustaining time and distance over the land are calculated as the time period and total distance travelled by a particular storm during the considered decay process, respectively. The power dissipation index (PDI) over land is calculated as the time integral of cube of the maximum wind speed during the considered decay period after landfall. Annual variations of indices are calculated by taking the average for all landfalling TCs in the same season.
TC frequency difference in Figures 9A,B is calculated using data aggregated in 2.5° × 2.5° grid boxes. Significance of storm frequency change is assessed by Monte Carlo tests with 100,000 random trials. At least 15 years are randomly chosen from a set of TC frequency data (1979–2003 and 2075–2099); frequency difference from two different sets is then calculated, and the process is repeated for 100,000 times. The increase (decrease) trends pass the 95% confidence level at one grid box if the positive (negative) sign of frequency differences on this grid point appear more than 95,000 times in the trials.
The entire trend analyses used in this study is based on the Mann–Kendall (MK) trend test. Annual variations of the indices are used when doing the tests.
3 Results
3.1 Observed Changes of the TC-Related Inland Impacts Over Asian Region
In this study, TCs from 1979 to 2016 and their impacts on the whole East and Southeast Asian inland regions are analyzed based on outlined TC selection criteria. On an average, about 5–6 TCs made landfall in the studied region every year, which is 1–2 more landfalling TCs than that reported by Liu et al. (2020), who focused on the China region. There are marked decadal variations during the last five decades (Figure 1A). The landfalling location also shows secular changes, with a weak poleward shift during the last 50 years, in which the JTWC data passed the 90% confidence level MK test (Figure 1B), consistent with previous investigations (Park et al., 2014; Kossin et al., 2016; Li et al., 2017).
Previous studies have shown a remarkable increase of the TC landfall intensity over the China region (Mei and Xie, 2016; Li et al., 2017; Liu et al., 2020), which may be highly related to the rapid coastal ocean warming over the WNP (Mei and Xie, 2016; Liu et al., 2020). Here, the annual mean landfall intensity in the whole East/Southeast Asian region also shows a remarkable increasing trend of about 1.6 m/s per decade in the JTWC and HKO best track data above the 95% significance level (see the blue and red lines in Figure 3A). However, there is no significant trend of the landfall intensity in the CMA data (see the black line in Figure 3A). Interestingly, it is noteworthy that in addition to possible influence of coastal ocean warming (Mei and Xie, 2016; Liu et al., 2020), landfall intensity is also highly related to the TC lifetime peak intensity change (Figure 3B). All three datasets give a high positive correlation between the peak intensity and landfall intensity (JTWC: 0.56; HKO: 0.65, and CMA: 0.59; see Figure 3C). Moreover, it was found that landfall intensity also correlates negatively with the distance between the position where TC attains lifetime peak intensity and landfall location (referred to as Dpl). Based on multiple linear regression, 1 m/s increase in TC annual peak intensity is related to ∼0.5 m/s rise of landfall intensity on average (JTWC: 0.58 m/s; HKO: 0.53 m/s, and CMA/STI: 0.41 m/s). At the same time, 100 km decrease in Dpl corresponds to ∼0.53 m/s increase in the landfall wind speed (JTWC: 0.6 m/s; HKO: 0.5 m/s, and CMA/STI: 0.5 m/s). The correlation between fitted and observed landfall intensity is much improved when the Dpl factor is included (JTWC: 0.74; HKO: 0.74, and CMA/STI: 0.70; see the scattering plot in Figure 3D). We propose that for larger Dpl, TC will experience longer decay time after its peak and eventually a weaker wind speed at landfall.
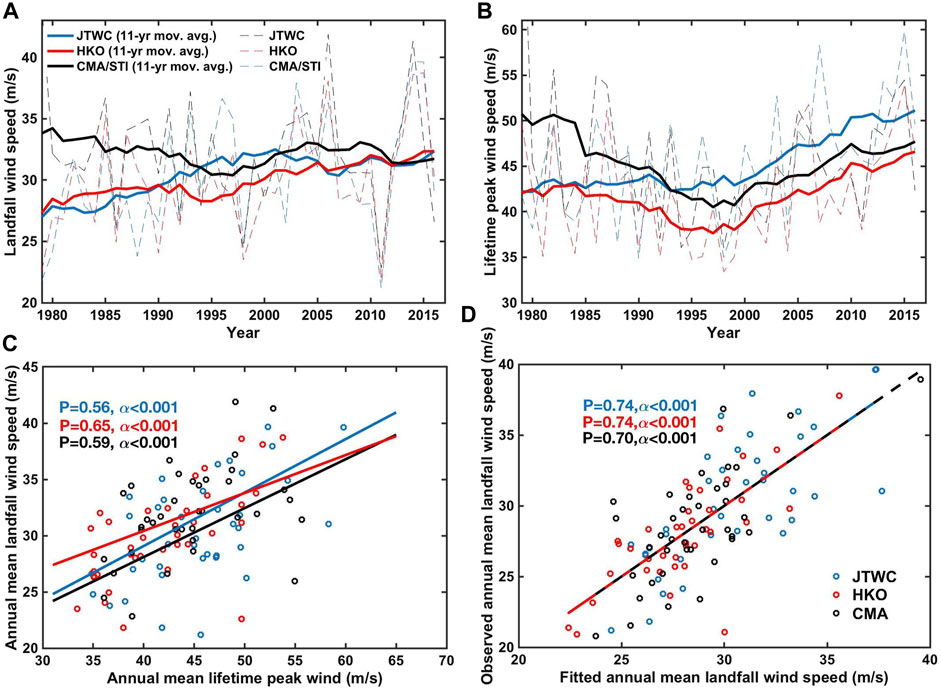
FIGURE 3. (A,B) are the annual mean of TC landfall intensity and lifetime peak intensity, respectively; (C) illustrates the scattering plot of annual mean lifetime peak intensity and landfall intensity from different datasets, while (D) represents relationship between the annual mean observed landfall wind speed and the landfall wind speed fitted from lifetime peak intensity and Dpl. Data are from JTWC, CMA/STI, and HKO.
In the relationship of the TC landfall intensity and the TC inland impacts, Figure 4A shows clear positive relationships between annual mean landfall intensity and sustaining time over land, with ∼0.77/0.51/0.47 h per 1 m/s increase within the 0.001/0.02/0.05 significance level based on JTWC/HKO/CMA best track data. All the best track datasets utilized in our study, that is, JTWC, HKO, and CMA/STI, display a striking extension of the life span of TCs after landfall, which has increased by 2–9 h since the 1979, above the 95% confidence level (see Figure 4B). Due to higher intensity and longer storm duration after landfall, the dissipated wind power over land, represented by PDI, has also doubled (Figure 4C). It is noteworthy that, despite a global slowdown of the TC translation speed reported by Kossin (2018), the robustness of such decreasing trends is still subject to further studies (Lanzante, 2019; Moon et al., 2019). In fact, if just the TCs in the satellite era are considered, no significant trend of these TCs’ translation speed was detected since 1979 (Figure 1C). If the storm translation speed after landfall remains unchanged, the higher intensity and longer sustaining time can substantially increase the travelling distance over land, meaning more inland penetration of storms. Indeed, on an average, there was an increase of ∼100 km (30–190 km) in distance travelled by TCs since 1979 (Figure 4D). These results are consistent with previous studies, which focused on the China region (Chan, 2008; Chen et al., 2011; Liu et al., 2020).
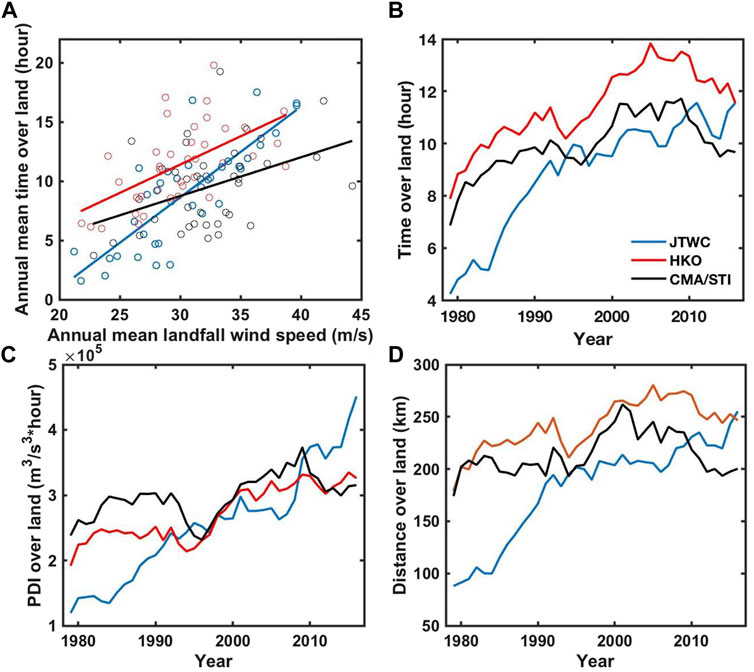
FIGURE 4. Changes of the influences of WNP TCs over land since the 1979. (A) Relationship between annual mean landfall intensity and time duration over the land; (B–D) are the 11-year moving averaged sustaining time, PDI, and travelling distance over the land from JTWC, HKO, and CMA/STI best track datasets, respectively.
As the East and Southeast Asia coastline is long, the changes of the TC inland impacts may be spatially different. To further investigate the TC inland impacts on different areas in the Asian region, the Asia land area is divided into three parts, Southeast Asia (latitude in 10°N–20°N), Hanoi and South China (in 20°N–25°N), and East China (>25°N). TCs making landfall in the three regions are then analyzed. First, there was an obvious poleward shift of TCs. A dramatic decrease trend of TC landfall frequency over the Southeast Asian region was detected from all the three datasets in the 0.05 significance level (see Figure 5A1), while an increase of TC landfall frequency over East China and above was found in JTWC and CMA/STI datasets within the 0.05 significance level (Figure 5C1). Second, the TC inland impacts, that is, TC intensity at landfall, sustaining time, and travelling distance over the land, showed different changes in the regions. The Southeast Asia region experienced steady change of TC landfall intensity, sustaining time, and translating distance over land (Figures 5A2–A4). The most significant increasing trends were found over the Hanoi and South China region (Figures 5B2–B4), with all the above parameters passing the 0.05 significance level MK trend test, except the TC landfall intensity change in the CMA best track dataset. In the East China region, although the increasing trend of landfall intensity was detected within the 0.05 significance level in all the datasets (Figure 5C2), the sustaining time and travelling distance over land did not show significant trends except JTWC (Figures 5C3,C4).
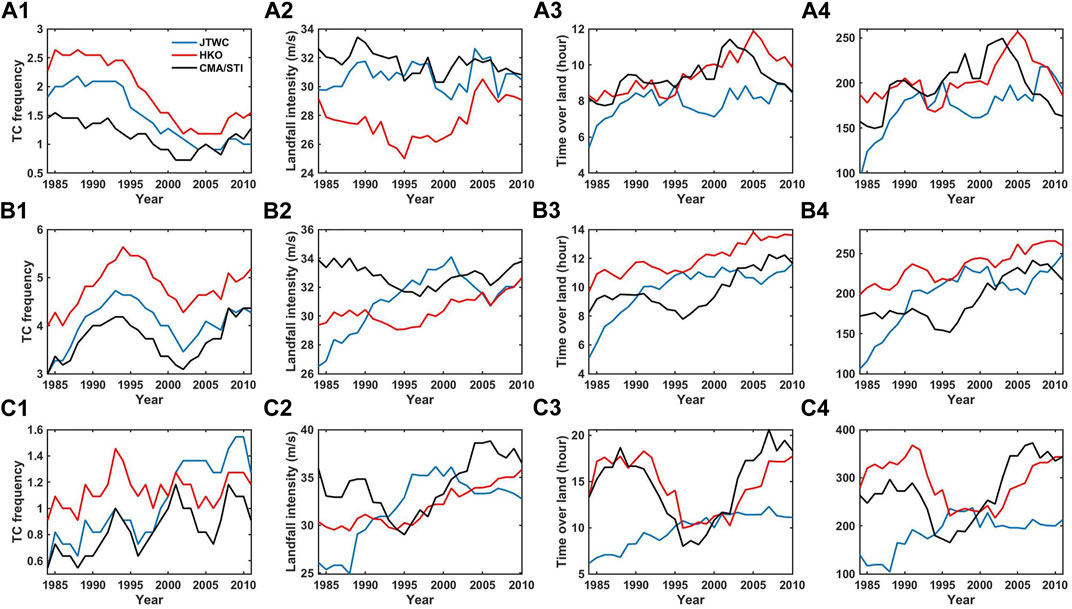
FIGURE 5. TC inland impacts in different Asian regions. (A1–A4) show TCs making landfall in the Southeast Asia region (10–20°N), while (B1–B4) TCs making landfall in the Hanoi and South China region (20–25°N) and (C1–C4) in the East China region and above (>25°N). Panels in the first column (A1, B1, C1) are the TC landfall frequency change, and the second (A2,B2,C2), third (A3,B3,C3), and fourth (A4,B4,C4) columns are for the TC landfall intensity, sustaining time, and traveling distance over the land, respectively. The plots are in 11-year moving average to show clearer changes of the parameters.
3.2 Future Projection of TC-Related Asian Inland Impacts
3.2.1 Model Evaluation
In this study, the 20-km MRI-AGCM3.2s model is used to project changes of storm-related impacts over continental East and Southeast Asia regions. MRI-AGCM3.2s can reproduce present-day (1979–2003) global TC characteristics well, such as TC numbers and distribution, including extremely intense (categories 4 + 5) TCs (Murakami et al., 2012b). Here, as the land-falling TCs are also considered in this study, the performance of MRI-AGCM3.2s-simulated land-falling TCs is evaluated.
First, in the historical period (1979–2003), the MRI-AGCM3.2s reasonably captured the historical TC genesis and TC occurrence frequency patterns (see Figure 6), with a relative overestimated TC genesis frequency over south part of the South China Sea (SCS) and a slightly underestimated TC genesis frequency over the Philippine Sea (Figures 6A,C). The TC genesis pattern has led to an overestimated TC frequency over south part of the SCS and slightly underestimate TC frequency over the north part of the SCS and western part of WNP (Figures 6B,D). More details are compared in Table 1. First, compared to the HKO best track data, MRI simulated ∼1.5 less landfall TCs every year over the Asian coastline in a 95% confidence level, while with stronger simulated TC lifetime peak and landfall wind speed above the 0.05 significance level (see the first two columns in Table 1). For the other parameters, MRI simulated reasonable TC inland impacts, that is, comparable TC sustaining time and travelling distance over the land (see Table 1).
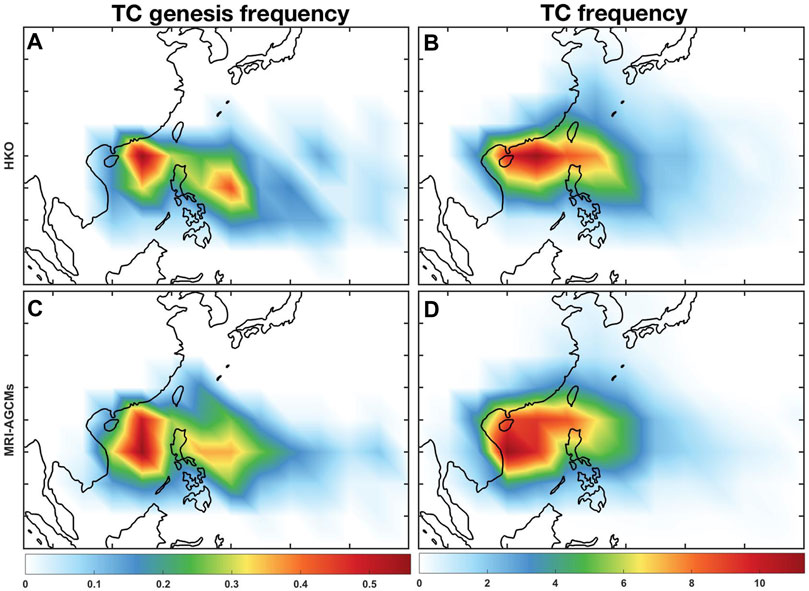
FIGURE 6. Comparisons of observed (A,B) and MRI-AGCM3.2s–simulated (C,D) WNP land-falling TCs genesis frequency (A,C), and occurrence frequency (B,D) in the period between 1979 and 2003.
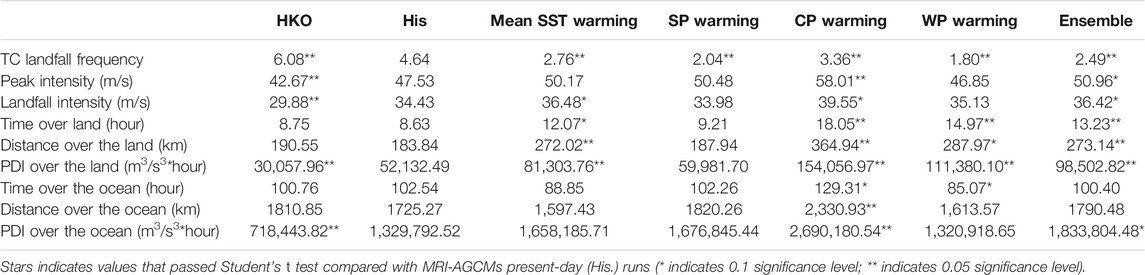
TABLE 1. HKO-observed and MRI-AGCM3.2s-simulated WNP parameters in the historical (1979–2003) and global warming (2075–2099) conditions according to RCP8.5 scenario.
In MRI-AGCM3.2s, a clear relationship between TC landfall and lifetime peak intensity (Figure 7A) and Dpl can also be found, with 0.67 (0.8) m/s increase in landfall wind speed per m/s (−100 km) peak intensity (Dpl) change (under the 0.001 confidence level, with p = 0.81). Figure 7B also shows the MRI model–simulated relationship between landfall intensity and TC time duration over land, with 0.53 h per m/s landfall intensity change above the 98% confidence level, which is comparable to the observed value (Figure 4A). The reasonable TC peak intensity/Dpl–landfall intensity relation and inland impacts illustrate that the 20 km MRI-AGCM can simulate a reasonable TC decay process before and after landfall. Note that as MRI-AGCM simulates stronger TC intensity, the PDI are simulated stronger than observed both over the land and over the ocean (see the first two columns in Table 1).
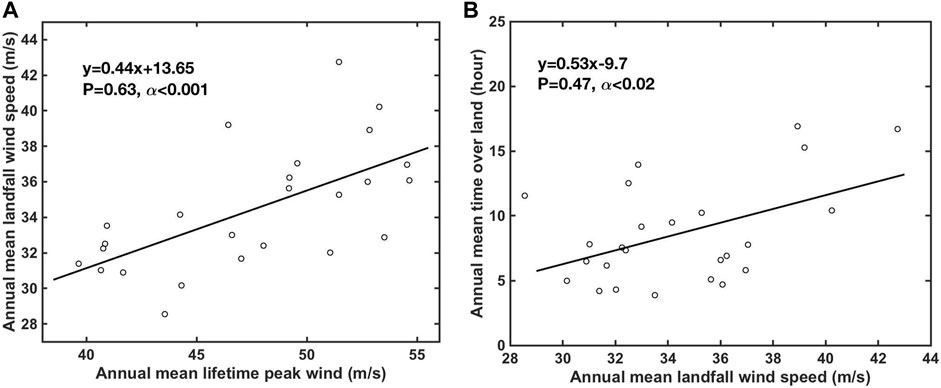
FIGURE 7. MRI-AGCM3.2s simulated relationships in (A) between TC annual lifetime peak intensity and the landfall wind speed and (B) between the TC annual landfall wind speed and time duration over the land.
3.2.2 Projected TC-Related Asian Inland Impacts
Compared to present-day TC landfall climatology, it is projected that the 2075–2099 ensemble mean WNP TC lifetime peak intensity would increase by ∼3 m/s (9%), with its PDF shifted to more intense side under global warming (see the red line in Figure 8 and the last column in Table 1), while the TC landfall intensity is projected to increase by 2 m/s (6%) under the RCP8.5 scenario, also with PDF change shifted to stronger values (Figure 8B). The results are generally in line with the latest assessments from the WNP perspective (Knutson et al., 2020), which have been suggested to be driven by anthropogenic warming (Knutson et al., 2010; Murakami et al., 2012a; Knutson et al., 2020). On the other hand, there is no significant change of Dpl in the global warming future (Figure 8C). Interestingly, it is found that the TC lifetime peak and landfall intensity will even be intensified by 10.5 m/s (22%) and 5.1 m/s (14.9%) under the CP warming condition (see the last second column in Table 1). The PDFs of the peak and the landfall wind speed under the CP warming condition are also further shifted to greater values (dashed green lines in Figures 8A,B). This indicates when CP El Niño occurs under the global warming condition, TCs are projected to be even stronger than those under the normal global warming. In fact, numerous studies have reported that variations of TC activity in the WNP is strongly influenced by the occurrence of El Niño (Wang and Chan, 2002; Camargo and Sobel, 2005; Kim et al., 2011; Coats and Karnauskas, 2017; Karamperidou et al., 2017; Xu et al., 2017; Seger et al., 2019), especially during the CP El Niño events (Chen and Tam, 2010; Zhao and Wang, 2019). When CP El Niño occurs, a large-scale cyclonic anomaly forms over the WNP (Chen and Tam, 2010), and at the same time, vertical wind shear over western part of the WNP can be reduced (Zhao and Wang, 2019), which are favorable for TC genesis and intensification. On the other hand, TCs are not significantly intensified under the WP warming condition. One possible reason may be the projected 17.5 h shorter TC time duration over the ocean in the WP warming compared to the historical experiments, which can reduce the TC evolution time and limit the TC intensification process.
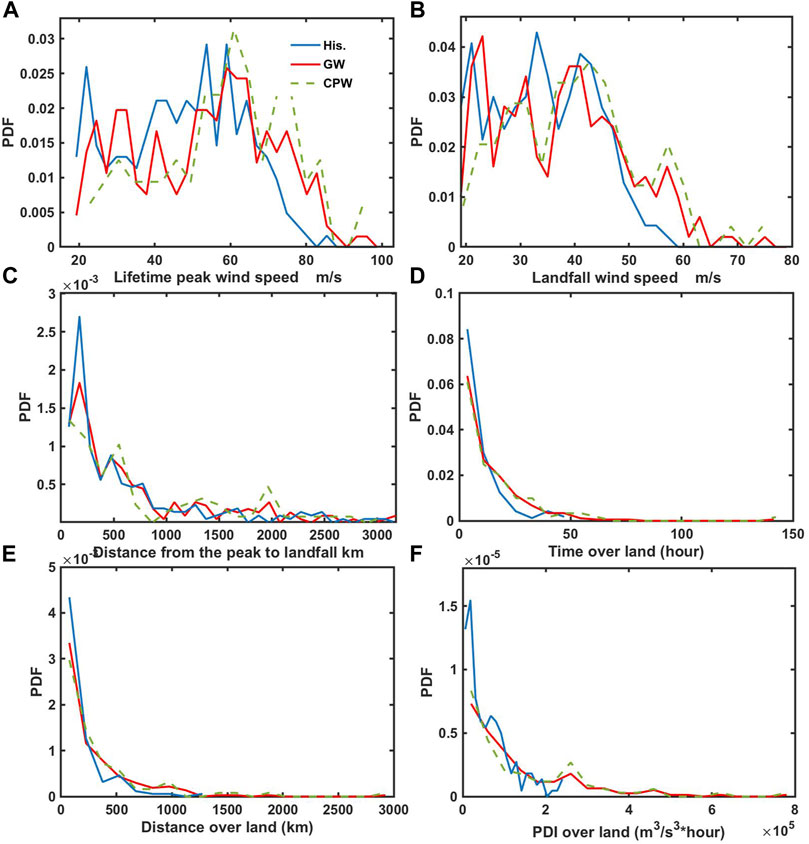
FIGURE 8. MRI-AGCMs simulated and projected PDFs changes of WNP TC and TC inland impacts. (A–C) are the PDFs changes of TC lifetime peak intensity, landfall intensity, and Dpl, respectively. (D–F) are the changes of PDFs of sustaining time, distance travelled, and PDI over land, respectively. Blue lines and red lines represent data in the present-day (1979–2003) and global warming condition ensemble mean (2075–2099) according to RCP8.5 scenario, respectively, while dashed green lines represent data in the CP warming cluster.
The TC inland impacts over the East and Southeast Asian regions are also strengthened. The averaged TC sustaining time and distance travelled over land from 2075 to 2099 can increase by 4.9 ± 3.4 h (56%) and 92.4 ± 67.3 km (50%), with the PDI doubled above the 95% significance level based on the Student’s t test in the ensemble mean. The PDFs of the indices display clear shifts to stronger values (red lines in Figures 8D–F). TC inland impacts can be even stronger in the occurrence of CP El Niño under the global warming condition. For runs belonging to the CP warming cluster, inland impacts will be much stronger, with averaged sustaining time over land increased by 10 h (109%), distance travelled by 181 km more (99%), and the PDI almost tripled (dashed green lines in Figures 8D–F).
Another TC impact can be shown by the TC landfall frequency change. The WNP storm frequency is projected to decrease under warming conditions. Figure 9A shows the projected change in TC frequency over WNP and Asian inland regions (2075–2099 minus 1979–2003). A dramatical decrease of storms can be seen over SCS and southwest part of WNP. The landfall frequency is also projected to decrease by ∼2 (see Table 1). Such dramatic TC landfall frequency decrease is mainly due to the decrease of TC genesis frequency. In specific, it is found that the TC genesis and landfall frequency in the present-day simulation are 24.24 and 4.7, respectively, over the WPN region, and the success landfall rate is 19.4%, while the ensemble mean TC genesis and landfall frequency over WNP are 12.39 and 2.5, respectively, with the success landfall rate 20.2%, which is similar with the rate in present-day simulations. For the simulations with different warming cluster SST-mean/WP/CP/SP, the genesis and landfall frequency are 12.52/10.84/16.32/9.88 and 2.76/1.76/3.4/2.08, respectively, with a success landfall rate of 22%/16.2%/20.8%/21.1%. The similar landfall rates indicate the TC genesis frequency change is the main factor that will cause the decrease of the TC landfall frequency. Although a poleward shift of the TC track has been projected in the global warming condition (see Figure 9A), the TCs can still succeed to make landfall. Note that the landfall rate in WP warming experiment show an obvious decrease, which may indicate the TC track may also play an important role.
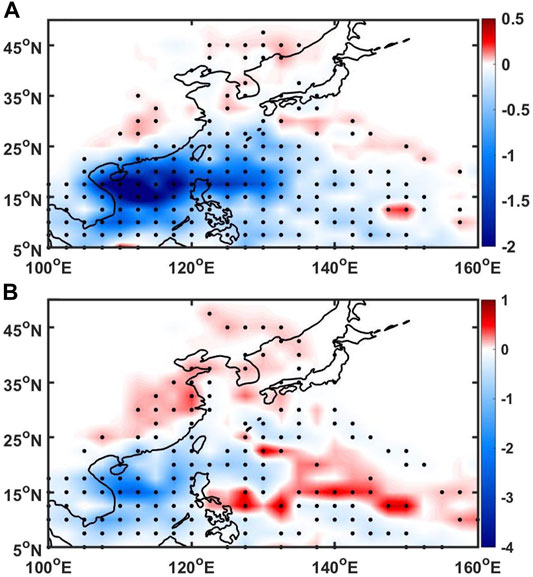
FIGURE 9. MRI-AGCM3.2s projected WNP TC frequency change between the present-day (1979–2003) and global warming condition (2075–2099) according to RCP8.5 scenario. (A) TC frequency change in the global warming ensemble mean, computed for 2.5° × 2.5° grid boxes. (B) same as (A) but the 2075–2099 period is based on the CP warming cluster. Black dots represent values passing the 0.05 significance level based on Monte Carlo tests.
Although less TCs are projected to make landfall, the TCs are expected to sustain longer time and penetrate to further Asian inland regions, and more TCs may still be found in Asian inland regions. In fact, TC frequency over inland places in Central China can be found to increase by ∼0.15 per year per each 2.5° × 2.5° grid box in the 2075–2099 period. There is also a poleward shift of WNP TC tracks, implying more landfalling TCs over mid- to high-latitude regions such as southern Japan, Korea, and even Russia. For the TCs under the CP warming condition, a substantial decrease of TC frequency can still be found, while more TCs can be found near 140°E, where the environment has been reported to be favorable for the TC genesis and intensification during CP El Niño years (Chen and Tam, 2010; Zhao and Wang, 2019). Moreover, 0.3–0.5 more TCs are projected in the Central, East, and North China land area in the CP warming cluster compared to the present-day simulations (Figure 9B), and the TC inland frequency is more than that from the ensemble mean (Figure 9A).
Interestingly, the dramatic increase of TC sustaining time in the model projections cannot be well explained by increased landfall intensity; 2 m/s increase in landfall intensity is responsible for ∼1 h longer sustaining time, according to the 0.53 h/per 1 m/s ratio in the MRI model (Figure 7B). Moreover, the landfall intensity–TC sustaining time over land is weaker and less significant under the global warming condition (below 90% confidence level). Thus, we propose that the “decay rate” is another factor determining TC duration after landfall (Liu et al., 2020). To further understand this, the e-folding decay time scale of TCs after landfall are calculated (Kaplan and DeMaria, 1995). It is found that the decay scale can be lengthened by ∼6.4 h under the anthropogenic warming condition (above the 95% significance level). The cumulative distribution function (CDF) of this parameter is shifted to stronger values in the RCP8.5 scenario compared to the present-day run CDF, and the TC decay time scale can be even larger in the CP warming cluster (Figure 10); some TCs can decay very slowly and sustain for several days (Figure 10). The lengthened decay time scale may be related to the northward change of TC tracks and landfall locations, making storm to land in regions with flatter topography (Liu et al., 2020). Moreover Li and Chakraborty (2020) showed that SST warming is a key factor for the slowing down of TC decay by enhancing the stock of moisture that a TC carries when making landfall. There are many on-going studies about these mechanisms which need to be further tested (Bosse, 2020; Chavas and Chen, 2020).
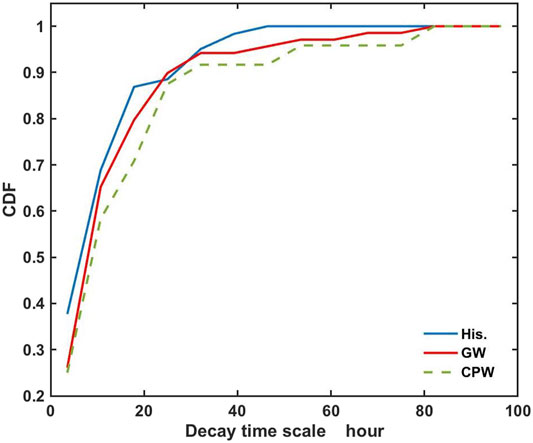
FIGURE 10. Compared CDFs of TC decay time scale between the present-day (1979–2003, solid blue line), global warming ensemble mean (2075–2099, solid red line), and the CP warming cluster (dashed green line) according to RCP8.5 scenario, respectively, based on the MRI-AGCMs simulations.
4 Conclusions and Discussion
In this study, a dramatic increase of WNP TC impacts on East and Southeast Asian inland regions has been found. Since the year of 1979, stronger landfalling TCs with a longer sustaining period and farther penetration to inland regions of East and Southeast Asia were observed, while the most significant increase of TC inland impacts occurred over Hanoi and South China regions. The results are consistent with previous studies over the China region (Liu et al., 2020). Moreover, the IBTrACS version 4 (Knapp et al., 2018), which includes TCs extended to 2019, also shows consistent TC inland impacts with version 3 best track data. In order to interpret the historical change of the TC landfall intensity, it is found that besides the impacts of coastal ocean warming on the TC intensification before landfall reported by previous studies (Mei and Xie, 2016; Liu et al., 2020), the TC lifetime peak intensity and the Dpl can also play very important roles in the TC landfall intensity change. Stronger peak intensity can drive a larger TC intensity at landfall, while for larger Dpl, TC will experience longer decay time after its peak and eventually a weaker wind speed at landfall. Also, the impacts of anthropogenic warming on TC-related Asian inland regions impacts have been evaluated by the 20-km MRI-AGCMs global model. Compared to the present era (1979–2013), WNP TCs would experience stronger landfall intensity under the warming conditions (2075–2099) in RCP8.5 scenario, and sustain longer time duration after landfall, invading further Asian inland regions with stronger dissipating energy released. The TC inland impacts would be even stronger in the CP warming pattern under the global warming condition. The past decades have seen a rapid global urbanization from the coastal regions to more and more inland locations. However, some inland places may not be well prepared for such TC impacts. For these inland regions, it is necessary to build up higher resilience to TC-related disasters in the future.
However, the historical TC impacts on inland regions are still regionally dependent. It is found that except the WNP and SIO which experienced significant increase trends and decrease trend respectively above the 0.05 significance level, the statistics in other regions are marginally significant (Figures not shown).
Moreover, the impact of the WNP ocean warming on the TC landfall intensity should be further investigated. Although the rapid SST warming over the WNP, especially near the East Asia coastal region, has been tied to the TC intensification of the landfall intensity (Mei and Xie, 2016), the warming (∼1 K) may not fully directly address such strong TC intensification just by the entropy increase. Modelling studies have shown that 1 K of SST warming can lead to 3–4% increase in TC intensity (Wang and Toumi, 2018). MRI-AGCM3.2s model also roughly follows the sensitivity ratio of ∼3 m/s (9%) intensification of TC lifetime peak intensity for 2.5–3 K SST warming. However, there was a ∼6 m/s (20%) increase in TC landfall intensity observed since 1979 (see the results from JTWC and HKO in Figure 3A), which may not be fully explained by the WNP SST warming. Meanwhile, a robust weakened vertical wind shear over the Asian coastal area and the east of the Philippines since 1970s has been detected (see Figure 11A, and Figure 9B from Li et al., 2017), which is favorable for TC structure and intensity maintenance (Gray, 1968; Wong and Chan 2004), and might also play an important role in the intensification of WNP TCs’ landfall intensity (Li et al., 2017). The annual mean of the vertical wind shear over the WNP region (see the red box in Figure 11A) shows a significant decrease trend (∼0.36 m/s per decade) at the 0.05 significance level in the MK test, and negatively correlated with TC annual landfall intensity at the 0.05 significance level (see Figure 11B). 1 m/s decrease of the vertical wind shear over this region may be responsible for ∼1.25 m/s increase in TC intensity at landfall through the linear regression model based on JTWC best track data. The decrease of the vertical wind shear at the east of the Philippines was pointed to be related with the enhanced Walker circulation which increased the low-level anticyclonic wind flows and reduced the vertical wind shear over the Philippines Sea (Park et al., 2014). It was suggested that the strengthened Walker circulation was closely related to the increasing zonal SST gradient over the tropical Pacific, which was driven by the significant warming of SST in the WNP while a weak cooling in the central Pacific. (Park et al., 2014; Li et al., 2017). Apart from the low-level wind flow changes, here we also found the weakened of the upper-level Asian Pacific teleconnection pattern since 1979 may also play an important role. As shown in Figure 12A, there is a seesaw zonal teleconnection pattern over the extratropical Asian Pacific region, and it can be characterized by the contrast of climatological upper-level (200–500 hPa) circulation, that is, the South Asian high, and to the variable cold, low-pressure trough to the east over the eastern North Pacific. Note that the upper-level thermal contrast between continental East Asia and eastern North Pacific has been weakening since 1970s (−0.3°C per decade, see shading in Figure 12B). Meanwhile, the zonal 200-hPa geopotential height gradient has also weakened (see contours in Figure 12B). These secular changes acted to reduce upper-level northeasterlies in the South China Sea and surrounding ocean areas near the Philippines (vectors in Figure 12B), lowering the vertical wind shear there (Figure 12C). Results derived from the NCEP reanalysis I (Kalnay et al., 1996) and ERA-Interim (Berrisford et al., 2009) also support the above conclusions (figures not shown). This see-saw teleconnection pattern change is highly related to the Asian-Pacific Oscillation (APO, Zhao et al., 2007), which shows multiple variabilities from the interannual to interdecadal timescales (Zhou et al., 2008; Zhao et al., 2012). The weakening of the APO in the past decades has been described as shifting to the negative phase of its interdecadal mode, according to 100 years of historical records (Zhao et al., 2012). However, APO may also be affected by anthropogenic forcing, and it is projected to further weaken under global warming conditions based on CMIP5 model simulations (Zhou, 2016). How much of this historical weakening signal is due to human-related forcing is still unclear. Moreover, anthropogenic aerosol emissions in Indian and Asian regions may also reduce the local incoming radiation, cooling down the local temperature (Giorgi and Qian, 2002; Chen et al., 2019), which may eventually affect the upper-level circulation, and should be further investigated.
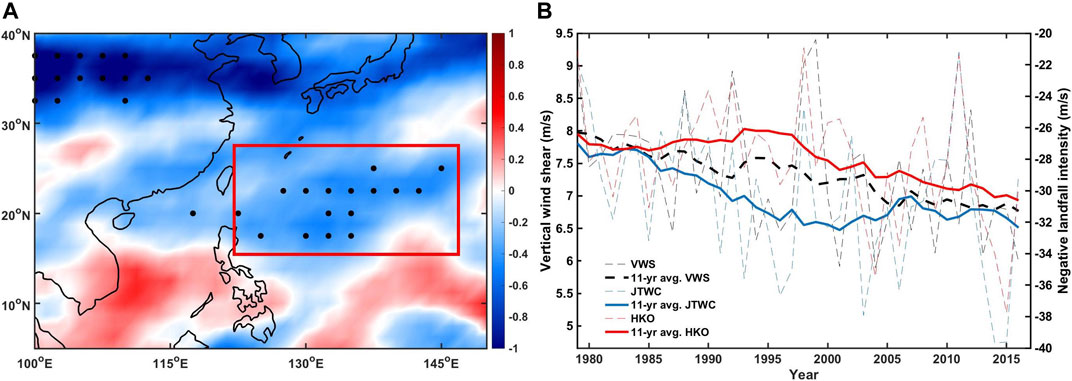
FIGURE 11. (A) Linear trend of vertical wind shear (m/s per decade) in JJASO over WNP and the Asian region, 1979–2016. The area in the red box is where strongest vertical wind shear change occurs. Black dots denote trend signals passing the 0.05 significance level according to the Mark–Kendall test. Data are from JRA-55. (B) Comparison of the annual mean vertical wind shear change within the red box in (A) and the annual mean landfall intensity change. TC landfall intensities are calculated from JTWC and HKO best track datasets.
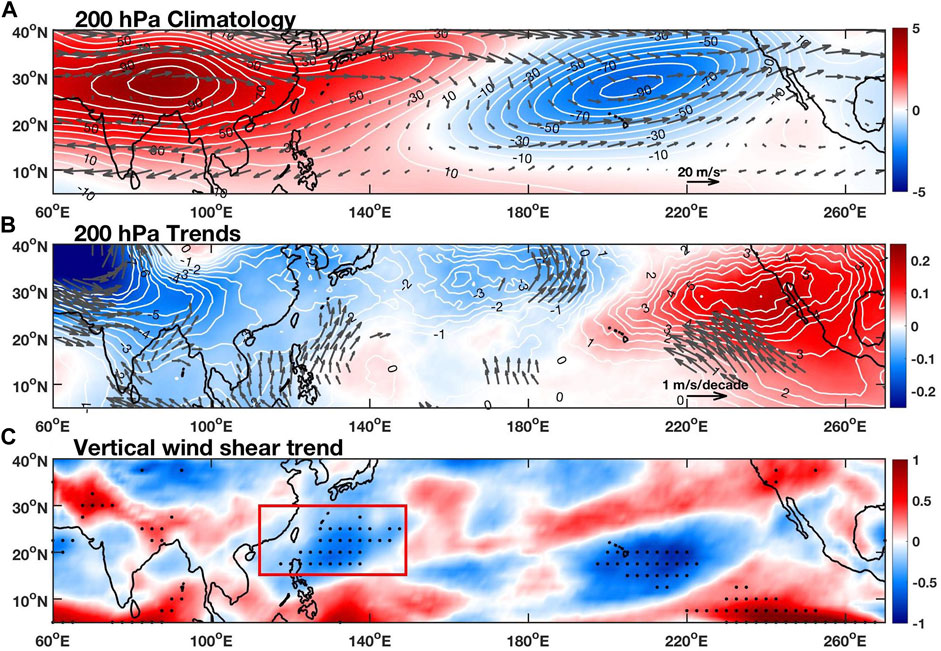
FIGURE 12. General circulation change and weakened vertical wind shear over far western WNP. (A) 1970–2016 summer season (JJASO) climatological values of the 500–200 hPa layer mean eddy temperature (i.e. with zonal average removed; shading, Units: K), 200 hPa eddy geopotential height (contours, Units: m), and 200 hPa wind (vectors Units: m/s). (B) Same as (A) but for linear trends (in per decade) of the same variables. (C) Linear trend of vertical wind shear (m/s per decade) in JJASO, 1970–2016. The region in the red box is where most of WNP landfalling typhoons pass by. Vectors in (B) and black dots in (C) denote trend signals passing the 0.05 significance level according to the Mark–Kendall test.
Data Availability Statement
The IBTrACS data for both version 3 and version 4 are retrieved from https://climatedataguide.ucar.edu/climate-data/ibtracs-tropical-cyclone-best-track-data. HadISST 1.1 monthly data is obtained from https://climatedataguide.ucar.edu/climate-data/sst-data-hadisst-v11. The JRA-55 reanalysis data can be downloaded at https://rda.ucar.edu/datasets/ds628.1/index.html. NCEP Reanalysis data is provided at https://psl.noaa.gov/data/gridded/data.ncep.reanalysis.html. ERA-Interim is from https://www.ecmwf.int/en/forecasts/datasets/. The MRI-AGCM model experiments are carried out by Japan Meteorological Agency (model documentation can be found at http://www.glisaclimate.org/model-inventory/meteorological-research-institute-agcm-version-32s).
Author Contributions
Conceptualization: JC, C-YT, ZW, and KC; data collection and analysis: JC and HM; methodology: JC, C-YT, ZW, KC, HM, and N-CL; writing original draft: JC; all the co-authors participated the manuscript review and editing.
Funding
C-YT and ZW was supported by the National Key Research and Development Program of China (Ref. No. 2019YFC1510400). C-YT was also supported by the Hong Kong Research Grant Council’s General Research Fund (No. 14306115) and the Shenzhen Research Institute, the Chinese University of Hong Kong (Grant No. 2019YFC1510402). ZW is supported by Guangdong Major Project of Basic and Applied Basic Research (2020B0301030004). JC is supported by the National Natural Science Foundation of China (Grant No. 42105161). The appointment of N-CL at The Chinese University of Hong Kong was supported by a professorship of the AXA Research Fund.
Conflict of Interest
The authors declare that the research was conducted in the absence of any commercial or financial relationships that could be construed as a potential conflict of interest.
Publisher’s Note
All claims expressed in this article are solely those of the authors and do not necessarily represent those of their affiliated organizations, or those of the publisher, the editors, and the reviewers. Any product that may be evaluated in this article, or claim that may be made by its manufacturer, is not guaranteed or endorsed by the publisher.
Acknowledgments
The authors acknowledge the MRI-AGCM model group in the Japan Meteorological Agency for MRI-AGCM model ensemble data. The authors would like to thank the editor and reviewers for their constructive comments.
References
Bengtsson, L., Botzet, M., and Esch, M. (1996). Will Greenhouse Gas-Induced Warming over the Next 50 Years lead to Higher Frequency and Greater Intensity of Hurricanes? Tellus A 48 (1), 57–73. doi:10.1034/j.1600-0870.1996.00004.x
Berrisford, P., Dee, D., Fielding, K., Fuentes, M., Kållberg, P., et al. (2009). The ERA-Interim Archive. ERA Rep. Ser. 1, 1–16.
Bhatia, K. T., Vecchi, G. A., Knutson, T. R., Murakami, H., Kossin, J., Dixon, K. W., et al. (2019). Recent Increases in Tropical Cyclone Intensification Rates. Nat. Commun. 10 (1), 635–639. doi:10.1038/s41467-019-08471-z
Bosse, F. (2020). Slower Decay of Landfalling Hurricanes in a Warmer World - Really Clim. Etc 587, 230-234. Available at: https://judithcurry.com/2020/11/17/slower-decay-of-landfalling-hurricanes-in-a-warmer-world-really/.
Camargo, S. J., and Sobel, A. H. (2005). Western North Pacific Tropical Cyclone Intensity and ENSO. J. Clim. 18 (15), 2996–3006. doi:10.1175/jcli3457.1
Cerveny, R. S. (2017). WMO Assessment of Weather and Climate Mortality Extremes: Lightning, Tropical Cyclones, Tornadoes, and Hail. Weather, Clim. Soc. 9 (3), 487–497. doi:10.1175/wcas-d-16-0120.1
Chan, J. C. (2008). Decadal Variations of Intense Typhoon Occurrence in the Western North Pacific. Proc. R. Soc. A: Math. Phys. Eng. Sci. 464 (2089), 249–272. doi:10.1098/rspa.2007.0183
Chavas, D., and Chen, J. (2020). Tropical Cyclones Could Last Longer after Landfall in a Warming World. Nature 587, 200–201. doi:10.1038/d41586-020-03118-2
Chen, G., and Tam, C.-Y. (2010). Different Impacts of Two Kinds of Pacific Ocean Warming on Tropical Cyclone Frequency over the Western north pacific. Geophys. Res. Lett. 37 (1), L01803. doi:10.1029/2009gl041708
Chen, J., Wang, Z., Tam, C. Y., Lau, N. C., Lau, D. S. D., and Mok, H. Y. (2020). Impacts of Climate Change on Tropical Cyclones and Induced Storm Surges in the Pearl River Delta Region Using Pseudo-global-warming Method. Scientific Rep. 10 (1), 1–10. doi:10.1038/s41598-020-58824-8
Chen, W., Dong, B., Wilcox, L., Luo, F., Dunstone, N., and Highwood, E. J. (2019). Attribution of Recent Trends in Temperature Extremes over China: Role of Changes in Anthropogenic Aerosol Emissions over Asia. J. Clim. 32 (21), 7539–7560. doi:10.1175/jcli-d-18-0777.1
Chen, X., Wu, L., and Zhang, J. (2011). Increasing Duration of Tropical Cyclones over china. Geophys. Res. Lett. 38 (2).L02708 doi:10.1029/2010gl046137
Coats, S., and Karnauskas, K. B. (2017). Are Simulated and Observed Twentieth century Tropical Pacific Sea Surface Temperature Trends Significant Relative to Internal Variability? Geophys. Res. Lett. 44 (19), 9928–9937. doi:10.1002/2017gl074622
Elsner, J. B., Kossin, J. P., and Jagger, T. H. (2008). The Increasing Intensity of the Strongest Tropical Cyclones. Nature 455 (7209), 92–95. doi:10.1038/nature07234
Emanuel, K. A. (1988). The Maximum Intensity of Hurricanes. J. Atmos. Sci. 45 (7), 1143–1155. doi:10.1175/1520-0469(1988)045<1143:tmioh>2.0.co;2
Giorgi, F., Bi, X., and Qian, Y. (2002). Direct Radiative Forcing and Regional Climatic Effects of Anthropogenic Aerosols over East Asia: A Regional Coupled Climate‐chemistry/aerosol Model Study. J. Geophys. Res. Atmospheres 107 (D20), 7-18. doi:10.1029/2001jd001066
Gray, W. M. (1968). Global View of the Origin of Tropical Disturbances and Storms. Monthly Weather Rev. 96 (10), 669–700. doi:10.1175/1520-0493(1968)096<0669:gvotoo>2.0.co;2
Kalnay, E., Kanamitsu, M., Kistler, R., Collins, W., Deaven, D., and Gandin, L. (1996). The NCEP/NCAR 40-year Reanalysis Project. Bull. Am. Meteorol. Soc. 77 (3), 437–472. doi:10.1175/1520-0477(1996)077<0437:tnyrp>2.0.co;2
Kaplan, J., and DeMaria, M. (1995). A Simple Empirical Model for Predicting the Decay of Tropical Cyclone Winds after Landfall. J. Appl. meteorology 34 (11), 2499–2512. doi:10.1175/1520-0450(1995)034<2499:asemfp>2.0.co;2
Karamperidou, C., Jin, F. F., and Conroy, J. L. (2017). The Importance of ENSO Nonlinearities in Tropical pacific Response to External Forcing. Clim. Dyn. 49 (7-8), 2695–2704. doi:10.1007/s00382-016-3475-y
Khouakhi, A., Villarini, G., and Vecchi, G. A. (2017). Contribution of Tropical Cyclones to Rainfall at the Global Scale. J. Clim. 30 (1), 359–372. doi:10.1175/jcli-d-16-0298.1
Kim, H. M., Webster, P. J., and Curry, J. A. (2011). Modulation of North Pacific Tropical Cyclone Activity by Three Phases of ENSO. J. Clim. 24 (6), 1839–1849. doi:10.1175/2010jcli3939.1
Knapp, K. R., Diamond, H. J., Kossin, J. P., Kruk, M. C., and Schreck, C. J. (2018). International Best Track Archive for Climate Stewardship (IBTrACS) Project, Version 4. NOAA National Centers for Environmental Information. doi:10.25921/82ty-9e16
Knapp, K. R., Kruk, M. C., Levinson, D. H., Diamond, H. J., and Neumann, C. J. (2010). The International Best Track Archive for Climate Stewardship (IBTrACS): Unifying Tropical Cyclone Data. Bull. Am. Meteorol. Soc. 91 (3), 363–376. doi:10.1175/2009bams2755.1
Knapp, K. R., and Kruk, M. C. (2010). Quantifying Interagency Differences in Tropical Cyclone Best-Track Wind Speed Estimates. Monthly Weather Rev. 138 (4), 1459–1473. doi:10.1175/2009mwr3123.1
Knutson, T. R., McBride, J. L., Chan, J., Emanuel, K., Holland, G., Landsea, C., et al. (2010). Tropical Cyclones and Climate Change. Nat. Geosci. 3 (3), 157–163. doi:10.1038/ngeo779
Knutson, T. R., Camargo, S J, Chan, J C. L, Emanuel, K, Ho, C-H, Kossin, J, et al. (2020). Tropical Cyclones and Climate Change Assessment: Part II: Projected Response to Anthropogenic Warming. Bull. Am. Meteorol. Soc. 101 (3), E303–E322. doi:10.1175/bams-d-18-0194.1
Kobayashi, S., Ota, Y., Harada, Y., Ebita, A., Moriya, M., Onoda, H., et al. (2015). The Jra-55 Reanalysis: General Specifications and Basic Characteristics. J. Meteorol. Soc. Jpn. Ser. 93 (1), 5–48. doi:10.2151/jmsj.2015-001
Kossin, J. P. (2018). A Global Slowdown of Tropical-Cyclone Translation Speed. Nature 558 (7708), 104–107. doi:10.1038/s41586-018-0158-3
Kossin, J. P., Emanuel, K. A., and Camargo, S. J. (2016). Past and Projected Changes in Western North Pacific Tropical Cyclone Exposure. J. Clim. 29 (16), 5725–5739. doi:10.1175/jcli-d-16-0076.1
Kruk, M. C., Knapp, K. R., and Levinson, D. H. (2010). A Technique for Combining Global Tropical Cyclone Best Track Data. J. Atmos. Oceanic Technology 27 (4), 680–692. doi:10.1175/2009jtecha1267.1
Lanzante, J. R. (2019). Uncertainties in Tropical-Cyclone Translation Speed. Nature 570 (7759), E6–E15. doi:10.1038/s41586-019-1223-2
Lee, T.-C., and Wong, C. (2007). “Historical Storm Surges and Storm Surge Forecasting in Hong Kong,” in Hong Kong Observatory, Paper for the JCOMM Scientific and Technical Symposium on Storm Surges (SSS) in Seoul Seoul: Hong Kong Observatory.
Lee, T. C., Knutson, T. R., Nakaegawa, T., Ying, M., and Cha, E. J. (2020). Third Assessment on Impacts of Climate Change on Tropical Cyclones in the Typhoon Committee Region–Part I: Observed Changes, Detection and Attribution. Trop. Cyclone Res. Rev. 9 (1), 1–22. doi:10.1016/j.tcrr.2020.03.001
Li, L., and Chakraborty, P. (2007). Slower Decay of Landfalling Hurricanes in a Warming World. Nature 587, 230–234. doi:10.1038/s41586-020-2867-7
Li, R. C., Zhou, W., Shun, C., and Lee, T. C. (2017). Change in Destructiveness of Landfalling Tropical Cyclones over china in Recent Decades. J. Clim. 30 (9), 3367–3379. doi:10.1175/jcli-d-16-0258.1
Liu, L., Wang, Y., Zhan, R., Xu, J., and Duan, Y. (2020). Increasing Destructive Potential of Landfalling Tropical Cyclones over china. J. Clim. 33 (9), 3731–3743. doi:10.1175/jcli-d-19-0451.1
Mei, W., and Xie, S.-P. (2016). Intensification of Landfalling Typhoons over the north- West pacific since the Late 1970s. Nat. Geosci. 9 (10), 753–757. doi:10.1038/ngeo2792
Mei, W., Xie, S. P., Primeau, F., McWilliams, J. C., and Pasquero, C. (2015). Northwestern Pacific Typhoon Intensity Controlled by Changes in Ocean Temperatures. Sci. Adv. 1 (4), e1500014. doi:10.1126/sciadv.1500014
Mizuta, R., Arakawa, O., Ose, T., Kusunoki, S., Endo, H., and Kitoh, A. (2014). Classification of Cmip5 Future Climate Responses by the Tropical Sea Surface Temperature Changes. SOLA 10, 167–171. doi:10.2151/sola.2014-035
Moon, I.-J., Kim, S.-H., and Chan, J. C. (2019). Climate Change and Tropical Cyclone Trend. Nature 570 (7759), E3–E5. doi:10.1038/s41586-019-1222-3
Murakami, H., Wang, Y., Yoshimura, H., Mizuta, R., Sugi, M., Shindo, E., et al. (2012b). Future Changes in Tropical Cyclone Activity Projected by the New High-Resolution MRI-AGCM. J. Clim. 25 (9), 3237–3260. doi:10.1175/jcli-d-11-00415.1
Murakami, H., Mizuta, R., and Shindo, E. (2012a). Future Changes in Tropical Cyclone Activity Projected by Multi-Physics and Multi-SST Ensemble Experiments Using the 60-Km-Mesh Mri-Agcm. Clim. Dyn. 39 (9-10), 2569–2584. doi:10.1007/s00382-011-1223-x
Needham, H. F., Keim, B. D., and Sathiaraj, D. (2015). A Review of Tropical Cyclone- Generated Storm Surges: Global Data Sources, Observations, and Impacts. Rev. Geophys. 53 (2), 545–591. doi:10.1002/2014rg000477
Park, D.-S. R., Ho, C.-H., and Kim, J.-H. (2014). Growing Threat of Intense Tropical Cyclones to East Asia over the Period 1977–2010. Environ. Res. Lett. 9 (1), 014008. doi:10.1088/1748-9326/9/1/014008
Park, D. S. R., Ho, C. H., Kim, J. H., and Kim, H. S. (2011). Strong Landfall Typhoons in Korea and Japan in a Recent Decade. J. Geophys. Res. Atmospheres 116 (D7), D07105. doi:10.1029/2010jd014801
Patricola, C. M., and Wehner, M. F. (2018). Anthropogenic Influences on Major Tropical Cyclone Events. Nature 563 (7731), 339–346. doi:10.1038/s41586-018-0673-2
Pielke, R. A., Landsea, C., Mayfield, M., Layer, J., and Pasch, R. (2005). Hurricanes and Global Warming. Bull. Am. Meteorol. Soc. 86 (11), 1571–1576. doi:10.1175/bams-86-11-1571
Rayner, N., Parker, D. E., Horton, E. B., Folland, C. K., Alexander, L. V., Rowell, D. P., et al. (2003). Global Analyses of Sea Surface Temperature, Sea Ice, and Night marine Air Temperature since the Late Nineteenth century. J. Geophys. Res. Atmospheres 108 (D14), 4407. doi:10.1029/2002jd002670
Roberts, M. J., Camp, J, Seddon, J, Vidale, P L, Hodges, K, Vanniere, B, et al. (2020). Impact of Model Resolution on Tropical Cyclone Simulation Using the HighResMIP–PRIMAVERA Multimodel Ensemble. J. Clim. 33 (7), 2557–2583. doi:10.1175/jcli-d-19-0639.1
Seager, R., Cane, M., Henderson, N., Lee, D. E., Abernathey, R., and Zhang, H. (2019). Strengthening Tropical Pacific Zonal Sea Surface Temperature Gradient Consistent with Rising Greenhouse Gases. Nat. Clim. Change 9 (7), 517–522. doi:10.1038/s41558-019-0505-x
Strachan, J., Vidale, P. L., Hodges, K., Roberts, M., and Demory, M. E. (2013). Investigating Global Tropical Cyclone Activity with a Hierarchy of AGCMs: The Role of Model Resolution. J. Clim. 26 (1), 133–152. doi:10.1175/jcli-d-12-00012.1
Wang, B., and Chan, J. C. (2002). How strong ENSO Events Affect Tropical Storm Activity over the Western North Pacific. J. Clim. 15 (13), 1643–1658. doi:10.1175/1520-0442(2002)015<1643:hseeat>2.0.co;2
Wang, S., and Toumi, R. (2018). Reduced Sensitivity of Tropical Cyclone Intensity and Size to Sea Surface Temperature in a Radiative-Convective Equilibrium Environment. Adv. Atmos. Sci. 35 (8), 981–993. doi:10.1007/s00376-018-7277-5
Webster, P. J., Holland, G. J., Curry, J. A., and Chang, H.-R. (2005). Changes in Tropical Cyclone Number, Duration, and Intensity in a Warming Environment. Science 309 (5742), 1844–1846. doi:10.1126/science.1116448
Wong, M. L., and Chan, J. C. (2004). Tropical Cyclone Intensity in Vertical Wind Shear. J. Atmos. Sci. 61 (15), 1859–1876. doi:10.1175/1520-0469(2004)061<1859:tciivw>2.0.co;2
Xu, K., Tam, C.-Y., Zhu, C., Liu, B., and Wang, W. (2017). CMIP5 Projections of Two Types of El Niño and Their Related Tropical Precipitation in the 21st Century. J. Clim. 30, 849–864 doi:10.1175/JCLI-D-16-0413.1
Zhao, H., and Wang, C. (2019). On the Relationship between ENSO and Tropical Cyclones in the Western North Pacific during the Boreal Summer. Clim. Dyn. 52 (1-2), 275–288. doi:10.1007/s00382-018-4136-0
Zhao, P., Wang, B., and Zhou, X. (2012). Boreal Summer continental Monsoon Rainfall and Hydroclimate Anomalies Associated with the Asian-Pacific Oscillation. Clim. Dyn. 39 (5), 1197–1207. doi:10.1007/s00382-012-1348-6
Zhao, P., Zhu, Y., and Zhang, R. (2007). An Asian–Pacific Teleconnection in Summer Tropospheric Temperature and Associated Asian Climate Variability. Clim. Dyn. 29 (2-3), 293–303. doi:10.1007/s00382-007-0236-y
Zhou, B., Cui, X., and Zhao, P. (2008). Relationship between the Asian-Pacific Oscillation and the Tropical Cyclone Frequency in the Western north pacific. Sci. China Ser. D: Earth Sci. 51 (3), 380–385. doi:10.1007/s11430-008-0014-7
Keywords: tropical cyclone, global warming, East and Southeast Asia, inland impacts, high-resolution model
Citation: Chen J, Tam C-Y, Cheung K, Wang Z, Murakami H, Lau N-C, Garner ST, Xiao Z, Choy C-W and Wang P (2021) Changing Impacts of Tropical Cyclones on East and Southeast Asian Inland Regions in the Past and a Globally Warmed Future Climate. Front. Earth Sci. 9:769005. doi: 10.3389/feart.2021.769005
Received: 01 September 2021; Accepted: 22 October 2021;
Published: 30 November 2021.
Edited by:
Gen Li, Hohai University, ChinaReviewed by:
Tao Feng, Hohai University, ChinaChao Wang, Nanjing University of Information Science and Technology, China
Copyright © 2021 Chen, Tam, Cheung, Wang, Murakami, Lau, Garner, Xiao, Choy and Wang. This is an open-access article distributed under the terms of the Creative Commons Attribution License (CC BY). The use, distribution or reproduction in other forums is permitted, provided the original author(s) and the copyright owner(s) are credited and that the original publication in this journal is cited, in accordance with accepted academic practice. No use, distribution or reproduction is permitted which does not comply with these terms.
*Correspondence: Chi-Yung Tam, RnJhbmNpcy5UYW1AY3Voay5lZHUuaGs=