 Haibo Zhou1,3
 Ke Fan2*
- 1Institute of Atmospheric Physics, Chinese Academy of Sciences, Beijing, China
- 2School of Atmospheric Sciences, Sun Yat-sen University, and Southern Marine Science and Engineering Guangdong Laboratory (Zhuhai), Zhuhai, China
- 3University of the Chinese Academy of Sciences, Beijing, China
This study reveals an intensified impact of winter (November–February mean) Arctic Oscillation (AO) on simultaneous precipitation over the mid–high latitudes of Asia (MHA) since the early 2000s. The unstable relationship may be related to the changes in the tropospheric AO mode and the subtropical jet. Further analyses suggest that their changes may be attributable to the interdecadal changes in the stratospheric polar vortex. During 2002–2017, the anomalously weak stratospheric polar vortex is accompanied by intensified upward-propagating tropospheric planetary-scale waves anomalies. Subsequently, the stratospheric geopotential height anomalies over the North Atlantic high-latitudes propagate downward strongly, causing the changes in the tropospheric AO mode, that is, the positive height anomalies over the North Atlantic high-latitudes are stronger and extend southward, corresponding to the stronger and eastward extension of negative height anomalies over the North Atlantic mid-latitudes. Thus, the Rossby wave source anomalies over Baffin Bay and the Black Sea are strong, and correspondingly so too are their subsequently excited the Rossby waves anomalies. Meanwhile, the planetary-scale waves anomalies propagate weakly along the low-latitude waveguide, causing the intensified and southward shift of the subtropical jet. Therefore, the strong Rossby waves anomalies propagate eastward to the MHA. By contrast, during 1979–1999, the strong stratospheric polar vortex anomaly is accompanied by weak upward-propagating planetary-scale waves anomalies, resulting in weaker height anomalies over the North Atlantic mid–high latitudes. Consequently, the anomalous Rossby waves are weak. In addition, the subtropical jet weakens and shifts northward, which causes the Rossby waves anomalies to dominate over the North Atlantic, and thereby the impact of winter AO on simultaneous precipitation over the MHA is weak.
1 Introduction
Early studies on winter climate variability over the mid–high latitudes of Asia (MHA) focused mostly on cold waves (Tao, 1957; Ding, 1999; Li and Sun, 2003; Wang and Ding, 2006), surface air temperature (SAT) (Li, 1989; Chen et al., 2000; Wang L. et al., 2009), and the underlying physical mechanisms (Wu and Huang, 1999; Gong et al., 2001; Wu and Wang, 2002a), but few on precipitation. Although winter precipitation over the MHA is less than that in summer, in fact, winter precipitation could directly affect the output of crops in the following year (Kiritani, 2007; Zhang and Huang, 2012). Furthermore, anomalous heavy precipitation in the form of snow or freezing rain can exert substantial adverse influences on transportation, the economy and people’s daily lives (Wang and Chen, 2010; Fereday et al., 2012). Studying the variability of winter precipitation over the MHA is therefore of great scientific and societal relevance, especially against the background of global warming.
The East Asia winter monsoon (EAWM), Siberian high and blocking high have marked effects on winter precipitation over the MHA (Shi, 1996; Gong et al., 2002; Li and Sun, 2003; Yang and Li, 2008). Furthermore, Shi (1996) showed that, during strong EAWM years, the circulation anomalies are characterized by a strong western Pacific teleconnection and a weak Eurasia teleconnection. Gong et al. (2002) suggested that Siberian high is significantly related to Arctic Oscillation (AO) and Eurasia teleconnection pattern. Yang and Li (2008) further showed that an intensified AO corresponds to a weakening of Ural blocking high, Aleutian low, and Siberian high, indicting weak EAWM and less precipitation over Inner Mongolia and Xinjiang.
As AO is an important mode of atmospheric circulation in the Northern Hemisphere (NH) extratropics, previous studies have shown that AO has a significant impact on the tropospheric climate variability over the MHA in winter, including EAWM (Gong et al., 2001; Wu and Wang, 2002a, 2002b; Chen et al., 2005), Siberian high (Gong et al., 2001; Wu and Wang, 2002; Huang et al., 2016), SAT (Thompson and Wallace, 1998; Thompson and Wallace, 2000; He and Wang, 2013; Yu et al., 2015; He and Wang, 2016; He et al., 2019) and precipitation (Thompson and Wallace, 2001; Gong and Wang, 2003; Yang and Li, 2008; He et al., 2017).
A considerable part of AO variability is related to the external forcing factors, such as sea surface temperature (Lin et al., 2005; Li et al., 2006; Jia et al., 2009), snow cover (Hardiman et al., 2008; Wu et al., 2011) and Arctic sea ice (Jaiser et al., 2012; Screen et al., 2013; Peings and Magnusdottir, 2014; King et al., 2015; Nakamura et al., 2015; Chen and Wu, 2018). Furthermore, AO exhibits a quasi-barotropic dipole mode over NH mid–high latitudes, extending from the troposphere to the stratosphere, and thus is closely related to the stratospheric polar vortex (Thompson and Wallace, 1998; Thompson and Wallace, 2000). There is an interaction between the stratospheric polar vortex and planetary-scale waves. The strength of the stratospheric polar vortex is modified by upward-propagating planetary-scale waves anomalies (Baldwin and Dunkerton, 1999); meanwhile, the stratospheric polar vortex anomaly, in turn, affects the propagation of planetary-scale waves (Chen and Robinson, 1992; Hartmann et al., 2000; Chen and Wei, 2009). When the stratospheric polar vortex is disturbed, the downward stratospheric influence induces a tropospheric negative AO mode (Baldwin and Dunkerton, 1999, 2001; Ren and Cai, 2007; Wang and Chen, 2010; Peng et al., 2019). The changes in AO-related tropospheric circulation over the MHA in winter could be modulated by stratospheric circulation anomalies (Chen and Kang, 2006; Takaya and Nakamura, 2013; Nath et al., 2014; He et al., 2019).
However, AO mode may have changed in recent years (Zhang et al., 2008; Wang J. et al., 2009; Overland and Wang, 2010; Stroeve et al., 2011). The impact of AO on the climate variability over the MHA is non-stationary (Gao et al., 2014; Li et al., 2014; Chen et al., 2015; Liu et al., 2017a; Liu et al., 2017b). For instance, Li et al. (2014) suggested that the relationship between winter AO and EAWM experienced a significant interdecadal change after the 1980s, which is related to the reduction of autumn Arctic sea-ice cover. Liu et al. (2017a) showed that the interdecadal change between winter AO and simultaneous SAT over East Asia might be attributable to the interdecadal change of AO’s Azores center.
These studies motivate us to speculate the relationship between winter AO and simultaneous precipitation over the MHA might also be unstable. However, previous studies on the unstable impact of winter AO on the MHA climate variability have less focused on the winter precipitation and the role of the stratosphere. Therefore, the primary goal of this study is to analyze the unstable relationship of winter AO with simultaneous precipitation over the MHA and explore its possible causes, including the role of the stratospheric polar vortex.
The rest of the paper is organized as follows: Section 2 describes the datasets and methods. Section 3 reveals the strengthened relationship and AO-related water vapor transport, tropospheric atmospheric circulation, and Rossby waves anomalies. Section 4 analyzes the possible causes. Finally, section 5 provides a conclusion and some discussion.
2 Data and Methods
2.1 Data
The monthly mean large-scale atmospheric circulation variables are from the National Centers for Environmental Prediction/National Center for Atmospheric Research (NCEP/NCAR) Reanalysis, with a horizontal resolution of 2.5° × 2.5° and 17 vertical pressure levels (Kalnay, 1996), and the Hadley Center SLP (HadSLP2r) with a 5° × 5° latitude–longitude resolution (Allan and Ansell, 2006). The variables used include SLP, 2-m temperature, specific humidity from 1,000 to 300 hPa, zonal wind, meridional wind, air temperature, and geopotential height at all levels.
Four precipitation datasets are employed in this study: (1) the Climatic Research Unit (CRU) monthly precipitation dataset, with a high horizontal resolution of 0.5° × 0.5° (CRU_TS_4) (Harris et al., 2020); (2) the Global Precipitation Climatology Centre (GPCC) monthly total precipitation dataset, with a horizontal resolution of 2.5° × 2.5° (GPCC_2018) (Becker et al., 2012); (3) the Global Precipitation Climatology Project (GPCP) monthly precipitation dataset, with a 2.5° × 2.5° latitude–longitude resolution (GPCP_2.3) (Adler et al., 2018), and (4) the Precipitation Reconstruction over Land (PREC/L) monthly precipitation dataset, with a 2.5° × 2.5° latitude–longitude resolution (Chen et al., 2002).
Four indices are used in this study. (1) AO index (AOI) is defined as the leading principal component of 1,000 hPa geopotential height anomalies north of 20°N (https://www.cpc.ncep.noaa.gov/products/precip/CWlink/daily_ao_index/ao.shtml). (2) The area-weighted precipitation over the domain of 40°–56°N and 75°–120°E is defined as the precipitation index over the MHA. In addition, (3) the Indian Ocean Dipole index (https://psl.noaa.gov/gcos_wgsp/Timeseries/DMI/), and (4) the Nino 3.4 index (https://psl.noaa.gov/data/correlation/nina34.anom.data) are also adopted. All indices are detrended and normalized.
The time period is from 1979 to 2017. By analyzing the temporal correlation coefficients (CCs) of annual cycles of the land precipitation’s climatology and its standard deviation over the MHA (40°–80°N, 60°–180°E) (figure not shown), we find that the precipitation variabilities over the region present a high spatial coherence during November–February. Hence, the winter in this study refers to the monthly means of November, December, January and February.
2.2 Methods
The quasi-geostrophic Eliassen–Palm (EP) flux is calculated to measure the wave intensity and wave propagation (Andrews et al., 1987). The EP flux (F) and its divergence (∇ ⋅ F) (Edmon et al., 1980) are defined as follow:
The mean zonal momentum equation is defined as*
where
Moreover, the Rossby wave source (Sardeshmukh and Hoskins, 1988), the horizontal wave activity fluxes (Takaya and Nakamura, 2001), and the vertically (surface to 300 hPa) integrated water vapor transport (Sun et al., 2011) are calculated. The significance of all analyses is determined using the two-tailed Student’s t-test.
3 Interdecadal Change of the Relationship Between AO and Simultaneous Precipitation Over the MHA
3.1 Intensified Impact of Winter AO on Simultaneous Precipitation Over the MHA Since the Early 2000s
It is found that winter AOI is significantly negatively correlated with simultaneous precipitation index over the MHA during 1979–2017 (Table 1). To detect whether instability exists in this relationship, we calculate the 13-years sliding CCs between the two indices (Figure 1). No significant correlations are observed before the early 2000s, whereas significantly negative correlations are detected after the early 2000s, implying that winter AO might have an intensified impact on precipitation over the MHA after the early 2000s. To verify the results, we repeated the above analyses using the GPCC and PREC/L data, and obtained similar results (figure not shown), suggesting that this interdecadal change is robust.
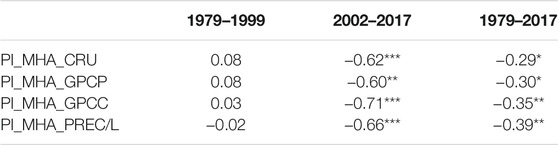
TABLE 1. The correlation coefficients between winter Arctic Oscillation index (AOI) and simultaneous precipitation index over the mid–high latitudes of Asia (40°–56°N, 75°–120°E) (PI_MHA) in the periods of 1979–1999, 2002–2017 and 1979–2017. The PI_MHA is derived from the four precipitation datasets (CRU, GPCP, GPCC, and PREC/L). The *, **, *** indicate statistical significance at the 90, 95, 99% confidence level based on the Student’s t-test, respectively.
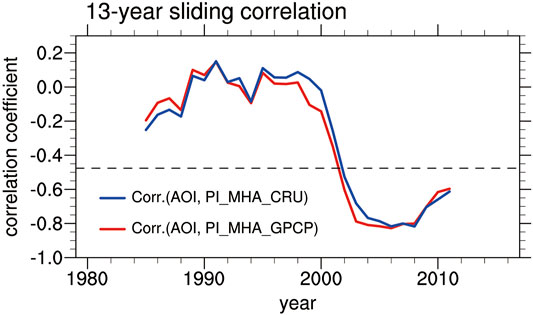
FIGURE 1. 13-years sliding correlation coefficients between winter Arctic Oscillation index (AOI) and simultaneous precipitation index over the MHA (PI_MHA) derived from CRU (PI_MHA_CRU; blue curve) and GPCP (PI_MHA_GPCP; red curve) data. Both indices are detrended and normalized. The horizontal dashed lines denote the 90% confidence level based on the Student’s t-test.
Some aspects of the climate are confirmed to have a turning point around the 2000s (England et al., 2014; Xu et al., 2015; Li et al., 2019). Motivated by these studies, we conducted the 13-years moving t-test on AOI during 1979–2017 (figure not shown) and found that AO exhibits an interdecadal change around the year 2000. Consequently, combining the 13-years sliding CCs (Figure 1) and AO’s turning point, we split the study period into two sub-periods (1979–1999 and 2002–2017) for the following comparative analyses.
The CCs between winter AOI and simultaneous precipitation index over the MHA derived from the CRU, GPCP, GPCC and PREC/L data is −0.62 (0.08), −0.60 (0.08),−0.71 (0.03) and −0.66 (−0.02), respectively (Table 1), confirming that winter AO is significantly (insignificantly) correlated with simultaneous precipitation over the MHA during 2002–2017 (1979–1999). Furthermore, we perform a statistical test on the CCs in the two periods based on the 1,000 bootstrap replicates in R-project, and the results also show that the interdecadal change in Table 1 and Figure 1 is reasonable. Because the CCs are negative in 1979–2017 and 2002–2017, the AOI multiplied by −1 (−AOI) is used in the following analyses for convenience. The precipitation anomalies over the MHA regressed upon −AOI in the two periods are displayed in Figure 2. The significant positive precipitation anomalies are observed over the MHA during 2002–2017 (Figures 2B,D); however, during 1979–1999, there are only sporadic significant precipitation anomalies (Figures 2A,C). We repeated the above analyses using the GPCC and PREC/L data and obtained similar results (figure not shown).
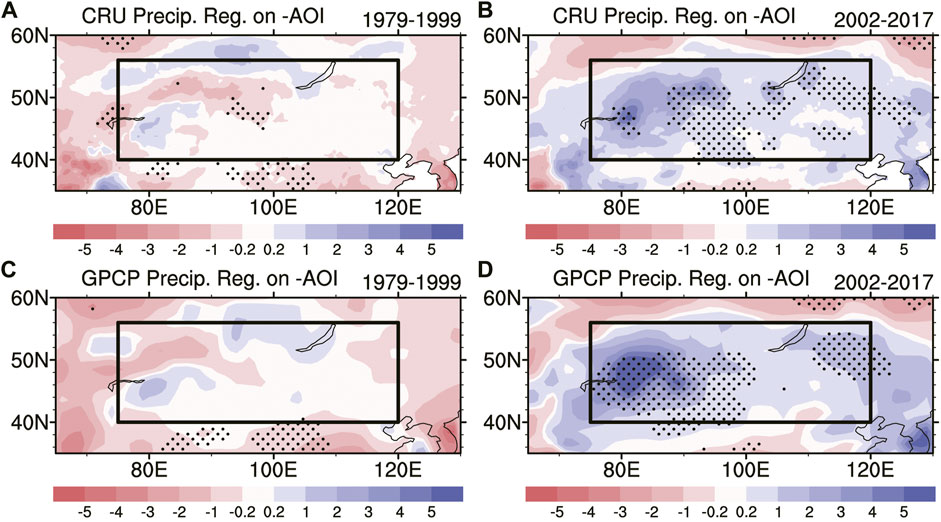
FIGURE 2. (A, B) Regression maps of the winter precipitation (units: mm month−1) upon AOI multiplied by −1 (−AOI) during (A) 1979–1999 and (B) 2002–2017. The precipitation in (A, B) is derived from the CRU data. (C, D) As in (A, B) but for the results derived from the GPCP data. The black frame denotes the location of the study area (40°–56°N, 75°–120°E). The dotted areas indicate statistical significance at the 95% confidence level based on the Student’s t-test.
3.2 Differences in Water Vapor Transport and Tropospheric Circulation Anomalies Between 1979–1999 and 2002–2017
Figure 3 displays the 850-hPa horizontal wind, water vapor transport and its divergence, 2-m temperature, and 200-hPa zonal wind regressed upon −AOI in the two periods. For the MHA, there is a significant lower-level wind convergence anomaly over the MHA in 2002–2017 (Figure 3B). During 1979–1999, however, there are no significant lower-level wind convergence or divergence anomalies over this region (Figure 3A). Furthermore, the distribution of water vapor transport anomalies is highly similar to the anomalous lower-level wind distribution. During 1979–1999, the significant easterly anomalies prevailing over the North Pacific high-latitudes to convey cold and dry air to the MHA, and there are no significant convergence and divergence anomalies of water vapor over this region (Figure 3C), which is consistent with the results obtained from Figures 2A,C. However, during 2002–2017, three branches of water vapor transport anomalies reach the MHA and form a water vapor convergence region (Figure 3D): the first is significant westerly anomalies in the south flank of the anomalous cyclone prevailing over the North Atlantic mid-latitudes to convey warm wet air to the MHA; the second is southwesterly anomalies over the Red Sea transporting warm wet air to the Caspian Sea, which turns into the westerly flow to the MHA; and the last is easterly anomalies of the weak polar vortex over the North Pacific mid–high latitudes transporting cold and dry air to the MHA. Because the water vapor anomalies mostly come from the low-latitudes, the temperature on the south side of the MHA is anomalously high (Figure 3F). Moreover, the convergence region of cold and warm air corresponds to more anomalous precipitation (Figures 3F vs 2B,D).
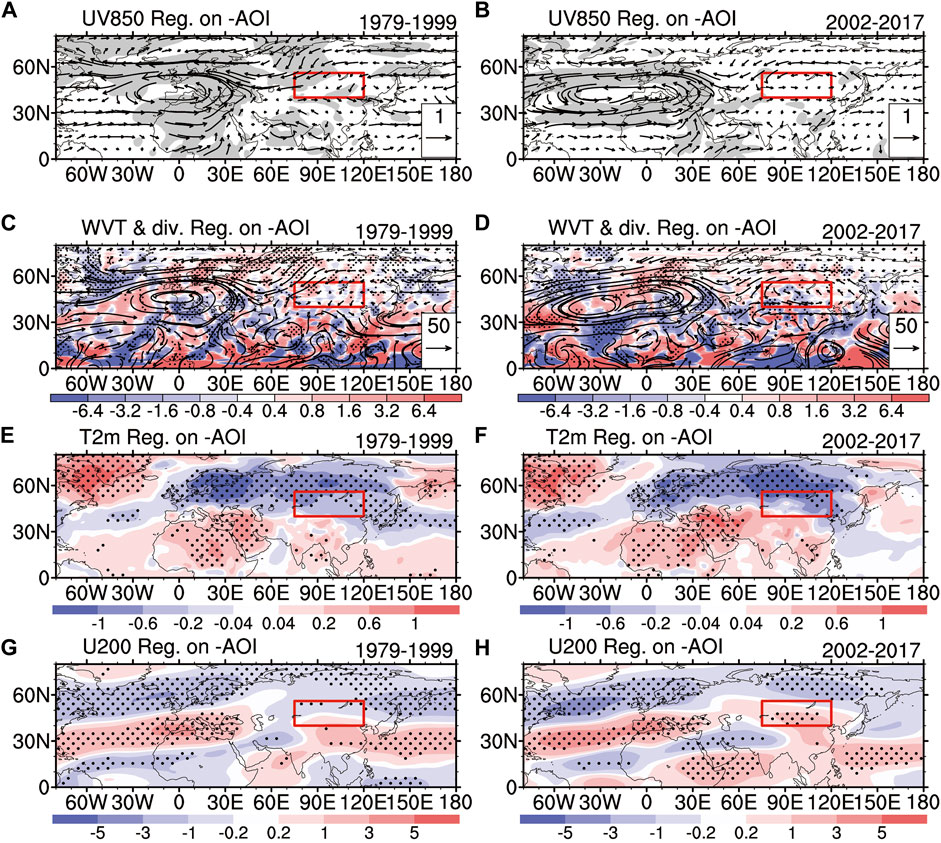
FIGURE 3. Regression maps of the (A, B) horizontal wind (units: m s−1) at 850 hPa, (C, D) vertically integrated (surface to 300 hPa) water vapor transport (vectors; units: kg m−1 s−1) and its divergence (shading, 10–6 kg m−2 s−1), (E, F) air temperature (units: °C) at 2-m, and (G, H) zonal wind (units: m s−1) at 200 hPa upon −AOI during (left panel) 1979–1999 and (right panel) 2002–2017. The red frame denotes the location of the study area (40°–56°N, 75°–120°E). The shaded areas in (A, B) and the dotted areas in (C, D, E, F, G, H) indicate statistical significance at the 95% confidence level based on the Student’s t-test.
It is interesting that lower-level zonal wind and water vapor transport anomalies over the North Atlantic mid–high latitudes also show significant differences in the two periods. Both anomalous patterns show the negative North Atlantic Oscillation (NAO) pattern (Figures 3A–D). However, their strength shows significant differences. The strength of significant lower-level wind convergence anomaly over the North Atlantic mid-latitudes during 2002–2017 is strong, and its anomaly center ranges from the mid-latitudes of the North Atlantic Ocean to western Europe (Figure 3B). Thus, the strong westerly anomalies over the south side of the anomalous cyclone facilitate transporting water vapor from the North Atlantic Ocean and the Red Sea to the MHA (Figure 3D). By contrast, during 1979–1999, the strength of lower-level wind convergence anomaly is relatively weak, which is characterized by a relatively stronger center over western Europe and a weaker center over the east coast of the United States (Figure 3A). Therefore, the weak westerly anomalies over the south side of the anomalous cyclone are not sufficient to transport water vapor from the North Atlantic Ocean and the Red Sea to the MHA (Figure 3C). Furthermore, the upper-level zonal wind anomalies over this region also show the negative NAO pattern. The significant easterly anomalies along 40°–60°N and the significant westerly anomalies along 20°–40°N in 2002–2017 are stronger than those in 1979–1999 (Figures 3G,H). These results indicate that the water vapor transport anomalies are more favorable for the occurring of precipitation over the MHA in 2002–2017 than that in 1979–1999.
Figure 4 shows the geopotential height anomalies at 200-hPa (contours) regressed upon −AOI in the two periods. It can be seen that the negative height anomalies over the MHA in 2002–2017 are stronger than that in 1979–1999. Moreover, both the height anomalies over the North Atlantic mid–high latitudes exhibit the negative NAO pattern. However, the location and strength of the height anomalies in the two periods are significantly different. The positive height anomalies over the North Atlantic high-latitudes in 2002–2017 are stronger, corresponding to the negative height anomalies over the North Atlantic mid-latitudes also being stronger (Figure 4B). However, during 1979–1999, the positive anomalies over the North Atlantic high-latitudes are relatively weak, corresponding to the relatively weak negative anomalies over the North Atlantic mid-latitudes (Figure 4A). Besides the strength, there are also differences in the locations. Compared with 1979–1999, the positive height anomalies over the North Atlantic high-latitudes in 2002–2017 move westward and southward, which correspond to the negative height anomalies over the North Atlantic mid-latitudes moving eastward.
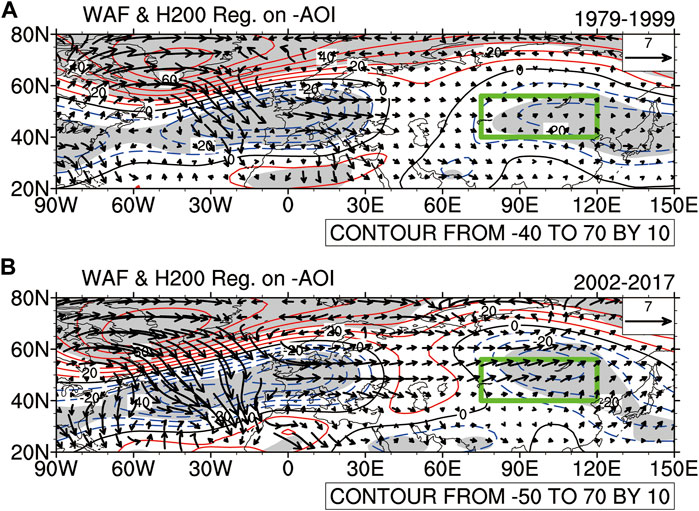
FIGURE 4. (A, B) Regression maps of the Rossby wave activity fluxes (vectors; units: m2 s−2) and geopotential height (contours; units: gpm) at 200 hPa upon −AOI during (A) 1979–1999 and (B) 2002–2017. The green frame denotes the location of the study area (40°–56°N, 75°–120°E). The shaded areas indicate statistical significance at the 95% confidence level based on the Student’s t-test.
3.3 Differences in Tropospheric Rossby Waves Anomalies Between 1979–1999 and 2002–2017
Is there any connection between the anomalous meridional dipole pattern over the North Atlantic mid–high latitudes and the circulation anomalies over the MHA? The 200-hPa wave activity fluxes (vectors) upon −AOI in the two periods are also presented in Figure 4. During 2002–2017, there is a significant Rossby wave-train anomaly from Baffin Bay to the MHA. As the wave activity fluxes’ divergence region, the Rossby waves anomalies over Baffin Bay first propagate to the southeast, and some of that propagate to western Europe, during which time it is supplemented by the energy of the transverse trough over this region. Then, the Rossby waves anomalies turn and propagate eastward along the subtropical jet waveguide. This stable energy transmission process leads to the maintenance of the negative anomaly center and the transverse trough over western Europe, and this region acts as a relay to disperse the Rossby waves eastward affecting the MHA, and thereby the impact of AO on precipitation over the MHA is significantly intensified. The anomalous Rossby wave-train is also characterized by the zonally oriented anomalous positive-negative-positive-negative geopotential height pattern located in Baffin Bay, western Europe, Caspian Sea, and the MHA (Figure 4B). However, during 1979–1999, the strengths of the wave activity fluxes’ divergence and convergence anomalies that appear alternately over Baffin Bay and western Europe are relatively weak (Figure 4A), and the transverse trough anomalies over western Europe are also relatively weak. The Rossby waves anomalies are dominant over the North Atlantic, and thus the impact of AO on precipitation over the MHA is weak.
Furthermore, the 200-hPa Rossby wave source, divergent winds in the lower and upper troposphere, and SLP anomalies regressed upon −AOI in the two periods are shown in Figure 5. During 2002–2017, the significantly stronger negative SLP anomalies over the mid-latitudes of the North Atlantic Ocean to the Black Sea, consequently, there is a strong convergent wind at the lower-level in the region (Figure 5D). Meanwhile, mass continuity demands a compensating vertical outflow, and thus the Ekman pumping produces ascending motion above the low. At the upper-level, to compensate for the upward inflow, a mass divergence is needed. Thus, an upper-level divergence lies over the lower-level convergence of the region (Figure 5B). According to Rossby wave source theory, such an upper-level divergence can lead to Rossby wave source anomalies occurring over the mid-latitudes of the North Atlantic Ocean and the Black Sea. Similarly, a stronger Rossby wave source anomaly occurs over Baffin Bay, and the associated Rossby waves anomalies over these regions are correspondingly stronger (Figure 4B). Furthermore, compared with 1979–1999, the negative SLP anomalies over the North Atlantic mid-latitudes in 2002–2017 are positioned eastward, meaning the Rossby wave source anomalies are also positioned further east than that in 1979–1999. However, during 1979–1999, the negative (positive) SLP anomalies over the North Atlantic mid-latitudes (high-latitudes) are relatively weak, resulting in the anomalously weak lower-level and upper-level divergent wind over Baffin Bay and western Europe, and thus the Rossby wave source anomalies over these regions are relatively weak (Figure 5A).
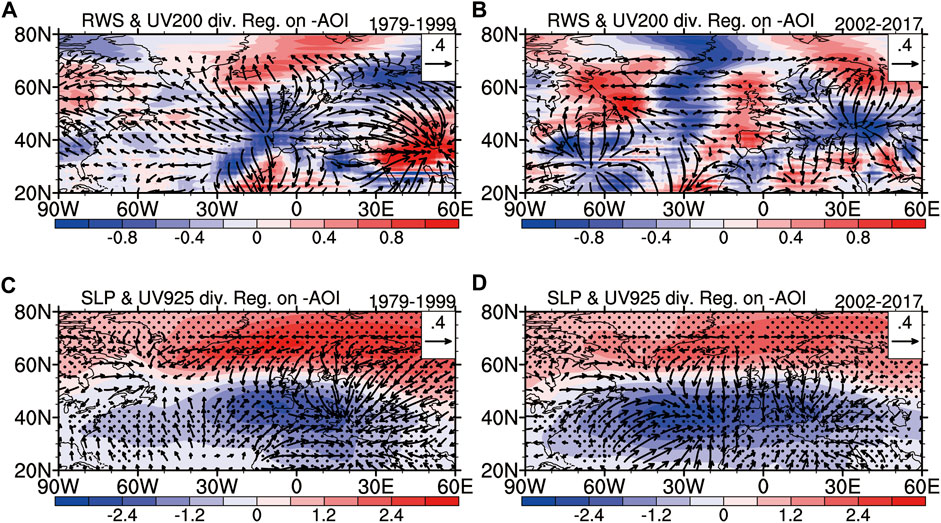
FIGURE 5. (A, B) Regression maps of the Rossby wave source (shading; units: 10–10 s−2) and divergent wind (vectors; units: m s−1) at 200 hPa upon −AOI during (A) 1979–1999 and (B) 2002–2017. (C, D) As in (A, B) but for divergent wind (vectors; units: m s−1) at 925 hPa and SLP (shading; units: hPa). The dotted areas in (C, D) indicate statistical significance at the 95% confidence level based on the Student’s t-test.
3.4 The Linkage Between Differences in North Atlantic Mid–High Latitudes and Those Over the MHA
The above analyses reveal that the different tropospheric circulations anomalies over the MHA in the two periods may be related to the interdecadal changes of the tropospheric circulations anomalies over the North Atlantic mid–high latitudes. Corresponding to the −AOI during 2002–2017, the positive (negative) height anomalies over North Atlantic high-latitudes (mid-latitudes) are stronger (deepened), with the center extending more southward (eastward). This negative AO/NAO pattern produces a strong lower-level divergence (convergence) over Baffin Bay (the Black Sea), in turn stimulates a strong upper-level convergence (divergence) via the Ekman pumping. Correspondingly, the Rossby wave source anomalies over Baffin Bay and the Black Sea are stronger, and then the associated stronger quasi-stationary Rossby waves anomalies propagate more eastward and excite stronger negative height anomalies over the MHA. The negative height anomalies over the MHA then make the water vapor convergence anomalies to provide beneficial conditions for more winter precipitation over this region. Thus, the impact of winter AO on simultaneous precipitation over the MHA is significantly intensified. However, corresponding to the −AOI during 1979–1999, the positive (negative) height anomalies over North Atlantic high-latitudes (mid-latitudes) are relatively weak. The Rossby waves anomalies are relatively weak and mainly confined in the North Atlantic region. Consequently, there is a weak linkage between winter AO and simultaneous precipitation over the MHA.
4 Possible Causes
Why are the tropospheric circulation anomalies and Rossby waves anomalies associated with −AOI significantly different in the two periods? In this section, we analyze its possible causes from the climatological perspective, including the role of the troposphere and stratosphere.
4.1 The Role of the Troposphere
4.1.1 The Interdecadal Change of Climatic Tropospheric AO/NAO Mode
The spatial distribution of the leading EOF mode (EOF1) of SLP anomalies in the two periods and their difference (2002–2017 minus 1979–1999, the same below) are shown in Figure 6. The negative AO mode in the two periods displays remarkable differences in the NH extratropics. Specially, during 1979–1999, the positive SLP anomalies over the polar region are surrounded by two negative SLP anomalies over the mid-latitudes North Pacific and North Atlantic. The intensity of the negative anomalies over the North Atlantic is greater than those over the North Pacific (Figures 6A,D). However, compared with 1979–1999, AO’s spatial pattern during 2002–2017 has undergone significantly changes, especially in the mid-latitudes. The strength of negative anomalies over the North Pacific (North Atlantic) is weakened (intensified) (Figures 6B,E). Besides the strength, the locations of the SLP anomalies over the two regions have also changed. The difference field (Figures 6C,F) clearly shows that, compared with 1979–1999, during 2002–2017, the extent of the positive anomalies over the polar region extending southward to Eurasia continent has been significantly shrunk, corresponding to the eastward extension to the MHA of the negative anomalies over the North Atlantic mid-latitudes. However, the positive anomalies over the North Atlantic high-latitudes shift westward, and are observed over Baffin Bay. Note that the climatic differences of AO mode in the NH extratropics are also consistent with the differences of AO mode regressed upon −AOI (figure not shown).
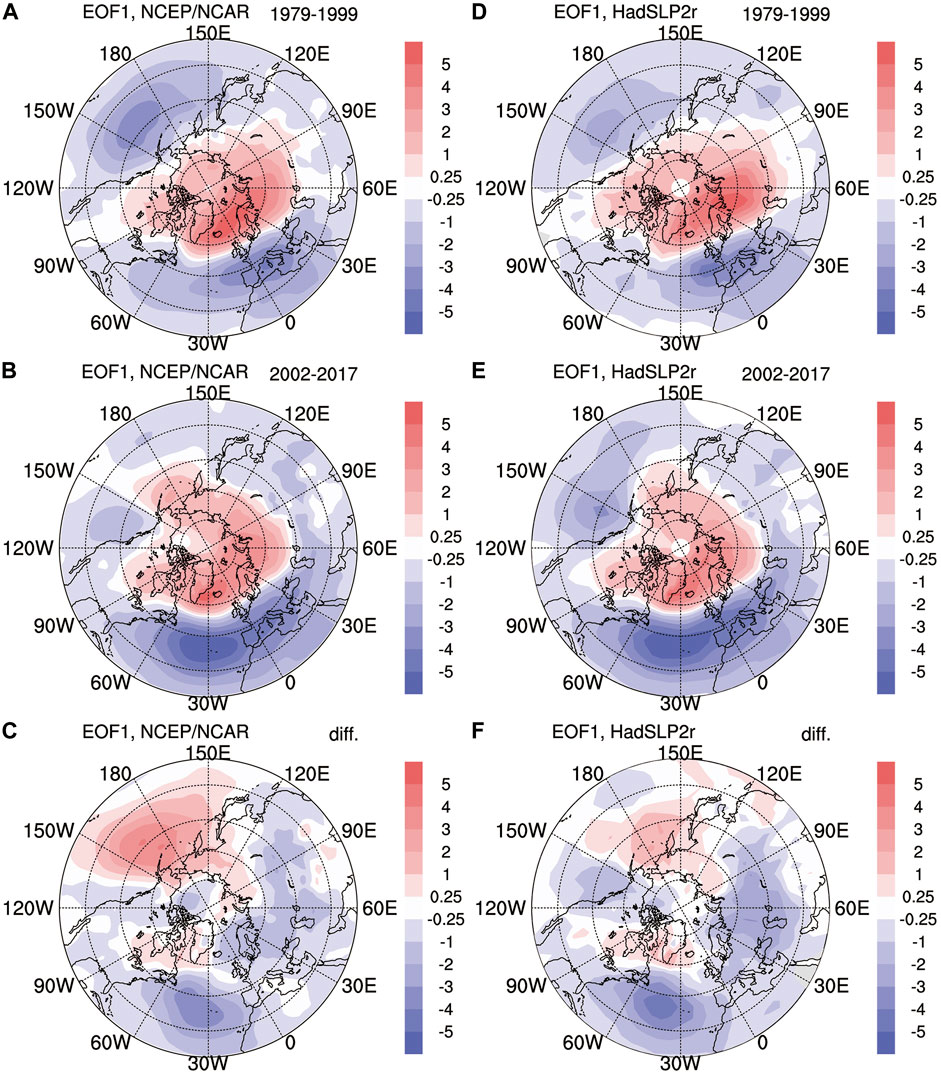
FIGURE 6. (A, B, C) The leading EOF mode of SLP anomalies (units: hPa) north of 20°N during (A) 1979–1999 and (B) 2002–2017, and (C) their difference (2002–2017 minus 1979–1999). Anomalies are calculated based on the climatology of 1979–2017. The variance contribution of (A) and (B) is 38.1 and 31.2%, respectively. The SLP is derived from the NCEP/NCAR dataset. (D, E, F) As in (A, B, C) but for the results derived from the HadSLP2r data. The variance contribution of (D) and (E) is 38.5 and 31.4%, respectively.
4.1.2 The Interdecadal Changes of Climatic Tropospheric Rossby Waves and Subtropical Jet
The climatic anomalies of the 200-hPa wave activity fluxes and geopotential height in the two periods, and their difference are presented in Figure 7. Over Baffin Bay, western Europe, central Eurasia and the MHA, the alternating occurrence of negative (positive)–positive (negative)–negative (positive)–positive (negative) height anomalies exhibit a wave-like pattern (Figures 7A,B). These patterns are also verified by the Rossby waves anomalies. However, the difference field (Figure 7C) shows that, compared with 1979–1999, during 2002–2017, the Rossby waves anomalies over North Atlantic mid–high latitudes are stronger, and so is the strength of their eastward propagation.
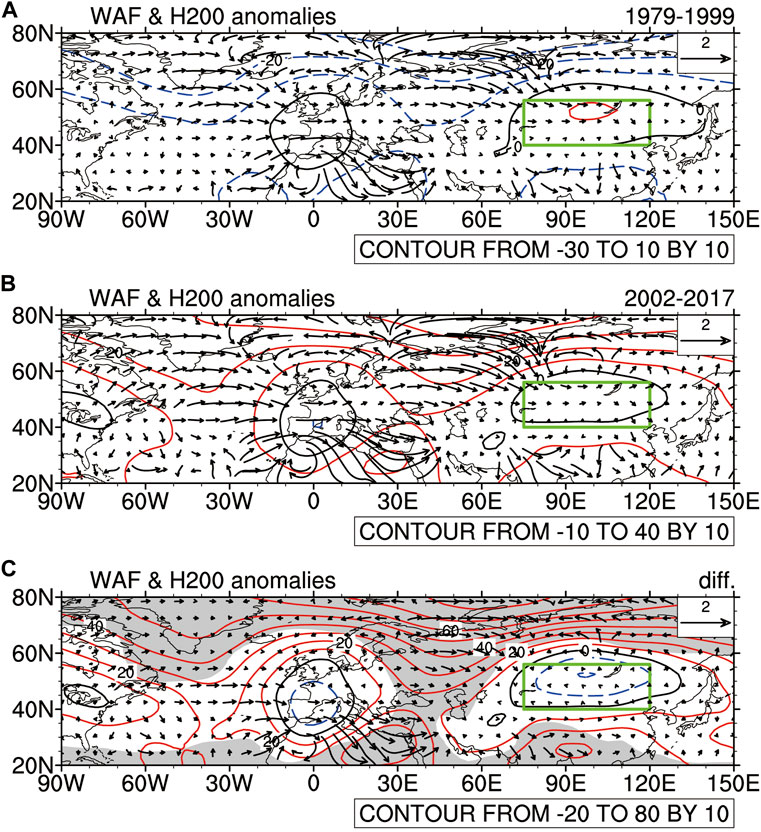
FIGURE 7. (A, B, C) The anomalies of the Rossby wave activity fluxes (vectors; units: m2 s−2) and geopotential height (contours; units: gpm) at 200 hPa during (A) 1979–1999 and (B) 2002–2017, and (C) their difference (2002–2017 minus 1979–1999). Anomalies are calculated based on the climatology of 1979–2017. The green frame denotes the location of the study area (40°–56°N, 75°–120°E). The shaded areas in (C) indicate statistical significance at the 95% confidence level based on the Student’s t-test.
Figure 8 displays the climatic anomalies of 200-hPa Rossby wave source, divergent winds in the lower- and upper-level troposphere, and SLP in the two periods. During 2002–2017, the strong negative SLP anomalies over western Europe make a strong lower-level convergent wind anomaly (Figure 8D). Accordingly, an upper-level divergence lies over the region, so there is a strong Rossby wave source anomaly over western Europe (Figure 8B). Similarly, a strong Rossby wave source anomaly is observed over Baffin Bay. By contrast, during 1979–1999, the SLP anomalies over North Atlantic mid–high latitudes are relatively weak (Figure 8C). Correspondingly, the Rossby wave source anomalies over western Europe and Baffin Bay are also relatively weak (Figure 8A).
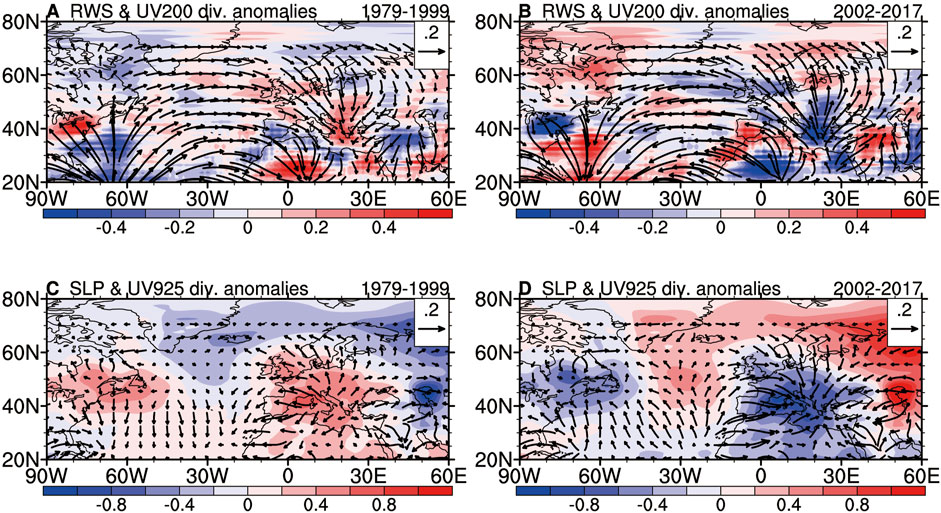
FIGURE 8. (A, B) The anomalies of the Rossby wave source (shading; units: 10–10 s−2) and divergent wind (vectors; units: m s−1) at 200 hPa during (A) 1979–1999 and (B) 2002–2017. Anomalies are calculated based on the climatology of 1979–2017. (C, D) As in (A, B) but for divergent wind (vectors; units: m s−1) at 925 hPa and SLP anomalies (shading; units: hPa).
Moreover, both −AOI-related and climatic tropospheric Rossby waves anomalies affecting the MHA propagate eastward along the climatological subtropical jet (Figures 4, 7). The climatic anomalies of 200-hPa zonal wind over Eurasia in the two periods, and their difference is thus analyzed (figure not shown). During 1979–1999, the subtropical jet weakens. However, during 2002–2017, it intensifies, and the anomalous ‘north-negative-south-positive’ zonal wind distribution indicates that the subtropical jet has shifted southward.
4.1.3 The Linkage Between the Interdecadal Changes of Climatic Tropospheric Circulations and the Unstable Relationship Between Winter AO and Simultaneous Precipitation Over the MHA
The mean differences between the two periods provide different climate backgrounds for the interannual relationship between winter AO and simultaneous precipitation over the MHA in two periods. The interdecadal changes of climatic tropospheric AO/NAO mode, tropospheric Rossby waves, and tropospheric subtropical jet may be plausible reasons for the unstable relationship between winter AO and simultaneous precipitation over the MHA.
Firstly, compared with 1979–1999, the positive (negative) SLP anomalies over North Atlantic high-latitudes (mid-latitudes) during 2002–2017 are stronger (deepened), with the center shifting more southward (eastward) (Figures 6C,F), which are consistent with the −AOI-related interannual anomaly over these regions in the corresponding period. Thus, the interdecadal change in climatic anomalies of AO/NAO mode may be the reason for the interdecadal change of interannual AO/NAO mode. Then, the −AOI-related stronger tropospheric Rossby waves anomalies over North Atlantic mid–high latitudes propagate eastward to the MHA during 2002–2017 (Figure 4B). Interestingly, the strengths of the climatic anomalies of the tropospheric Rossby waves over North Atlantic mid–high latitudes during 2002–2017 are also stronger, so too are their intensity of eastward propagation (Figure 7C), indicating that −AOI-related interannual stronger tropospheric eastward-propagating Rossby waves anomalies in 2002–2017 could be related to their climatic anomalies. Besides, the intensified and southward shift of the climatic subtropical jet during 2002–2017 may be the reason for the intensified eastward propagation of −AOI-related Rossby waves anomalies in this period.
In summary, the interdecadal changes of the climatic tropospheric AO/NAO mode, Rossby waves, and subtropical jet are conducive to the occurring of the unstable relationship between winter AO and simultaneous precipitation over the MHA.
4.2 The Role of the Stratosphere
4.2.1 The Impacts of Interdecadal Change of Climatic Stratospheric Polar Vortex on the Interdecadal Change of Climatic Tropospheric AO/NAO Mode
Figures 9A–C display the climatic anomalies of 50-hPa geopotential height in the two periods, and their difference. During 1979–1999, the negative height anomalies over the polar region are characterized by relatively zonal symmetry (Figure 9A). However, during 2002–2017, the height positive anomalies over the polar region are characterized by significant zonal asymmetry, with positive height anomalies extending to the mid-latitudes over the North Pacific and North Atlantic, respectively (Figure 9B). As shown in the introduction, there is an interaction between the stratospheric polar vortex and planetary-scale waves. The climatic anomalies of the cross-section of zonal-mean EP flux (vectors), EP divergence (green contours) and zonal wind (blue and red contours) in the two periods and their difference, are presented in Figures 9D–F. The weak stratospheric polar vortex anomaly in 2002–2017 is accompanied by intensified upward propagation of tropospheric planetary-scale waves anomalies (Figure 9E). When the stratospheric polar vortex is disturbed, the anomalous stratospheric signal of the geopotential height and zonal wind will propagate down to the troposphere. From the previous analyses we know that North Atlantic mid–high latitudes is the key region in this study, and the changes over the region are related to the interdecadal change. Therefore, we focus on the stratospheric polar vortex anomaly over the North Atlantic mid–high latitudes.
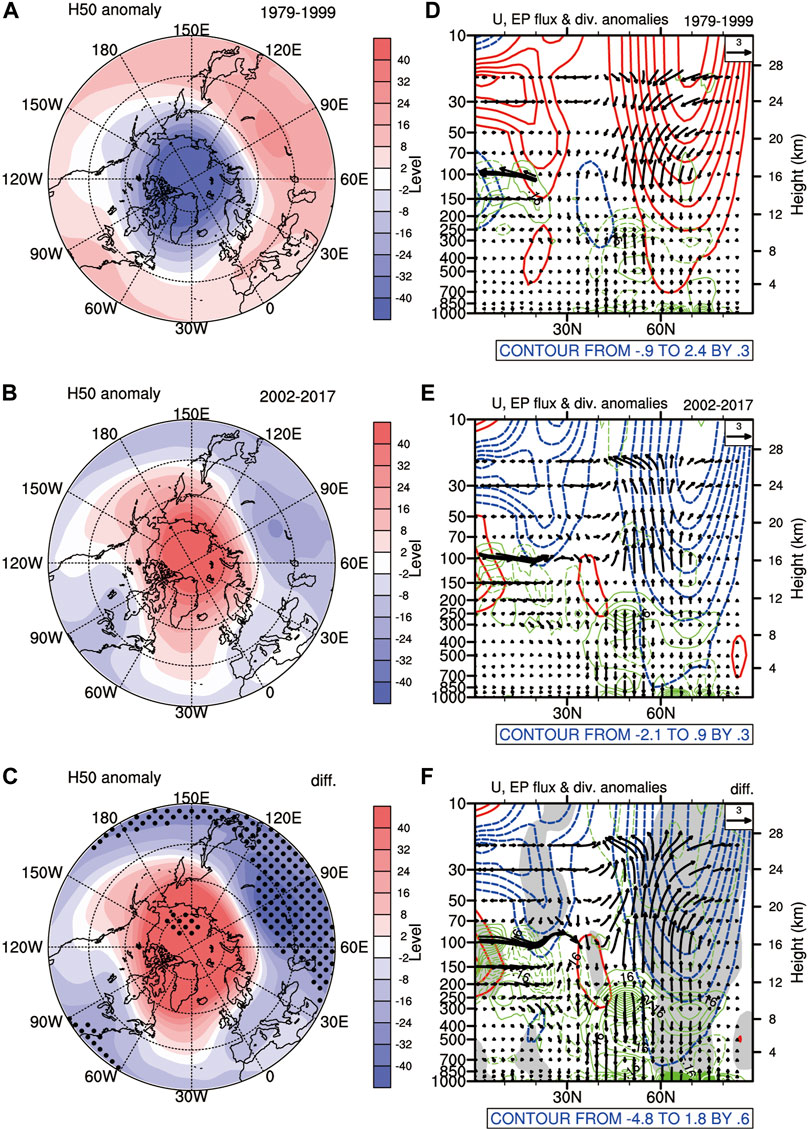
FIGURE 9. (A, B, C) The anomalies of the geopotential height (units: gpm) at 50 hPa during (A) 1979–1999 and (B) 2002–2017, and (C) their difference (2002–2017 minus 1979–1999). Anomalies are calculated based on the climatology of 1979–2017. (D, E, F) Also shown are cross-sections of zonal-mean EP flux for wavenumbers 1–3 (vectors; units: 108 m2 s−2), EP divergence (green contours; units: m s−1 d−1), and zonal wind (blue and red contours; units: m s−1) during (D) 1979–1999, (E) 2002–2017, and (F) their difference (2002–2017 minus 1979–1999). The dotted areas in (C) and the shaded areas in (F) indicate statistical significance at the 95% confidence level based on the Student’s t-test.
To display the vertical structure, the climatic anomalies of geopotential height averaged zonally within the North Atlantic (90°W–30°E) in the two periods and their difference are presented in Figures 10A–C. The downward propagation features of the stratospheric positive height anomalies over the North Atlantic high-latitudes in 2002–2017 are more significant (Figure 10B). Moreover, the height anomalies extend southward over North Atlantic mid–high latitudes more significantly than those in 1979–1999 (Figure 10A), which is consistent with Figures 9A,B. This indicates that downward propagation of stratospheric circulation anomalies may play an important role in maintaining tropospheric circulation anomalies over the North Atlantic high-latitudes. To show the downward propagation of the stratospheric polar vortex anomaly more clearly, the daily evolution of height anomalies averaged within the North Atlantic high-latitudes (60°–90°N, 90°W–30°E) in the two periods are presented in Figures 10D,E, respectively. During 1979–1999 (2002–2017), the height anomalies from the troposphere to the stratosphere are characterized by an out-of-phase pattern in the previous winter (November to December), indicating that the strong (weak) stratospheric polar vortex anomaly does not affect the troposphere. By contrast, in the late winter (January to February), the stratospheric height anomalies with the in-phase pattern propagate down to the lower troposphere (Figures 10D,E), which is consistent with previous studies (Kim et al., 2014; Zhang et al., 2016; Zhang et al., 2018; Xu et al., 2020). Moreover, the difference curve of the downward propagation strength of the stratospheric polar vortex anomaly in the two periods (Figure 10F) shows that, in the late winter, except for several weak negative values, the rest of the values are positive. This indicates that the downward propagation of the weak stratospheric polar vortex over the North Atlantic high-latitudes in 2002–2017 is stronger than that of the strong stratospheric polar vortex in 1979–1999, which is consistent with Figures 10A,B, and previous studies (Jeong et al., 2006; Park et al., 2011; Wan et al., 2013). The results show that the interdecadal change of climatic tropospheric AO/NAO mode may be attributable to the interdecadal change in the climatic stratospheric polar vortex.
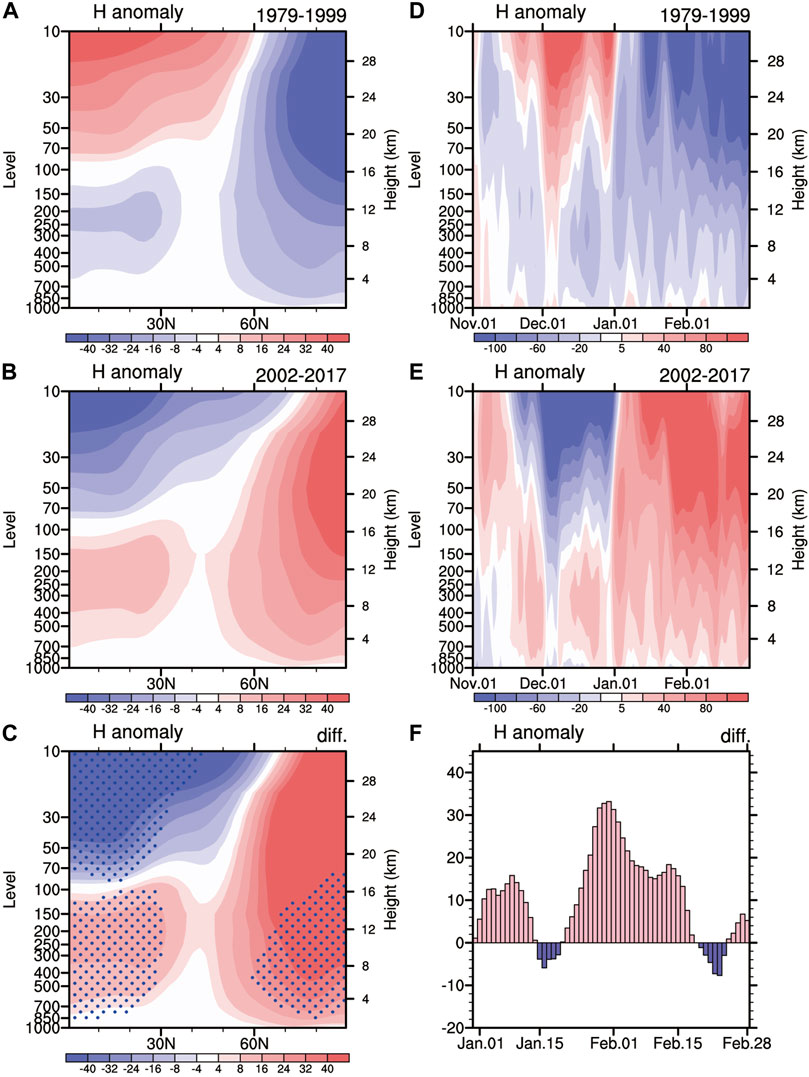
FIGURE 10. (A, B, C) Cross-section of the geopotential height anomalies (units: gpm) averaged zonally within the North Atlantic (90°W–30°E) during (A) 1979–1999 and (B) 2002–2017, and (C) their difference (2002–2017 minus 1979–1999). Anomalies are calculated based on the climatology of 1979–2017. The dotted areas in (C) indicate statistical significance at the 95% confidence level based on the Student’s t-test. (D, E) The daily evolution of geopotential height anomalies (units: gpm) averaged within the North Atlantic high-latitudes (60°–90°N, 90°W–30°E) during (D) 1979–1999 and (E) 2002–2017. (F) The daily evolution of geopotential height (units: gpm) difference [abs (E) minus abs (D)] averaged vertically from 1,000 to 10 hPa.
4.2.2 The Impacts of Interdecadal Change of Climatic Stratospheric Polar Vortex on the Interdecadal Change of Climatic Tropospheric Subtropical Jet
The jet is related to planetary-scale waves and wave-mean flow interaction (Chen and Wei, 2009; Wang L. et al., 2009; Huang et al., 2014). During 2002–2017, the weak stratospheric polar vortex anomaly is accompanied by intensified upward propagation of planetary-scale waves anomalies along the polar waveguide, which causes the EP flux convergence anomalies over the mid–high latitudes of the middle troposphere and stratosphere (Figure 9E). Thus, the circumpolar westerly anomalies are weakened according to wave-mean flow interaction, indicating downward propagation of negative AO signal, which can be partly seen in Figures 7B, 8D. Meanwhile, the planetary-scale waves anomalies propagate strongly along the low-latitude waveguide with the inverse oscillation of the two waveguides (Chen et al., 2003; Chen et al., 2005), which causes the EP flux divergence anomalies in the mid-latitudes of upper troposphere. Thus, the westerly wind anomalies over the subtropical region are intensified—that is, the subtropical jet is intensified (Figure 9E). However, during 1979–1999, the strong stratospheric polar vortex anomaly is accompanied by opposite propagation characteristics of planetary-scale waves anomalies, and thus the subtropical jet is weakened (Figure 9D). The difference field (Figure 9F) suggests more clearly that the subtropical jet in 2002–2017 is stronger than that in 1979–1999. Moreover, the distribution of anomalous ‘north-negative-south-positive’ zonal wind indicates that the location of the subtropical jet has shifted southward in 2002–2017. The results reveal that the interdecadal change of climatic tropospheric subtropical jet may be related to the interdedacal change of climatic stratospheric polar vortex.
4.2.3 The Linkage Between the Interdecadal Change of Climatic Stratospheric Polar Vortex and the Unstable Relationship Between Winter AO and Simultaneous Precipitation Over the MHA
As mentioned in the introduction, AO has a quasi-barotropic structure extending from the ground to the stratosphere. Figures 11A,B display the 50-hPa geopotential height regressed upon −AOI in the two periods. AO is significantly related to the stratospheric polar vortex, and negative AO anomaly correspond to the anomalous weak stratospheric polar vortex. However, compared with 1979–1999, the height anomalies in the North Pacific and North Atlantic extend more strongly to the mid-latitudes in 2002–2017, especially in the North Atlantic, which is consistent with Figure 11B. To display the vertical structure, cross-sections of geopotential height averaged zonally within the North Atlantic (90°W–30°E) regressed upon −AOI in the two periods are represented in Figures 11C,D. The out-of-phase distribution of the height anomalies in the mid–high latitudes extend from the stratosphere to the lower troposphere. Compared to 1979–1999, the positive height anomalies of the stratosphere over the North Atlantic high-latitudes propagate downward strongly and extend southward more significantly in 2002–2017, which will further intensify the positive tropospheric height anomalies of the region, and make the positive anomalies over the region extend southward (Figure 4B). The stronger and southward extension of positive anomalies over the North Atlantic high-latitudes are accompanied by stronger and eastward-extended negative anomalies over the North Atlantic mid-latitudes—that is, AO/NAO mode changes.
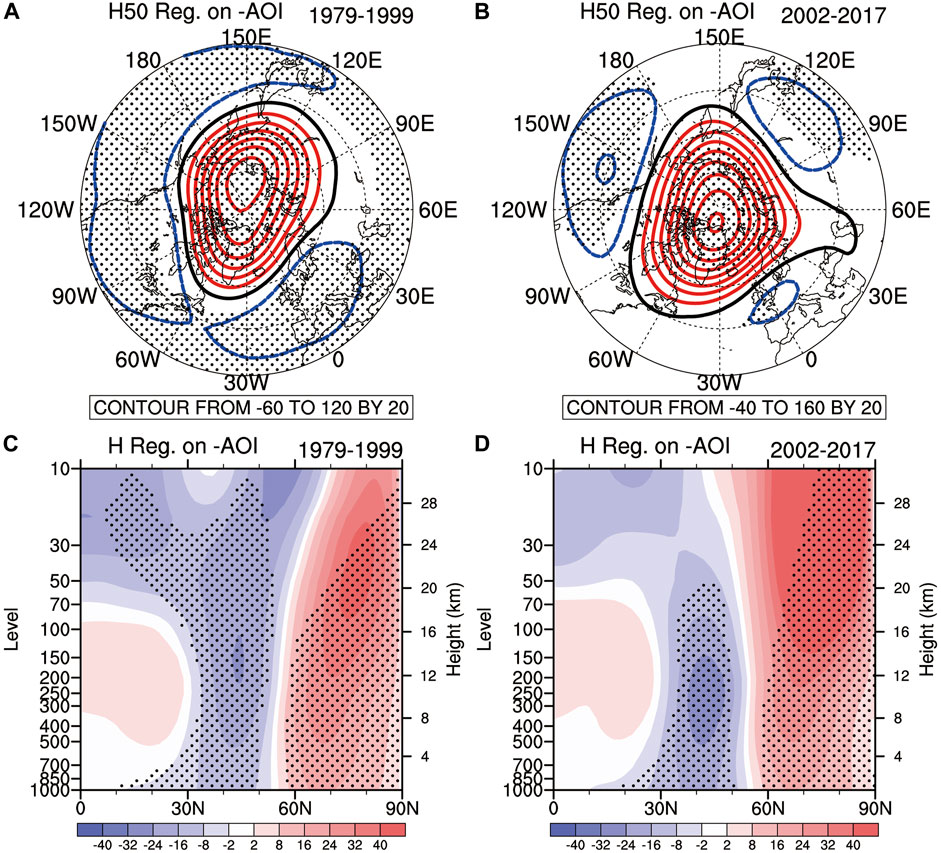
FIGURE 11. (A, B) Regression maps of the geopotential height (units: gpm) at 50 hPa upon −AOI during (A) 1979–1999 and (B) 2002–2017. (C, D) Also shown are regression maps of the cross-section of the geopotential height (units: gpm) averaged zonally within the North Atlantic (90°W–30°E) during (C) 1979–1999 and (D) 2002–2017 upon −AOI. The dotted areas indicate statistical significance at the 95% confidence level based on the Student’s t-test.
These results reveal that the differences in the strength of downward propagation and the range of southward extension of the −AOI-related stratospheric polar vortex anomaly over North Atlantic high-latitudes in the two periods are consistent with their differences of climatic anomalies (Figures 9A, 9B, 10A,B,D,E), indicating that the differences in the climatic anomalies of the stratospheric polar vortex over the North Atlantic high-latitudes in the two periods may be part of the reason for the differences in −AOI-related stratospheric polar vortex anomaly over the region in the corresponding period.
In short, further analyses reveal that the interdecadal changes of climatic tropospheric AO/NAO mode and subtropical jet may be related to the interdecadal change of climatic stratospheric polar vortex. That is, the interdecadal change of climatic stratospheric polar vortex may be the deeper reason for the unstable relationship between winter AO and simultaneous precipitation over the MHA.
5 Conclusions and Discussion
This study reveals an intensified impact of winter AO on simultaneous precipitation over the MHA since the early 2000s. The unstable relationship may be related to the changes in the tropospheric AO mode and the subtropical jet. Further analyses suggest that their changes may be attributable to the interdecadal changes in the stratospheric polar vortex.
During 2002–2017, the stratospheric polar vortex anomaly is weak, accompanied by intensified upward-propagating planetary-scale waves anomalies along the polar waveguide that weaken the polar vortex further. Subsequently, the stratospheric geopotential height anomalies over the North Atlantic high-latitudes propagate downward strongly, causing the changes in the tropospheric AO mode, that is, the positive height anomalies over the North Atlantic high-latitudes are stronger and extend southward, corresponding to the stronger and eastward extension of negative anomalies over the North Atlantic mid-latitudes. Thus, the Rossby wave source anomalies over Baffin Bay and the Black Sea are strong, and correspondingly so too are their subsequently excited Rossby waves anomalies. Meanwhile, the planetary-scale waves anomalies propagate weakly along the low-latitude waveguide, according to the wave-mean flow interaction, causing the intensified and southward-shifted subtropical jet, which is conducive to the eastward-propagating Rossby waves anomalies to the MHA. So, the impact of winter AO on precipitation over the MHA is intensified significantly. By contrast, during 1979–1999, the strong stratospheric polar vortex anomaly is accompanied by anomalously weak upward-propagating planetary-scale waves, and the stratospheric height anomalies over the North Atlantic high-latitudes propagate downward weakly, resulting in weaker anomalies over North Atlantic mid–high latitudes. Consequently, the anomalously Rossby wave source and associated Rossby waves are weak. In addition, the subtropical jet weakens and shifts northward, which causes the Rossby waves anomalies to be dominant over the North Atlantic, and thereby the impact of winter AO on precipitation over the MHA is weak.
The analyses in this study suggest an important impact of the stratospheric polar vortex. But what are the reasons for its interdecadal change? Studies have shown that there is intensified warming over the Arctic region (Serreze and Francis, 2006; Cohen et al., 2017). The difference of zonal-mean air temperature, geopotential height, and zonal wind in the two periods is analyzed (figure not shown). Compared with 1979–1999, the Arctic temperature increases from the troposphere to the lower stratosphere in 2002–2017. Meanwhile, the Arctic sea-ice extent has declined dramatically (Stroeve et al., 2011). There is positive feedback between them. Therefore, the Arctic warming anomaly is likely to be impacted by sea-ice loss.
Arctic warming and sea-ice loss may impact the polar vortex through tropospheric and stratospheric pathways. The main tropospheric pathway is as follows: the sea ice loss can make the temperature increase over the Arctic region through the ice-albedo positive feedback, which reduces meridional temperature gradients and thus weakens the prevailing westerly flow in mid–high latitudes in winter (Petoukhov and Semenov, 2010; Outten and Esau, 2012). At the same time, the Arctic warming anomaly increases the vertical thickness (1,000–500 hPa), resulting in a slackening of the poleward thickness gradient (Francis et al., 2009; Overland and Wang, 2010). In addition, the main stratospheric pathway is as follows: the sea ice loss may result in intensified upward-propagating planetary-scale waves, and the stratospheric polar vortex will be greatly disturbed and weakened (Kim et al., 2014; Nakamura et al., 2015; Wu and Smith, 2016). The weak stratospheric polar vortex corresponds to positive height anomalies—that is, the thickness of Arctic height increases. In addition, the upward propagation of planetary-scale waves is stronger, and thus the circumpolar westerly jet weakens according to the wave-mean flow interaction. For brevity, the specific physical processes are not analyzed in detail in this study.
Does any tropical forcing have a role in the strengthening of winter AO and simultaneous precipitation over the MHA? The CCs between winter AOI and simultaneous Indian Ocean Dipole index, Nino 3.4 index during 1979–2017 is −0.02 and −0.09, respectively, indicating the effects of tropical forcing is little in the intensified impact of winter AO on simultaneous precipitation over the MHA since the early 2000s.
Data Availability Statement
Publicly available datasets were analyzed in this study. This data can be found here: National Centers for Environmental Prediction-National Center for Atmospheric Research (NCEP/NCAR) (https://psl.noaa.gov/data/gridded/data.ncep.reanalysis.html; for monthly mean large-scale atmospheric circulation variables), the Hadley Center (https://psl.noaa.gov/gcos_wgsp/Gridded/data.hadslp2.html; for monthly mean SLP), and the Climatic Research Unit (CRU) (https://crudata.uea.ac.uk/cru/data/hrg/), the Global Precipitation Climatology Centre (GPCC) (https://psl.noaa.gov/data/gridded/data.gpcc.html), the Global Precipitation Climatology Project (GPCP) (https://psl.noaa.gov/data/gridded/data.gpcp.html) and the Precipitation Reconstruction over Land (PREC/L) (https://www.esrl.noaa.gov/psd/data/gridded/data.precl.html) for monthly precipitation data.
Author Contributions
Conceptualization: KF Data curation: HZ Formal analysis: HZ Funding acquisition: KF Investigation: HZ Methodology: KF Project Administration: KF Resources: HZ Supervision: KF Validation: KF Writing original draft: HZ Writing review and editing: KF.
Funding
This study was supported by the National Natural Science Foundation of China (Grants 41730964 and 42088101) and the Innovation Group Project of Southern Marine Science and Engineering Guangdong Laboratory (Zhuhai) (No 311021001).
Conflict of Interest
The authors declare that the research was conducted in the absence of any commercial or financial relationships that could be construed as a potential conflict of interest.
Publisher’s Note
All claims expressed in this article are solely those of the authors and do not necessarily represent those of their affiliated organizations, or those of the publisher, the editors and the reviewers. Any product that may be evaluated in this article, or claim that may be made by its manufacturer, is not guaranteed or endorsed by the publisher.
Acknowledgments
We are grateful to the editors and reviewers for insight comments.
References
Adler, R. F., Sapiano, M., Huffman, G. J., Wang, J., Gu, G., Bolvin, D., et al. (2018). The Global Precipitation Climatology Project (GPCP) Monthly Analysis (New Version 2.3) and a Review of 2017 Global Precipitation. Atmosphere (Basel) 9 (4), 138. doi:10.3390/atmos9040138
Allan, R., and Ansell, T. (2006). A New Globally Complete Monthly Historical Gridded Mean Sea Level Pressure Dataset (HadSLP2): 1850-2004. J. Clim. 19 (22), 5816–5842. doi:10.1175/JCLI3937.1
Andrews, D. G., Holton, J. R., and Leovy, C. B. (1987). Middle Atmosphere Dynamics. Amsterdam: Elsevier Science.
Baldwin, M. P., and Dunkerton, T. J. (1999). Propagation of the Arctic Oscillation from the Stratosphere to the Troposphere. J. Geophys. Res. 104 (D24), 30937–30946. doi:10.1029/1999JD900445
Baldwin, M. P., and Dunkerton, T. J. (2001). Stratospheric Harbingers of Anomalous Weather Regimes. Science 294 (5542), 581–584. doi:10.1126/science.1063315
Becker, A., Finger, P., Meyer-Christoffer, A., Rudolf, B., Schamm, K., Schneider, U., et al. (2012). A Description of the Global Land-Surface Precipitation Data Products of the Global Precipitation Climatology Centre with Sample Applications Including Centennial (Trend) Analysis from 1901-present. Earth Syst. Sci. Data 5 (2), 71–99. doi:10.5194/essd-5-71-2013
Chen, M., Xie, P., Janowiak, J. E., and Arkin, P. A. (2002). Global Land Precipitation: A 50-yr Monthly Analysis Based on Gauge Observations. J. Hydrometeor 3 (3), 249–266. doi:10.1175/1525-7541(2002)003<0249:glpaym>2.0.co;2
Chen, P., and Robinson, W. A. (1992). Propagation of Planetary Waves between the Troposphere and Stratosphere. J. Atmos. Sci. 492 (24), 2533–2545. doi:10.1175/1520-0469(1992)0492.0.CO10.1175/1520-0469(1992)049<2533:popwbt>2.0.co;2
Chen, S., Chen, W., and Wu, R. (2015). An Interdecadal Change in the Relationship between Boreal Spring Arctic Oscillation and the East Asian Summer Monsoon Around the Early 1970s. J. Clim. 28 (4), 1527–1542. doi:10.1175/JCLI-D-14-00409.1
Chen, S., and Wu, R. (2018). Impacts of Early Autumn Arctic Sea Ice Concentration on Subsequent spring Eurasian Surface Air Temperature Variations. Clim. Dyn. 51, 2523–2542. doi:10.1007/s00382-017-4026-x
Chen, W., Graf, H. F., and Huang, R. (2000). The Interannual Variability of East Asia Winter Monsoon and its Relation to the Summer Monsoon. Adv. Atmos. Sci. 17 (1), 48–60. doi:10.1007/s00376-000-0042-5
Chen, W., and Kang, L. H. (2006). Linkage between the Arctic Oscillation and winter Climate over East Asia on the Interannual Timescale: Roles of Quasi-Stationary Planetary Waves. J. Atmos. Sci. 30 (5), 863–870. doi:10.3878/j.issn.1006-9895.2006.05.15
Chen, W., Takahashi, M., and Graf, H.-F. (2003). Interannual Variations of Stationary Planetary Wave Activity in the Northern winter Troposphere and Stratosphere and Their Relations to NAM and SST. J. Geophys. Res. 108 (D24), a–n. doi:10.1029/2003jd003834
Chen, W., and Wei, K. (2009). Anomalous Propagation of the Quasi-Stationary Planetary Waves in the Atmosphere and its Roles in the Impact of the Stratosphere on the East Asia Winter Climate. Adv. Earth Sci. 024 (003), 272–285. doi:10.3321/j.issn:1001-8166.2009.03.006
Chen, W., Yang, S., and Huang, R.-H. (2005). Relationship between Stationary Planetary Wave Activity and the East Asian winter Monsoon. J. Geophys. Res. 110 (D14), a–n. doi:10.1029/2004jd005669
Cohen, J., Screen, J. A., Furtado, J. C., Barlow, M., Whittleston, D., Coumou, D., et al. (2014). Recent Arctic Amplification and Extreme Mid-latitude Weather. Nat. Geosci 7 (9), 627–637. doi:10.1038/ngeo2234
Daoyi, G., and Shaowu, W. (2003). Influence of Arctic Oscillation on winter Climate over China. J. Geogr. Sci. 13 (002), 208–216. doi:10.1007/BF02837460
Ding, Y. (1999). A Statistical Study of winter Mon- Soons in East Asia. J. Trop. Meteorology 6 (2), 119–128. doi:10.16032/j.issn.1004-4965.1990.02.003
Edmon, H. J., Hoskins, B. J., and Mcintyre, M. E. (1980). Eliassen-Palm Cross Sections for the Troposphere. J. Atmos. Sci. 37 (12), 2600–2616. doi:10.1175/1520-0469(1980)0372.0.CO;2
England, M. H., Mcgregor, S., Spence, P., Meehl, G. A., Timmermann, A., Cai, W., et al. (2014). Recent Intensification of Wind-Driven Circulation in the Pacific and the Ongoing Warming Hiatus. Nat. Clim Change 4 (3), 222–227. doi:10.1038/nclimate2106
Fereday, D. R., Maidens, A., Arribas, A., Scaife, A. A., and Knight, J. R. (2012). Seasonal Forecasts of Northern Hemisphere winter 2009/10. Environ. Res. Lett. 7 (3), 034031. doi:10.1088/1748-9326/7/3/034031
Francis, J. A., Chan, W., Leathers, D. J., Miller, J. R., and Veron, D. E. (2009). Winter Northern Hemisphere Weather Patterns Remember Summer Arctic Sea-Ice Extent. Geophys. Res. Lett. 36, a–n. doi:10.1029/2009GL037274
Gao, M.-N., Yang, J., Gong, D.-Y., and Kim, S.-J. (2014). Unstable Relationship between spring Arctic Oscillation and East Asian Summer Monsoon. Int. J. Climatol. 34 (7), 2522–2528. doi:10.1002/joc.3849
Gong, D.-Y., Wang, S.-W., and Zhu, J.-H. (2001). East Asian Winter Monsoon and Arctic Oscillation. Geophys. Res. Lett. 28 (10), 2073–2076. doi:10.1029/2000GL012311
Gong, D., Zhu, J., and Wang, S. (2002). The Influence of Siberian High on Large-Scale Climate over Continential Asia. Plateau Meteorology 21 (1), 8–14. doi:10.3321/j.issn:1000-0534.2002.01.002
Hardiman, S. C., Kushner, P. J., and Cohen, J. (2008). Investigating the Ability of General Circulation Models to Capture the Effects of EurAsia Snow Cover on Winter Climate. J. Geophys. Res. 113, D21123. doi:10.1029/2008JD010623
Harris, I., Osborn, T. J., Jones, P., and Lister, D. (2020). Version 4 of the CRU TS Monthly High-Resolution Gridded Multivariate Climate Dataset. Sci. Data 7 (1), 109. doi:10.1038/s41597-020-0453-3
Hartmann, D. L., Wallace, J. M., Limpasuvan, V., Thompson, D. W. J., and Holton, J. R. (2000). Can Ozone Depletion and Global Warming Interact to Produce Rapid Climate Change? Proc. Natl. Acad. Sci. 97 (4), 1412–1417. doi:10.1073/pnas.97.4.1412
He, S., Gao, Y., Li, F., Wang, H., and He, Y. (2017). Impact of Arctic Oscillation on the East Asian Climate: A Review. Earth-Science Rev. 164, 48–62. doi:10.1016/j.earscirev.2016.10.014
He, S., Wang, H., Gao, Y., and Li, F. (2019). Recent Intensified Impact of December Arctic Oscillation on Subsequent January Temperature in Eurasia and North Africa. Clim. Dyn. 52 (22), 1077–1094. doi:10.1007/s00382-018-4182-7
He, S., and Wang, H. (2013). Impact of the November/December Arctic Oscillation on the Following January Temperature in East Asia. J. Geophys. Res. Atmos. 118 (2312), 981–912. doi:10.1002/2013jd020525
He, S., and Wang, H. (2016). Linkage between the East Asian January Temperature Extremes and the Preceding Arctic Oscillation. Int. J. Climatol. 36 (2), 1026–1032. doi:10.1002/joc.4399
Huang, R., Liu, Y., Huangfu, J., and Feng, T. (2014). Characteristics and Internal Dynamical Causes of the Interdecadal Variability of East Asian Winter Monsoon Near the Late 1990s. Chin. J. Atmos. Sci. 38, 627–644. doi:10.3878/j.issn.1006-9895.2013.13245
Huang, W., Wang, B., Wright, J. S., Chen, R., and Xie, S. (2016). On the Non-stationary Relationship between the Siberian High and Arctic Oscillation. Plos One 11 (6), e0158122. doi:10.1371/journal.pone.0158122
Jaiser, R., Dethloff, K., Handorf, D., Rinke, A., and Cohen, J. (2012). Impact of Sea Ice Cover Changes on the Northern Hemisphere Atmospheric winter Circulation. Tellus A: Dynamic Meteorology and Oceanography 64 (1), 53–66. doi:10.3402/tellusa.v64i0.11595
Jeong, J.-H., Kim, B.-M., Ho, C.-H., Chen, D., and Lim, G.-H. (2006). Stratospheric Origin of Cold Surge Occurrence in East Asia. Geophys. Res. Lett. 33 (14), L14710. doi:10.1029/2006gl026607
Jia, X., Lin, H., and Derome, J. (2009). The Influence of Tropical Pacific Forcing on the Arctic Oscillation. Clim. Dyn. 32 (4), 495–509. doi:10.1007/s00382-008-0401-y
Kalnay, E., Kanamitsu, M., Kistler, R., Collins, W., Deaven, D., Gandin, L., et al. (1996). The NCEP/NCAR 40-Year Reanalysis Project. Bull. Amer. Meteorol. Soc. 77 (3), 437–471. doi:10.1175/1520-0477(1996)077<0437:TNYRP>2.0.CO;2
Kim, B.-M., Son, S.-W., Min, S.-K., Jeong, J.-H., Kim, S.-J., Zhang, X., et al. (2014). Weakening of the Stratospheric Polar Vortex by Arctic Sea-Ice Loss. Nat. Commun. 5, 4646. doi:10.1038/ncomms5646
King, M. P., Hell, M., and Keenlyside, N. (2015). Investigation of the Atmospheric Mechanisms Related to the Autumn Sea Ice and winter Circulation Link in the Northern Hemisphere. Clim. Dyn. 46 (3-4), 1185–1195. doi:10.1007/s00382-015-2639-5
Kiritani, K. (2007). The Impact of Global Warming and Land-Use Change on the Pest Status of rice and Fruit Bugs (Heteroptera) in Japan. Glob. Change Biol 13 (8), 1586–1595. doi:10.1111/j.1365-2486.2007.01397.x
Li, C., and Sun, Z. (2003). Association of Mid-latitude Blocking High Index with Summer Precipitation in North China. J. Nanjing Inst. Meteorology 26 (4), 458–464. doi:10.1007/BF02948883
Li, F., Wang, H., and Gao, Y. (2014). On the Strengthened Relationship between the East Asian Winter Monsoon and Arctic Oscillation: A Comparison of 1950-70 and 1983-2012. J. Clim. 27 (13), 5075–5091. doi:10.1175/JCLI-D-13-00335.1
Li, S., Hoerling, M. P., Peng, S., and Weickmann, K. M. (2006). The Annular Response to Tropical Pacific SST Forcing. J. Clim. 19 (9), 1802–1819. doi:10.1175/jcli3668.1
Li, X., Fan, K., and Xu, Z. (2019). Decrease in Extreme Precipitation in Summer over East Northern China and the Water-Vapor Transport Characteristics after Year 2000. Chin. J. Atmos. Sci. 43 (5), 1109–1124. doi:10.3878/j.issn.1006-9895.1902.18198
Lin, H., Derome, J., and G, B. (2005). Tropical Pacific Link to the Two Dominant Patterns of Atmospheric Variability. Geophys. Res. Lett. 32, L03801. doi:10.1029/2004GL021495
Liu, Y., He, S., Li, F., Wang, H., and Zhu, Y. (2017a). Interdecadal Change between the Arctic Oscillation and East Asian Climate during 1900-2015 winters. Int. J. Climatol 37 (14), 4791–4802. doi:10.1002/joc.5123
Liu, Y., He, S., Li, F., Wang, H., and Zhu, Y. (2017b). Unstable Relationship between the Arctic Oscillation and East Asian Jet Stream in winter and Possible Mechanisms. Theor. Appl. Climatol 135 (1-2), 13–27. doi:10.1007/s00704-017-2354-8
Nakamura, T., Yamazaki, K., Iwamoto, K., Honda, M., Miyoshi, Y., Ogawa, Y., et al. (2015). A Negative Phase Shift of the winter AO/NAO Due to the Recent Arctic Sea-Ice Reduction in Late Autumn. J. Geophys. Res. Atmospheres 120 (8), 3209-3227. doi:10.1002/2014jd022848
Nath, D., Chen, W., Wang, L., and Ma, Y. (2014). Planetary Wave Reflection and its Impact on Tropospheric Cold Weather over Asia during January 2008. Adv. Atmos. Sci. 31 (004), 851–862. doi:10.1007/s00376-013-3195-8
Outten, S. D., and Esau, I. (2012). A Link between Arctic Sea Ice and Recent Cooling Trends over Eurasia. Climatic Change 110 (3-4), 1069–1075. doi:10.1007/s10584-011-0334-z
Overland, J. E., and Wang, M. (2010). Large-scale Atmospheric Circulation Changes Are Associated with the Recent Loss of Arctic Sea Ice. Tellus A: Dynamic Meteorology and Oceanography 62 (1), 1–9. doi:10.1111/j.1600-0870.2009.00421.x
Park, T.-W., Ho, C.-H., and Yang, S. (2011). Relationship between the Arctic Oscillation and Cold Surges over East Asia. J. Clim. 24 (1), 68–83. doi:10.1175/2010JCLI3529.1
Peings, Y., and Magnusdottir, G. (2014). Response of the Wintertime Northern Hemisphere Atmospheric Circulation to Current and Projected Arctic Sea Ice Decline: A Numerical Study with CAM5. J. Clim. 27 (1), 244–264. doi:10.1175/JCLI-D-13-00272.1
Peng, C., Fan, K., and Dai, H. (2019). Sub Seasonal Variations of Weak Stratospheric Polar Vortex in December and its Impact on Eurasian Air Temperature. Atmos. Oceanic Sci. Lett. 12 (5), 369–375. doi:10.1080/16742834.2019.1640053
Petoukhov, V., and Semenov, V. A. (2010). A Link between Reduced Barents-Kara Sea Ice and Cold winter Extremes over Northern Continents. J. Geophys. Res. 115 (D21), D21111. doi:10.1029/2009JD013568
Randel, W. J. (1987). A Study of Planetary Waves in the Southern Winter Troposphere and Stratosphere. Part I: Wave Structure and Vertical Propagation. J. Atmos. Sci. 44 (6), 917–935. doi:10.1175/1520-0469(1987)044<0917:ASOPWI>2.0.CO;2
Ren, R.-C., and Cai, M. (2007). Meridional and Vertical Out-of-phase Relationships of Temperature Anomalies Associated with the Northern Annular Mode Variability. Geophys. Res. Lett. 34 (7). doi:10.1029/2006gl028729
Sardeshmukh, P. D., and Hoskins, B. J. (1988). The Generation of Global Rotational Flow by Steady Idealized Tropical Divergence. J. Atmos. Sci. 452 (7), 1228–1251. doi:10.1175/1520-0469(1988)0452.0.CO10.1175/1520-0469(1988)045<1228:tgogrf>2.0.co;2
Screen, J. A., Simmonds, I., Deser, C., and Tomas, R. (2013). The Atmospheric Response to Three Decades of Observed Arctic Sea Ice Loss. J. Clim. 26 (4), 1230–1248. doi:10.1175/JCLI-D-12-00063.1
Serreze, M. C., and Francis, J. A. (2006). The Arctic Amplification Debate. Climatic Change 76 (3-4), 241–264. doi:10.1007/s10584-005-9017-y
Shi, N. (1996). Features of the East Asia winter Monsoon Intensity on Multiple Time Scale in Recent 40 Years and Their Relation to Climate. Q. J. Appl. Meteorology 7 (2), 175–182.
Stroeve, J. C., Maslanik, J., Serreze, M. C., Rigor, I., Meier, W., and Fowler, C. (2011). Sea Ice Response to an Extreme Negative Phase of the Arctic Oscillation during winter 2009/2010. Geophys. Res. Lett. 38 (2), a–n. doi:10.1029/2010gl045662
Sun, B., Zhu, Y., and Wang, H. (2011). The Recent Interdecadal and Interannual Variation of Water Vapor Transport over Eastern China. Adv. Atmos. Sci. 28 (5), 1039–1048. doi:10.1007/s00376-010-0093-1
Takaya, K., and Nakamura, H. (2001). A Formulation of a Phase-independent Wave-Activity Flux for Stationary and Migratory Quasigeostrophic Eddies on a Zonally Varying Basic Flow. J. Atmos. Sci. 58 (6), 608–627. doi:10.1175/1520-0469(2001)058<0608:AFOAPI>2.0.CO;2
Takaya, K., and Nakamura, H. (2013). Interannual Variability of the East Asian Winter Monsoon and Related Modulations of the Planetary Waves. J. Clim. 26 (23), 9445–9461. doi:10.1175/JCLI-D-12-00842.1
Tao, S. (1957). A Synoptic and Aerolog Ical Study on a Cold Wave in the Far East during the Period of the Break Down of the Blocking Situation over Euroasia and Atlantic. Acta Meteorologica Sinica 28 (1), 63–74. doi:10.11676/qxxb1957.005
Thompson, D. W. J., and Wallace, J. M. (2000). Annular Modes in the Extratropical Circulation. Part I: Month-To-Month Variability*. J. Clim. 132, 1000–1016. doi:10.1175/1520-0442(2000)0132.0.CO10.1175/1520-0442(2000)013<1000:amitec>2.0.co;2
Thompson, D. W. J., and Wallace, J. M. (2001). Regional Climate Impacts of the Northern Hemisphere Annular Mode. Science 293 (5527), 85–89. doi:10.1126/science.1058958
Thompson, D. W. J., and Wallace, J. M. (1998). The Arctic Oscillation Signature in the Wintertime Geopotential Height and Temperature fields. Geophys. Res. Lett. 25 (9), 1297–1300. doi:10.1029/98GL00950
Wan, X., Fu, Z., and Hu, Y. (2013). The Influence of Stratospheric Anomalies on the Northeast Cold Vortex. Acta Sci. Nat. Uni. Pekinensis 49 (3), 417–425. doi:10.13209/j.0479-8023.2013.060
Wang, J., Zhang, J., Watanabe, E., Ikeda, M., Mizobata, K., Walsh, J. E., et al. (2009). Is the Dipole Anomaly a Major Driver to Record Lows in Arctic Summer Sea Ice Extent? Geophys. Res. Lett. 36 (5), L05706. doi:10.1029/2008gl036706
Wang, L., and Chen, W. (2010). Downward Arctic Oscillation Signal Associated with Moderate Weak Stratospheric Polar Vortex and the Cold December 2009. Geophys. Res. Lett. 37, a–n. doi:10.1029/2010gl042659
Wang, L., Huang, R., Gu, L., Chen, W., and Kang, L. (2009). Interdecadal Variations of the East Asian Winter Monsoon and Their Association with Quasi-Stationary Planetary Wave Activity. J. Clim. 22 (18), 4860–4872. doi:10.1175/2009jcli2973.1
Wang, Z., and Ding, Y. (2006). Climate Change of the Cold Wave Frequency of China in the Last 53 Years and the Possible Reasons. Chin. J. Atmos. Sciences 30 (6), 1068–1076. doi:10.3878/j.issn.1006-9895.2006.06.02
Wu, B., and Huang, R. (1999). Effects of Theextremes in the North Atlantic Oscillation on East Asia winter Monsoon. Chin. J. Atmos. Sciences 23 (6), 641–651. doi:10.3878/j.issn.1006-9895.1999.06.01
Wu, B., and Wang, J. (2002a). Possible Impacts of winter Arctic Oscillation on Siberian High, the East Asian winter Monsoon and Sea-Ice Extent. Adv. Atmos. Sci. 19, 297–320. doi:10.1007/s00376-002-0024-x
Wu, B., and Wang, J. (2002b). Winter Arctic Oscillation, Siberian High and East Asian Winter Monsoon. Geophys. Res. Lett. 29 (19), 3–1. doi:10.1029/2002gl015373
Wu, Q., Hu, H., and Zhang, L. (2011). Observed Influences of Autumn-Early Winter Eurasian Snow Cover Anomalies on the Hemispheric PNA-like Variability in Winter. J. Clim. 24 (7), 2017–2023. doi:10.1175/2011JCLI4236.1
Wu, Y., and Smith, K. L. (2016). Response of Northern Hemisphere Midlatitude Circulation to Arctic Amplification in a Simple Atmospheric General Circulation Model. J. Clim. 29 (6), 2041–2058. doi:10.1175/JCLI-D-15-0602.1
Xu, M., Tian, W., Zhang, J., Wang, T., and Qie, K. (2021). Impact of Sea Ice Reduction in the Barents and Kara Seas on the Variation of the East Asian Trough in Late Winter. J. Clim. 34 (3), 1081–1097. doi:10.1175/JCLI-D-20-0205.1
Xu, Z., Fan, K., and Wang, H. (2015). Decadal Variation of Summer Precipitation over China and Associated Atmospheric Circulation after the Late 1990s. J. Clim. 28 (10), 4086–4106. doi:10.1175/JCLI-D-14-00464.1
Yang, H., and Li, C. (2008). Influence of Arctic Oscillation on Temperature and Precipitation in Winter. Climatic Environ. Res. 13 (4), 395–404. doi:10.3878/j.issn.1006-9585.2008.04.05
Yu, Y., Ren, R., and Cai, M. (2015). Comparison of the Mass Circulation and AO Indices as Indicators of Cold Air Outbreaks in Northern winter. Geophys. Res. Lett. 42 (7), 2442–2448. doi:10.1002/2015GL063676
Zhang, J., Tian, W., Chipperfield, M. P., Xie, F., and Huang, J. (2016). Persistent Shift of the Arctic Polar Vortex towards the Eurasian Continent in Recent Decades. Nat. Clim Change 6 (12), 1094–1099. doi:10.1038/nclimate3136
Zhang, J., Tian, W., Xie, F., Chipperfield, M. P., Feng, W., Son, S.-W., et al. (2018). Stratospheric Ozone Loss over the Eurasian Continent Induced by the Polar Vortex Shift. Nat. Commun. 9 (1), 1–8. doi:10.1038/s41467-017-02565-2
Zhang, T., and Huang, Y. (2012). Impacts of Climate Change and Inter-annual Variability on Cereal Crops in China from 1980 to 2008. J. Sci. Food Agric. 92 (8), 1643–1652. doi:10.1002/jsfa.5523
Keywords: Arctic Oscillation (AO), winter precipitation, intensified impact, stratospheric polar vortex, the mid-high latitudes of Asia
Citation: Zhou H and Fan K (2021) Intensified Impact of Winter Arctic Oscillation on Simultaneous Precipitation Over the Mid–High Latitudes of Asia Since the Early 2000s. Front. Earth Sci. 9:782388. doi: 10.3389/feart.2021.782388
Received: 24 September 2021; Accepted: 05 November 2021;
Published: 07 December 2021.
Edited by:
Jing-Jia Luo, Nanjing University of Information Science and Technology, ChinaReviewed by:
Renguang Wu, Zhejiang University, ChinaEduardo Zorita, Helmholtz Centre for Materials and Coastal Research (HZG), Germany
Copyright © 2021 Zhou and Fan. This is an open-access article distributed under the terms of the Creative Commons Attribution License (CC BY). The use, distribution or reproduction in other forums is permitted, provided the original author(s) and the copyright owner(s) are credited and that the original publication in this journal is cited, in accordance with accepted academic practice. No use, distribution or reproduction is permitted which does not comply with these terms.
*Correspondence: Ke Fan, ZmFuazhAbWFpbC5zeXN1LmVkdS5jbg==